Annual Qualifications Market Report: 2020 to 2021 academic year
Updated 10 June 2022
Applies to England

© Crown copyright 2022
This publication is licensed under the terms of the Open Government Licence v3.0 except where otherwise stated. To view this licence, visit nationalarchives.gov.uk/doc/open-government-licence/version/3 or write to the Information Policy Team, The National Archives, Kew, London TW9 4DU, or email: psi@nationalarchives.gov.uk.
Where we have identified any third party copyright information you will need to obtain permission from the copyright holders concerned.
This publication is available at https://www.gov.uk/government/statistics/annual-qualifications-market-report-academic-year-2020-to-2021/annual-qualifications-market-report-2020-to-2021-academic-year
This release provides information on the number and types of qualifications available for award and the number of certificates awarded by recognised awarding organisations in England during the 2020 to 2021 academic year. It also includes some statistics on regulated qualifications certified in international jurisdictions by recognised awarding organisations.
The release covers all regulated qualifications apart from apprenticeship end-point assessments (EPAs). Please note, where this release refers to ‘vocational and other’ qualifications, this means all qualifications other than GCSE, AS and A level.
Many assessments, predominantly occupational qualifications, were cancelled or delayed in spring and summer 2020 due to the measures put in place in response to the coronavirus (COVID-19) pandemic. Alternative arrangements were also put in place in 2021. The trends seen in the 2020 to 2021 academic year, particularly when compared against the 2019 to 2020 academic year, may have been affected as a result.
1. Main trends
The main trends in the qualifications market for the 2020 to 2021 academic year in England were:
-
There were 11,700 active qualifications (available qualifications with certificates) in the academic year 2020 to 2021, a 0.7% increase on the previous year.
-
In total 10.8 million certificates were issued for GCSE, AS, A level and vocational and other qualifications available for award in England over the 2020 to 2021 academic year, up 4.3% compared to the 2019 to 2020 academic year.
-
There were 6.1 million GCSE, AS and A level certificates awarded in the 2020 to 2021 academic year, up by 0.6% compared to the previous year.
-
There were 4.7 million certificates awarded for vocational and other qualifications in the 2020 to 2021 academic year, up by 9.6% compared to the 2019 to 2020 academic year.
-
The awarding organisations with the largest market shares in the academic year 2020 to 2021 were AQA (35.0%), Pearson (21.9%), OCR (7.0%) and City & Guilds (5.1%); the rest of the 142 awarding organisations with active qualifications (excluding the ones offering EPAs only) accounted for 31.1% of the market.
2. Number of awarding organisations offering regulated qualifications
Any organisation that wants to offer regulated qualifications in England has to be recognised by Ofqual. Any new awarding organisation needs to meet Ofqual’s Criteria for Recognition and, once recognised, all awarding organisations need to continue to meet Ofqual’s General Conditions of Recognition.
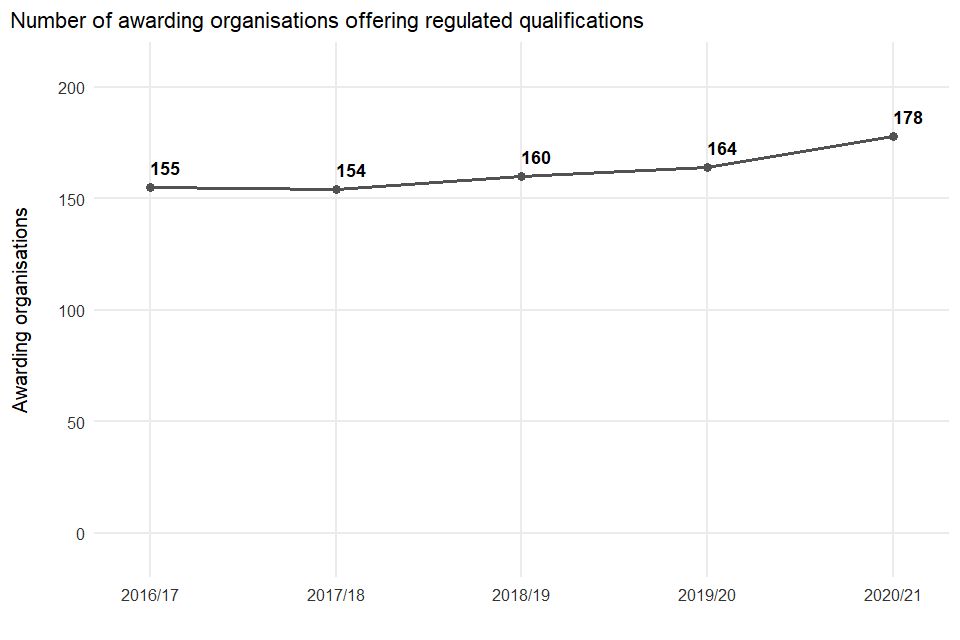
Number of awarding organisations offering regulated qualifications from 2016 to 2017 to 2020 to 2021
| Year | Number of organisations |
|---|---|
| 2016 to 2017 | 155 |
| 2017 to 2018 | 154 |
| 2018 to 2019 | 160 |
| 2019 to 2020 | 164 |
| 2020 to 2021 | 178 |
There were 178 Ofqual recognised awarding organisations during the 2020 to 2021 academic year. This number includes 32 awarding organisations which had no active qualifications (available qualifications with certificates) or delivered EPAs for apprenticeship standards only during the 2020 to 2021 academic year.
Please note, that elsewhere in the report statistics on qualifications and certifications do not include apprenticeship EPAs.
3. Regulated qualifications
Information on qualifications including title, type, awarding organisation, sector subject area and level is taken from the Register of Regulated Qualifications.
3.1 Number of available qualifications
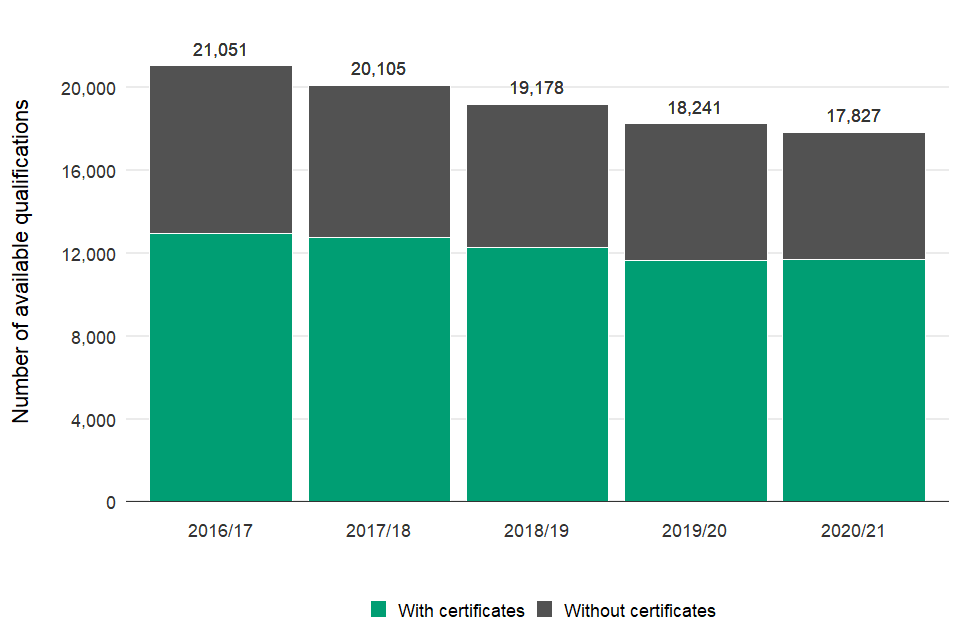
Number of available qualifications from 2016 to 2017 to 2020 to 2021
| Year | Number of qualifications with certificates | Number of qualifications without certificates | Total number of qualifications |
|---|---|---|---|
| 2016 to 2017 | 12,949 | 8,102 | 21,051 |
| 2017 to 2018 | 12,748 | 7,357 | 20,105 |
| 2018 to 2019 | 12,250 | 6,928 | 19,178 |
| 2019 to 2020 | 11,625 | 6,616 | 18,241 |
| 2020 to 2021 | 11,707 | 6,120 | 17,827 |
There were 17,827 qualifications available to certificate in the 2020 to 2021 academic year. This is a 2.3% decrease compared to the previous year. No certificates will have been issued for some qualifications because they are new and/or require a 1- or 2-year course of study before students can certificate.
3.2 Number of available qualifications by type
Qualification types are used to describe the nature of qualifications and are contained within the Register of Regulated Qualifications.
| Qualification type | Number of qualifications available to certificate in 2019 to 2020 | Number of qualifications available to certificate in 2020 to 2021 | Number of qualifications with certificates in 2019 to 2020 | Number of qualifications with certificates in 2020 to 2021 |
|---|---|---|---|---|
| GCSE (9 to 1) | 143 | 143 | 143 | 139 |
| A level | 173 | 148 | 147 | 137 |
| AS | 161 | 136 | 131 | 109 |
| Vocationally-Related Qualification | 8,341 | 8,203 | 5,105 | 5,192 |
| Occupational Qualification | 5,138 | 4,979 | 3,080 | 3,038 |
| Other Life Skills Qualification | 1,810 | 1,758 | 1,234 | 1,302 |
| Other Vocational Qualification | 838 | 825 | 520 | 550 |
| Performing Arts Graded Examination | 513 | 575 | 394 | 439 |
| Other General Qualification | 540 | 483 | 422 | 385 |
| English For Speakers of Other Languages | 330 | 348 | 221 | 225 |
| Functional Skills | 226 | 205 | 215 | 180 |
| Project | 14 | 14 | 12 | 10 |
| Advanced Extension Award | 1 | 1 | 1 | 1 |
| Total | 18,228 | 17,818 | 11,625 | 11,707 |

Percentage change in the number of qualifications with certifications by qualification type between 2019 to 2020 and 2020 to 2021
| Qualification type | Percentage change in the number of qualifications with certifications by qualification type between 2019 to 2020 and 2020 to 2021 |
|---|---|
| GCSE (9 to 1) | -2.8% |
| A level | -6.8% |
| AS | -16.8% |
| Vocationally-Related Qualification | 1.7% |
| Occupational Qualification | -1.4% |
| Other Life Skills Qualification | 5.5% |
| Other Vocational Qualification | 5.8% |
| Performing Arts Graded Examination | 11.4% |
| Other General Qualification | -8.8% |
| English For Speakers of Other Languages | 1.8% |
| Functional Skills | -16.3% |
| Project | -16.7% |
| Advanced Extension Award | 0.0% |
| Total | 0.7% |
The largest proportional increase in the number of qualifications with certificates was seen in Performing Arts Graded Examination qualifications (up by 11.4% this year). This increase can be attributed to the introduction of new Performing Arts Graded Examination qualifications offered by several awarding organisations including the Associated Board of the Royal Schools of Music, GQA Qualifications Limited, LAMDA, RSL Awards Ltd and The Learning Machine.
The largest proportional decrease in the number of qualifications with certificates was seen in AS qualifications in the 2020 to 2021 academic year (down by 16.8%), compared to the previous year. Legacy AS qualifications were no longer available to certificate following reforms to AS qualifications.
Please note, legacy GCSE qualifications, also known as GCSE (A* to G), as well as A levels were also no longer available to certificate in the 2020 to 2021 academic year.
Please note, apprenticeship EPAs are not reported in this release. As noted in the Background notes accompanying this release, Ofqual collects data for the Annual Qualifications Market Report from awarding organisations. The awarding organisations that conduct EPAs do not issue certificates for the completion of EPAs and therefore do not provide us the data on certifications of EPAs.
4. Certificates awarded for regulated qualifications
4.1 Overall number of certificates
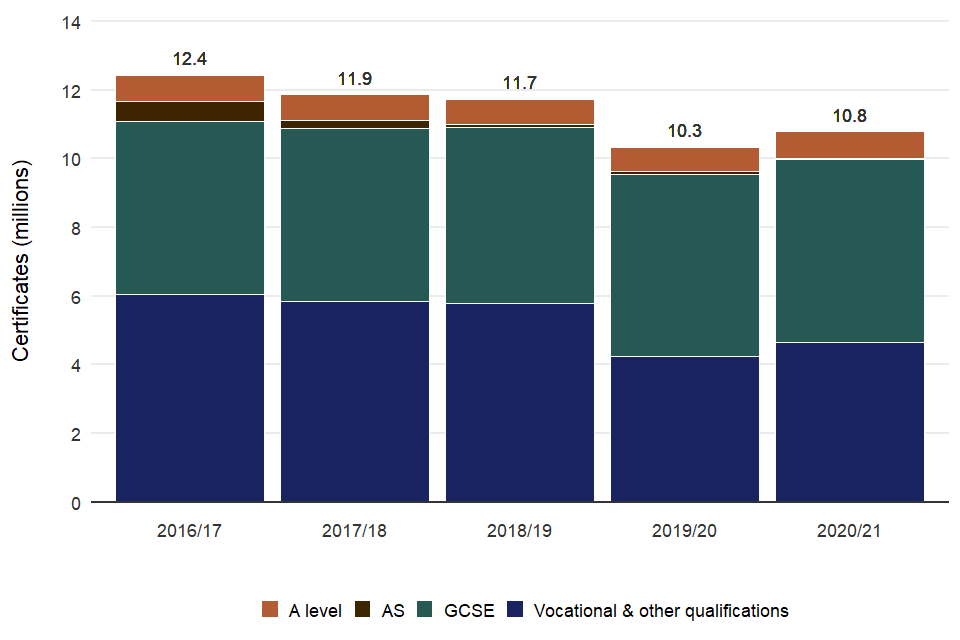
Number of certificates awarded from 2016 to 2017 to 2020 to 2021
| Year | A level | AS | GCSE | Vocational & other qualifications | Total |
|---|---|---|---|---|---|
| 2016 to 2017 | 764,715 | 582,115 | 5,039,825 | 6,051,450 | 12,438,105 |
| 2017 to 2018 | 736,090 | 237,775 | 5,035,565 | 5,854,825 | 11,864,255 |
| 2018 to 2019 | 720,225 | 98,745 | 5,119,705 | 5,789,755 | 11,728,430 |
| 2019 to 2020 | 716,825 | 68,365 | 5,309,585 | 4,246,060 | 10,340,840 |
| 2020 to 2021 | 763,745 | 55,130 | 5,313,310 | 4,652,790 | 10,784,970 |
The total number of certificates awarded for all qualifications (A level, AS, GCSE and vocational and other qualifications) in the 2020 to 2021 academic year was 10.8 million, up 4.3% compared to the previous year.
The overall number of certificates for A level qualifications has increased by 6.5% compared to the 2019 to 2020 academic year. This is in line with an upward trend in the number of entries for A level qualifications taken in the 2020 to 2021 academic year. The trend is likely to partly reflect a change in the size of the 16 year old cohort.
AS qualifications saw a decrease in the number of certificates (down by 19.4% compared to the 2019 to 2020 academic year). This is a continuation of the downward trend mainly attributable to the decoupling of AS from A levels as part of the government policy reforms.
The overall number of certificates for GCSE qualifications has increased, by less than 1%. This is in line with a slight increase in the number of entries for GCSEs in the 2020 to 2021 academic year. Please note, all GCSEs awarded in the 2019 to 2020 and 2020 to 2021 academic years were reformed qualifications also known as GCSE (9 to 1).
There has been an increase in the overall number of certificates in vocational and other qualifications (up by 9.6%) compared to the 2019 to 2020 academic year, when many assessments were cancelled or delayed in spring and summer 2020 due to the measures put in place in response to the coronavirus (COVID-19) pandemic. The numbers have not reached the pre-COVID-19 pandemic level though, partly due to exceptional arrangements still being in place in the 2020 to 2021 academic year.
4.2 Number of certificates by qualification type
| Qualification type | Number of certificates in 2019 to 2020 | Share of certificates in 2019 to 2020 | Number of certificates in 2020 to 2021 | Share of certificates in 2020 to 2021 |
|---|---|---|---|---|
| GCSE (9 to 1) | 5,309,585 | 51.3% | 5,313,310 | 49.3% |
| A level | 716,825 | 6.9% | 763,745 | 7.1% |
| AS | 68,365 | <1% | 55,130 | <1% |
| Vocationally-Related Qualification | 1,778,795 | 17.2% | 2,011,215 | 18.6% |
| Occupational Qualification | 527,030 | 5.1% | 574,710 | 5.3% |
| Other Vocational Qualification | 327,890 | 3.2% | 422,085 | 3.9% |
| Other General Qualification | 396,815 | 3.8% | 391,070 | 3.6% |
| Performing Arts Graded Examination | 227,600 | 2.2% | 374,970 | 3.5% |
| English For Speakers of Other Languages | 273,610 | 2.6% | 307,655 | 2.9% |
| Functional Skills | 447,670 | 4.3% | 302,150 | 2.8% |
| Other Life Skills Qualification | 218,615 | 2.1% | 216,680 | 2.0% |
| Project | 47,640 | <1% | 52,100 | <1% |
| Advanced Extension Award | 170 | <1% | 85 | <1% |
| QCF | 220 | <1% | 75 | <1% |
| Retired Qualifications | 0\~ | <1% | 0 | 0% |
| Total | 10,340,840 | 100.0% | 10,784,970 | 100.0% |

Percentage change in the number of certificates awarded by qualification type etween 2019 to 2020 and 2020 to 2021
| Qualification type | Percentage change in the number of certificates awarded between 2019 to 2020 and 2020 to 2021 |
|---|---|
| GCSE (9 to 1) | 0.1% |
| A level | 6.5% |
| AS | -19.4% |
| Vocationally-Related Qualification | 13.1% |
| Occupational Qualification | 9.0% |
| Other Vocational Qualification | 28.7% |
| Other General Qualification | -1.4% |
| Performing Arts Graded Examination | 64.8% |
| English For Speakers of Other Languages | 12.4% |
| Functional Skills | -32.5% |
| Other Life Skills Qualification | -0.9% |
| Project | 9.4% |
| Advanced Extension Award | -49.1% |
| QCF | -67.1% |
| Retired Qualifications | -100.0% |
| Total | 4.3% |
The largest proportional increase in the number of certificates in the 2020 to 2021 academic year among vocational and other qualifications was seen in Performing Arts Graded Examination qualifications (up by 64.8%, equivalent to an increase of 147,400 certificates). A large number of certificates issued for the new qualifications offered by the Associated Board of the Royal Schools of Music is likely to be the main driver for the change.
The largest percentage decrease in the number of certificates among vocational and other qualifications has been in QCF qualifications (down by 67.1%, equivalent to 150) and Advanced Extension Award qualifications (down by 49.1%, equivalent to 85). The downward trend in QCF qualifications is likely due to Ofqual’s decision to revise the list of available qualification types and the removal of QCF design rules.
There were no certificates issued for Retired Qualifications.
4.3 Awarding organisations with the highest number of certificates
| Awarding organisation | Number of certificates in 2019 to 2020 | Number of certificates in 2020 to 2021 |
|---|---|---|
| AQA Education | 3,749,040 | 3,769,440 |
| Pearson Education Ltd | 2,372,260 | 2,361,855 |
| OCR | 767,075 | 751,680 |
| City and Guilds of London Institute | 602,400 | 551,055 |
| WJEC-CBAC | 427,100 | 444,375 |
| NCFE | 357,770 | 368,890 |
| Highfield Qualifications | 201,055 | 222,000 |
| Trinity College London | 140,015 | 196,205 |
| Qualsafe Awards | 145,055 | 180,400 |
| Associated Board of the Royal Schools of Music | 91,985 | 167,560 |
| First Aid Awards Ltd | 92,460 | 124,955 |
| Training Qualifications UK Ltd | 81,545 | 110,535 |
| VTCT | 41,590 | 92,160 |
| NOCN | 84,795 | 88,865 |
| Ascentis | 83,395 | 85,705 |
| IQL | 32,050 | 53,880 |
| University of the Arts London | 45,135 | 51,465 |
| Excellence, Achievement & Learning Limited | 45,560 | 50,790 |
| Gateway Qualifications Limited | 40,490 | 46,305 |
| Cambridge Assessment English | 51,845 | 44,115 |
| Other organisations | 888,215 | 1,022,735 |
| Total | 10,340,840 | 10,784,970 |
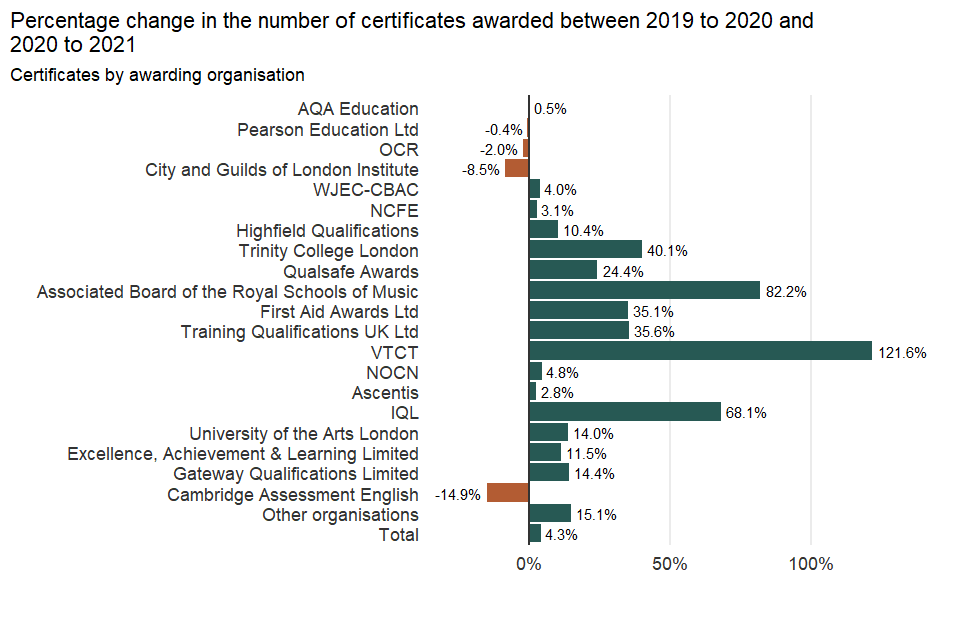
Percentage change in the number of certificates awarded by awarding organisation between 2019 to 2020 and 2020 to 2021
| Awarding organisation | Percentage change in the number of certificates awarded between 2019 to 2020 and 2020 to 2021 |
|---|---|
| AQA Education | 0.5% |
| Pearson Education Ltd | -0.4% |
| OCR | -2.0% |
| City and Guilds of London Institute | -8.5% |
| WJEC-CBAC | 4.0% |
| NCFE | 3.1% |
| Highfield Qualifications | 10.4% |
| Trinity College London | 40.1% |
| Qualsafe Awards | 24.4% |
| Associated Board of the Royal Schools of Music | 82.2% |
| First Aid Awards Ltd | 35.1% |
| Training Qualifications UK Ltd | 35.6% |
| VTCT | 121.6% |
| NOCN | 4.8% |
| Ascentis | 2.8% |
| IQL | 68.1% |
| University of the Arts London | 14.0% |
| Excellence, Achievement & Learning Limited | 11.5% |
| Gateway Qualifications Limited | 14.4% |
| Cambridge Assessment English | -14.9% |
| Other organisations | 15.1% |
| Total | 4.3% |
The 20 awarding organisations that reported the highest volume of all certificates in the 2020 to 2021 academic year awarded 90.5% of all certificates. IQL is new to the top 20 this year.
The Associated Board of the Royal Schools of Music has had the largest increase (up by 75,600) in certificates compared with the previous year, largely due to increases in the number of certificates awarded for the new Performing Arts Graded Examination qualifications.
VTCT has had the largest percentage increase (up by 121.6%) in certificate numbers, largely due to increases in the number of certificates for Vocationally-Related Qualifications.
5. General qualifications
5.1 Market share: GCSE
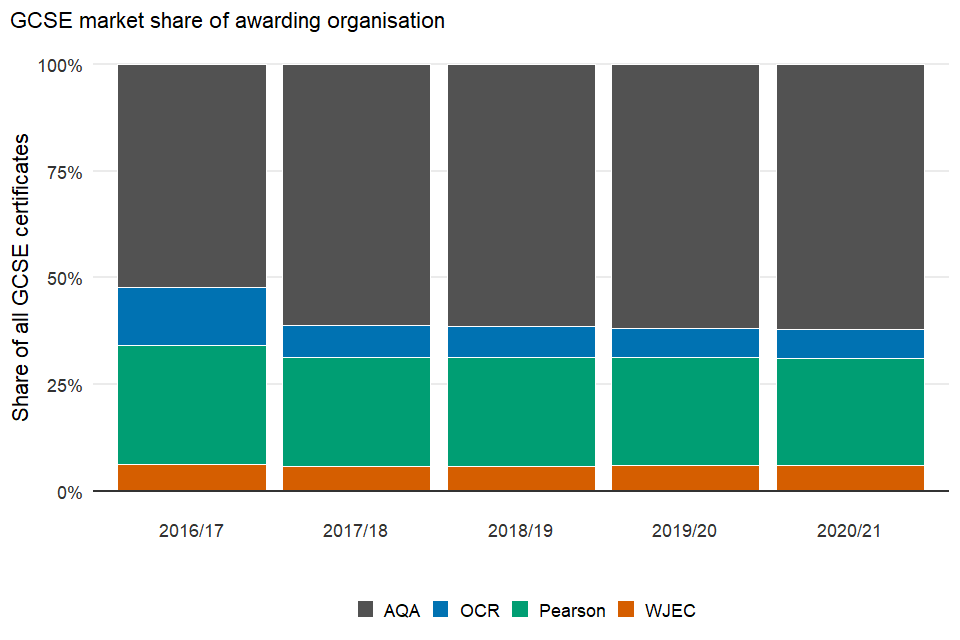
GCSE market share of awarding organisation
| Year | AQA | OCR | Pearson | WJEC |
|---|---|---|---|---|
| 2016 to 2017 | 52.3% | 13.5% | 27.8% | 6.4% |
| 2017 to 2018 | 61.1% | 7.6% | 25.4% | 5.9% |
| 2018 to 2019 | 61.4% | 7.2% | 25.5% | 5.9% |
| 2019 to 2020 | 61.7% | 6.9% | 25.4% | 6.0% |
| 2020 to 2021 | 62.0% | 6.8% | 25.2% | 6.0% |
The GCSE market continued to be relatively stable in the 2020 to 2021 academic year.
5.2 Number of certificates awarded in the top 10 GCSE subjects in the academic year 2020 to 2021
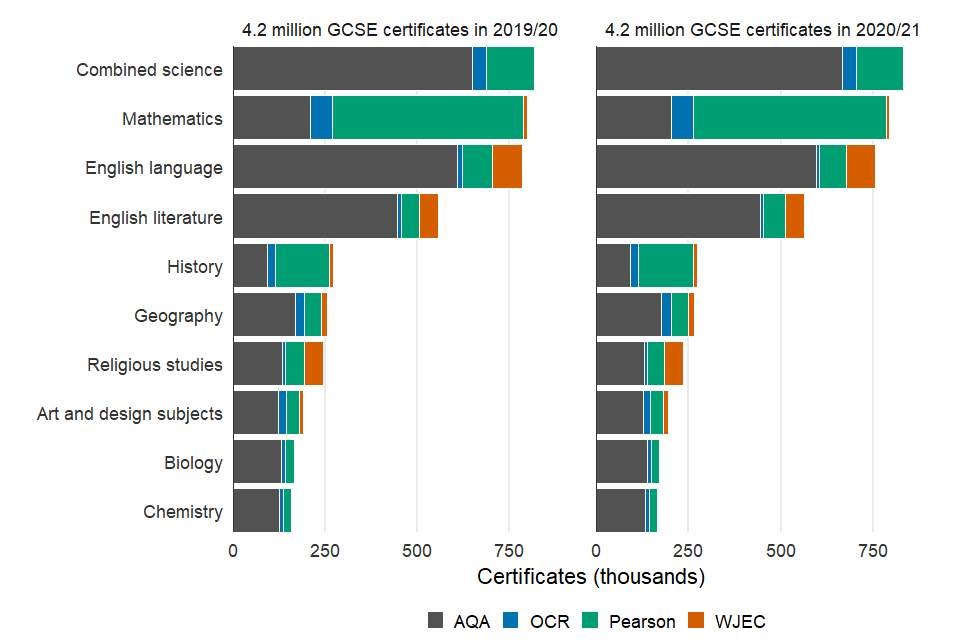
Number of certificates awarded in the 10 most popular GCSE subjects in 2019 to 2020 and 2020 to 2021
| Year | Subject | AQA | OCR | Pearson | WJEC | Total |
|---|---|---|---|---|---|---|
| 2020 to 2021 | Combined science | 667,420 | 36,360 | 127,050 | 0 | 830,830 |
| 2020 to 2021 | Mathematics | 203,680 | 60,090 | 520,890 | 9,700 | 794,360 |
| 2020 to 2021 | English language | 595,635 | 9,470 | 72,515 | 78,555 | 756,175 |
| 2020 to 2021 | English literature | 445,125 | 8,440 | 57,140 | 53,170 | 563,870 |
| 2020 to 2021 | History | 92,860 | 20,115 | 149,370 | 11,135 | 273,480 |
| 2020 to 2021 | Geography | 176,770 | 25,435 | 47,055 | 15,250 | 264,505 |
| 2020 to 2021 | Religious studies | 129,400 | 7,305 | 48,050 | 49,680 | 234,435 |
| 2020 to 2021 | Art and design subjects | 125,675 | 21,525 | 34,270 | 13,145 | 194,615 |
| 2020 to 2021 | Biology | 136,825 | 10,890 | 22,960 | 0 | 170,675 |
| 2020 to 2021 | Chemistry | 131,840 | 10,385 | 22,805 | 0 | 165,035 |
| 2019 to 2020 | Combined science | 649,085 | 37,920 | 128,490 | 150 | 815,645 |
| 2019 to 2020 | Mathematics | 210,610 | 58,865 | 518,325 | 8,705 | 796,505 |
| 2019 to 2020 | English language | 608,645 | 11,475 | 82,325 | 82,060 | 784,505 |
| 2019 to 2020 | English literature | 444,900 | 9,810 | 48,970 | 52,685 | 556,365 |
| 2019 to 2020 | History | 92,910 | 21,625 | 146,770 | 10,850 | 272,155 |
| 2019 to 2020 | Geography | 169,115 | 24,825 | 46,380 | 14,420 | 254,740 |
| 2019 to 2020 | Religious studies | 133,605 | 8,330 | 52,205 | 49,205 | 243,345 |
| 2019 to 2020 | Art and design subjects | 122,235 | 20,830 | 35,485 | 11,915 | 190,465 |
| 2019 to 2020 | Biology | 130,845 | 10,985 | 23,065 | 150 | 165,045 |
| 2019 to 2020 | Chemistry | 125,620 | 10,235 | 22,535 | 135 | 158,530 |
The total number of certificates for GCSEs has increased by 0.1% between the 2019 to 2020 academic year and the 2020 to 2021 academic year.
The top 10 highest volume subjects account for 79.9% of all GCSE certificates, 0.1 percentage point more than in the 2019 to 2020 academic year.
AQA has the largest market share in 8 of the 10 highest volume subjects. Pearson has the largest share in the remaining 2 subjects; mathematics and history.
Among the top 10 highest volume subjects, English language, religious studies and mathematics have seen a drop in the number of certificates issued (down by 28,300; 8,900 and 2,100 respectively compared to the 2019 to 2020 academic year). The biggest increases in the number of certificates were for combined science, geography and English literature (up by 15,200; 9,800 and 7,500 respectively). Among the top 10 highest volume subjects, chemistry saw the largest proportional increase in the number of certificates (up by 4.1% from the 2019 to 2020 academic year).
The market share of awarding organisations in all GCSE subjects in the 2020 to 2021 is given in the data tables accompanying this release (Table 8).
Please note, combined science certificates have been doubled throughout the report and data tables to reflect the fact that it counts as two GCSEs.
5.3 Market share: AS
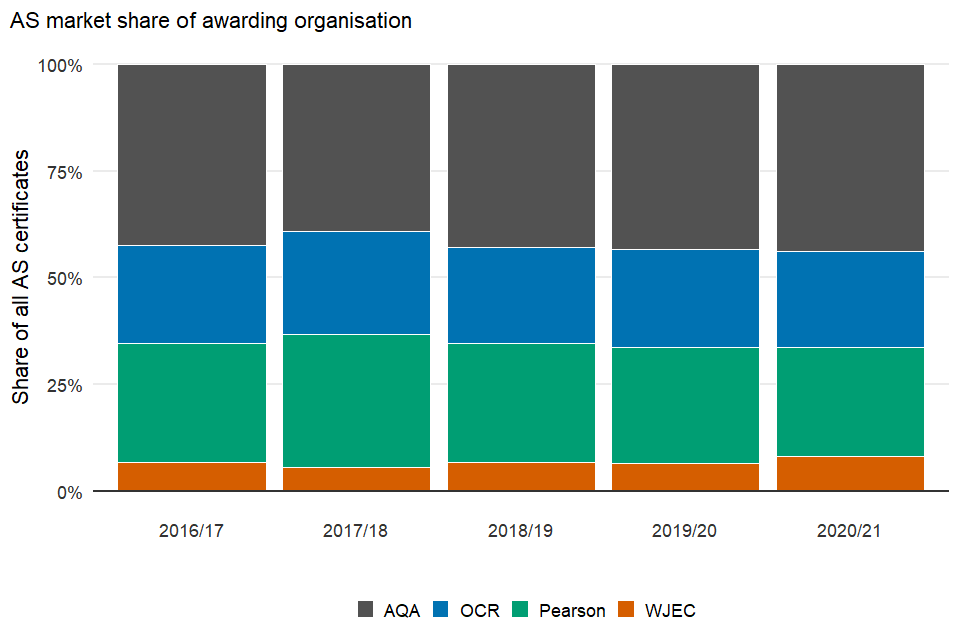
AS market share of awarding organisation
| Year | AQA | OCR | Pearson | WJEC |
|---|---|---|---|---|
| 2016 to 2017 | 42.5% | 22.9% | 27.8% | 6.8% |
| 2017 to 2018 | 39.2% | 24.1% | 31.0% | 5.7% |
| 2018 to 2019 | 43.0% | 22.4% | 27.9% | 6.8% |
| 2019 to 2020 | 43.4% | 22.8% | 27.1% | 6.6% |
| 2020 to 2021 | 43.9% | 22.4% | 25.6% | 8.1% |
The AS market is changing due to the overall decline in entries (rates of decline among different subjects vary) which reflects the phased AS and A level reforms. Pearson has seen the largest decrease (down by 1.5% in the 2020 to 2021 academic year) in its share of the AS market. WJEC has seen the largest increase (up by 1.5%) in its share of the AS market.
5.4 Number of certificates awarded in the top 10 AS subjects in the academic year 2020 to 2021
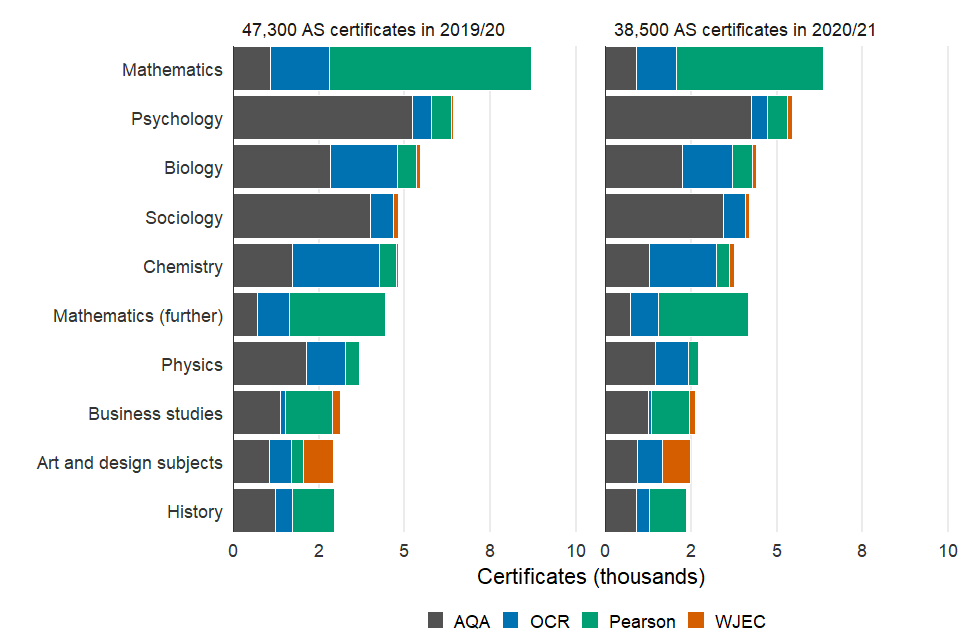
Number of certificates awarded in the 10 most popular AS subjects in 2019 to 2020 and 2020 to 2021
| Year | Subject | AQA | OCR | Pearson | WJEC | Total |
|---|---|---|---|---|---|---|
| 2020 to 2021 | Mathematics | 905 | 1,165 | 4,290 | 0 | 6,360 |
| 2020 to 2021 | Psychology | 4,245 | 465 | 580 | 155 | 5,450 |
| 2020 to 2021 | Biology | 2,235 | 1,470 | 565 | 140 | 4,415 |
| 2020 to 2021 | Sociology | 3,435 | 640 | 0 | 130 | 4,210 |
| 2020 to 2021 | Mathematics (further) | 720 | 820 | 2,620 | 0 | 4,155 |
| 2020 to 2021 | Chemistry | 1,285 | 1,965 | 380 | 145 | 3,775 |
| 2020 to 2021 | Physics | 1,450 | 960 | 290 | 10 | 2,715 |
| 2020 to 2021 | Business studies | 1,265 | 80 | 1,095 | 185 | 2,620 |
| 2020 to 2021 | Art and design subjects | 930 | 730 | 0 | 830 | 2,485 |
| 2020 to 2021 | History | 915 | 360 | 1,075 | 0 | 2,350 |
| 2019 to 2020 | Mathematics | 1,090 | 1,710 | 5,910 | 0 | 8,710 |
| 2019 to 2020 | Psychology | 5,220 | 565 | 565 | 80 | 6,430 |
| 2019 to 2020 | Biology | 2,830 | 1,960 | 550 | 115 | 5,455 |
| 2019 to 2020 | Sociology | 4,005 | 670 | 0 | 140 | 4,815 |
| 2019 to 2020 | Chemistry | 1,740 | 2,520 | 485 | 70 | 4,815 |
| 2019 to 2020 | Mathematics (further) | 710 | 915 | 2,805 | 0 | 4,435 |
| 2019 to 2020 | Physics | 2,125 | 1,155 | 385 | 0\~ | 3,675 |
| 2019 to 2020 | Business studies | 1,380 | 135 | 1,390 | 210 | 3,115 |
| 2019 to 2020 | History | 1,225 | 510 | 1,220 | 0 | 2,950 |
| 2019 to 2020 | Art and design subjects | 1,050 | 635 | 350 | 875 | 2,910 |
The total number of certificates for AS qualifications has decreased by 19.4% between the 2019 to 2020 academic year and the 2020 to 2021 academic year, continuing the trend seen from 2016 due to the qualification reforms.
The top 10 highest volume subjects account for 69.9% of all AS certificates, 0.7 percentage point more than in the 2019 to 2020 academic year.
AQA has the largest market share in 6 of the 10 highest volume subjects. Pearson and OCR have the largest share in the remaining 4 subjects; mathematics, mathematics (further), history and chemistry.
There has been a decrease in the number of certificates across all top 10 highest volume AS subjects in the 2020 to 2021 academic year compared to the 2019 to 2020 academic year. This is particularly noticeable for AS mathematics, chemistry and biology where certificate numbers dropped by 2,300; 1,000 and 1,000 respectively compared to the 2019 to 2020 academic year.
The market share of awarding organisations in all AS subjects in the 2020 to 2021 academic year is given in the data tables accompanying this release (Table 9).
5.5 Market share: A level
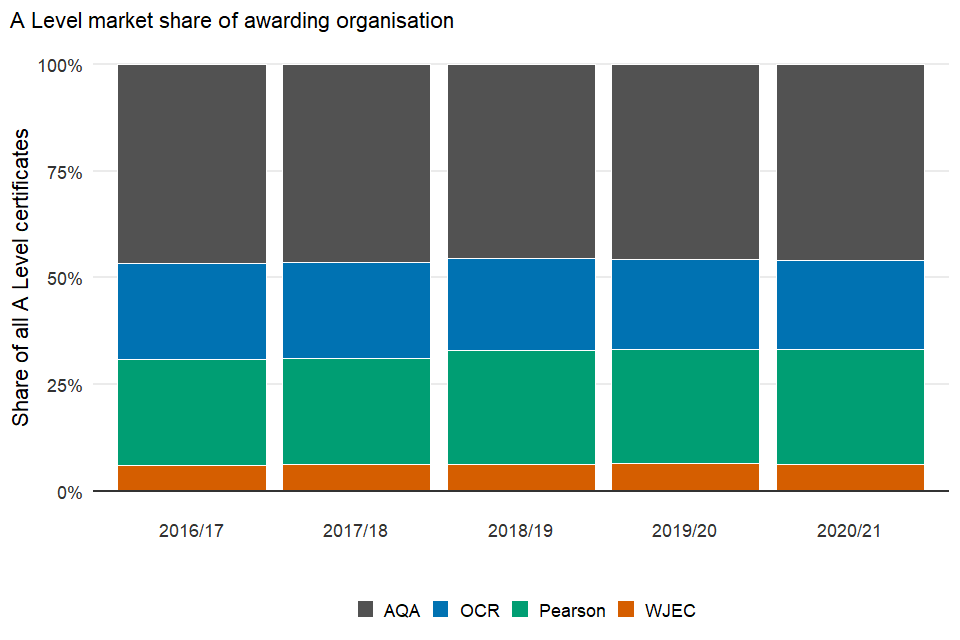
A level market share of awarding organisation
| Year | AQA | OCR | Pearson | WJEC |
|---|---|---|---|---|
| 2016 to 2017 | 46.6% | 22.4% | 24.8% | 6.2% |
| 2017 to 2018 | 46.3% | 22.7% | 24.7% | 6.3% |
| 2018 to 2019 | 45.4% | 21.6% | 26.7% | 6.3% |
| 2019 to 2020 | 45.7% | 21.0% | 26.7% | 6.5% |
| 2020 to 2021 | 45.9% | 20.9% | 27.0% | 6.2% |
The A level market continued to be relatively stable in the 2020 to 2021 academic year.
5.6 Number of certificates awarded in the top 10 A level subjects in the academic year 2020 to 2021
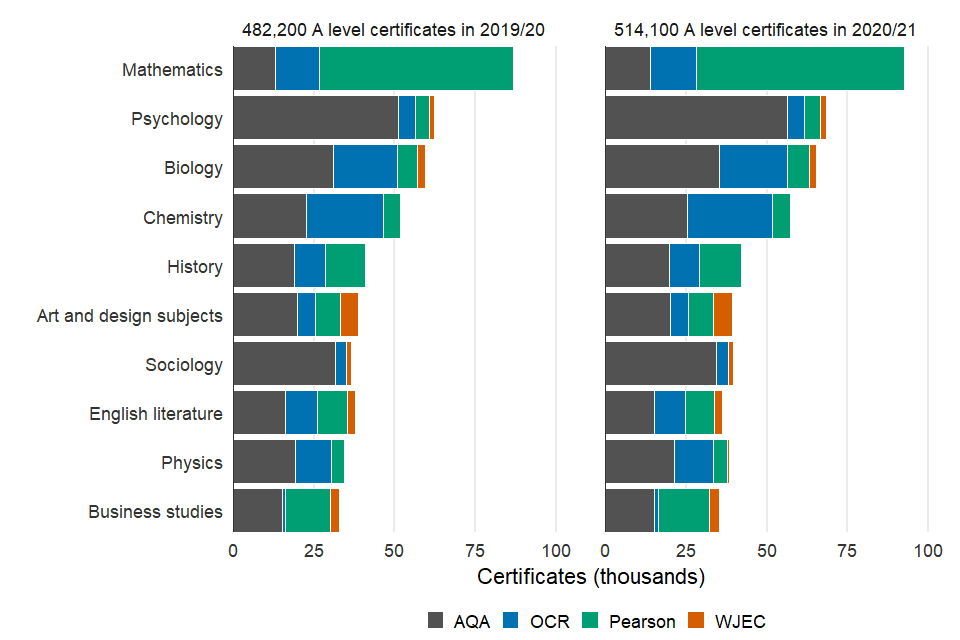
Number of certificates awarded in the 10 most popular A level subjects in 2019 to 2020 and 2020 to 2021
| Year | Subject | AQA | OCR | Pearson | WJEC | Total |
|---|---|---|---|---|---|---|
| 2020 to 2021 | Mathematics | 13,820 | 14,305 | 64,290 | 0 | 92,420 |
| 2020 to 2021 | Psychology | 56,425 | 5,265 | 4,755 | 1,950 | 68,390 |
| 2020 to 2021 | Biology | 35,335 | 21,085 | 6,765 | 2,210 | 65,390 |
| 2020 to 2021 | Chemistry | 25,420 | 26,160 | 5,640 | 130 | 57,355 |
| 2020 to 2021 | History | 19,700 | 9,455 | 12,765 | 0 | 41,920 |
| 2020 to 2021 | Sociology | 34,285 | 3,690 | 0 | 1,635 | 39,615 |
| 2020 to 2021 | Art and design subjects | 19,950 | 5,570 | 7,810 | 5,915 | 39,245 |
| 2020 to 2021 | Physics | 21,405 | 12,040 | 4,180 | 595 | 38,220 |
| 2020 to 2021 | English literature | 15,130 | 9,480 | 9,200 | 2,505 | 36,315 |
| 2020 to 2021 | Business studies | 15,230 | 1,070 | 15,790 | 3,165 | 35,255 |
| 2019 to 2020 | Mathematics | 13,015 | 13,580 | 60,250 | 0 | 86,845 |
| 2019 to 2020 | Psychology | 51,165 | 5,185 | 4,325 | 1,670 | 62,340 |
| 2019 to 2020 | Biology | 31,055 | 19,735 | 6,230 | 2,300 | 59,320 |
| 2019 to 2020 | Chemistry | 22,685 | 23,825 | 5,085 | 125 | 51,725 |
| 2019 to 2020 | History | 19,065 | 9,330 | 12,430 | 0 | 40,825 |
| 2019 to 2020 | Art and design subjects | 19,845 | 5,575 | 7,795 | 5,655 | 38,870 |
| 2019 to 2020 | English literature | 16,225 | 9,890 | 9,160 | 2,685 | 37,960 |
| 2019 to 2020 | Sociology | 31,620 | 3,430 | 0 | 1,655 | 36,705 |
| 2019 to 2020 | Physics | 19,350 | 10,995 | 3,920 | 605 | 34,870 |
| 2019 to 2020 | Business studies | 15,160 | 1,010 | 13,795 | 2,750 | 32,715 |
The total number of certificates for A levels has increased by 6.5% between the 2019 to 2020 academic year and the 2020 to 2021 academic year. This is in line with the change in the overall number of entries for A level qualifications taken in the 2020 to 2021 academic year. The change is likely to partly reflect an increase in the size of the 16 year old cohort.
The top 10 highest volume subjects account for 67.3% of all A level certificates, the same as in the 2019 to 2020 academic year. Among the top 10 highest volume subjects English literature has seen a drop in the number of certificates issued (down by 1,600 compared to the 2019 to 2020 academic year). Among the top 10 highest volume subjects, biology, psychology and chemistry have seen the largest increase in the number of certificates (up by 6,100; 6,100 and 5,600 respectively).
The market share of awarding organisations in all A level subjects in the 2020 to 2021 academic year is given in the data tables accompanying this release (Table 10).
6. Vocational and other qualifications
6.1 Number of certificates in vocational and other qualifications by sector subject area
Sector subject areas (SSAs) is a classification of qualifications into business sectors or subject areas maintained by Ofqual. There are 15 SSAs in total.
| Sector subject area | Number of certificates in 2019 to 2020 | Share of certificates in 2019 to 2020 | Number of certificates in 2020 to 2021 | Share of certificates in 2020 to 2021 |
|---|---|---|---|---|
| Health, Public Services and Care | 911,060 | 21.5% | 1,079,475 | 23.2% |
| Preparation for Life and Work | 989,165 | 23.3% | 869,805 | 18.7% |
| Arts, Media and Publishing | 458,825 | 10.8% | 619,485 | 13.3% |
| Business, Administration and Law | 334,470 | 7.9% | 383,295 | 8.2% |
| Construction, Planning and the Built Environment | 271,360 | 6.4% | 323,800 | 7.0% |
| Leisure, Travel and Tourism | 276,830 | 6.5% | 301,020 | 6.5% |
| Retail and Commercial Enterprise | 259,720 | 6.1% | 295,355 | 6.3% |
| Engineering and Manufacturing Technologies | 218,590 | 5.1% | 238,910 | 5.1% |
| Information and Communication Technology | 146,380 | 3.4% | 149,945 | 3.2% |
| Science and Mathematics | 114,870 | 2.7% | 106,520 | 2.3% |
| Agriculture, Horticulture and Animal Care | 70,870 | 1.7% | 87,850 | 1.9% |
| Education and Training | 77,095 | 1.8% | 81,675 | 1.8% |
| Languages, Literature and Culture | 83,360 | 2.0% | 73,960 | 1.6% |
| Social Sciences | 22,530 | <1% | 31,930 | <1% |
| History, Philosophy and Theology | 10,935 | <1% | 9,760 | <1% |
| Total | 4,246,060 | 100.0% | 4,652,790 | 100.0% |
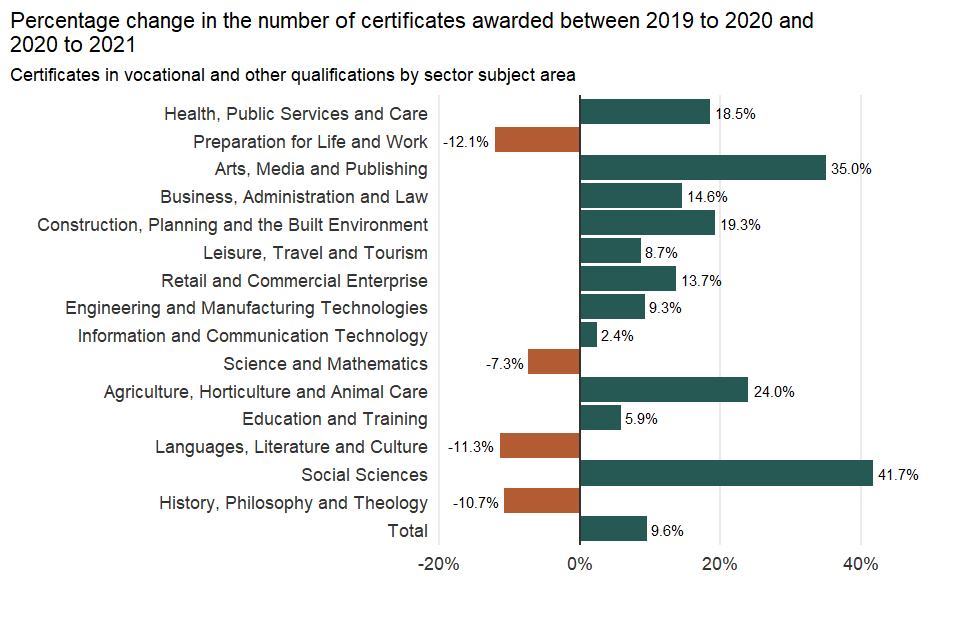
Percentage change in the number of certificates awarded by sector subject area between 2019 to 2020 and 2020 to 2021
| Sector subject area | Percentage change in the number of certificates awarded between 2019 to 2020 and 2020 to 2021 |
|---|---|
| Health, Public Services and Care | 18.5% |
| Preparation for Life and Work | -12.1% |
| Arts, Media and Publishing | 35.0% |
| Business, Administration and Law | 14.6% |
| Construction, Planning and the Built Environment | 19.3% |
| Leisure, Travel and Tourism | 8.7% |
| Retail and Commercial Enterprise | 13.7% |
| Engineering and Manufacturing Technologies | 9.3% |
| Information and Communication Technology | 2.4% |
| Science and Mathematics | -7.3% |
| Agriculture, Horticulture and Animal Care | 24.0% |
| Education and Training | 5.9% |
| Languages, Literature and Culture | -11.3% |
| Social Sciences | 41.7% |
| History, Philosophy and Theology | -10.7% |
| Total | 9.6% |
There were 4.7 million certificates awarded in vocational and other qualifications in the 2020 to 2021 academic year. This is up 9.6% compared to the 2019 to 2020 academic year, when many assessments were cancelled or delayed in spring and summer 2020 due to the measures put in place in response to the coronavirus (COVID-19) pandemic.
Consistent with the overall increase in the volume of certificates, most SSAs have seen an increase in the number of certificates. The largest increase in the number of certificates awarded in vocational and other qualifications was seen in Health, Public Services and Care as well as Arts, Media and Publishing SSAs (up by 168,400 and 160,700 respectively). Preparation for Life and Work; Languages, Literature and Culture as well as Science and Mathematics SSAs have had the most substantial declines in the number of certificates awarded (down by 119,400; 9,400 and 8,300 respectively).
6.2 Number of certificates in vocational and other qualifications by level
Qualification level gives an indication of the difficulty of the qualification, with higher levels being more difficult. The content and number of study hours, however, can vary significantly within a qualification level.
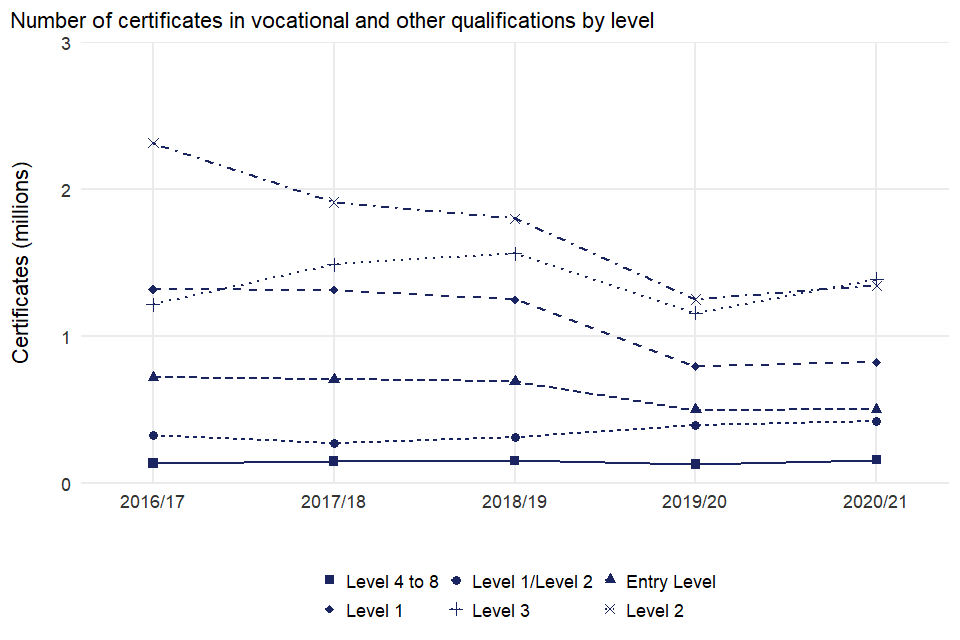
Number of certificates in vocational and other qualifications by level from 2016 to 2017 to 2020 to 2021
| Qualification level | Number of certificates in 2016 to 2017 | Number of certificates in 2017 to 2018 | Number of certificates in 2018 to 2019 | Number of certificates in 2019 to 2020 | Number of certificates in 2020 to 2021 |
|---|---|---|---|---|---|
| Entry Level | 723,015 | 708,380 | 696,805 | 502,485 | 503,530 |
| Level 1 | 1,323,125 | 1,317,525 | 1,253,300 | 798,565 | 825,630 |
| Level 1/Level 2 | 328,710 | 272,605 | 315,400 | 397,705 | 421,770 |
| Level 2 | 2,317,880 | 1,913,910 | 1,803,310 | 1,254,470 | 1,347,460 |
| Level 3 | 1,219,100 | 1,490,205 | 1,565,095 | 1,161,275 | 1,391,950 |
| Level 4 to 8 | 139,620 | 152,195 | 155,850 | 131,555 | 162,450 |
The 4-year trend in declining numbers of Level 1 and Level 2 certificates has reversed this academic year. The number of Level 1 certificates has increased by 27,100 and Level 2 certificates were up by 93,000 in the 2020 to 2021 academic year compared to the 2019 to 2020 academic year.
The number of Level 3 certificates has increased in the 2020 to 2021 academic year (up by 230,700), reaching numbers slightly lower than those observed before the 2019 to 2020 academic year.
The number of certificates for Entry Level qualifications has increased slightly (up by 1,000) compared to the 2019 to 2020.
The numbers of certificates for Level 1/Level 2 qualifications continue to increase. There has been a 24,100 increase in the number of certificates in the 2020 to 2021 academic year compared to the 2019 to 2020 academic year.
The number of certificates in Levels 4 to 8 has also increased this year, up by 30,900, reaching the highest number of certificates over the last 5 years.
6.3 Awarding organisations with the highest number of certificates awarded in vocational and other qualifications
| Awarding organisation | Number of certificates in 2019 to 2020 | Number of certificates in 2020 to 2021 |
|---|---|---|
| Pearson Education Ltd | 815,190 | 802,585 |
| City and Guilds of London Institute | 602,400 | 551,055 |
| NCFE | 357,770 | 368,890 |
| Highfield Qualifications | 201,055 | 222,000 |
| OCR | 236,120 | 220,390 |
| Trinity College London | 140,015 | 196,205 |
| Qualsafe Awards | 145,055 | 180,400 |
| Associated Board of the Royal Schools of Music | 91,985 | 167,560 |
| First Aid Awards Ltd | 92,460 | 124,955 |
| Training Qualifications UK Ltd | 81,545 | 110,535 |
| AQA Education | 113,240 | 100,345 |
| VTCT | 41,590 | 92,160 |
| NOCN | 84,795 | 88,865 |
| Ascentis | 83,395 | 85,705 |
| WJEC-CBAC | 56,145 | 71,845 |
| IQL | 32,050 | 53,880 |
| University of the Arts London | 45,135 | 51,465 |
| Excellence, Achievement & Learning Limited | 45,560 | 50,790 |
| Gateway Qualifications Limited | 40,490 | 46,305 |
| Cambridge Assessment English | 51,845 | 44,115 |
| Other organisations | 888,215 | 1,022,735 |
| Total | 4,246,060 | 4,652,790 |
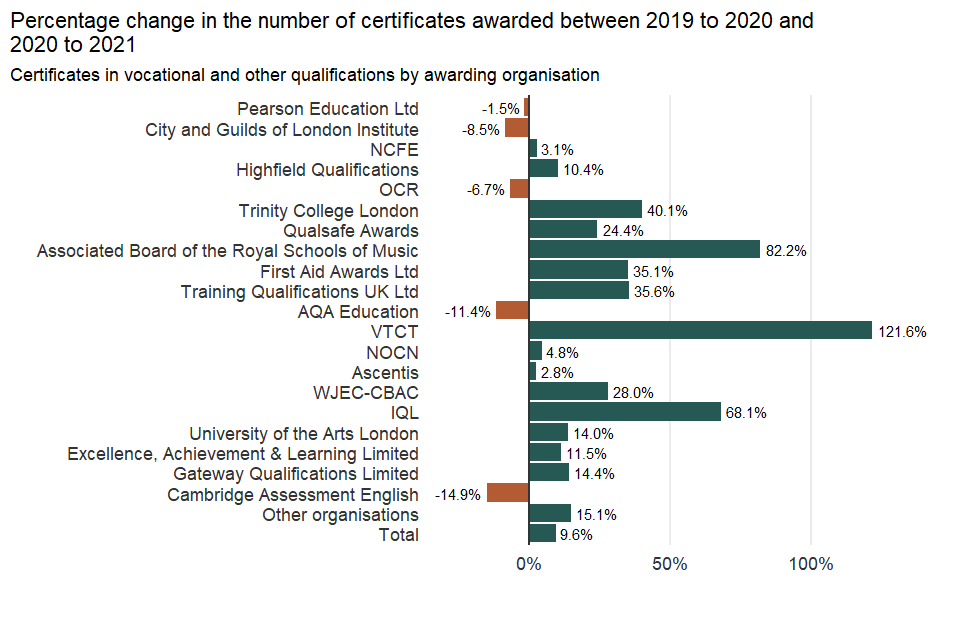
Percentage change in the number of certificates awarded by awarding organisation between 2019 to 2020 and 2020 to 2021
| Awarding organisation | Percentage change in the number of certificates awarded between 2019 to 2020 and 2020 to 2021 |
|---|---|
| Pearson Education Ltd | -1.5% |
| City and Guilds of London Institute | -8.5% |
| NCFE | 3.1% |
| Highfield Qualifications | 10.4% |
| OCR | -6.7% |
| Trinity College London | 40.1% |
| Qualsafe Awards | 24.4% |
| Associated Board of the Royal Schools of Music | 82.2% |
| First Aid Awards Ltd | 35.1% |
| Training Qualifications UK Ltd | 35.6% |
| AQA Education | -11.4% |
| VTCT | 121.6% |
| NOCN | 4.8% |
| Ascentis | 2.8% |
| WJEC-CBAC | 28.0% |
| IQL | 68.1% |
| University of the Arts London | 14.0% |
| Excellence, Achievement & Learning Limited | 11.5% |
| Gateway Qualifications Limited | 14.4% |
| Cambridge Assessment English | -14.9% |
| Other organisations | 15.1% |
| Total | 9.6% |
The 20 awarding organisations that reported the highest volume of certificates awarded in vocational and other qualifications in the 2020 to 2021 academic year awarded 78.0% of all certificates awarded in vocational and other qualifications. IQL is new to the top 20 this year.
The Associated Board of the Royal Schools of Music has had the largest increase (up by 75,600) in certificates compared with the previous year, largely due to increases in the number of certificates awarded for the new Performing Arts Graded Examination qualifications.
VTCT has had the largest percentage increase (up by 121.6%) in certificate numbers, largely due to increases in the number of certificates for Vocationally-Related Qualifications.
Please note data for all awarding organisations is available in the Vocational and Other qualifications quarterly published by Ofqual.
7. In focus: technical and applied qualifications
Technical and applied qualifications are vocational qualifications designated as such according to Department for Education criteria and can count towards school and college performance tables. Applied qualifications which are known as Applied General qualifications are for students who want to continue their education through applied learning and offer a progression route to employment or higher education. They are all Level 3 qualifications aimed at post-16 students. The purpose of technical qualifications is to equip students with applied knowledge and associated practical skills not usually associated with general qualifications. They are Level 1, 1/2, 2 and 3 qualifications.
7.1 Market share of technical and applied qualifications in the 2020 to 2021 academic year
| Qualification category | Number of certificates | Market share |
|---|---|---|
| Applied Generals | 209,165 | 4.5% |
| Technical qualifications | 495,820 | 10.7% |
| Remaining vocational and other qualifications | 3,947,805 | 84.8% |
7.2 Market share of technical qualifications in the 2020 to 2021 academic year
| Qualification category | Number of certificates | Market share |
|---|---|---|
| Technical Awards | 415,200 | 83.7% |
| Technical Certificates | 24,430 | 4.9% |
| Tech Levels | 56,190 | 11.3% |
The 495,800 technical qualifications certificates awarded in the 2020 to 2021 academic year can be further broken down into:
-
415,200 Technical Awards, these are Level 1, Level 2 or Level 1/ Level 2 qualifications and designed for study at key stage 4 (14 to 16 year olds). They require the same or more guided learning hours as a GCSE.
-
24,400 Technical Certificates, these are designed for study at key stage 5 (16 to 19 year olds) and are intended for students who wish to specialise in a specific industry or prepare for a particular job. They are Level 2 qualifications.
-
56,200 Tech Levels, which are also designed for study at key stage 5. They are Level 3 qualifications.
7.3 Number of technical and applied qualifications certificates by sector subject area
| Sector subject area | Applied Generals | Technical Awards | Technical Certificates | Tech Levels | Total |
|---|---|---|---|---|---|
| Leisure, Travel and Tourism | 23,845 | 99,090 | 470 | 2,020 | 125,420 |
| Business, Administration and Law | 57,685 | 47,095 | 11,540 | 8,505 | 124,825 |
| Arts, Media and Publishing | 13,950 | 106,150 | 205 | 4,135 | 124,440 |
| Health, Public Services and Care | 33,530 | 66,200 | 910 | 13,275 | 113,915 |
| Information and Communication Technology | 16,630 | 28,740 | 830 | 4,455 | 50,655 |
| Engineering and Manufacturing Technologies | 6,385 | 27,845 | 825 | 4,190 | 39,250 |
| Retail and Commercial Enterprise | 1,280 | 29,480 | 3,445 | 1,610 | 35,815 |
| Science and Mathematics | 28,635 | 0 | 0 | 0 | 28,635 |
| Social Sciences | 27,130 | 0 | 0 | 0 | 27,130 |
| Agriculture, Horticulture and Animal Care | 0 | 1,940 | 3,460 | 12,795 | 18,195 |
| Construction, Planning and the Built Environment | 90 | 8,655 | 2,750 | 5,205 | 16,700 |
| Total | 209,165 | 415,200 | 24,430 | 56,190 | 704,985 |
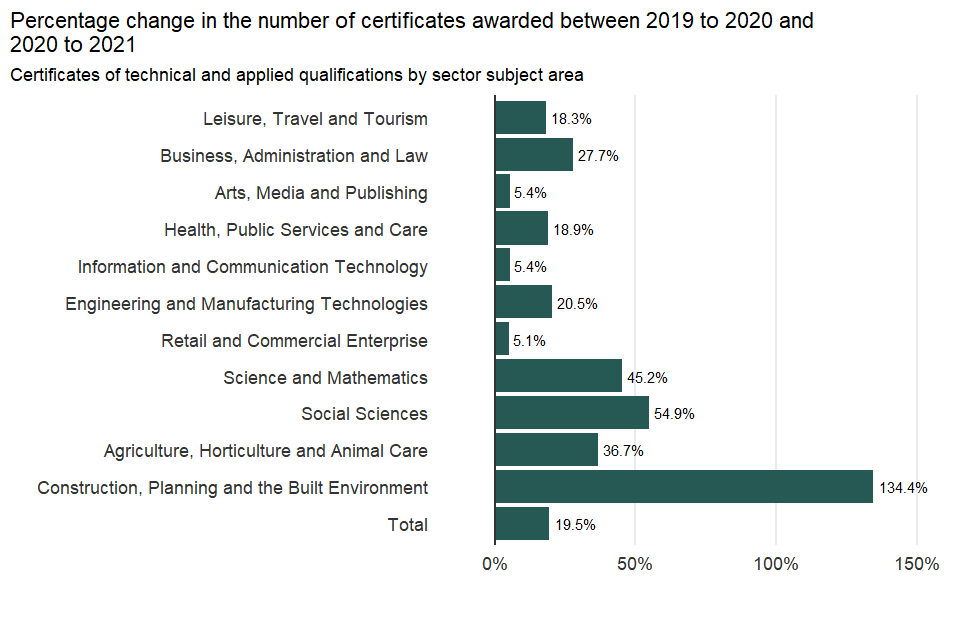
Percentage change in the number of certificates awarded by sector subject area between 2019 to 2020 and 2020 to 2021
| Sector subject area | Percentage change in the number of certificates awarded between 2019 to 2020 and 2020 to 2021 |
|---|---|
| Leisure, Travel and Tourism | 18.3% |
| Business, Administration and Law | 27.7% |
| Arts, Media and Publishing | 5.4% |
| Health, Public Services and Care | 18.9% |
| Information and Communication Technology | 5.4% |
| Engineering and Manufacturing Technologies | 20.5% |
| Retail and Commercial Enterprise | 5.1% |
| Science and Mathematics | 45.2% |
| Social Sciences | 54.9% |
| Agriculture, Horticulture and Animal Care | 36.7% |
| Construction, Planning and the Built Environment | 134.4% |
| Total | 19.5% |
There was an increase in the number of certificates in technical and applied qualifications across all SSAs in the 2020 to 2021 academic year compared to the 2019 to 2020 academic year. Business, Administration and Law; Leisure, Travel and Tourism as well as Health, Public Services and Care saw the largest increase (up by 27,100; 19,400 and 18,100 respectively) in the number of certificates awarded in the 2020 to 2021 academic year compared to the 2019 to 2020 academic year.
Applied Generals in the Business, Administration and Law saw the largest increase in the number of certificates compared to other qualification categories and SSAs, up by 16,600. Tech Levels in Construction, Planning and the Built Environment saw the largest proportional increase (up by 305.2%) in the number of certificates compared to other qualification categories and SSAs in the 2020 to 2021 academic year.
7.4 Distribution of Technical and Applied General certificates by sector subject area
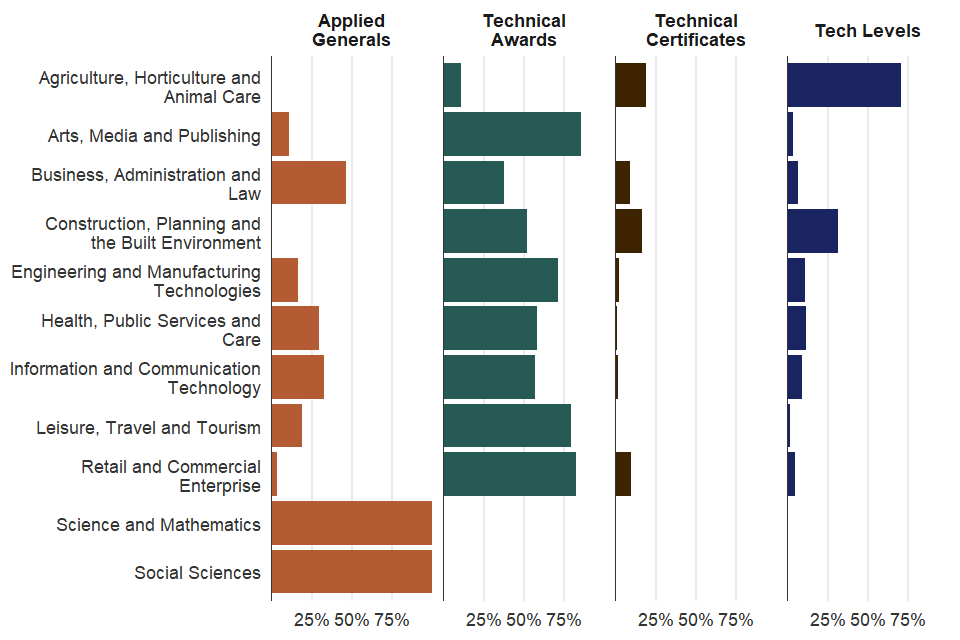
Distribution of Technical and Applied General certificates by sector subject area
| Sector subject area | Applied Generals | Technical Awards | Technical Certificates | Tech Levels |
|---|---|---|---|---|
| Agriculture, Horticulture and Animal Care | 0.0% | 10.7% | 19.0% | 70.3% |
| Arts, Media and Publishing | 11.2% | 85.3% | 0.2% | 3.3% |
| Business, Administration and Law | 46.2% | 37.7% | 9.2% | 6.8% |
| Construction, Planning and the Built Environment | 0.6% | 51.8% | 16.5% | 31.2% |
| Engineering and Manufacturing Technologies | 16.3% | 70.9% | 2.1% | 10.7% |
| Health, Public Services and Care | 29.4% | 58.1% | 0.8% | 11.7% |
| Information and Communication Technology | 32.8% | 56.7% | 1.6% | 8.8% |
| Leisure, Travel and Tourism | 19.0% | 79.0% | 0.4% | 1.6% |
| Retail and Commercial Enterprise | 3.6% | 82.3% | 9.6% | 4.5% |
| Science and Mathematics | 100.0% | 0.0% | 0.0% | 0.0% |
| Social Sciences | 100.0% | 0.0% | 0.0% | 0.0% |
| Total | 29.7% | 58.9% | 3.5% | 8.0% |
Different SSAs have a different mix of technical and applied qualifications. For instance, the Arts, Media and Publishing sector is dominated by Technical Awards and Agriculture, Horticulture and Animal Care sector is dominated by Tech Levels. Whereas Science and Mathematics as well as Social Sciences SSAs comprise entirely of Applied General qualifications.
7.5 Number of technical and applied qualifications certificates by awarding organisation
| Awarding organisation | Applied Generals | Technical Awards | Technical Certificates | Tech Levels | Total |
|---|---|---|---|---|---|
| Pearson Education Ltd | 142,485 | 205,080 | 3,220 | 13,820 | 364,605 |
| OCR | 20,500 | 136,735 | 1,135 | 6,645 | 165,020 |
| WJEC-CBAC | 29,775 | 36,205 | 0 | 0 | 65,985 |
| NCFE | 270 | 23,380 | 0 | 11,800 | 35,450 |
| City and Guilds of London Institute | 0 | 1,235 | 8,020 | 11,770 | 21,025 |
| Association of Accounting Technicians | 0 | 0 | 10,630 | 8,440 | 19,065 |
| The London Institute of Banking & Finance | 10,145 | 0 | 0 | 0 | 10,145 |
| RSL Awards Ltd | 0 | 7,690 | 0 | 1,260 | 8,950 |
| AQA Education | 4,000 | 1,260 | 0 | 875 | 6,140 |
| VTCT | 55 | 1,870 | 875 | 540 | 3,340 |
| University of the Arts London | 1,925 | 0 | 0 | 0 | 1,925 |
| Excellence, Achievement & Learning Limited | 0 | 625 | 240 | 310 | 1,175 |
| The Institute of the Motor Industry | 0 | 595 | 235 | 30 | 860 |
| AIM Qualifications | 0 | 0 | 0 | 490 | 490 |
| 1st4sport Qualifications | 5 | 370 | 15 | 0 | 390 |
| Active IQ | 0 | 0 | 55 | 205 | 260 |
| Skills and Education Group Awards | 0 | 155 | 0 | 0 | 155 |
| Total | 209,165 | 415,200 | 24,430 | 56,190 | 704,985 |
Pearson was the single largest provider of Applied Generals and Technical Awards due to its Level 3 Applied General and Level 1/Level 2 Technical BTEC qualifications. The Association of Accounting Technicians, City and Guilds and Pearson dominated the Technical Certificates market. Pearson and NCFE were the largest providers of Tech Levels.
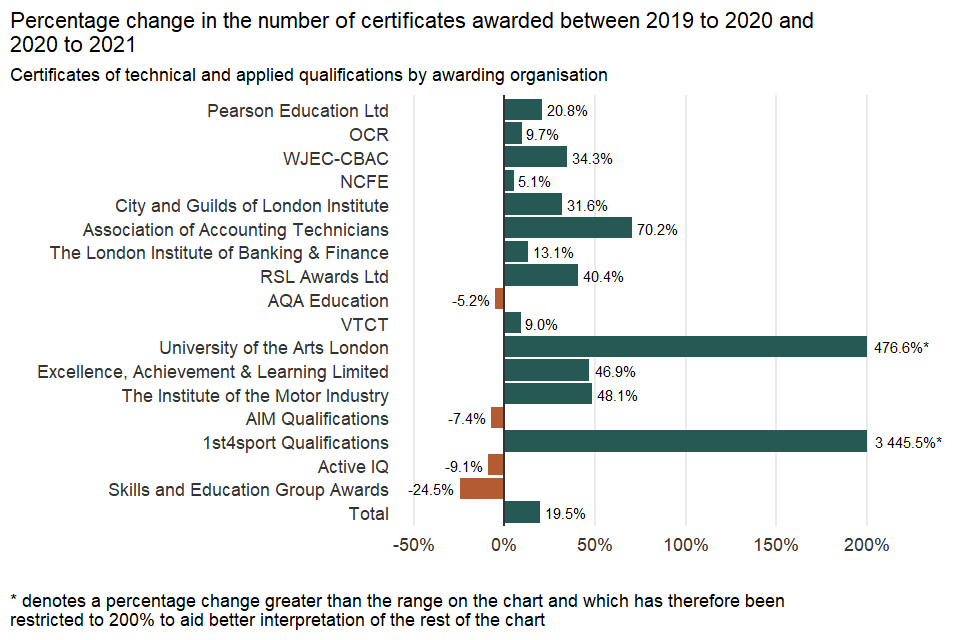
Percentage change in the number of certificates awarded by awarding organisation between 2019 to 2020 and 2020 to 2021
| Awarding organisation | Percentage change in the number of certificates awarded between 2019 to 2020 and 2020 to 2021 |
|---|---|
| Pearson Education Ltd | 20.8% |
| OCR | 9.7% |
| WJEC-CBAC | 34.3% |
| NCFE | 5.1% |
| City and Guilds of London Institute | 31.6% |
| Association of Accounting Technicians | 70.2% |
| The London Institute of Banking & Finance | 13.1% |
| RSL Awards Ltd | 40.4% |
| AQA Education | -5.2% |
| VTCT | 9.0% |
| University of the Arts London | 476.6% |
| Excellence, Achievement & Learning Limited | 46.9% |
| The Institute of the Motor Industry | 48.1% |
| AIM Qualifications | -7.4% |
| 1st4sport Qualifications | 3 445.5% |
| Active IQ | -9.1% |
| Skills and Education Group Awards | -24.5% |
| Total | 19.5% |
Skills and Education Group Awards saw the largest proportional drop (down by 24.5%) in the number of certificates, as they awarded fewer certificates in Technical Awards and no certificates in Tech Levels in the 2020 to 2021 academic year compared to the previous year.
1st4sport Qualifications and University of the Arts London saw the largest proportional increase (up by 3,445.5% and 476.6% respectively) in the number of certificates in the 2020 to 2021 academic year compared to the 2019 to 2020 academic year. 1st4sport Qualifications began awarding certificates in Technical Award qualifications and Technical Certificates in the 2020 to 2021 academic year. University of the Arts London began awarding certificates in Applied General qualifications in the 2020 to 2021 academic year.
8. In focus: Functional Skills qualifications
Functional Skills are the fundamental and applied skills that help people to get the most from everyday life, education and work. Functional Skills qualifications are available in English, mathematics and ICT at the following levels: Entry level, Level 1 and Level 2.
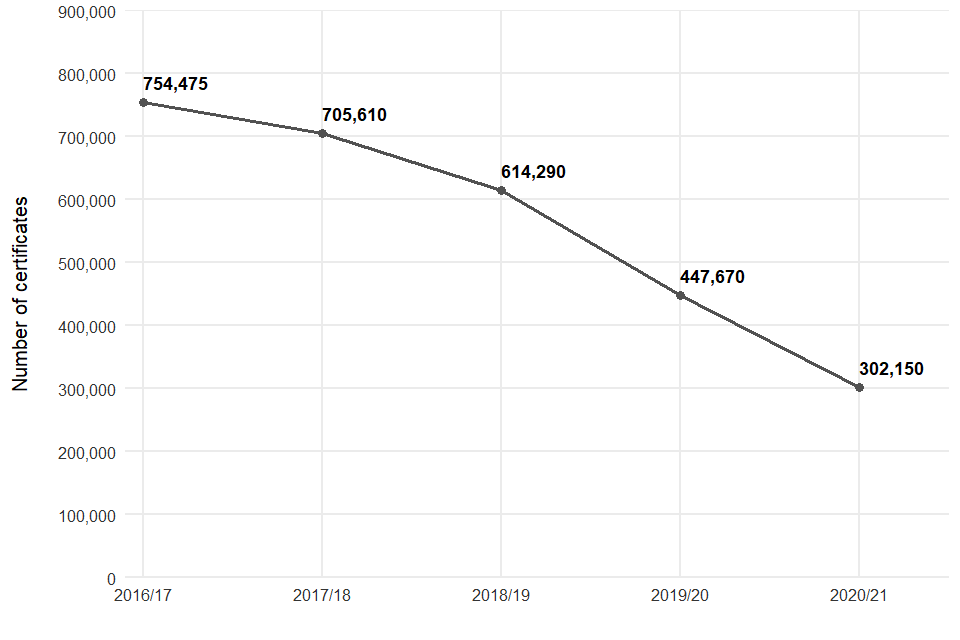
8.1 Number of certificates in Functional Skills qualifications
Number of certificates in functional skills qualifications from 2016 to 2017 to 2020 to 2021
| Academic year | Number of certificates |
|---|---|
| 2016 to 2017 | 754,475 |
| 2017 to 2018 | 705,610 |
| 2018 to 2019 | 614,290 |
| 2019 to 2020 | 447,670 |
| 2020 to 2021 | 302,150 |
The overall number of certificates awarded in Functional Skills qualifications has reduced by 33% (145,500) in the 2020 to 2021 academic year compared to the 2019 to 2020 academic year, continuing the downward trend seen over the last 5 years. There are a number of factors that may have influenced the trend, to a greater or lesser extent. These are discussed in the Background notes accompanying this release.
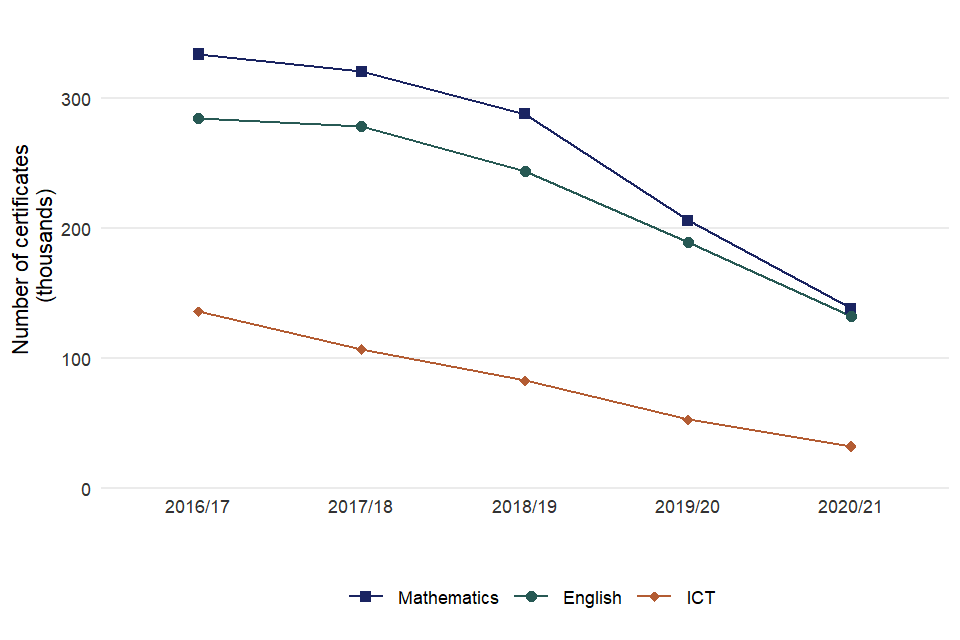
8.2 Number of certificates of Functional Skills qualifications by subject
Number of certificates in functional skills qualifications by subject from 2016 to 2017 to 2020 to 2021
| Subject | 2016 to 2017 | 2017 to 2018 | 2018 to 2019 | 2019 to 2020 | 2020 to 2021 |
|---|---|---|---|---|---|
| Mathematics | 333,905 | 320,450 | 287,945 | 205,710 | 138,170 |
| English | 284,795 | 278,385 | 243,605 | 189,345 | 131,900 |
| ICT | 135,770 | 106,775 | 82,740 | 52,610 | 32,080 |
There was a decline in the number of certificates across all subjects in the 2020 to 2021 academic year compared to the 2019 to 2020 academic year. The number of certificates in Functional Skills qualifications in mathematics decreased the most (down by 67,500) compared to the remaining subjects.
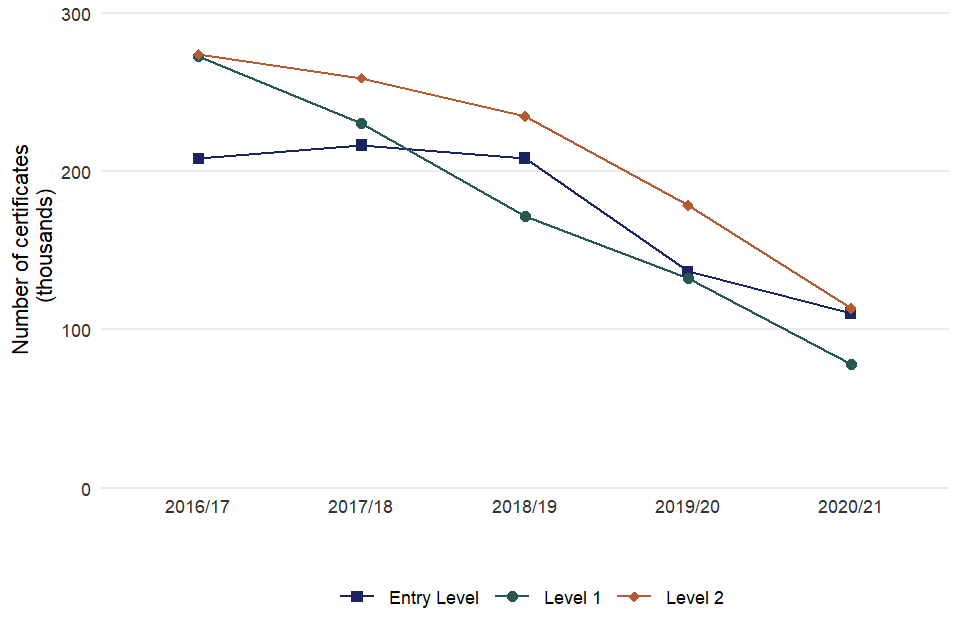
8.3 Number of certificates of Functional Skills by level
Number of certificates in functional skills qualifications by level from 2016 to 2017 to 2020 to 2021
| Qualification level | 2016 to 2017 | 2017 to 2018 | 2018 to 2019 | 2019 to 2020 | 2020 to 2021 |
|---|---|---|---|---|---|
| Entry Level | 207,900 | 216,480 | 208,250 | 136,600 | 110,465 |
| Level 1 | 272,670 | 230,270 | 171,455 | 132,505 | 78,230 |
| Level 2 | 273,900 | 258,860 | 234,585 | 178,560 | 113,455 |
There was a decline in the number of certificates in Functional Skills qualifications across all levels in the 2020 to 2021 academic year compared to the 2019 to 2020 academic year. The largest decrease in the number of certificates was in Level 2 qualifications, down by 65,100.
8.4 Number of certificates of Functional Skills qualifications by awarding organisation
| Awarding organisation | Number of certificates in 2019 to 2020 | Number of certificates in 2020 to 2021 |
|---|---|---|
| Pearson Education Ltd | 190,995 | 144,205 |
| City and Guilds of London Institute | 165,770 | 104,185 |
| NCFE | 36,585 | 25,500 |
| AQA Education | 15,785 | 8,510 |
| NOCN | 5,970 | 5,500 |
| Highfield Qualifications | 6,370 | 3,850 |
| Skillsfirst Awards Ltd | 6,825 | 3,825 |
| OCR | 14,620 | 3,220 |
| Open Awards | 1,425 | 2,645 |
| SFJ Awards | 1,200 | 330 |
| Excellence, Achievement & Learning Limited | 1,870 | 280 |
| Future (Awards and Qualifications) Ltd | 135 | 105 |
| Gateway Qualifications Limited | 120 | 0 |
| Total | 447,670 | 302,150 |
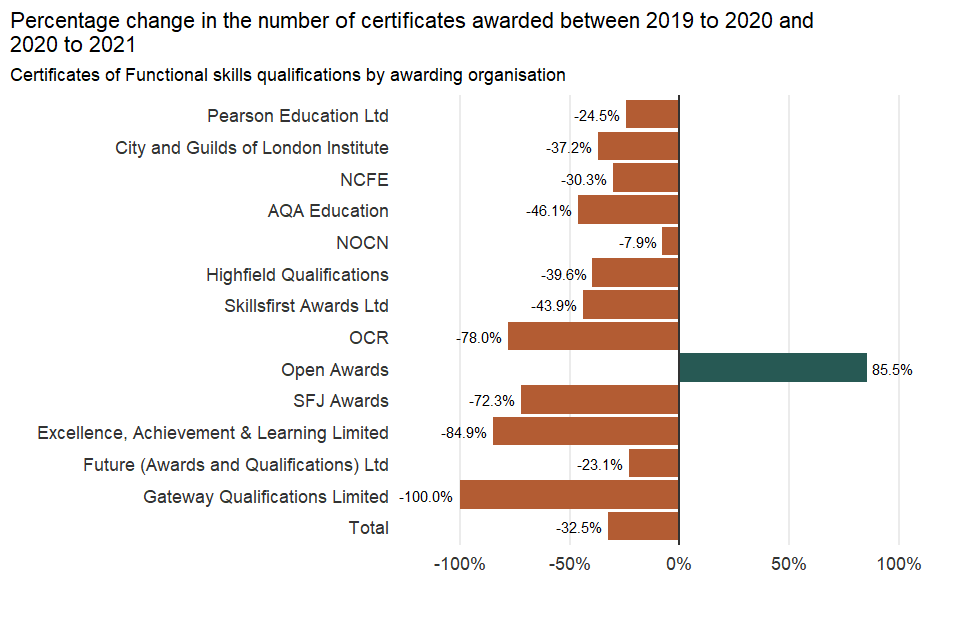
Percentage change in the number of certificates awarded by awarding organisation between 2019 to 2020 and 2020 to 2021
| Awarding organisation | Percentage change in the number of certificates awarded between 2019 to 2020 and 2020 to 2021 |
|---|---|
| Pearson Education Ltd | -24.5% |
| City and Guilds of London Institute | -37.2% |
| NCFE | -30.3% |
| AQA Education | -46.1% |
| NOCN | -7.9% |
| Highfield Qualifications | -39.6% |
| Skillsfirst Awards Ltd | -43.9% |
| OCR | -78.0% |
| Open Awards | 85.5% |
| SFJ Awards | -72.3% |
| Excellence, Achievement & Learning Limited | -84.9% |
| Future (Awards and Qualifications) Ltd | -23.1% |
| Gateway Qualifications Limited | -100.0% |
| Total | -32.5% |
There were 12 awarding organisation issuing certificates in Functional Skills qualifications in the 2020 to 2021 academic year, down from 13 in the previous year.
Most awarding organisations awarded fewer certificates in Functional Skills qualifications in comparison to the 2019 to 2020 academic year. Only Open Awards saw an increase in the number of certificates awarded (up by 1,200) in the 2020 to 2021 academic year compared to the 2019 to 2020 academic year.
City and Guilds of London Institute, Pearson Education Ltd and OCR saw the largest decrease in the number of certificates awarded for Functional Skill qualifications (down by 61,600, 46,800 and 11,400 respectively).
Gateway Qualifications Limited issued no certificates for Functional Skills qualifications this year.
9. In focus: International market
Ofqual-regulated awarding organisations offer a wide selection of regulated qualifications outside the UK. These qualifications, offered internationally, are protected by Ofqual regulation so long as they are also taken by learners in England. The certification data for delivery of regulated qualifications outside the UK was collected for the second time in the 2020 to 2021 academic year.
9.1 Number of certificates of regulated qualifications awarded outside the UK
| Year | Number of certificates |
|---|---|
| 2019 to 2020 | 4,885,670 |
| 2020 to 2021 | 5,775,140 |
In total 5.8 million certificates were awarded for 2,600 different regulated qualifications to students outside the UK over the 2020 to 2021 academic year, up by 18% compared to the previous year.
9.2 Number of certificates of regulated qualifications awarded outside the UK by type
| Qualification type | Number of certificates in 2019 to 2020 | Number of certificates in 2020 to 2021 | Share of certificates in 2019 to 2020 | Share of certificates in 2020 to 2021 |
|---|---|---|---|---|
| English for Speakers of Other Languages | 3,201,570 | 4,010,380 | 65.5% | 69.4% |
| Other General Qualification | 1,171,205 | 1,079,285 | 24.0% | 18.7% |
| Performing Arts Graded Examination | 279,085 | 392,600 | 5.7% | 6.8% |
| Vocationally-Related Qualification | 148,570 | 200,885 | 3.0% | 3.5% |
| GCSE (9 to 1) | 33,795 | 36,260 | 0.7% | 0.6% |
| Other qualifications | 51,440 | 55,725 | 1.1% | 1.0% |
| Total | 4,885,670 | 5,775,140 | 100.0% | 100.0% |

Percentage change in the number of certificates awarded by qualification type between 2019 to 2020 and 2020 to 2021
| Qualification type | Percentage change in the number of certificates awarded between 2019 to 2020 and 2020 to 2021 |
|---|---|
| English for Speakers of Other Languages | 25.3% |
| Other General Qualification | -7.8% |
| Performing Arts Graded Examination | 40.7% |
| Vocationally-Related Qualification | 35.2% |
| GCSE (9 to 1) | 7.3% |
| Other qualifications | 8.3% |
| Total | 18.2% |
The top 5 highest volume qualification types accounted for 99.0% of all certificates issued outside the UK. English for Speakers of Other Languages had the highest number of certificates issued, followed by Other General Qualification and Performing Arts Graded Examination.
Only Other General Qualification saw a decrease (down by 91,900) in the number of certificates awarded outside the UK in the 2020 to 2021 academic year compared to the previous year. The largest increase in the number of certificates awarded outside the UK was among English for Speakers of Other Languages regulated qualifications, up by 808,800.
9.3 Number of certificates of regulated qualifications awarded outside the UK by level
| Qualification level | Number of certificates in 2019 to 2020 | Number of certificates in 2020 to 2021 | Share of certificates in 2019 to 2020 | Share of certificates in 2020 to 2021 |
|---|---|---|---|---|
| Entry Level | 824,190 | 916,990 | 16.9% | 15.9% |
| Level 1 | 1,665,620 | 2,138,115 | 34.1% | 37.0% |
| Level 1/Level 2 | 209,930 | 152,315 | 4.3% | 2.6% |
| Level 2 | 943,430 | 1,243,995 | 19.3% | 21.5% |
| Level 3 | 1,185,435 | 1,246,575 | 24.3% | 21.6% |
| Level 4 to 8 | 57,065 | 77,145 | 1.2% | 1.3% |
| Total | 4,885,670 | 5,775,140 | 100.0% | 100.0% |
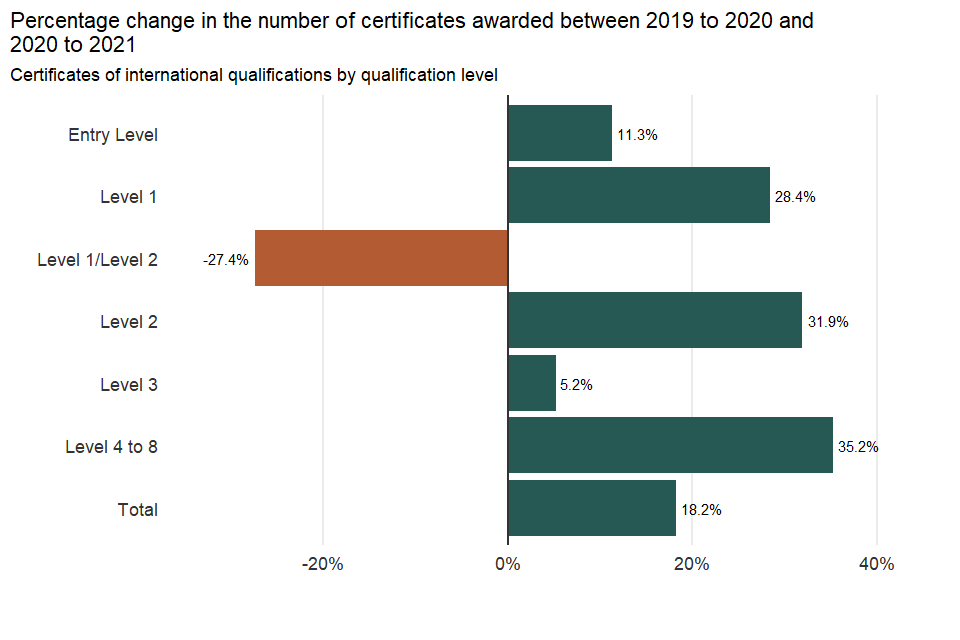
Percentage change in the number of certificates awarded by qualification level between 2019 to 2020 and 2020 to 2021
| Qualification level | Percentage change in the number of certificates awarded between 2019 to 2020 and 2020 to 2021 |
|---|---|
| Entry Level | 11.3% |
| Level 1 | 28.4% |
| Level 1/Level 2 | -27.4% |
| Level 2 | 31.9% |
| Level 3 | 5.2% |
| Level 4 to 8 | 35.2% |
| Total | 18.2% |
Level 1 regulated qualifications had the highest number of certificates issued outside the UK in the 2020 to 2021 academic year, accounting for 37.0% of the non-UK total.
Only Level 1/Level 2 regulated qualifications saw a decline (down by 57,600) in the number of certificates issued outside the UK in the 2020 to 2021 academic year compared to the 2019 to 2020 academic year. The highest rise in the number of non-UK certificates was among Level 1 regulated qualifications, up by 472,500, compared to the 2019 to 2020 academic year. The Level 4 to 8 regulated qualifications saw the highest proportional increase in the number of certificates issued outside the UK, up by 35.2%, compared to the previous year.
9.4 Awarding organisations with the highest number of certificates of regulated qualifications awarded outside the UK
| Awarding organisation | Number of certificates in 2019 to 2020 | Number of certificates in 2020 to 2021 |
|---|---|---|
| Cambridge Assessment English | 2,674,620 | 3,364,140 |
| International Baccalaureate Organisation | 1,069,895 | 1,076,275 |
| Pearson Education Ltd | 435,935 | 434,330 |
| Trinity College London | 137,635 | 175,025 |
| Associated Board of the Royal Schools of Music | 101,660 | 174,260 |
| Royal Academy of Dance | 38,510 | 76,685 |
| WSET Awards | 52,105 | 68,150 |
| LanguageCert | 21,075 | 61,970 |
| Learning Resource Network | 11,795 | 56,035 |
| NOCN | 6,095 | 26,135 |
| RSL Awards Ltd | 17,480 | 24,975 |
| VTCT | 13,345 | 24,465 |
| City and Guilds of London Institute | 21,615 | 22,115 |
| English Speaking Board (International) Ltd | 44,010 | 21,980 |
| AQA Education | 19,395 | 21,215 |
| Qualifi Ltd | 5,330 | 16,695 |
| Highfield Qualifications | 13,570 | 13,770 |
| University of West London | 8,035 | 13,595 |
| Association of Chartered Certified Accountants | 7,545 | 10,025 |
| AIM Qualifications | 11,945 | 8,085 |
| Other organisations | 174,060 | 85,215 |
| Total | 4,885,670 | 5,775,140 |
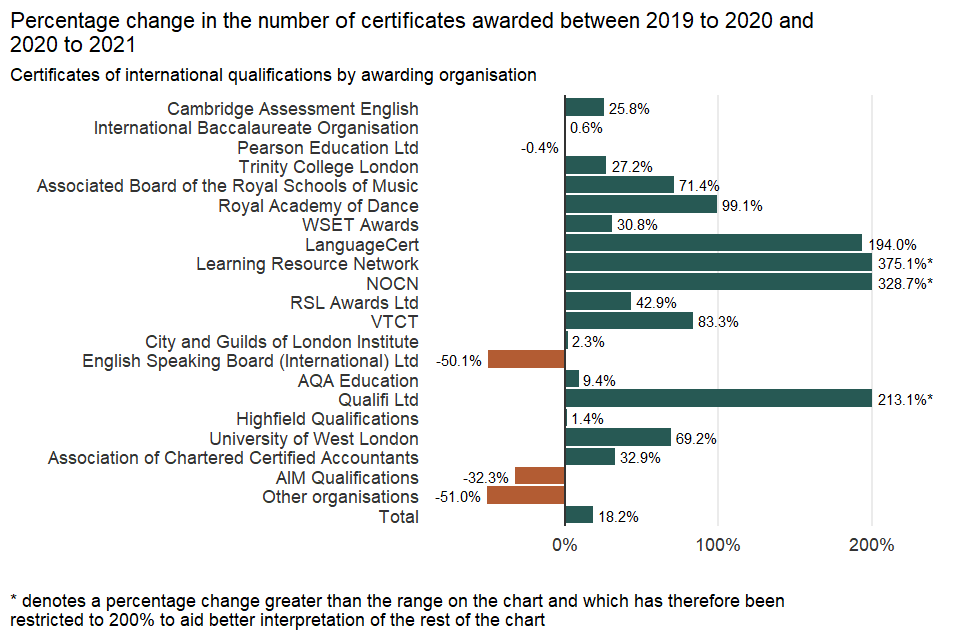
Percentage change in the number of certificates awarded by awarding organisation between 2019 to 2020 and 2020 to 2021
| Awarding organisation | Percentage change in the number of certificates awarded between 2019 to 2020 and 2020 to 2021 |
|---|---|
| Cambridge Assessment English | 25.8% |
| International Baccalaureate Organisation | 0.6% |
| Pearson Education Ltd | -0.4% |
| Trinity College London | 27.2% |
| Associated Board of the Royal Schools of Music | 71.4% |
| Royal Academy of Dance | 99.1% |
| WSET Awards | 30.8% |
| LanguageCert | 194.0% |
| Learning Resource Network | 375.1% |
| NOCN | 328.7% |
| RSL Awards Ltd | 42.9% |
| VTCT | 83.3% |
| City and Guilds of London Institute | 2.3% |
| English Speaking Board (International) Ltd | -50.1% |
| AQA Education | 9.4% |
| Qualifi Ltd | 213.1% |
| Highfield Qualifications | 1.4% |
| University of West London | 69.2% |
| Association of Chartered Certified Accountants | 32.9% |
| AIM Qualifications | -32.3% |
| Other organisations | -51.0% |
| Total | 18.2% |
The 20 awarding organisations that reported the highest volume of non-UK certificates of regulated qualifications in the 2020 to 2021 academic year awarded 98.5% of all regulated qualifications certificates issued outside the UK. NOCN and Qualifi Ltd are new to the top 20 this year.
Cambridge Assessment English has had the largest increase (up by 689,500) in certificates compared with the previous year, mainly due to increases in the number of certificates awarded for English for Speakers of Other Languages qualifications.
Learning Resource Network has had the largest percentage increase (up by 375.1%) in certificate numbers. The increase in the certificate numbers was also mainly due to increases in the number of certificates for English for Speakers of Other Languages qualifications.
Please note data for all awarding organisations is available in the accompanying data tables (Table 22).
10. User feedback
We welcome your feedback on our publications. Should you have any comments on this statistical release and how to improve it to meet your needs please contact us at data.analytics@ofqual.gov.uk.
Head of profession: Nadir Zanini