Chapter 9: Intermediate consumption
Updated 3 September 2026

© Crown copyright 2026
This publication is licensed under the terms of the Open Government Licence v3.0 except where otherwise stated. To view this licence, visit nationalarchives.gov.uk/doc/open-government-licence/version/3 or write to the Information Policy Team, The National Archives, Kew, London TW9 4DU, or email: psi@nationalarchives.gov.uk.
Where we have identified any third party copyright information you will need to obtain permission from the copyright holders concerned.
This publication is available at https://www.gov.uk/government/statistics/agriculture-in-the-united-kingdom-2025/chapter-9-intermediate-consumption
In this summary, all values are provided in current prices which is considered the most intuitive approach for comparisons over a short time period. It should be noted that these values have not been adjusted for inflation. For the current prices dataset please see Chapter 4: Accounts.
Summary
In 2025:
-
The total cost of intermediate consumption was £21.6 billion, an increase of £331 million (+1.6%) from 2024.
-
The value of animal feed decreased by £32 million (-0.4%) from 2024 to £7.1 billion.
-
The value of energy decreased by £41 million (-2.1%) from 2024 to £1.9 billion.
-
The value of fertilisers increased by £92 million (+5.5%) from 2024 to £1.8 billion.
Introduction
Chapter 4 provides more detailed information on input costs and gives a full breakdown of intermediate consumption.
Figure 9.2 presents the annual price of European Brent crude oil in current prices. Figures 9.3 and 9.4 present the value of energy and fertilisers respectively. These are presented in real terms, adjusted for inflation, which provides more meaningful comparisons over longer time periods. Comparisons over more recent years, as presented in Chapter 4, are presented at current prices, not adjusted for inflation, which is considered the most intuitive for comparisons over shorter time periods.
Inputs
Figure 9.1: Intermediate consumption (at current prices), 2020 to 2025 (£ billion)
Enquiries: farmaccounts@defra.gov.uk
| Year | Intermediate Consumption (£ billion) |
|---|---|
| 2020 | 16.9 |
| 2021 | 18.6 |
| 2022 | 21.7 |
| 2023 | 22.0 |
| 2024 | 21.3 |
| 2025 | 21.6 |
Source: Total Income from Farming in the UK
Download the full intermediate consumption dataset
Figure 9.1 shows the value of intermediate consumption from 2020 to 2025 in current prices. Since 2020, the average value of intermediate consumption is £20.4 billion, with the lowest value for £16.9 billion occurring in 2020 and the highest value of £22.0 billion occurring in 2023. The value for intermediate consumption increased by £331 million (+1.6%) from 2024.
Animal feed
Table 9.1: Animal feed purchases, 2023 to 2025 (thousand tonnes unless stated otherwise)
Enquiries: allan.howsam@defra.gov.uk
| 2023 | 2024 | 2025 | |
|---|---|---|---|
| Compounds: | |||
| Cattle | 4,977 | 5,261 | 5,651 |
| Calves | 263 | 279 | 294 |
| Pigs | 2,061 | 2,063 | 2,013 |
| Poultry | 4,667 | 4,742 | 4,641 |
| Sheep | 783 | 871 | 968 |
| Total compounds plus imports less exports | 12,780 | 13,346 | 13,691 |
| Straight concentrates | 6,356 | 6,796 | 7,808 |
| Non-concentrates | 525 | 525 | 525 |
| Inter/intra farm transfer | 10,476 | 9,767 | 9,438 |
| Total animal feed | 30,138 | 30,434 | 31,461 |
| Total value of animal feed (£ million) | 7,638 | 7,092 | 7,061 |
Notes:
-
Compounds poultry includes poultry feed produced by ‘retail’ compounders but excludes production from integrated poultry units which are included within the straight concentrates data.
-
‘Maize for stockfeed’ is included within the ‘inter/intra farm transfer’ category.
-
See Chapter 4: Accounts for a breakdown of the value of animal feed into compounds and straights.
Source: Total Income from Farming in the UK
Download the full intermediate consumption dataset
The cost of animal feed is the largest item of expenditure recorded in the aggregate agricultural accounts. The amount of feed purchased remained broadly level from 1993 to 2012 (around 25 million tonnes) before rising steadily since then to reach a peak of 31.1 million tonnes in 2018 before falling to 29.4 million tonnes in 2022. 2025 saw an increase of 3.4% compared to 2024, to 31.5 million tonnes, due to an increase in compound and purchased straight feed offsetting a decrease in inter-intra farm sales. Despite the broadly increased usage the value of animal feed used within the agricultural industry has closely followed trends in commodity prices, shaped by exchange rates and world prices.
The total value of all animal feed decreased by 0.4% between 2024 and 2025 to £7.1 billion. Total compound feed production increased by 2.6% to 13.7 million tonnes with increases in Sheep (+11%), Cattle (+7.4%) and Calves (+5.6%), whereas Pigs (-2.4%) and Poultry (-2.1%) decreased in 2025 compared to 2024. The pig and poultry sectors have encountered problems over the last few years due to a combination of high feed and energy costs, butchery capacity and disease risks, but cheaper feed costs in 2025 provided a measure of support. The cattle and sheep sectors saw benefits from higher beef, lamb and milk prices. Higher milk prices encouraged producers to increase output, which raised demand for feed. Tight forage supplies also led farmers to use more compound feed.
2025 saw the price of commodities fall for the third successive year after the summer 2022 peak, as markets have adjusted to the ongoing Russia / Ukraine conflict.
Defra June 2025 Survey results show the total number of poultry increased by 4.1% to 183 million birds in 2025. Broiler numbers increased by 7.6% to 121 million whilst the breeding and laying flock saw a decrease of 1.2% to 54 million. The total number of cattle and calves in the UK decreased by 1.3% to 9.3 million in June 2025. The breeding herd saw a decrease of 1.3% to 3.1 million. The total number of sheep and lambs decreased by 1.7% to 30.5 million. The female breeding flock fell by 0.7% to 14.8 million and lambs decreased by 2.9% to 14.8 million. The total number of pigs in the UK remained relatively stable at 4.7 million animals. Breeding pig numbers fell by 3.2% to 407 thousand animals, while fattening pigs rose by 0.9%.
Besides compound feed usage there was an increase of 15% in purchased straight concentrates and a 3.4% decrease in inter/intra farm sales.
Oil prices
Figure 9.2: Annual Europe Brent Spot Price, 2000 to 2025 (in $ per barrel)
Enquiries: farmaccounts@defra.gov.uk
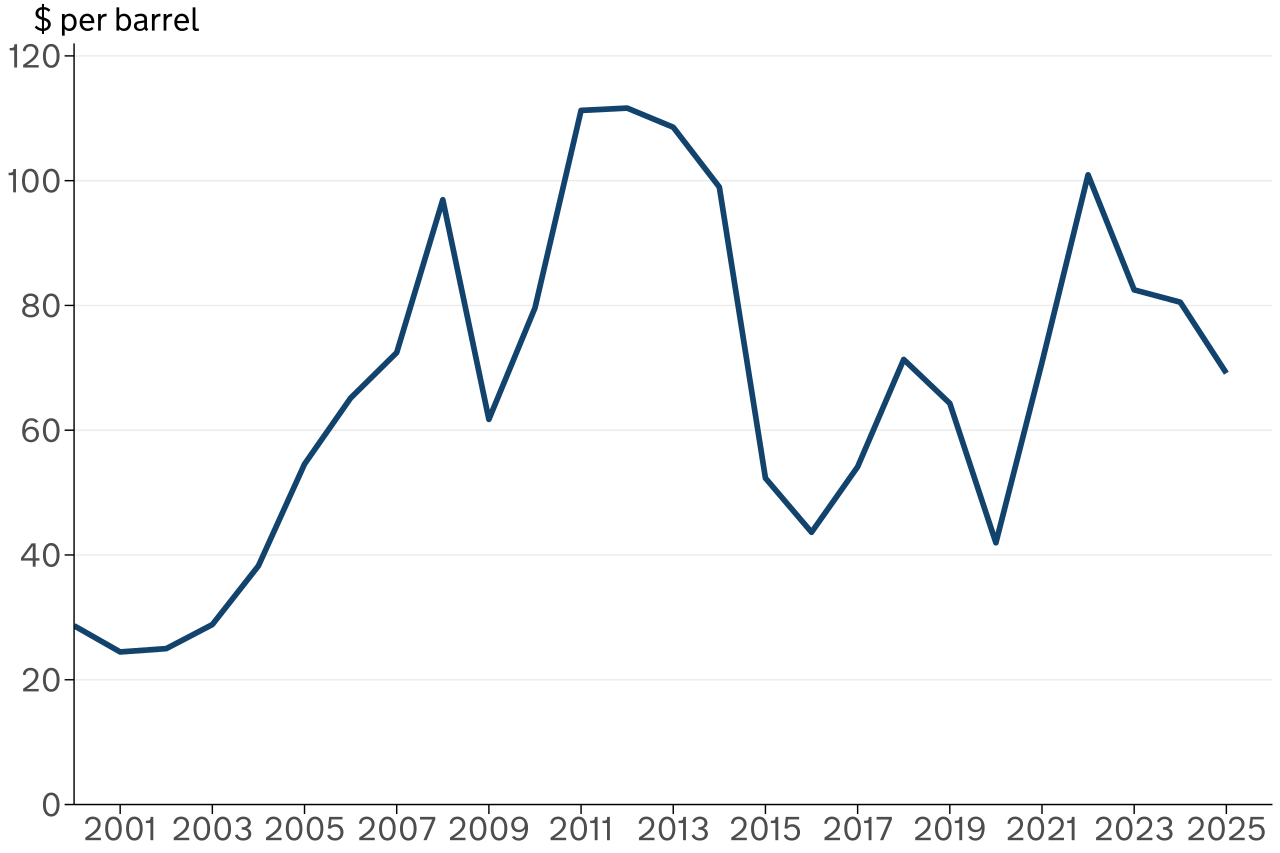
Text description for Figure 9.2: Figure 9.2 is a line chart showing the European Brent Spot Price from 2000 to 2025. Values are presented as $ per barrel at current prices.
Source: US Energy Information Administration
Download the full intermediate consumption dataset
Some inputs, such as fuel, electricity and fertiliser, link closely to oil prices. Changes in oil prices affect the cost of running machinery and the cost of heating, lighting and crop drying, as well as fertiliser prices.
Figure 9.2 shows trends in annual Europe Brent crude oil prices since 2000 in current prices. Oil prices rose strongly between 2002 and 2008, then fell sharply in 2009 during the global financial crisis. Prices remained high but stable between 2011 and 2014, reaching a peak of $112 per barrel in 2012.
In 2015, global supply exceeded demand and prices fell quickly, dropping to $44 per barrel in 2016. Prices increased in 2017 and 2018, reaching $71 per barrel.
In 2020, COVID-19 restrictions reduced global demand for oil, particularly in transport. Prices fell to $42 per barrel, the lowest level since 2004. Prices increased to $71 per barrel in 2021 as demand recovered faster than supply.
In 2022, prices rose to $101 per barrel following disruption to global supply after Russia’s invasion of Ukraine. In 2023, prices fell to around $83 per barrel as weaker demand offset supply cuts.
In 2024, OPEC+ supply cuts supported prices, which remained relatively stable. The annual average price fell to around $81 per barrel, reflecting high supply outside OPEC+ and subdued demand.
In 2025, prices fell by a further 14.1% to an average of around $69 per barrel. Global oil supply exceeded demand during the year, which increased stocks and placed downward pressure on prices. Prices declined through the year, from around $79 per barrel in January to around $63 per barrel in December.
For more information on crude oil prices see this article: EIA
Energy
Figure 9.3: Value of energy in real terms, 2000 to 2025 (£ million)
Enquiries: farmaccounts@defra.gov.uk
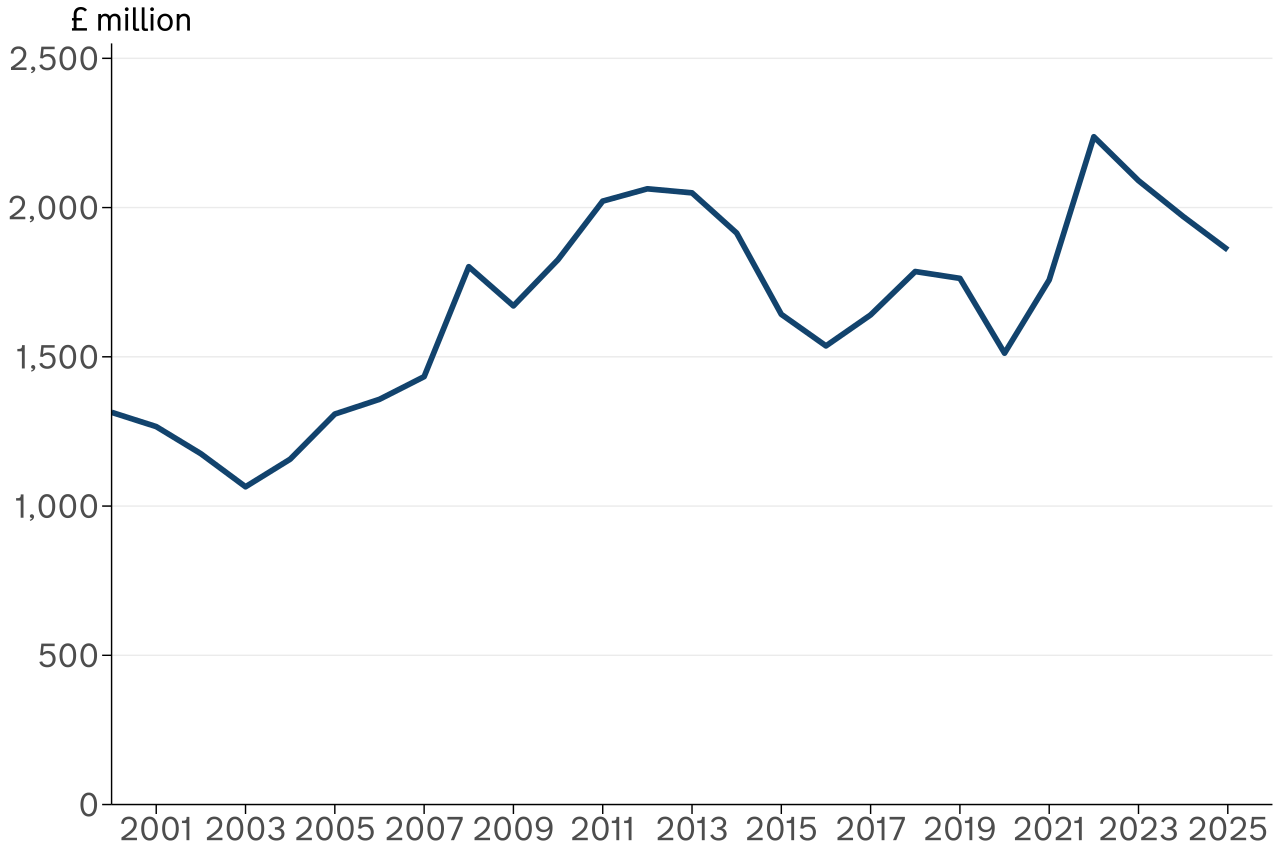
Text description for Figure 9.3: Figure 9.3 is a line chart showing the value of energy in real terms from 2000 to 2025. Values are presented in millions.
Source: Total Income from Farming in the UK
Download the full intermediate consumption dataset
Over the long term the cost of energy has followed a similar pattern to that of the crude oil price (see Figure 9.2). Energy costs generally increased during the 2000s, reaching a peak in 2012 before falling again. From 2015-2021 energy costs fluctuated between £1.5 billion and £1.7 billion, before rising sharply to £2.2 billion in 2022. The cost of energy fell between 2023 and 2024 driven by a fall in the value of motor and machinery fuels.
In 2025 energy costs fell by a further 2.1% in current prices to £1.9 billion, driven by a fall in the values of motor and machinery fuels (-3.8%) offsetting a very small increase in electricity and fuels for heating (+0.1%). The cost of motor and machinery fuels in 2025 fell largely as a result of the substantial reduction in oil price in 2025. This offset the 1.8% increase in volumes of fuels used driven by increases in UK areas of cereals (+1.6%), potatoes (+7.2%) and vegetables grown outdoors (+6.7%) at June 2025.
For the full current prices and real terms dataset see Chapter 4: Accounts
Fertilisers
Figure 9.4: Fertilisers, 2000 to 2025 (in real terms)
Enquiries: farmaccounts@defra.gov.uk
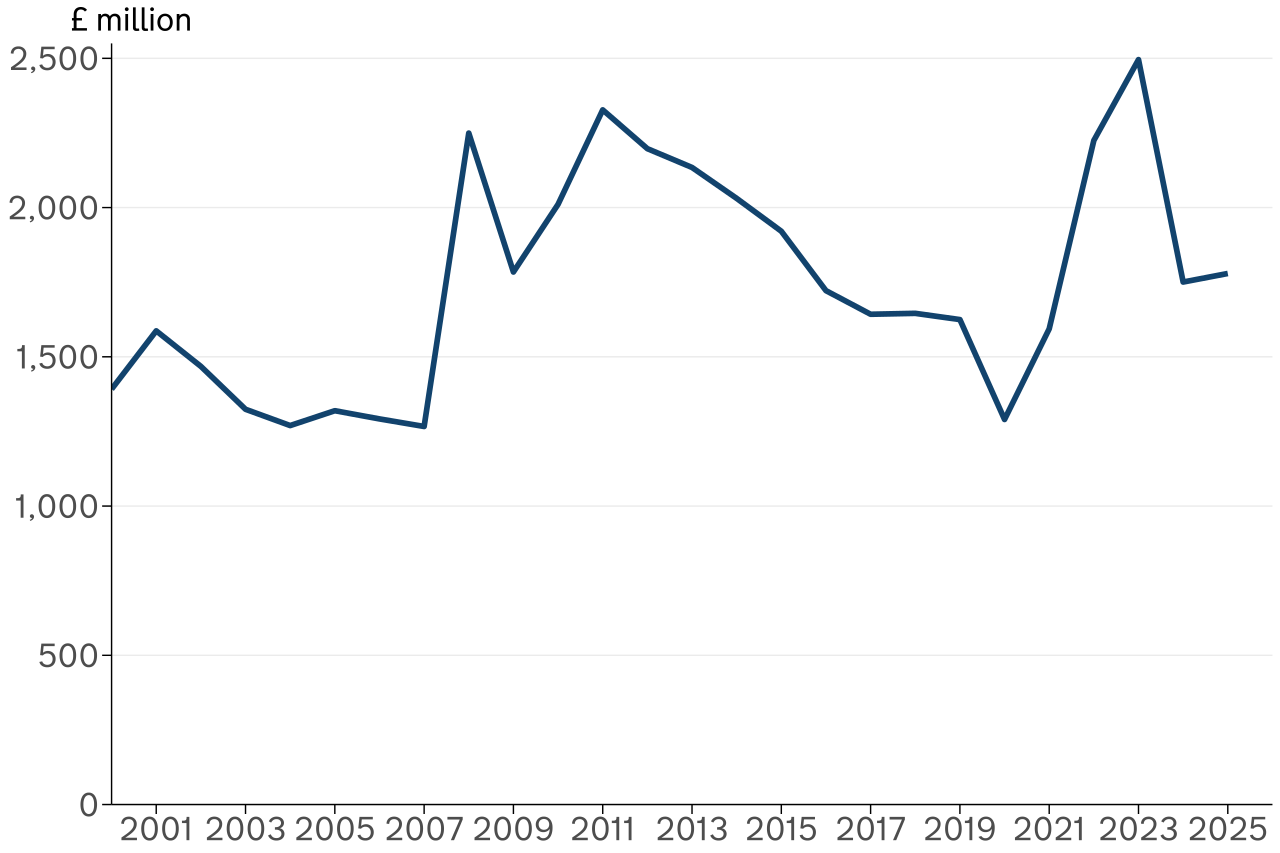
Text description for Figure 9.4: Figure 9.4 is a line chart showing the value of fertilisers in real terms from 2000 to 2024. Values are presented in millions.
Source: Total Income from Farming in the UK
Download the full intermediate consumption dataset
Natural gas is used in the process of manufacturing nitrogen fertilisers and its price is closely linked to the price of oil. Consequently, if the price of oil rises so does the cost of producing fertiliser.
Between 2000 and 2007 fertiliser costs were largely stable, before increasing sharply in 2008 and remaining high until peaking at £2.3 billion in 2011. Between 2012 and 2019 fertiliser costs steadily declined, with a sharp drop in 2020 resulting from reductions in both prices and the volume of fertilisers used. Fertiliser costs began to increase in 2021 before a sharp rise in 2022 as a result of steep rises in oil prices which drove up the cost of fertiliser production. Prices remained high into the following year with 2023 seeing the highest expenditure on fertilisers, in real terms, since 1987 at £2.5 billion. In 2024, the value of fertilisers decreased by £745 million (-30%) from 2023, in real terms to £1.8 billion. This was driven by a decrease in the cost of gas, a key input for fertiliser production, in comparison to the high prices seen in 2022 and 2023.
In 2025, the value of fertilisers saw an increase of £92 million (+5.5%) from 2024, to £1.8 billion in current prices. After two years of large fluctuations, this small increase in fertiliser value is attributed to farmers adjusting buying patterns in response to an 11% increase in the annual fertiliser price index. However, it should be noted that many farmers forward-buy fertiliser on contract, and purchasing patterns are not necessarily indicative of usage patterns in the same year.
Other input costs
The cost of seeds in 2025 was £1.0 billion, an increase of £22 million (+2.2%) from 2024, in current prices. Seed usage is driven by a combination of crop area, time of drilling, and drilling conditions. In 2025, a 0.6% decrease in the annual price index for seeds was offset by a 2.9% increase in the volume of seeds purchased. This volume increase was driven by increases in the UK areas of arable crops at June such as wheat (+9.1%), oats (+8.8%) and potatoes (+7.2%), as well as vegetables grown outdoors (+6.7%).
The cost of plant protection products in 2025 was £925 million, a decrease of £39 million (-4.0%) from 2024, in current prices. This decrease was largely driven by a 6.5% reduction in annual price index offsetting a 2.7% increase in volumes.
Revisions
Details of the revisions can be found in Chapter 4: Accounts