Chapter 4: Accounts
Updated 3 September 2026

© Crown copyright 2026
This publication is licensed under the terms of the Open Government Licence v3.0 except where otherwise stated. To view this licence, visit nationalarchives.gov.uk/doc/open-government-licence/version/3 or write to the Information Policy Team, The National Archives, Kew, London TW9 4DU, or email: psi@nationalarchives.gov.uk.
Where we have identified any third party copyright information you will need to obtain permission from the copyright holders concerned.
This publication is available at https://www.gov.uk/government/statistics/agriculture-in-the-united-kingdom-2025/chapter-4-accounts
Summary
In this section, unless otherwise stated, all values are provided in current prices which is considered the most intuitive approach for comparisons over a short time period. It should be noted that these values have not been adjusted for inflation. The alternative to current prices is real terms, where prices are adjusted for inflation to allow for more meaningful comparisons over a longer time period.
-
UK Total Income from Farming (TIFF) in 2025 was £8.4 billion, an increase of £1.4 billion (+21%) from 2024. After a period of relative stabilisation in input costs in 2025, the large increase in TIFF was primarily driven by higher commodity prices in the beef and dairy sectors, which led to a substantial rise in the value of outputs.
-
Total livestock output in 2025 increased by £2.1 billion (+10%) from 2024, to £22.2 billion, with large increases for beef (+23%) and milk (+12%) driven by high commodity prices.
-
In 2025, total crop output decreased by £0.4 billion (-3.1%) from 2024, to £11.4 billion, driven by falls in the values of barley (-17%), sugar beet (-22%) and potatoes (-5.4%). All three crops saw substantial price drops, despite variable production and quality.
-
Intermediate consumption increased by £0.3 billion (+1.6%) from 2024, to £21.6 billion in 2025. The small overall increase was driven by increases in the values of other goods and services, fertilisers and total maintenance.
-
In 2025, agriculture’s contribution to the UK economy (Gross Value Added at basic prices) was £15.9 billion (0.6% of GVA). This constitutes an increase of £1.4 billion (+10%) in GVA compared to 2024.
-
Despite recent volatility in TIFF, the longer-term trend is of overall improvement, with TIFF more than tripling in real terms between 2000 and 2025. However, TIFF in 2024 remains 37% lower in real terms than the series high of £13.4 billion seen in 1973.
Introduction
This chapter presents the UK aggregate agricultural accounts, also published separately at Total Income from Farming in the UK. These accounts conform to internationally agreed accounting principles required by the United Kingdom’s Office for National Statistics.
Total Income from Farming is the total profit from all UK farming businesses on a calendar year basis. It measures the return to all agricultural entrepreneurs for their management, inputs, labour and capital invested. The term ‘income’ used throughout this chapter refers to TIFF. For differences between TIFF and Farm Business Income statistics presented in Chapter 3, see Table 3.3.
When comparing more recent years, values are presented at current prices (not adjusted for inflation). For long term trends in TIFF, values are presented in real terms. This means the figures have been adjusted to account for inflation, which allows more meaningful comparisons between years over the longer term.
The value of TIFF is subject to a degree of revision in future years when additional data becomes available. In this release, the estimate of TIFF for 2024, published in June 2024, has been revised downwards by £699 million (-9.1%). This is primarily due to an increase in the value of inputs and costs as a result of the replacement of industry estimates with survey data.
TIFF in recent years
In this section, all values are provided in current prices which is considered the most intuitive approach for comparisons over a short time period. It should be noted that these values have not been adjusted for inflation.
Figure 4.1: Total Income from Farming for the United Kingdom: 2020 to 2025 at current prices (£ billion)
Enquiries: farmaccounts@defra.gov.uk
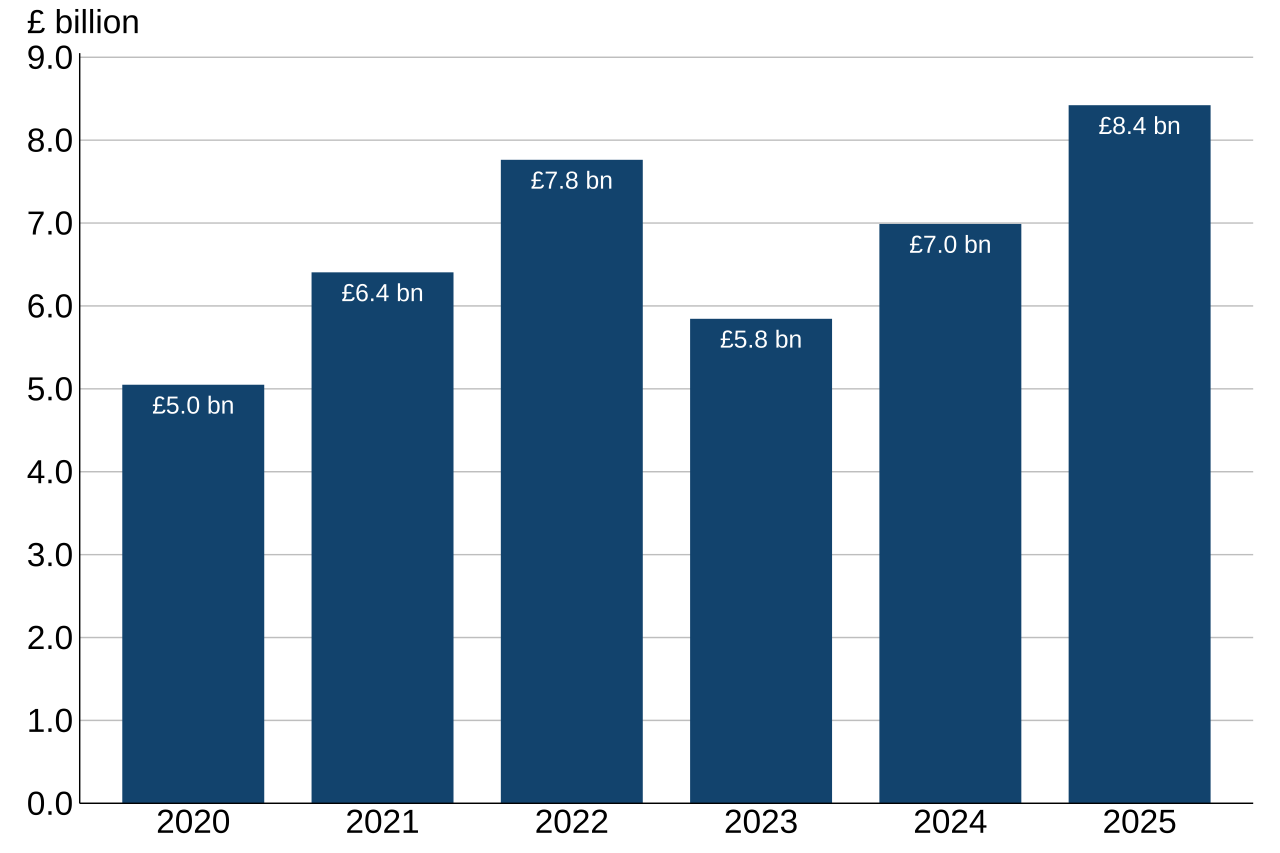
Text description of Figure 4.1: Figure 4.1 shows the value of TIFF from 2020 to 2025 at current prices. TIFF is presented in billions.
Source: Total Income from Farming in the UK
Download the full accounts dataset
Since 2020, the average value of TIFF has been £6.7 billion, with the lowest value of £5.0 billion occurring in 2020, and the highest value of £8.4 billion occurring in 2025. In 2025, the value of TIFF increased by £1.4 billion (+21%), from £7.0 billion in 2024.
Outputs and subsidies
In this section, all values are provided in current prices which is considered the most intuitive approach for comparisons over a short time period. It should be noted that these values have not been adjusted for inflation.
There may be small discrepancies between numbers presented in this section and those in Chapter 7: Crops and Chapter 8: Livestock. This is due to data revisions since the production of the 2025 UK Aggregate Agricultural Accounts.
Overview
Figure 4.2: Summary of outputs and subsidies, 2020 to 2025 at current prices (£ million)
Enquiries: farmaccounts@defra.gov.uk
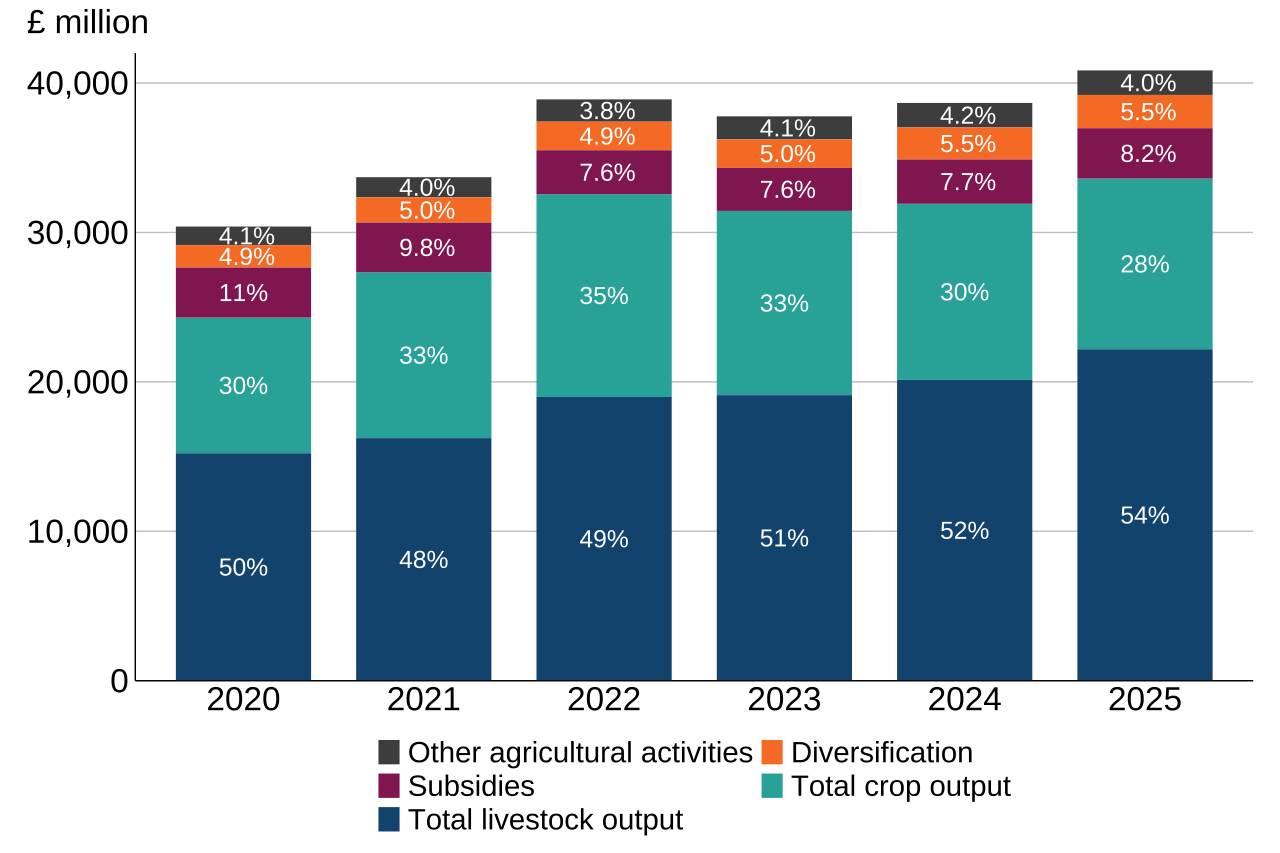
Text description of Figure 4.2: Figure 4.2 shows the value of all outputs and subsidies from 2020 to 2025. Values are presented in millions and %. Outputs and subsidies represent all financial incomes to farmers. Total livestock output is consistently the largest contributor to the value of all outputs and subsidies.
Source: Total Income from Farming in the UK
Download the full accounts dataset
In 2025, total livestock output was £22.2 billion, an increase of £2.1 billion (+10%) on 2024. The second largest contribution to the value of outputs and subsidies in 2025 was total crop output at £11.4 billion, a decrease of £364 million (-3.1%) on 2024. The remaining incomes to farmers in 2025 were subsidies (£3.4 billion), diversification (£2.2 billion) and other agricultural activities (£1.6 billion).
Total livestock output
Figure 4.3: Main contributions to total livestock output, 2024 to 2025 at current prices (£ million)
Enquiries: farmaccounts@defra.gov.uk
| Item | 2024 | 2025 |
|---|---|---|
| Milk | 6,295 | 7,049 |
| Beef | 4,139 | 5,084 |
| Poultry | 3,348 | 3,367 |
| Mutton and lamb | 1,763 | 1,867 |
| Pig meat | 1,815 | 1,828 |
| Eggs | 1,360 | 1,456 |
Source: Total Income from Farming in the UK
Download the full accounts dataset
The largest contribution to total livestock output in 2025 was milk with a value of £7.0 billion, an increase of 775 million (+12%) from 2024. This was the second largest value increase in total livestock output and was driven by a combination of high prices and high production volumes. Elevated prices continued from the end of 2024 due to high commodity values for butter and cream. This, combined with low feed wheat prices, encouraged a 5.0% increase in domestic production from 2024, to 15.8 billion litres in 2025. Following a fall in global dairy commodity values, UK farmgate milk prices began to fall in the last 2 months of 2025 but remained historically high. The overall 2025 UK farmgate milk price increased by 6.8% compared to 2024, at 44 pence per litre.
In 2025, the largest value increase in total livestock output was beef with an increase of £945 million (+23%) from 2024. This increase was driven by reduced production and sustained demand, resulting in elevated prices throughout 2025. Home-killed beef production decreased by 3.4% in 2025 to 898 thousand tonnes, driven by a 4.3% decline in prime cattle slaughter numbers, which was partially moderated by a 1.0% increase in dressed carcase weight. The tightening in supply sharply increased finished deadweight prime cattle prices, which reached a historical high annual price of 647 pence per kilogram in 2025, an increase of 30% on 2024.
Total crop output
Figure 4.4: Main contributions to total crop output, 2024 to 2025 at current prices (£ million)
Enquiries: farmaccounts@defra.gov.uk
| Item | 2024 | 2025 |
|---|---|---|
| Wheat | 2,132 | 2,143 |
| Fresh vegetables | 2,109 | 2,117 |
| Plants and flowers | 1,649 | 1,616 |
| Potatoes | 1,546 | 1,463 |
| Fruit | 1,083 | 1,137 |
| Barley | 1,197 | 997 |
| Other crop products | 693 | 665 |
| Other industrial crops | 554 | 445 |
| Oilseed rape | 339 | 408 |
| Forage plants | 242 | 247 |
Notes:
-
Potato prices and yield information were previously obtained from the AHDB who stopped producing data midway through 2021. From 2022 we have estimated yields based on input from sector representatives, devolved administrations and coverage of the sector in the farming press. For prices we made use of the Northern Ireland published potato prices.
-
‘Other industrial crops’ includes the value of protein crops and sugar beet.
Source: Total Income from Farming in the UK
Download the full accounts dataset
The largest contribution to total crop output in 2025 was wheat with a value of £2.1 billion. This small increase was driven by an increase in production, which slightly offset decreases in prices. Following a substantial 20% decrease in UK production in 2024, 2025 saw a modest recovery, with a 7.3% increase in harvest wheat volumes to 12 million tonnes. The area of wheat increased by 9.1%, offsetting a 1.7% decrease in yields due to a hot and dry spring and summer. Plentiful global wheat supplies and reduced export demand led to reductions in domestic prices from 2024, with breadmaking wheat price falling by 17% and feed wheat price falling by 5.0% in 2025.
In 2025, the largest value decrease in a crop item was barley, with a decrease of £201 million (-17%) from 2024 to £997 million. This decrease was a result of falls in both production and prices, with overall barley value reaching its lowest level since 2017. Barley production decreased by 10%, to 6.4 million tonnes, with a 9.6% decrease in planted area to 1.1 million hectares and an overall 0.7% decrease in yields due to the impact of the hot and dry weather on spring barley yields. Similarly to wheat, barley prices decreased in 2025 due to increased supplies in the global market, with premium malting barley price falling by 7.8% and feed barley price falling by 2.4%.
Smaller decreases were seen in the values of potatoes and sugar beet. The value of potatoes decreased by £83 million (-5.4%) to £1.5 billion in 2025. With exceptionally high prices in 2024 due to a difficult harvest, there was a 31% fall in the annual potato price index with ample supplies available on the market. The value of sugar beet fell by £80 million (-22%) to £286 million, with poor planting conditions and pest pressures driving a 10% decrease in area and subsequent fall in production.
Other outputs and subsidies
Table 4.1: Breakdown of other incomes and subsidies, 2024 to 2025 at current prices (£ million)
Enquiries: farmaccounts@defra.gov.uk
| Item | 2024 | 2025 |
|---|---|---|
| Subsidies not linked to production | 2,915 | 3,319 |
| Diversification | 2,143 | 2,229 |
| Other agricultural activities | 1,640 | 1,641 |
| Subsidies linked to production | 47 | 47 |
Notes:
-
‘Subsidies not linked to production’ includes all subsidies not directly linked to production, including delinked payments and agri-environment schemes, including the Countryside Stewardship Scheme and Sustainable Farming Incentive.
-
Subsidies captured in the accounts do not include capital grants to farmers. This, alongside more minor differences in reporting scope, means that payments totals reported in this chapter will not align with those in Chapter 10: Agricultural Support Payments, which includes all payments reported as part of the Agricultural Policy Monitoring and Evaluation Report that is submitted to OECD.
-
To improve clarity, the item ‘Inseparable non-agricultural activities’ has been renamed ‘Diversification’. This covers all non-farming income which is generated on farms, i.e. tourism from renting out cottages, energy generation, and farm shops and cafes.
Source: Total Income from Farming in the UK
Download the full accounts dataset
In 2025, the value of subsidies not linked to production increased by £404 million (+14%) from 2024, with an increase in agri-environment scheme payments offsetting a reduction in Basic Payment Scheme (BPS) and de-linked payments. However, it should be noted that this is not necessarily indicative of changes in total payments to farmers, because subsidies not linked to production are a subset of total agricultural payments and exclude capital payments and certain grants. Additionally, the shift away from BPS and de-linked payments towards agri-environment schemes will mean farmers face increased associated costs, and so an increase in payments does not necessarily indicate an increase in overall income from subsidy schemes.
Inputs and costs
In this section, all values are provided in current prices which is considered the most intuitive approach for comparisons over a short time period. It should be noted that these values have not been adjusted for inflation.
Overview
Figure 4.5: Summary of inputs and costs, 2020 to 2025 at current prices (£ million)
Enquiries: farmaccounts@defra.gov.uk
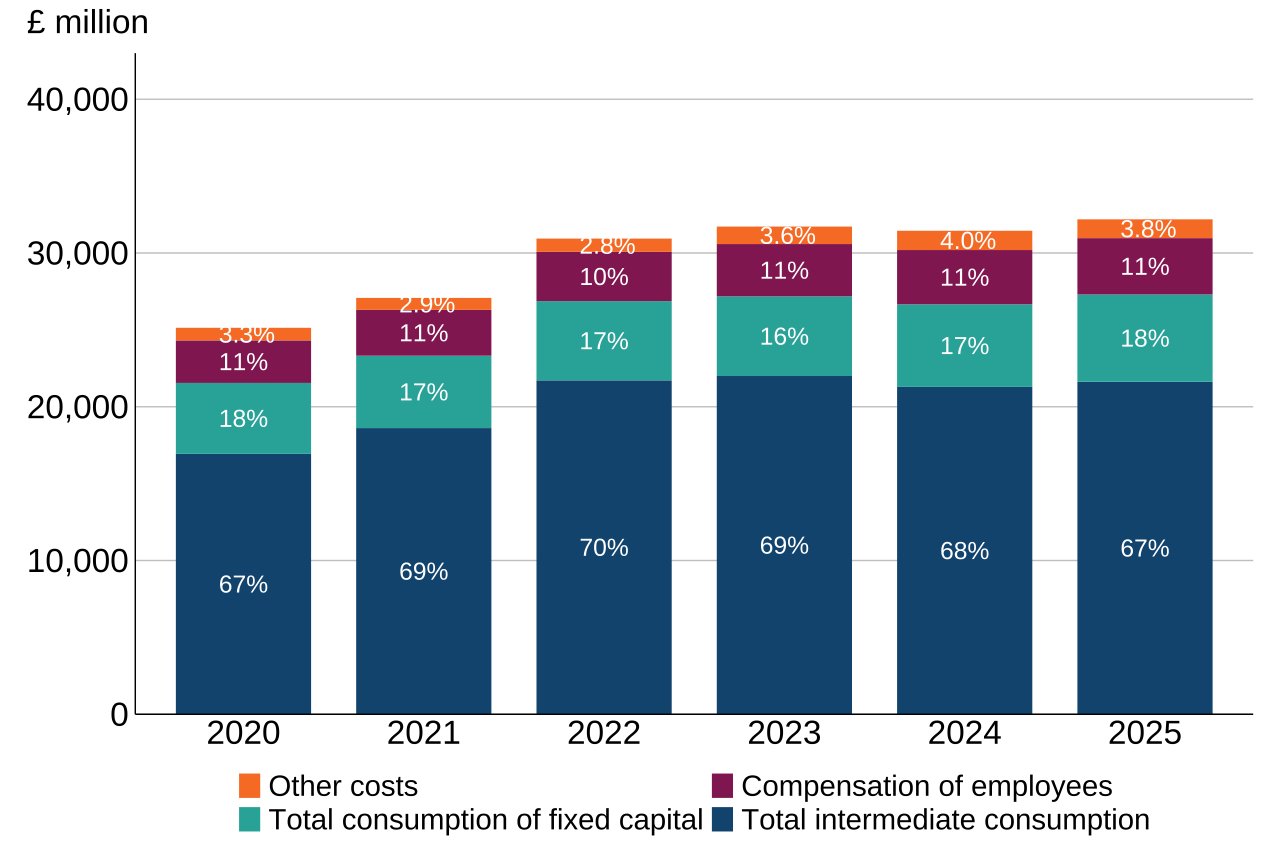
Text description of Figure 4.5: Figure 4.5 shows the make-up of all inputs and costs from 2020 to 2025. Values are presented in millions and %.
Source: Total Income from Farming in the UK
Download the full accounts dataset
Inputs and costs represent all money paid out by farmers during a calendar year. The proportions of items that make up inputs and costs have been relatively consistent for the last 6 years. The largest cost facing farmers is intermediate consumption. In 2025 the value of intermediate consumption was £21.6 billion, an increase of £331 million (+1.6%) on 2024. The remaining costs in 2025 were total consumption of fixed capital (£5.7 billion), compensation of employees (£3.7 billion) and other costs (£1.2 billion).
Inputs: Intermediate consumption
Intermediate consumption represents items that are used up during the production of farm outputs. The accounts are set up in a way to provide a picture of the agriculture industry in an annual year in terms of money spent and money received by farming businesses. For intermediate consumption, we rely on data from the Farm Business Survey on expenditure. However, this data is only available two years in arrears and so our initial estimate each year is based on information from industry experts, which is then replaced with Farm Business Survey data the following year, resulting in revisions to the intermediate consumption estimates. See Revisions section for details.
Figure 4.6: Main contributions to intermediate consumption, 2024 to 2025 at current prices (£ million)
Enquiries: farmaccounts@defra.gov.uk
| Item | 2024 | 2025 |
|---|---|---|
| Animal feed: compounds | 4,415 | 4,362 |
| Other goods and services | 4,040 | 4,227 |
| Total maintenance | 2,229 | 2,315 |
| Animal feed: straights | 1,806 | 1,908 |
| Fertilisers | 1,687 | 1,779 |
| Agricultural services | 1,640 | 1,641 |
| Motor and machinery fuels | 1,088 | 1,047 |
| Seeds | 985 | 1,007 |
| Plant protection products | 964 | 925 |
| Electricity and fuels for heating | 811 | 812 |
| Animal feed: other | 871 | 791 |
| Veterinary expenses | 566 | 598 |
Notes:
-
Animal feed: other represents feed produced and used on farm or purchased from other farms.
-
Other goods and services includes costs such as specific livestock and crops costs, water rates, insurance, costs associated with specialist contractors, professional fees and banking fees.
Source: Total Income from Farming in the UK
Download the full accounts dataset
The largest contribution to intermediate consumption was compound animal feed with a value of £4.4 billion, a decrease of £53 million (-1.2%) from 2024. GB compound feed production increased by 221 kilotonnes (+2.0%) from 2024, however this was offset by decreases in compound feed prices. Prices for cattle and calf feed decreased by 3.8%, pig feed by 2.7%, sheep feed by 3.4% and poultry feed by 4.0%. Conversely, straights animal feed increased in value by £102 million (+5.6%) in 2025 to £1.9 billion, with a large increase in overall GB production (+15%) outweighing reductions in crop commodity prices.
In 2025, the largest value increase in intermediate consumption was from other goods and services which increased by £187 million (+4.6%) to £4.2 billion. Other goods and services includes costs such as specific livestock and crops costs, water rates, insurance, costs associated with specialist contractors, professional fees and banking fees. The annual price index for other goods and services increased by 3.3% in 2025 due to a large increase in water prices driven by a rise in water tariff prices and limited supplies. Water usage also increased with the hot and dry weather over the spring and summer causing drought conditions in many regions of the UK. There were increases seen in the value of other livestock and crops costs associated with cleaning, bedding and general costs associated with contracting. Professional and bank fees also increased due to higher wages, regulatory changes and increased borrowing costs.
Other inputs and costs
Table 4.2: Breakdown of other inputs and costs, 2024 to 2025 at current prices (£ million)
Enquiries: farmaccounts@defra.gov.uk
| Item | 2024 | 2025 |
|---|---|---|
| Total consumption of fixed capital | 5,370 | 5,679 |
| Equipment consumption of fixed capital | 2,637 | 2,712 |
| Livestock consumption of fixed capital | 1,436 | 1,638 |
| Buildings consumption of fixed capital | 1,297 | 1,329 |
| Other taxes on production | 115 | 116 |
| Compensation of employees | 3,530 | 3,664 |
| Rent | 547 | 539 |
| Interest | 821 | 799 |
Source: Total Income from Farming in the UK
Download the full accounts dataset
Long term trends in TIFF
Values in this section are expressed in real terms at 2025 prices. The figures have been adjusted to account for inflation, which allows more meaningful comparisons between years over the longer term.
Figure 4.7: Long term trends in TIFF, 2000 to 2025 in real terms (£ billion)
Enquiries: farmaccounts@defra.gov.uk
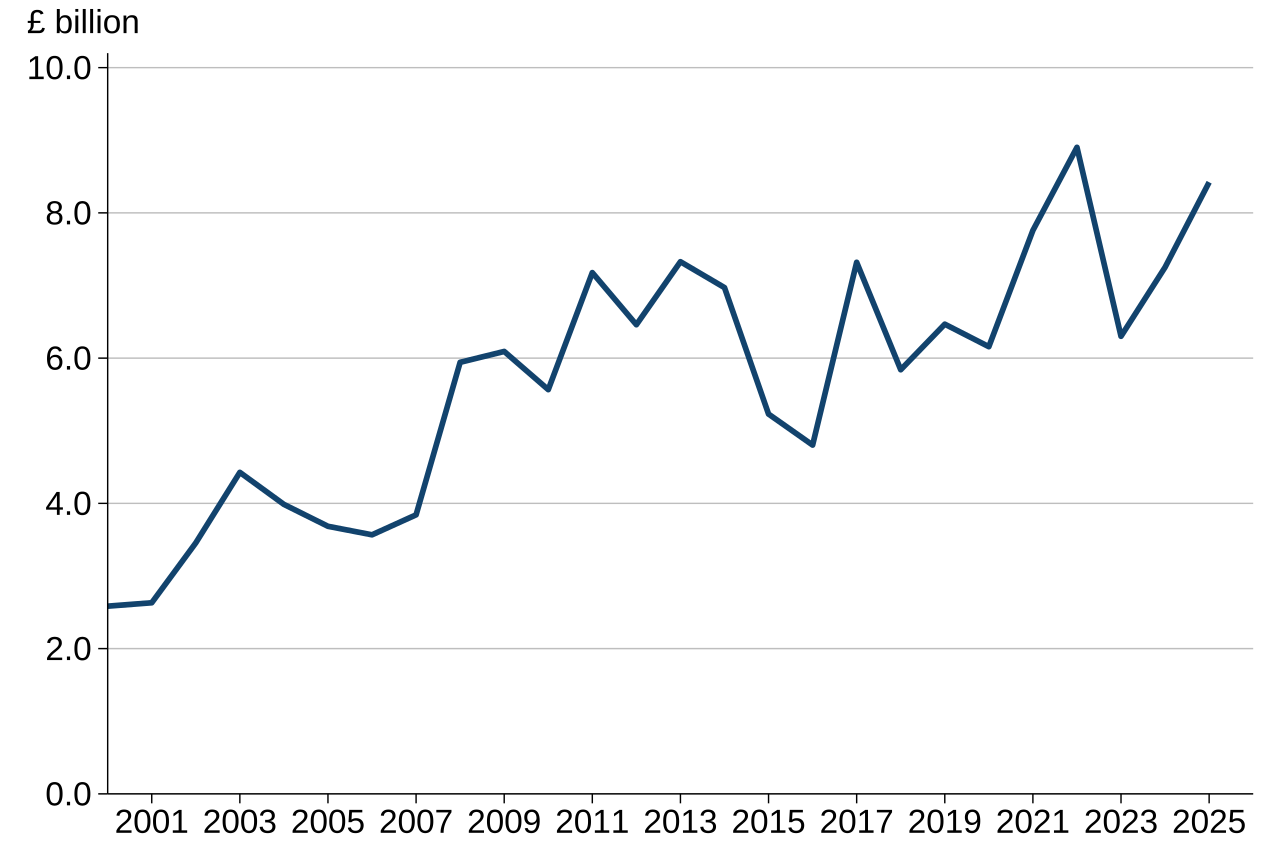
Text description of Figure 4.7: Figure 4.7 shows the long term trend in TIFF from 2000 to 2025. TIFF is presented in billions.
Source: Total Income from Farming in the UK
Download the full accounts dataset
Table 4.3: Headline figures 2020 to 2025 in real terms (£ billion)
Enquiries: farmaccounts@defra.gov.uk
| Item | 2020 | 2021 | 2022 | 2023 | 2024 | 2025 |
|---|---|---|---|---|---|---|
| Total crop output | 11.1 | 13.5 | 15.6 | 13.3 | 12.2 | 11.4 |
| Total livestock output | 18.6 | 19.7 | 21.8 | 20.6 | 20.9 | 22.2 |
| Total intermediate consumption | 20.7 | 22.5 | 24.9 | 23.7 | 22.1 | 21.6 |
| Total Income from Farming | 6.2 | 7.8 | 8.9 | 6.3 | 7.3 | 8.4 |
Source: Total Income from Farming in the UK
Download the full accounts dataset
Overall, TIFF has increased in real terms in recent decades, despite some large year-on-year fluctuations, and has more than tripled since 2000.
A notable dip occurred in 2015 and 2016, driven by a strong pound in 2015, a poor 2016 harvest and low commodity prices throughout. However, in 2017, TIFF reached the highest point for 20 years as a result of a favourable combination of a weaker pound, strong commodity prices and high levels of production.
Following lower values in 2018 to 2020, 2021 saw a sharp increase (+26%) in TIFF, as a result of an inflation rate of less than 0.1% and favourable weather conditions that led to an increase in production, particularly for crops. 2022 saw the largest value for TIFF, in real terms, since 1995 and the second highest in the last 40 years. This was driven by good yields across most crops and substantial price increases in wheat, barley, oilseed rape and milk, which more than offset price rises for inputs as a result of a sharp increase in crude oil prices following the Russian invasion of Ukraine.
In 2023, TIFF fell by 29% in real terms due to the increased value of inputs, particularly fertilisers, due to continued elevation in oil and gas prices, as gas is a key input for fertiliser production. Additionally, a decreased cereal harvest due to poor weather led to a decrease in crop output value, resulting in a substantial reduction in TIFF.
In 2024, a relatively poor year for crops was offset by a strong year for livestock due to increased demand and high commodity prices across all livestock categories except poultry and pigs. The resulting increase in output value, coupled with a decrease in intermediate consumption due to reductions in energy and fuel costs, led to a 15% increase in TIFF.
In 2025 the majority of livestock items increased in value, with large rises in the values of beef (+18%) and milk (+7.9%) due to historically high commodity prices. The 1.2% increase in output value at basic prices along with a 2.1% decrease in intermediate consumption, produced an increase in TIFF of £1.2 billion (+16%) in real terms from 2024, to £8.4 billion in 2025.
Balance sheet for the United Kingdom agricultural industry
Table 4.4: Balance sheet, 2022 to 2025 at current prices (£ million)
| Item | 2022 | 2023 | 2024 | 2025 |
|---|---|---|---|---|
| Total fixed assets | 332,958 | 374,402 | 400,676 | 393,389 |
| Total current assets | 19,555 | 18,104 | 18,553 | 19,834 |
| Total assets | 352,513 | 392,506 | 419,229 | 413,223 |
| Total long and medium term liabilities | 16,332 | 17,057 | 16,713 | 17,106 |
| Total short term liabilities | 6,175 | 6,570 | 6,458 | 6,670 |
| Total liabilities | 22,507 | 23,627 | 23,171 | 23,776 |
| Net worth | 330,007 | 368,880 | 396,058 | 389,447 |
Notes:
- Balance sheet as at December each year.
Source: Total Income from Farming in the UK
Download the full accounts dataset
Table 4.4 presents the agricultural balance sheet which values the assets and liabilities for agriculture at the end of each calendar year and estimates the net worth of the industry. Overall net worth is estimated to have been £389.4 billion in 2025, a decrease of £6.6 billion (-1.7%) on 2024. This was the result of a decrease in total assets of 1.4% and an increase in total liabilities of 2.6%. Land is the largest fixed asset in the agricultural industry with a value of £336.6 billion in 2025, a decrease of 2.6% on 2024.
Table 4.5: Balance sheet, 2022 to 2025 in real terms (£ million)
| Item | 2022 | 2023 | 2024 | 2025 |
|---|---|---|---|---|
| Total assets | 404,265 | 423,122 | 434,965 | 413,223 |
| Total liabilities | 25,811 | 25,469 | 24,041 | 23,776 |
| Net worth | 378,454 | 397,652 | 410,924 | 389,447 |
Source: Total Income from Farming in the UK
Download the full accounts dataset
In real terms at 2025 prices, net worth decreased by 5.2% from 2024, total assets decreased by 5.0% and total liabilities decreased by 1.1%.
About these statistics
Revisions
Table 4.6: Revisions in total outputs, inputs and TIFF at current prices (£ million)
| Item | Previous estimate for 2024 (published June 2025) | Current estimate for 2024 (published June 2026) | % change (from Jun 25 to Jun 26 estimate) |
|---|---|---|---|
| All outputs and subsidies | 38,507 | 38,779 | 0.7% |
| All inputs and costs | 30,618 | 31,561 | 3.1% |
| Total Income from Farming | 7,688 | 6,989 | -9.1% |
Source: Total Income from Farming in the UK
Download the full accounts dataset
TIFF is calculated as the (relatively small) difference between two large numbers, ‘outputs and subsidies’ and ‘inputs and costs’, and so minor changes in these numbers can feed through to cause a large change in the value of TIFF. There was a substantial downwards revision to TIFF in the UK in 2024 of £699 million mainly as a result of a 3.1% increase to all inputs and costs.
Table 4.7: Revisions larger than £100 million in outputs at current prices (£ million)
| Item | Previous estimate for 2024 (published June 2025) | Current estimate for 2024 (published June 2026) | % change (from Jun 25 to Jun 26 estimate) |
|---|---|---|---|
| Diversification | 1,952 | 2,143 | 9.8% |
Source: Total Income from Farming in the UK
Download the full accounts dataset
The £191 million increase to the value of diversification is due to the replacement of industry estimates with survey data. Please see Inputs: Intermediate consumption section for details.
Table 4.8: Revisions larger than £100 million in inputs and costs at current prices (£ million)
| Item | Previous estimate for 2024 (published June 2025) | Current estimate for 2024 (published June 2026) | % change (from Jun 25 to Jun 26 estimate) |
|---|---|---|---|
| Energy | 1,746 | 1,899 | 8.8% |
| Other goods and services | 3,863 | 4,040 | 4.6% |
| Compensation of employees | 3,044 | 3,530 | 16.0% |
Source: Total Income from Farming in the UK
Download the full accounts dataset
The £153 million increase to the value of energy, £177 million increase to the value of other goods and services and £486 million increase to the value of compensation of employees are due to the replacement of industry estimates with survey data. Please see Inputs: Intermediate consumption section for details.
As a result of more data becoming available over time there have also been minor revisions to earlier years in this release. These revisions are intended to enhance the precision of these estimates. Sometimes additional revisions are necessary to refine the methodology or correct historical errors.
Glossary of other Key Terms
-
Basic price is the market price plus directly paid subsidies that are linked to the production of specific products.
-
Current price is the value based on prices observed during the reference year (i.e. values not adjusted for inflation). The alternative to current price is ‘real terms’.
-
Gross Value Added (GVA) is computed as Gross output minus intermediate consumption and represents that contribution of a business, sector or industry to Gross Domestic Product (GDP).
-
Intermediate consumption is the goods and services used as inputs in the productive process, e.g. feed, energy and fertilisers.
-
Other costs includes other taxes on production, rent and interest paid.
-
Real terms is where values from previous years have been adjusted for inflation. The alternative to real terms is ‘current price’.