Chapter 14: The food chain
Updated 3 September 2026

© Crown copyright 2026
This publication is licensed under the terms of the Open Government Licence v3.0 except where otherwise stated. To view this licence, visit nationalarchives.gov.uk/doc/open-government-licence/version/3 or write to the Information Policy Team, The National Archives, Kew, London TW9 4DU, or email: psi@nationalarchives.gov.uk.
Where we have identified any third party copyright information you will need to obtain permission from the copyright holders concerned.
This publication is available at https://www.gov.uk/government/statistics/agriculture-in-the-united-kingdom-2025/chapter-14-the-food-chain
Summary
-
In 2024, the agri-food sector (excluding fishing) in the United Kingdom accounted for a total estimated Gross Value Added (GVA) of £162.3bn or 6.2% of national GVA, an increase of 6.6% since 2023.
-
Employment in the agri-food sector in Great Britain was 4.1 million over the 12-month period to the fourth quarter of 2025, a 1% fall on the previous year.
-
Total Factor Productivity of the food chain in 2024 showed no significant change compared to 2023, while the productivity of the wider economy increased by 0.4%. In the 10 years prior to 2024, the average annual growth rate of the food chain was 0.8%, while the wider economy’s average annual growth rate was 0.3%.
-
Consumer expenditure on food and alcoholic drinks was £303.3bn in 2025, an increase of 1.1% from £300bn in 2024 in real terms.
-
The food production to supply ratio is estimated to be 60% for all food and 72% of indigenous type food in 2025.
Contribution of the agri-food sector to the national economy
Figure 14.1 Gross Value Added of the agri-food sector, 2024 (£ billion)
Enquiries: familyfood@defra.gov.uk
| Sector | Gross Value Added | Share of total |
|---|---|---|
| Agriculture (excluding fishing) | £14.5bn | 8.9% |
| Food and drink manufacturing | £39.3bn | 24.2% |
| Food and drink wholesale | £18.3bn | 11.3% |
| Food and drink retail | £44.1bn | 27.1% |
| Non-residential catering | £46.1bn | 28.4% |
Source: Annual Business Survey (ONS), Aggregate Agricultural Accounts (Defra).
Download the full food chain dataset
In 2024 the agri-food sector (excluding fishing) contributed £162.3bn to the UK’s economy, 6.2% of the national GVA. Within this, catering accounted for the largest proportion at 28.4% followed by retailing at 27.1% and manufacturing at 24.2%. The agriculture sector made the smallest contribution at 8.9%.
Tables 14.1a to 14.1d Agri-food sector selected statistics
Enquiries: familyfood@defra.gov.uk
Table 14.1a Gross Value Added, UK 2022-2024 (£ million)
| Sector | 2022 | 2023 | 2024 |
|---|---|---|---|
| Agri-food sector’s contribution to total economy Gross Value Added | 146,088 | 152,315 | 162,325 |
| Agriculture (excluding fishing) | 14,249 | 12,840 | 14,490 |
| Food and drink manufacturing | 34,962 | 37,132 | 39,333 |
| Food and drink wholesale | 15,852 | 16,911 | 18,303 |
| Food and drink retail | 37,753 | 40,249 | 44,061 |
| Food and drink non-residential catering | 43,272 | 45,183 | 46,138 |
| % of national Gross Value Added | 6.5% | 6.2% | 6.2% |
Table 14.1b Employment, GB 2023-2025 (thousand persons)
| Sector | 2023 | 2024 | 2025 |
|---|---|---|---|
| Workforce in the agri-food sector in Great Britain | 4,192 | 4,159 | 4,102 |
| Agriculture (excluding fishing) | 409 | 402 | 394 |
| Food and drink manufacturing | 440 | 443 | 444 |
| Food and drink wholesale | 210 | 226 | 232 |
| Food and drink retail | 1,109 | 1,105 | 1,079 |
| Food and drink non-residential catering | 2,022 | 1,984 | 1,953 |
| % of total workforce in employment | 13.4% | 13.2% | 13.0% |
Table 14.1c Production to supply ratio, UK 2023-2025
| UK Food Production to supply ratio | 2023 | 2024 | 2025 |
|---|---|---|---|
| % of all food | 62% | 65% | 60% |
| % of indigenous type food | 75% | 77% | 72% |
Table 14.1d Consumer expenditure, UK 2023-2025 (£ million unless otherwise specified)
| UK Household final consumption expenditure on food and alcoholic drinks | 2023 | 2024 | 2025 |
|---|---|---|---|
| At current prices (all food and drink) | 303,534 | 311,891 | 328,521 |
| Household food and non-alcoholic beverages | 139,909 | 142,180 | 147,956 |
| Food and drink eaten out | 136,450 | 141,616 | 151,378 |
| Alcoholic drinks (off-licence only) | 27,175 | 28,095 | 29,187 |
| At constant 2023 prices (all food and drink) | 303,534 | 300,033 | 303,265 |
| Household food and non-alcoholic beverages | 139,909 | 138,368 | 138,197 |
| Food and drink eaten out | 136,450 | 134,689 | 137,724 |
| Alcoholic drinks (off-licence only) | 27,175 | 26,976 | 27,344 |
| % of total household final consumption expenditure (current prices) | 18.6% | 18.5% | 18.6% |
| Household food and non-alcoholic beverages | 8.6% | 8.4% | 8.4% |
| Food and drink eaten out | 8.4% | 8.4% | 8.6% |
| Alcoholic drinks (off-licence only) | 1.7% | 1.7% | 1.7% |
Notes:
- The value of agricultural GVA published in Chapter 14 may differ to the value of agricultural GVA published in Chapter 4 due to differences in analytical calculations.
Sources: Annual Business Survey (ONS), Aggregate Agricultural Accounts (Defra), Labour Force Survey GB (ONS), Overseas Trade Statistics (HMRC), Consumer Price Indices (ONS).
Download the full food chain dataset
Agri-food sector employees and self-employed farmers in Great Britain
Figure 14.2 Agri-food sector employees and self-employed farmers, Great Britain, 2025 (millions)
Enquiries: familyfood@defra.gov.uk
| Sector | Employees (millions) |
|---|---|
| Agriculture (excluding fishing) | 0.4 |
| Food and drink manufacturing | 0.4 |
| Food and drink wholesale | 0.2 |
| Food and drink retail | 1.1 |
| Food and drink non-residential catering | 2.0 |
| Total Food | 3.7 |
| Total Agri-Food | 4.1 |
Notes:
-
‘Food’ includes non-alcoholic drinks. ‘Drink’ is alcoholic drinks.
-
Refer to the Glossary for the Economic definition of Food and Agri-Food sector for the relevant SIC codes.
-
GB figures have more specific, divisional level data (3-digit SIC codes) to be able to specify employment within the food chain. Not available for Northern Ireland as it is not recorded in their equivalent survey: the Northern Ireland Quarterly Employment Survey (NISRA).
Sources: Labour Market Statistics- Employee jobs by industry (ONS) & Agricultural Workforce in the United Kingdom at 1 June (Defra).
Download the full food chain dataset
The food and drink sector in Great Britain (GB) employed 3.7 million people in 2025 (4.1 million if agriculture is included along with self-employed farmers), a 1% decrease on a year earlier. The sector accounted for 11.8% of GB employment in 2025 (13% if agriculture is included along with self-employed farmers). Employment across the whole GB economy increased by 0.2% between 2024 and 2025 (based on the ‘total industries’ estimate from the same JOBS03 table that covers SIC section A-T).
Total Factor Productivity
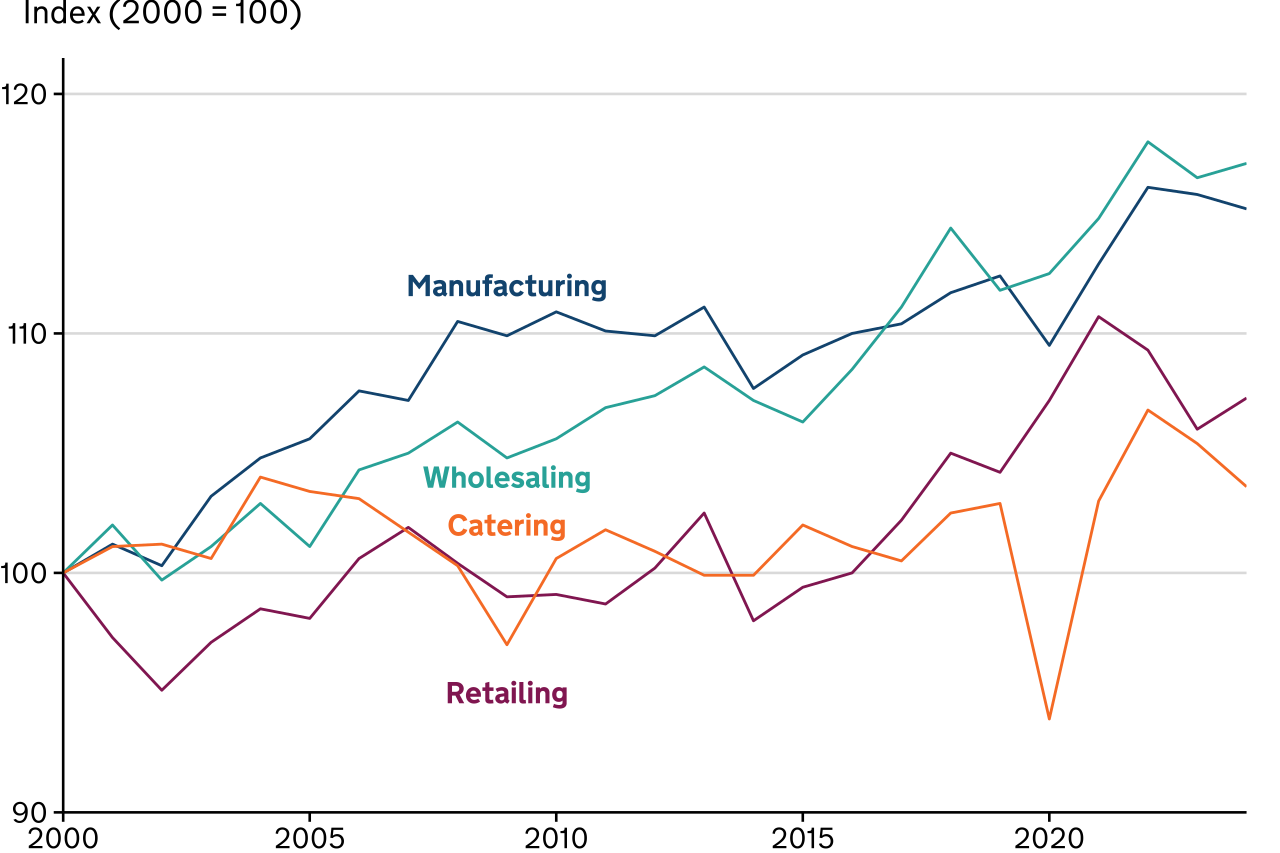
Figure 14.3 Trends in the total factor productivity of the UK food chain, 2000 to 2024
Enquiries: familyfood@defra.gov.uk
Source: Total Factor Productivity of the United Kingdom Food Chain, Defra
Download the full food chain dataset
In 2024 the productivity of the food chain showed no significant change compared to 2023, while the productivity of the wider economy increased by 0.4%. In the 10 years prior to 2024, the average annual growth rate of the food chain was 0.8%, while the wider economy’s average annual growth rate was 0.3%. In 2024 productivity increased in two of the four sectors: wholesale and retail.
In 2024, Total Factor Productivity in food and drink manufacturing decreased by 0.5%, while in the last 10 years average annual productivity increased by 0.7%. Total Factor Productivity of food wholesaling increased by 0.4% in 2024, while in the last 10 years has shown an average annual increase of 0.9%. Productivity of the food retail sector increased by 1.2% in 2024. In the last 10 years, productivity has shown an average annual increase of 0.9%. In 2024, non-residential catering (NRC) showed a decrease in productivity of 1.7% but in the last 10 years average annual productivity increased by 0.5%.
For more information on productivity please see the Total Factor Productivity of the United Kingdom Food Chain publication.
Food production to supply ratio
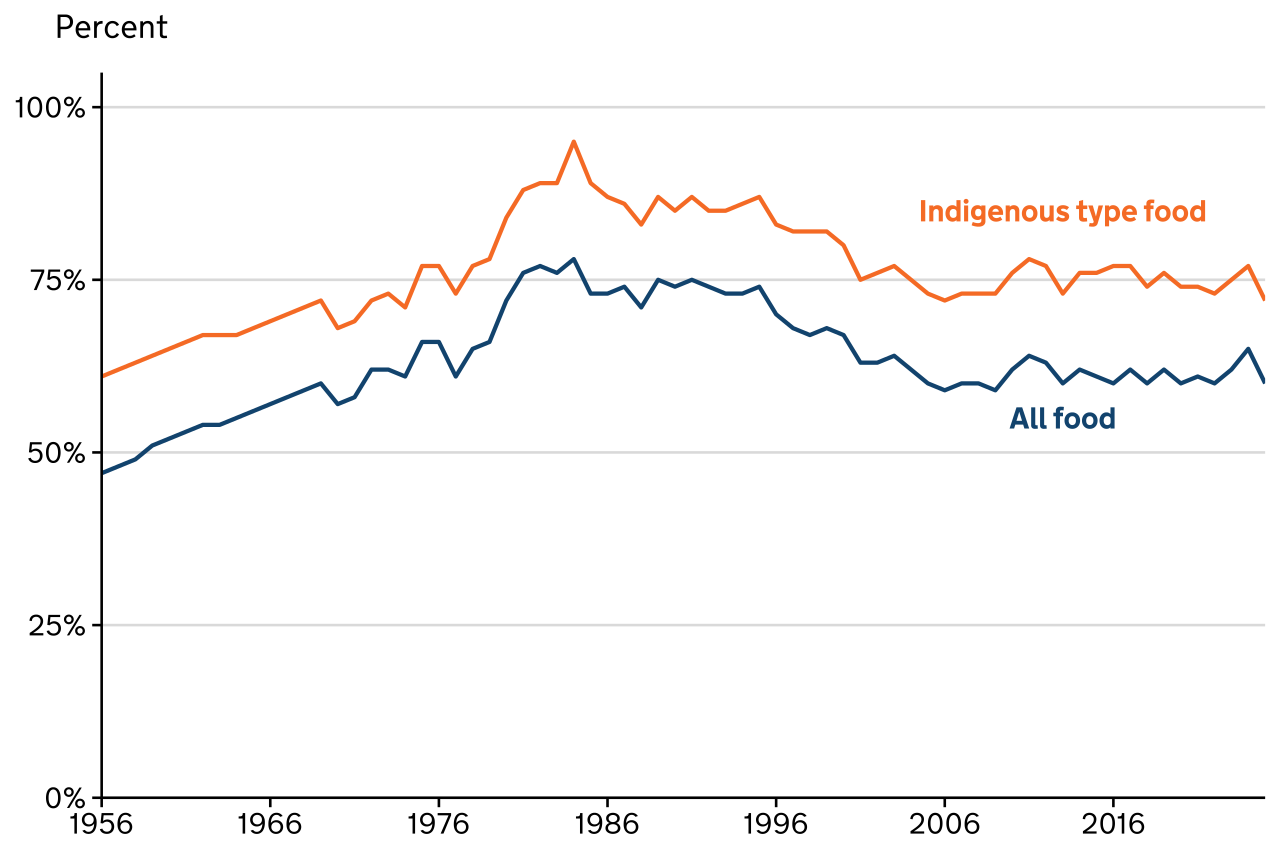
Figure 14.4 Food production to supply ratio (by value), United Kingdom, 1956-2025
Enquiries: familyfood@defra.gov.uk
Source: Defra analysis of HMRC Overseas Trade Statistics
Text description of Figure 14.4: Figure 14.4 is a line chart that shows how the food production to supply ratio for all food and indigenous type food for the UK has changed from 1956 to 2025.
Download the full food chain dataset
In 2025, the value of food, feed and drink exports was £25.7bn, a decrease of 0.9% from 2024 after adjusting for trade price inflation. In 2025 the value of food, feed and drink imports increased by 4.8% from 2024 to £67.8bn, resulting in a trade gap of £42.1bn, an increase of 8.6% from £38.8bn in 2024 after adjusting for trade price inflation. See Chapter 13 for more detail on overseas trade.
Net trade on its own does not take domestic production into account. The food production to supply ratio (sometimes referred to as the “self-sufficiency ratio”), is calculated as the farmgate value of raw food production divided by the value of raw food for human consumption – the value of trade in processed, added-value products is adjusted to reflect the value of the raw ingredients. The ratio has stabilised in the most recent decade at around 60% after falling from over 80% in the 1980s, but is higher than it has been historically. The ratio for indigenous only food types follows the same trend but is consistently several percentage points higher than the ratio for all food types.
The food production to supply ratio is estimated to be 60% for all food and 72% of indigenous type food in 2025. In 2024, this was 65% and 77% respectively. The main driver of the annual change has been an increase in imports (by value) - Figure 13.5. Table 14.2 contains production to supply ratios for selected crops and other primary agricultural products. For these individual products, the production to supply ratio is calculated using volumes rather than value.
Table 14.2 Food production to supply ratios (by volume), 2023 to 2025
Enquiries: familyfood@defra.gov.uk
| 2023 | 2024 | 2025 | |
|---|---|---|---|
| Cereals | 93% | 79% | 81% |
| Wheat | 96% | 79% | 83% |
| Barley | 113% | 106% | 107% |
| Oats | 120% | 104% | 109% |
| Other crops | |||
| Oilseed rape | 63% | 53% | 49% |
| Sugar beet | 54% | 65% | 61% |
| Fresh vegetables | 54% | 54% | 56% |
| Potatoes | 67% | 67% | 71% |
| Cabbages | 81% | 85% | 90% |
| Cauliflowers and broccoli | 51% | 56% | 55% |
| Carrots, turnips and swede | 96% | 95% | 97% |
| Mushrooms | 49% | 46% | 46% |
| Lettuce | 47% | 48% | 48% |
| Tomatoes | 16% | 16% | 17% |
| Fresh fruit | 16% | 15% | 14% |
| Apples | 45% | 43% | 47% |
| Pears | 13% | 17% | 19% |
| Plums | 13% | 12% | 9% |
| Strawberries | 66% | 61% | 56% |
| Raspberries | 39% | 34% | 38% |
| Meat and dairy | |||
| Beef and veal | 85% | 85% | 84% |
| Pig meat | 65% | 65% | 67% |
| Mutton and lamb | 113% | 101% | 103% |
| Poultry meat | 82% | 82% | 80% |
| Milk | 105% | 105% | 105% |
| Eggs | 88% | 88% | 88% |
Notes:
- 2025 figures are provisional.
- Average ratios for categories of cereals, other crops, fresh vegetables and fresh fruit may include more items than the selected items listed in the table.
Source: Chapter 7: Crops and Chapter 8: Livestock, of this publication are used for category averages (e.g. fresh vegetables) and potatoes and all meat and dairy products. Defra’s Horticulture Statistics for all other individual products.
Download the full food chain dataset
Production to supply ratios, competitiveness and food security
Food production to supply ratios provide a very broad indicator of the ability of United Kingdom agriculture to meet consumer demand - also described as competitiveness. They are not a definitive measure of food security since they do not account for many dimensions of this complex issue. Diversity of supply enhances security because a high food production to supply ratio fails to insulate a country against many possible disruptions to its supply chain. The United Kingdom sources foods from diverse stable countries, mainly European countries, and imports can make up for domestic supply shortages (see Figure 14.4).
For example, the production to supply ratio for fresh fruit (Table 14.2) is low, but this reflects a number of factors. Around four-fifths of the fruit we import cannot be grown in the UK, such as bananas and citrus fruit. For fruits that cannot be stored self-sufficiency will vary seasonally - for example the UK is largely self-sufficient in strawberries between June and September, but imports them when not in season. Even where produce can be successfully stored out of season, such as with apples, consumer choice can have an impact. The second most consumed variety in the UK is Pink Lady which accounts for around one-fifth of the UK market. However, the UK does not have the climate to successfully grow this variety. Pink Lady is also a licensed variety, and the UK only holds a very limited number of commercial licenses.
Thus a low production to supply ratio does not equate to low food security. There are economic and environmental reasons why increasing domestic production to displace imported produce may be desirable. However, even if all imports of fruit that could be grown in the UK were displaced, seasonality and consumer choice aside, the production to supply ratio would still be below 50%.
Defra’s triennial UK Food Security Report (UKFSR) which was last updated in 2024, provides a comprehensive analysis that encompasses the many dimensions of food security; availability, access, utilisation of food, stability, sustainability and agency. The next UKFSR will be published in 2027. In the intervening years, the UK Food Security Digest presents a selection of statistics on issues related to food security.
There is a continuously evolving set of challenges facing the food supply chain, for example geopolitical tensions disrupting global markets, the increasing cybersecurity risks as reliance on digital infrastructure grows and climate change.
In recent years, the food security landscape has changed significantly. The UK’s departure from the European Union brought changes in the areas of trade, farming, and access to fisheries, resulting in both challenges and opportunities in food security. The COVID-19 pandemic also stress-tested the supply chain, highlighting both the vulnerabilities in this complex system and the resilience and flexibility of the UK’s food supply.
Distinction between food production to supply ratio and origins of consumption
These two closely related measures are often quoted as indicators relevant to the state of domestic production or competitiveness. The diagram below illustrates the differences between them. Both are calculated using the farmgate value of raw food production.
-
The food production to supply ratio compares total UK production including exports with total UK supply. A small adjustment is made to take account of important inputs into agriculture (feed and seeds).
-
For origins of domestic consumption, UK consumption is considered to equate to supply. Only domestic supply, i.e. that amount of UK production which is not exported, is considered as UK consumption, alongside imported food.

The production to supply ratio is often referred to as ‘self-sufficiency’ in a food security context. It is important to note that 100% self-sufficiency does not equate to food security. A combination of strong domestic production and a diverse set of trading partners is more desirable. A high food production to supply ratio fails to insulate a country against many possible disruptions to its supply chain. Defra produces two outputs that cover food security in much more detail: the triennial UK Food Security Report and the annual UK Food Security Digest.
Origins of food consumed in the United Kingdom
Figure 14.5 includes the proportion of United Kingdom food consumption that is produced in the United Kingdom. This should not be confused with the food production to supply ratio given in Figure 14.4. Figure 14.5 looks purely at the breakdown of food that the United Kingdom actually consumes.
Figure 14.5 Origins of food consumed in the United Kingdom, 2025 (percentage)
Enquiries: familyfood@defra.gov.uk
| Origin | 2025 |
|---|---|
| UK | 58% |
| EU | 23% |
| Rest of Europe | 3% |
| Africa | 5% |
| Asia | 4% |
| Australasia | 1% |
| North America | 2% |
| South America | 4% |
Notes:
- Based on the farm-gate value of raw food.
- Consumption of UK origin consists of UK domestic production minus UK exports.
Source: Defra analysis of HMRC Overseas Trade Statistics
Download the full food chain dataset
Supply includes domestic production plus imports and excludes exports of home production. In 2025, 58% of domestic consumption came from UK production (based on unprocessed value at farmgate), 23% from the EU and the remaining 19% from the rest of the world. 35 countries accounted for 90% of imported supply, and 22 for 80%. Some countries or regions are uniquely important to the supply of particular products such as bananas from the Caribbean and Central America, reducing the security of this supply.
Consumer expenditure
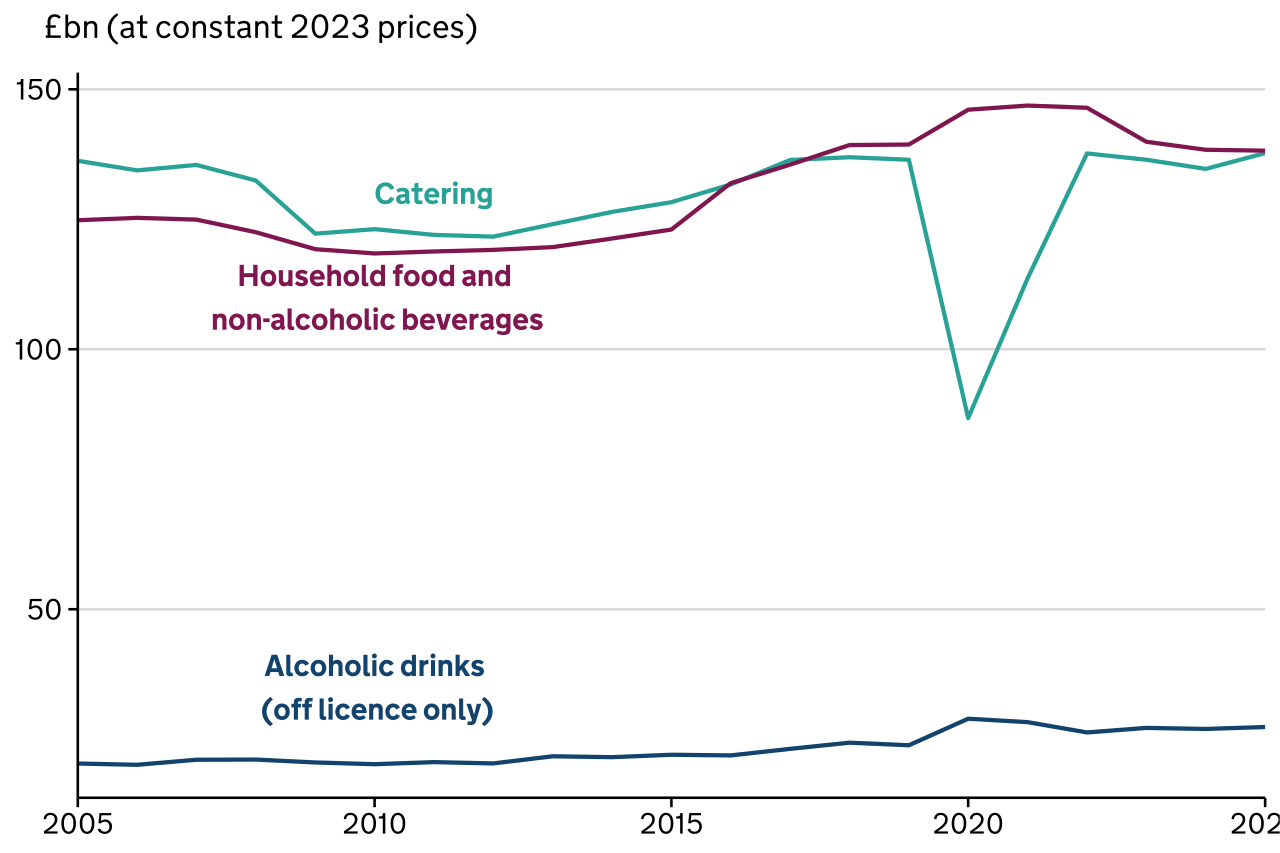
Figure 14.6 UK Consumer expenditure on food, drink and eating out, 2005-2025 (£ billion at constant 2023 prices)
Enquiries: familyfood@defra.gov.uk
Notes:
- Catering includes food and non-alcoholic beverages and alcoholic beverages from canteens, restaurants, cafés, pubs etc.
Source: Consumer trends, ONS
Text description of Figure 14.6: Figure 14.6 is a line chart that shows the amount of consumer spending in the UK on household food and non-alcoholic drink, alcoholic drink (off-licence only) and for catering from 2005 to 2025.
Download the full food chain dataset
In real terms, (removing the effect of price changes), consumer expenditure on food and alcoholic drinks was £303.3bn in 2025, an increase of 1.1% from £300.0bn in 2024.
Expenditure on food and drink eaten out increased by 2.3% from £134.7bn in 2024 to £137.7bn in 2025 and expenditure on household food fell slightly, by 0.12% from £138.4bn to £138.2bn. Expenditure on alcoholic drinks (off-licence only) increased by 1.4% from £26.98bn to £27.34bn.
Changes in consumer price indices
Figure 14.7 UK food and non-alcoholic beverage prices measured by Consumer Prices Index including owner occupiers’ housing costs (CPIH), Jan 2020 - Dec 2025
Enquiries: familyfood@defra.gov.uk

Source: Consumer Price Indices, (ONS)
Text description of Figure 14.7: Figure 14.7 is a line chart that shows the changes in the UK food and non-alcoholic beverage prices measured by CPIH and overall CPIH inflation from January 2020 to December 2025.
Download the full food chain dataset
The Consumer Prices Index including owner occupiers’ housing costs (CPIH) is the most comprehensive measure of inflation. It extends the Consumer Prices Index (CPI) to include a measure of the costs associated with owning, maintaining and living in one’s own home, known as owner occupiers’ housing costs (OOH), along with Council Tax. Both are significant expenses for many households that are excluded from the CPI.
Modelling commissioned by Defra shows that the five main drivers of food prices are farmgate prices, import prices, exchange rates, labour costs in food manufacturing and non-labour costs in food manufacturing.
Food price inflation rose sharply during the period 2021-2023 due to a combination of those factors - some of which were also exacerbated further by the conflict in Ukraine. Food and non-alcoholic beverages CPIH inflation peaked in March 2023 at 19.2% while overall CPIH inflation peaked in October 2022 at 9.6%. Since then inflation has fallen, with food inflation becoming less than overall inflation in April 2024. In the eighteen months to the end of 2025, inflation generally showed a slow upward trend, with food inflation overtaking overall inflation in May 2025 and ending the year at 4.5% compared to 3.6% for all items.
Glossary
Standard Industrial Classification codes (SIC codes)
These are numerical codes that categorise the industries that companies belong to based on their business activities.
Economic definition of food and agri-food sector
The UK food sector is defined as food manufacturing, food wholesaling, food retailing and non- residential catering. In terms of the Standard Industrial Classification (SIC 2007) it is defined as:
| Category | SIC codes |
|---|---|
| Food manufacturing: | 10 + 11 |
| Food wholesaling: | 46.3 (excluding 46.35) + 46.17 |
| Food retailing: | 47.2 (excluding 47.26) + 47.11 + 47.81 |
| Non-residential catering: | 56 |
-
In SIC2007 the food manufacturing sector comprises of nine main categories including processing and preserving meat, dairy, fruit and vegetables, oils, bread, biscuits and cakes, and confectionery. Animal feed manufacturing is included, covering both farm animal feed and pet food. The drink manufacturing sector includes alcoholic beverages and soft drinks and mineral waters.
-
Food and drink wholesaling consists of the buying, storage and reselling of food either manufactured or freshly produced. Wholesale of tobacco products (46.35) is not included, but SIC code 46.17 “Agents involved in the sale of food, beverages and tobacco” is included. This group includes wholesalers that trade on behalf of others on a fee or contract basis and also 46.3 which is “Wholesale of food, beverages and tobacco”.
-
Food and drink retailing is defined as the sale of food within both non-specialised stores (e.g. supermarkets), 47.11, and specialised stores such as butchers and bakers, 47.11 and 47.81. The sale of tobacco products is subtracted from the specialised stores using 47.26 and then subtracted from the non-specialised stores later on using a ratio for food and drink.
-
Non-residential catering (NRC) consists of restaurants and bars involved in preparation and serving of food, alongside canteens and catering services. Hotels are not included.
The deductions are to remove non-food items as far as possible.
The agri-food sector is the food sector plus agriculture.
Gross Value Added (GVA)
GVA is the difference between output and intermediate consumption for any given sector / industry. This is the difference between the value of goods and services produced and the cost of raw materials and other inputs which are used up in production.
Total Factor Productivity (TFP)
Productivity measures the efficiency at which inputs are converted into outputs. Total Factor Productivity provides a comprehensive picture of growth.