Statistical commentary: adult mental health profile, July 2026 update
Published 7 July 2026
Applies to England

© Crown copyright 2026
This publication is licensed under the terms of the Open Government Licence v3.0 except where otherwise stated. To view this licence, visit nationalarchives.gov.uk/doc/open-government-licence/version/3 or write to the Information Policy Team, The National Archives, Kew, London TW9 4DU, or email: psi@nationalarchives.gov.uk.
Where we have identified any third party copyright information you will need to obtain permission from the copyright holders concerned.
This publication is available at https://www.gov.uk/government/statistics/adult-mental-health-and-wellbeing-profile-july-2026-update/statistical-commentary-adult-mental-health-profile-july-2026-update
What’s new
The following indicators have been updated for the financial year ending 2024:
- new referrals to secondary mental health services, per 100,000
- attended contacts with community and outpatient mental health services, per 100,000
- inpatient stays in secondary mental health services, per 100,000
They show data for:
- England
- statistical regions
- NHS regions
- integrated care boards (ICBs)
- upper tier local authorities (UTLAs)
These indicators are published as ‘equality’ measures. As well as measuring between area variation they show within area variation. An overall rate is presented and is split by age group, gender and area level deprivation quintile (based on index of multiple deprivation (IMD) 2019) at national and local level. Data for these breakdowns have been updated and are presented in the inequalities data view in the adult mental health and wellbeing profile.
The data source for these indicators is the Mental Health Services Dataset (MHSDS). There are some data quality issues with MHSDS that can impact on rates produced for some geographies. Values and counts are not published when relevant fields are missing, or data quality issues have been flagged. More information can be found in the introduction and the definitions data view in the profile.
Introduction
The purpose of the profile is to provide an intelligence driven approach to improving understanding of adult mental health and wellbeing at a local and national level. It brings together intelligence on:
- identification of need
- factors affecting mental health
- wellbeing
- services and access
- quality and outcomes
Selected important indicators are presented as ‘key indicators’.
This commentary concentrates on 3 of the indicators in ‘services and access’. For presentation purposes, indicator names have been shortened as:
- ‘new referrals’ for new referrals to secondary mental health services, per 100,000
- ‘attended contacts’ for attended contacts with community and outpatient mental health services, per 100,000
- ‘inpatient stays’ for inpatient stays in secondary mental health services, per 100,000
These indicators have been produced by the Office for Health Improvement and Disparities (OHID) using:
- MHSDS from NHS England
- IMD 2019 from the Ministry of Housing, Communities and Local Government
- mid-year population estimates from the Office for National Statistics (ONS)
Indicators are presented as directly age-standardised rates to account for the varying proportions of people at different ages in the population. This enables comparison between areas and across time.
This commentary analyses variation in rates across the population between the financial years ending in 2018 and 2024, including changes over time.
It should be noted that:
- some of the changes over time may reflect an increase in providers submitting to MHSDS
- as these indicators are activity based, some people may be counted more than once in a financial year
- the age group ‘less than 25 years’ includes those aged ‘less than 18 years’
- gender is displayed as ‘sex’ in the profile
- for the purpose of presentation, small area values have been combined with neighbouring UTLAs, as follows:
- City of London with Hackney, and presented for Hackney only
- Isles of Scilly with Cornwall, and presented for Cornwall only
The indicators covered in this commentary are subject to a data completeness assessment. Indicator values and counts have not been published where relevant fields are missing more than 10% of data. This has been noted below the corresponding figures and tables. When there is between 5% and 10% of the data missing a value note has been applied, which is available to view in the profile.
Main findings
This update shows that for England in the financial year ending 2024:
- people aged under 25 years had the highest rate of new referrals and attended contacts, whereas people aged 25 to 64 years had the highest rates of inpatient stays
- females had a higher rate of new referrals and attended contacts, whereas males had a higher rate of inpatient stays
- people living in the most deprived quintile had a higher rate of new referrals, attended contacts and inpatient stays than those in the least deprived quintile, with the greatest difference evident in inpatient stays
For England between the financial years ending 2018 and 2024:
- new referrals increased for all age groups with those aged under 25 and under 18 showing a higher percentage change, whereas inpatient stays decreased for all age groups, with those aged under 18 showing the largest decrease
- males and females had increasing rates of new referrals, with a higher increase in females, whereas both showed a similar reduction in inpatient stays
- people in both the most and least deprived quintiles had an increasing rate of new referrals, but the increase was higher in the least deprived quintile, whereas inpatient stays showed a similar percentage decrease for both quintiles
For statistical regions in the financial year ending 2024:
- the North East had the highest rate of new referrals and attended contacts, whereas London had the highest rate of inpatient stays
- the South East had the lowest rate of new referrals and attended contacts, and the South East and South West had the lowest rate of inpatient stays
For statistical regions between the financial years ending 2018 and 2024 there was:
- an increase in new referrals in all regions, with the largest increase in the South East and South West, and the smallest increase in the North East
- a reduction in inpatient stays in all regions, with the largest decrease in the North East and East of England
Detailed findings
For England, rates of new referrals and attended contacts have been increasing from the financial year ending 2018, whereas inpatient stays have been decreasing.
For the financial year ending 2024 the rate was:
- 8,602 per 100,000 population for new referrals
- 34,211 per 100,000 population for attended contacts
- 202 per 100,000 population for inpatient stays
Variation by age group, gender and deprivation quintile
The following section examines how rates of new referrals, attended contacts and inpatient stays vary by age group, gender and deprivation quintile in England.
Table 1: rate of new referrals, attended contacts and inpatient stays per 100,000, by age group, for England, financial year ending 2024
| Age group | New referrals | Attended contacts | Inpatient stays |
|---|---|---|---|
| Less than 18 years | 9,818 | 35,705 | 21 |
| Less than 25 years | 10,584 | 37,235 | 99 |
| 25 to 64 years | 7,982 | 33,146 | 265 |
| 65 years and over | 7,492 | 32,841 | 174 |
Data source: OHID based on MHSDS and mid-year population estimates.
Table 1 shows:
- people aged under 25 years and under 18 years had the highest rate of new referrals and attended contacts
- people aged 25 to 64 years had the highest rate of inpatient stays, at around 2.5 times the rate for people aged under 25 years and more than 10 times the rate for people aged under 18 years
Table 2: rate of new referrals, attended contacts and inpatient stays per 100,000, by gender, for England, financial year ending 2024
| Gender | New referrals | Attended contacts | Inpatient stays |
|---|---|---|---|
| Female | 9,192 | 38,726 | 183 |
| Male | 7,887 | 29,246 | 221 |
Data source: OHID based on MHSDS and mid-year population estimates.
Table 2 shows:
- females had a higher rate of new referrals and attended contacts compared to males
- the rate of inpatient stays was higher in males compared to females
Table 3: rate of new referrals, attended contacts and inpatient stays per 100,000, by most and least deprived quintile, for England, financial year ending 2024
| Deprivation quintile | New referrals | Attended contacts | Inpatient stays |
|---|---|---|---|
| Most deprived | 12,322 | 49,369 | 319 |
| Least deprived | 5,428 | 22,404 | 103 |
Data source: OHID based on MHSDS, IMD 2019, and mid-year population estimates.
Table 3 shows people living in the most deprived quintile had higher rates than those in the least deprived quintile for all 3 indicators with:
- more than 2 times the rate of new referrals
- more than 2 times the rate of attended contacts
- over 3 times the rate of inpatient stays
The following figures (1 to 3) explore the percentage change for each year from financial year ending 2018 for rate of new referrals, attended contacts and inpatient stays.
Figure 1: percentage change in rate of new referrals, attended contacts and inpatient stays, by age group, for England, financial year ending 2018 to financial year ending 2024

Data source: OHID based on MHSDS and mid-year population estimates.
Figure 1 shows:
- for new referrals:
- people aged under 18 years and under 25 years had the largest percentage increase whereas people aged 25 to 64 years showed a smaller increase
- there were modest fluctuations in the rate for people aged 65 and over, with an overall minor increase by financial year ending 2024
- for attended contacts:
- the rate increased for all age groups until the financial year ending 2021, then showed evidence of steadying or decreasing in the following years
- early increases were highest in those aged under 18 and under 25
- inpatient stays decreased across all age groups across the period, with those aged under 18 showing the largest decrease
This data is available in table 1 of the accompanying data tables on the adult mental health and wellbeing profile, July 2026 update.
Figure 2: percentage change in rate of new referrals, attended contacts and inpatient stays, by gender, for England, financial year ending 2018 to financial year ending 2024

Data source: OHID based on MHSDS and mid-year population estimates.
Figure 2 shows:
- new referrals increased in both females and males across the period, with the percentage change higher in females
- the rate of attended contacts in males and females increased up to the financial year ending 2021 then fluctuated in the following years
- a steady decline in both male and female rates of inpatient stays across the period
This data is available in table 2 of the accompanying data tables on the adult mental health and wellbeing profile, July 2026 update.
Figure 3: percentage change in rate of new referrals, attended contacts and inpatient stays, by most and least deprived quintile, for England, financial year ending 2018 to financial year ending 2024

Data source: OHID based on MHSDS, IMD 2019, and mid-year population estimates.
Figure 3 shows:
- new referrals increased across the period with a greater increase in the least deprived quintile compared to the most deprived quintile
- attended contacts increased in the most and least deprived quintiles up to the financial year ending 2021 then fluctuated in the following years
- inpatient stays decreased by similar amounts in the most and least deprived quintiles between the financial years ending 2018 and 2024
This data is available in table 3 of the accompanying data tables on the adult mental health and wellbeing profile, July 2026 update.
Although rates of new referrals and attended contacts are higher for people living in the most deprived quintile in the financial year ending 2024 (as shown in table 3), there has been a larger percentage increase in rates across the period for people living in the least deprived quintile.
Variation in rates for regions
This section explores variation in the rates of new referrals, attended contacts and inpatient stays in statistical regions in England.
Table 4: rate of new referrals, attended contacts and inpatient stays per 100,000, by region, financial year ending 2024
| Region | New referrals | Attended contacts | Inpatient stays |
|---|---|---|---|
| North East | 11,182 | 48,601 | 187 |
| North West | 9,243 | 35,727 | 234 |
| Yorkshire and the Humber | 8,468 | 38,869 | 199 |
| East Midlands | Missing data | 38,385 | 187 |
| West Midlands | 9,265 | 32,220 | 196 |
| East of England | 8,292 | 29,762 | 164 |
| London | 7,299 | 35,676 | 254 |
| South East | 7,036 | 26,815 | 149 |
| South West | 7,336 | 30,587 | 145 |
Data source: OHID based on MHSDS and mid-year population estimates.
Note: there is a value not published in this figure due to a data quality assessment identifying the area as having more than 10% missing data.
Table 4 shows:
- the North East had the highest rate of new referrals and attended contacts
- inpatient stays were highest in London and the North West
- the South East had the lowest rate of new referrals and attended contacts
Figure 4: percentage change in rate of new referrals, attended contacts and inpatient stays, by region, between financial year ending 2018 and financial year ending 2024

Data source: OHID based on MHSDS and mid-year population estimates.
Note: there is a value not published in this figure due to a data quality assessment identifying the area as having more than 10% missing data.
Figure 4 shows:
- new referrals and attended contacts increased for all regions
- the South East and South West had the largest increase in new referrals
- the East of England and South West had the largest increase in attended contacts
- inpatient stays decreased across all regions, with the North East having the largest percentage change
This data is available in table 4 of the accompanying data tables on the adult mental health and wellbeing profile, July 2026 update page.
Variation by age group, gender and deprivation quintiles in UTLAs
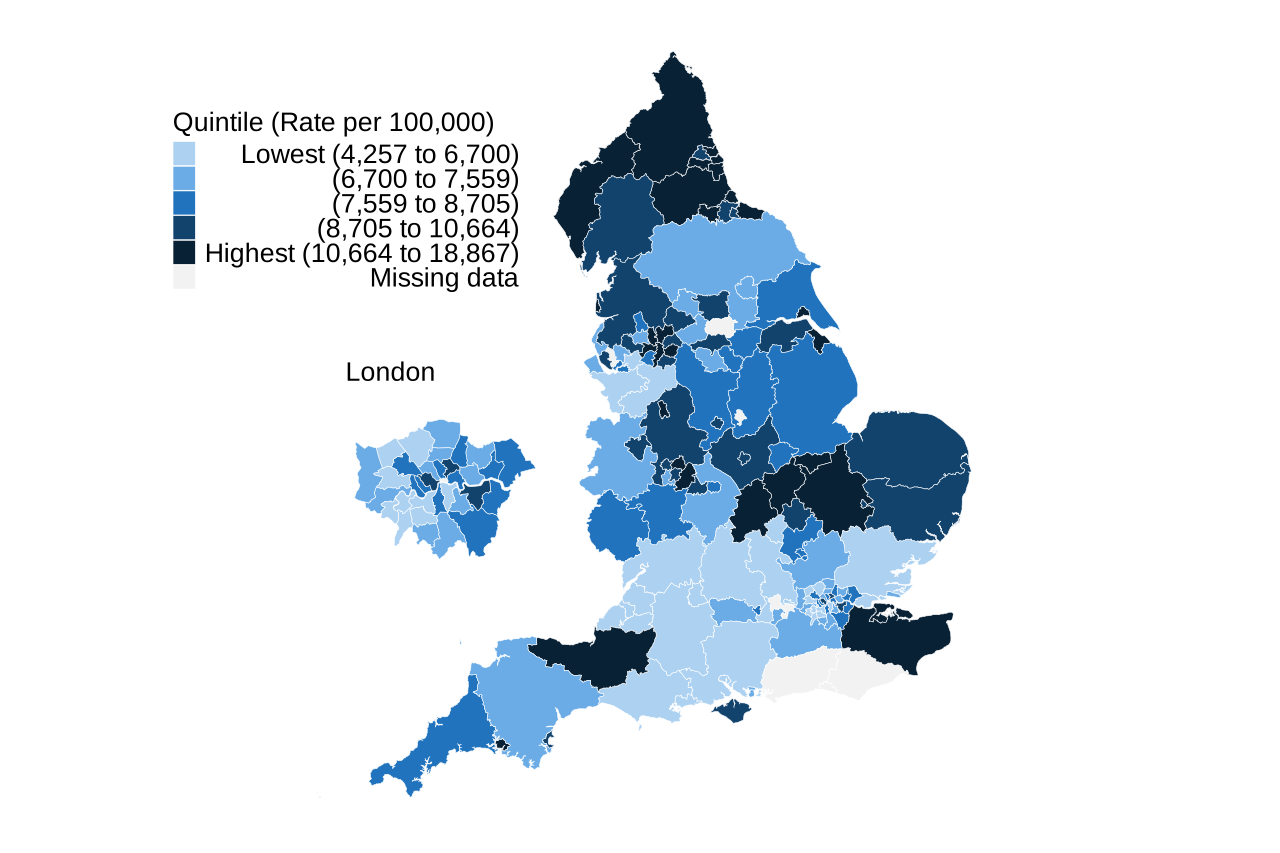
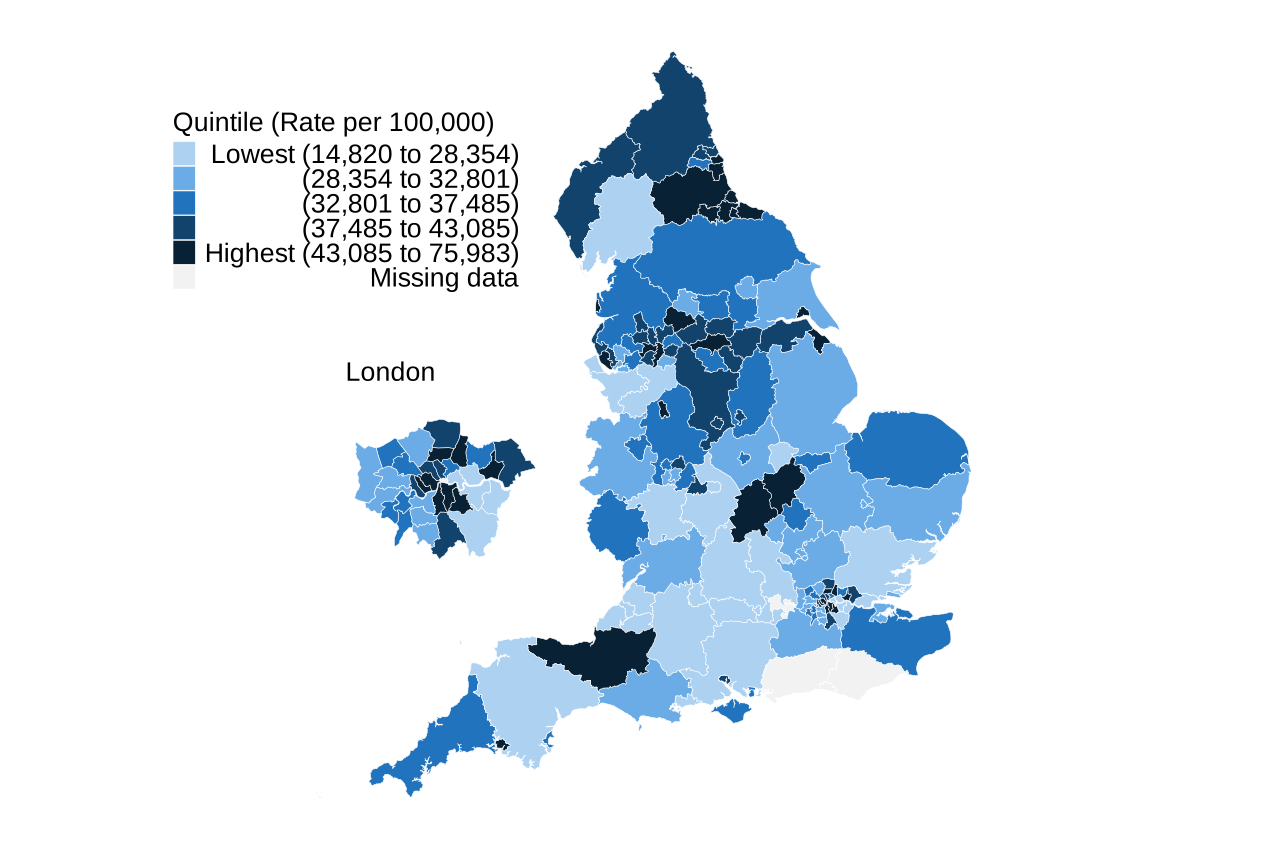
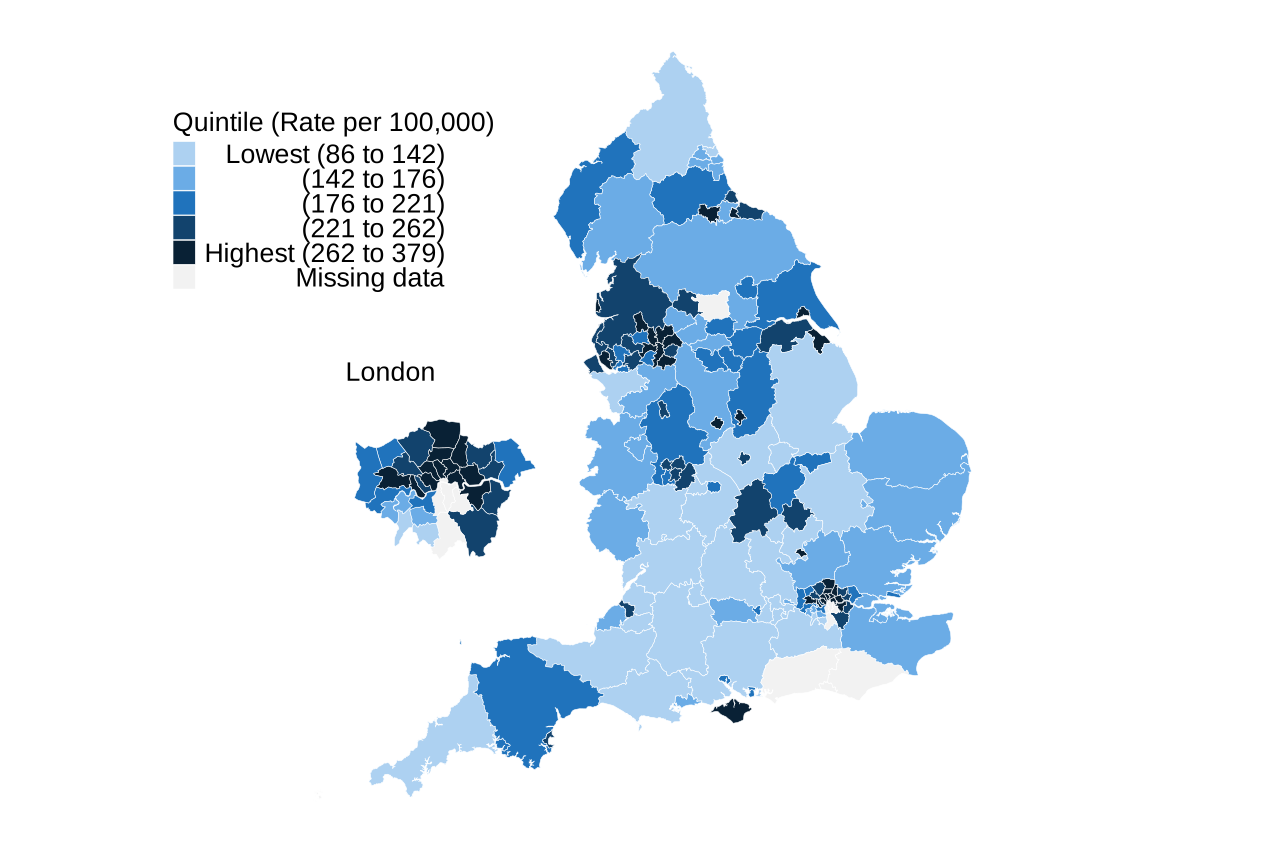
As well as national and regional variation, there is evidence of local variation across UTLAs in England. The following maps present rates per 100,000 which have been grouped into quintiles from lowest rate through to highest.
Figure 5: new referral rates for UTLAs per 100,000, for England, financial year ending 2024
Data source: OHID based on MHSDS and mid-year population estimates.
Note: there are values not published in this figure due to a data quality assessment identifying the areas as having more than 10% missing data. Values are also not showing for small areas that have been combined with a neighbouring UTLA.
Figure 5 shows:
- there were higher rates of new referrals in:
- the north of England, including Northumberland and County Durham
- North East and North West urban areas
- urban areas around Birmingham
- rural East Midlands
- parts of the South East
- some coastal areas
- there were lower rates of new referrals:
- in counties across southern central England from Essex to Gloucestershire
- in north west and south west London
- in parts of the South East and South West
- in parts of the rural North West
This data is available in table 5 of the accompanying data tables on the adult mental health and wellbeing profile, July 2026 update page.
Figure 6: attended contact rates for UTLAs per 100,000, for England, financial year ending 2024
Data source: OHID based on MHSDS and mid-year population estimates.
Note: there are values not published in this figure due to a data quality assessment identifying the areas as having more than 10% missing data. Values are also not showing for small areas that have been combined with a neighbouring UTLA.
Figure 6 shows:
- there were higher rates of attended contacts in:
- urban areas, particularly around Liverpool, Manchester, Sunderland, Birmingham and Kingston upon Hull
- north and south east London
- parts of rural East Midlands
- some coastal areas
- urban areas in the Midlands
- there were lower rates of attended contacts:
- in counties across southern central England from Essex to Gloucestershire
- in south east London
- in parts of the South East and South West
- in parts of the rural North West
This data is available in table 5 of the accompanying data tables on the adult mental health and wellbeing profile, July 2026 update page.
Figure 7: inpatient stay rates for UTLAs per 100,000, for England, financial year ending 2024
Data source: OHID based on MHSDS and mid-year population estimates.
Note: there are values not published in this figure due to a data quality assessment identifying the areas as having more than 10% missing data. Values are also not showing for small areas that have been combined with a neighbouring UTLA.
Figure 7 shows:
- there were higher rates of inpatient stays in:
- urban areas, particularly around Liverpool, Manchester, Sunderland, Birmingham and Kingston upon Hull
- north and south east London
- parts of rural East Midlands
- some urban coastal areas
- urban areas in the Midlands
- there were lower rates of inpatient stays in:
- most of central rural England
- parts of the South West and South East
This data is available in table 5 of the accompanying data tables on the adult mental health and wellbeing profile, July 2026 update page.
Although there are similarities in high and low rates for new referrals, attended contact and inpatient stays, differences also exist. High rates of inpatient stays are more concentrated in urban areas compared to either new referrals or attended contacts.
Figure 8: Proportion of UTLAs in each rate quintile for new referrals, attended contacts and inpatient stays, presented across deprivation quintiles, for England, financial year ending 2024

Data source: OHID based on MHSDS, IMD 2019, and mid-year population estimates.
Note: rates per 100,000 are grouped into quintiles from lowest through to highest. Missing data is not presented and is excluded from the calculated proportions.
Figure 8 shows:
- UTLA rates varied substantially by deprivation quintile
- the most deprived quintile had the most UTLAs with highest rates (new referrals 48%, contacts 45%, inpatient stays 39%) and no UTLAs with lowest rates
- the least deprived quintile had most UTLAs with lowest rates (new referrals 50%, contacts 46%, inpatient stays 63%)
This data is available in table 6 of the accompanying data tables on the adult mental health and wellbeing profile, July 2026 update page.
Figure 9: percentage change in rate of new referrals, attended contacts and inpatient stays, in the 10 UTLAs with highest increase in new referrals, between financial year ending 2018 and financial year ending 2024

Data source: OHID based on NHS England and mid-year population estimates.
Note: there are values not published in this figure due to a data quality assessment identifying the areas as having more than 10% missing data.
Figure 9 shows:
- new referrals increased by more than 100% in all 10 UTLAs, with the largest increase observed in North Northamptonshire and West Northamptonshire
- an increase in attended contacts in all 10 UTLAs that was generally smaller than the increase in new referrals, except for Plymouth where the percentage increase in attended contacts was more than double that for new referrals
- in Somerset, increases in new referrals and attended contacts were similar
- a percentage decrease in inpatient stays, ranging from 9% to 43%
This data is available in table 7 of the accompanying data tables on the adult mental health and wellbeing profile, July 2026 update page.
Further information
Responsible statistician:
Senior Public Health Intelligence Analyst (Mental Health Intelligence Team, OHID)
Product leads:
Programme Lead (Mental Health Intelligence Team, OHID)
Deputy Director (Clinical Epidemiology, OHID)
For queries relating to this publication, contact: mhit@dhsc.gov.uk.