Women and the Criminal Justice System, 2019
Published 26 November 2020
Applies to England and Wales

© Crown copyright 2020
This publication is licensed under the terms of the Open Government Licence v3.0 except where otherwise stated. To view this licence, visit nationalarchives.gov.uk/doc/open-government-licence/version/3 or write to the Information Policy Team, The National Archives, Kew, London TW9 4DU, or email: psi@nationalarchives.gov.uk.
Where we have identified any third party copyright information you will need to obtain permission from the copyright holders concerned.
This publication is available at https://www.gov.uk/government/statistics/women-and-the-criminal-justice-system-2019/women-and-the-criminal-justice-system-2019
We are trialling the publication of this statistical bulletin in HTML format alongside the usual PDF version and we are seeking user feedback on the use of HTML for the publication of statistical bulletins. Please send any comments to: datausers@justice.gov.uk.
1. Executive Summary
This publication compiles statistics from data sources across the Criminal Justice System (CJS), to provide a combined perspective on the typical experiences of females who come into contact with it. It considers how these experiences have changed over time and how they contrast to the typical experiences of males. No causative links can be drawn from these summary statistics, differences observed may indicate areas worth further investigation, but should not be taken as evidence of unequal treatments or as direct effects of sex. In general, females appear to be substantially underrepresented throughout the CJS compared with males. This is particularly true in relation to the most serious offence types and sentences, though patterns by sex vary between individual offences.
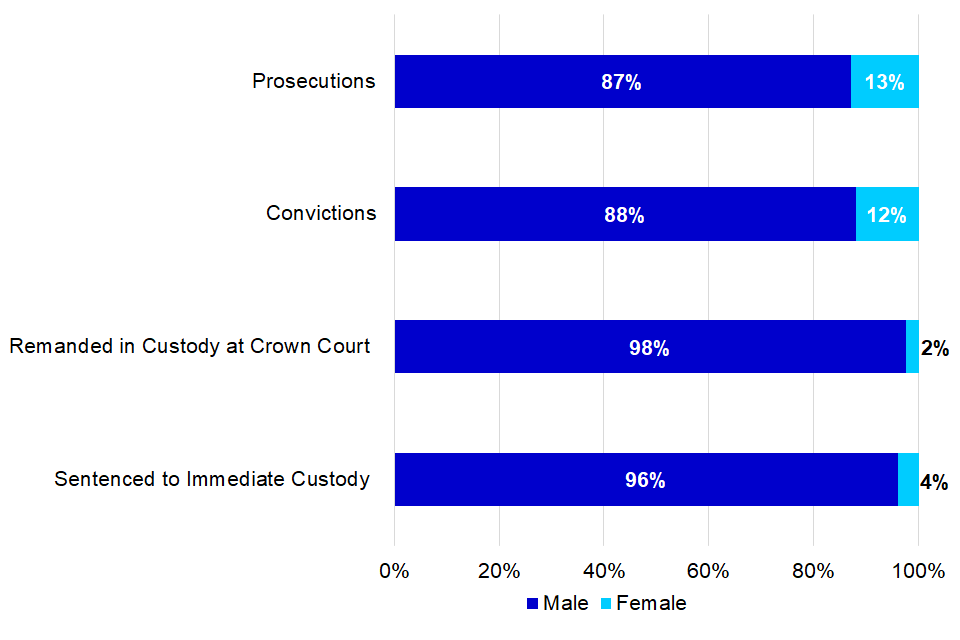
Figure 1.01: Proportions of males and females throughout the CJS, 2019
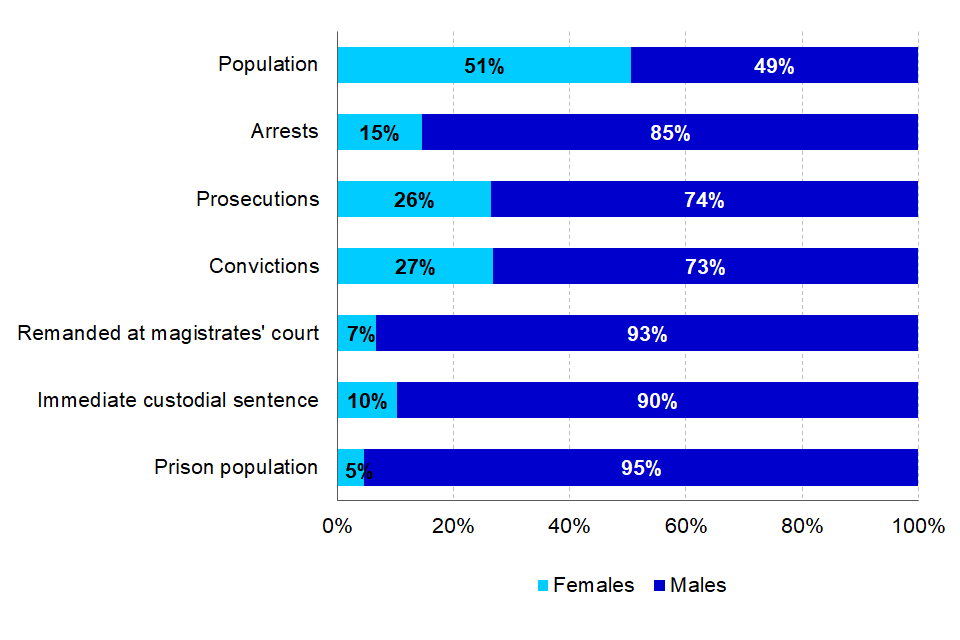
Proportions of males and females throughout the CJS, 2019
Victimisation
Males maintain higher risk of personal crime than females.
In 2019/20, 3.9% of males were victim to personal crime, compared to 3.4% of females. Overall personal crime rates continue to decrease from 2015/16.
The proportion of females experiencing domestic abuse in 2019/20 was 7.3%, double that of males (3.6%).
In 2018/19, 671 homicides took place; 64% of victims were male and 36% were female.
In homicides where the principal suspect was known to the victim, 67% of cases with female victims suspected the partner/ex-partner.
Police Activity
The majority (85%) of arrests continue to be accounted for by males in 2019/20.
The number of arrests has remained stable over the last 3 years following a previously downward trend.
In 2018/19, 21% of the 85,900 adults who engaged with liaison and diversion services were female.
Females in contact with the services more often had suspected alcohol misuse, financial needs, were abuse victims and had mental health needs compared to males.
Defendants
In 2019, 74% of individuals dealt with by the Criminal Justice System were male, and 26% were female.
These proportions have remained constant over the last 5 years.
Females were typically dealt with for less severe offences at court.
Of all female defendants prosecuted at court, 55% were prosecuted for summary non-motoring offences compared to 29% of male defendants in the latest year.
In 2019, the average custodial sentence length (ACSL) for male offenders was 19.7 months compared to 11.3 months for female offenders.
A greater proportion of female offenders are sentenced for offences that tend to receive shorter sentences.
Offenders under supervision or in custody
The majority (95%) of the prison population were male.
As at 30 June 2019, 5% of the prison population were female, this proportion has remained stable for the last 5 years.
Males were serving longer custodial sentence lengths.
As at 30 June 2019, 15% of females and 6% of males were serving sentences of less than 12 months.
In the 2019/20 HM Inspectorate of Prisons survey, females reported significantly more negative results for questions related to problems on arrival at prison.
Compared to males, a higher proportion of females reported: self-declared mental health problems, physical disability, having drug and alcohol problems, money worries and housing worries.
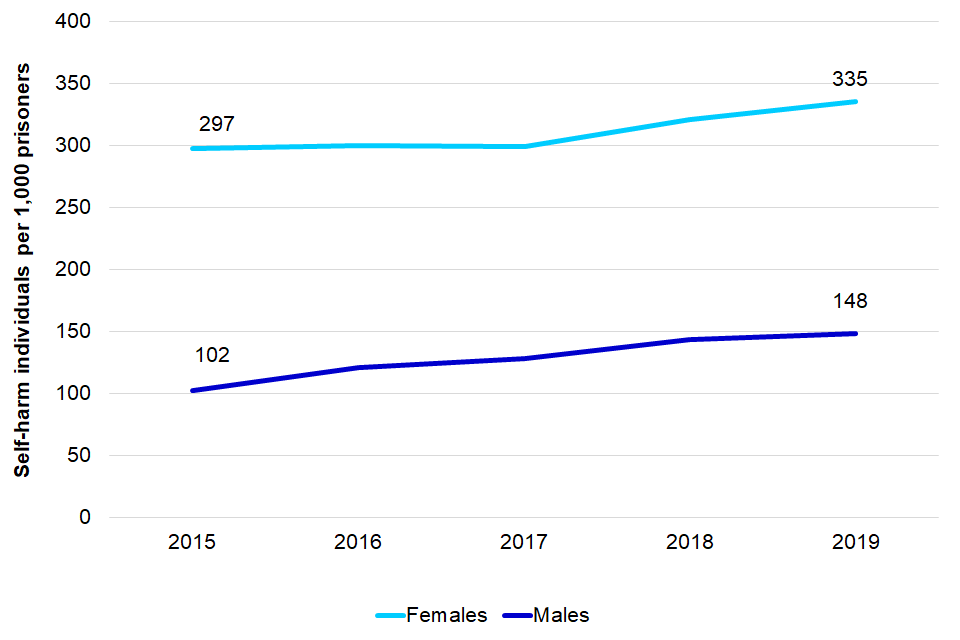
A higher proportion of female prisoners self-harmed in 2019.
In 2019, the number of individuals who self-harmed per 1,000 prisoners was 335 for females and 148 for males. Self-harm per individual was over twice as high for females at 9.3 instances, compared to 4.4 for males.
Offender characteristics
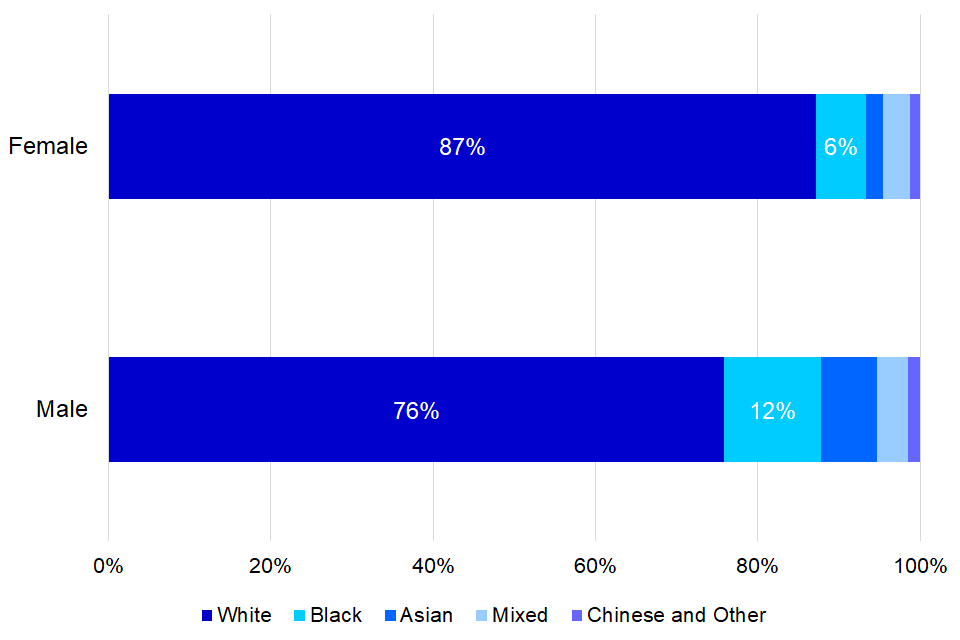
Ethnic minority groups accounted for a higher proportion of prosecutions against males compared to females.
In 2019, Black males were particularly over represented, accounting for 12% of all male prosecutions. This compared to Black females accounting for 6% of all female prosecutions.
The age distribution of female and male defendants is broadly similar.
For both sexes, the 30 to 39 age range represented the highest number of those prosecuted in 2019.
A higher proportion of female offenders were first time offenders, compared to males.
Of all female offenders cautioned or convicted in 2019, 35% were first time offenders, compared to 22% for males.
Females had a higher average number of reoffences per reoffender compared to males, at 4.33 and 3.99, respectively.
The proportion of all young offenders in the matched cohort that achieved 5 or more GCSEs (or equivalents) graded A* to C, including English and Maths, was slightly higher for the young female group, at 12%, compared to 10% for young males.
This was considerably lower than the proportion of pupils achieving this attainment level for the overall pupil population (including both offenders and non-offenders) in 2013/14 (62% for young females and 52% for young males) and 2014/15 (62% for young females and 53% for young males).
For both young males and young females that received a sentence/caution in the matched offender cohort, over half (57% of males and 61% of females) received Free School Meals (FSM).
This was higher than the proportion of pupils eligible for FSM in the overall pupil population (including both offenders and non-offenders) in 2013/14 and 2014/15 (14% for both young females and young males).
Offence analysis
TV licence evasion was the most common offence for which females were convicted in 2019.
In 2019, 74% of those convicted for TV licence evasion were female. This offence accounted for 30% of all female convictions, compared to 4% of male convictions.
Theft from shops was the most common indictable offence for which 34% of females and 14% of males were convicted in 2019.
Of the 34,300 defendants convicted for shoplifting, 9,600 (28%) were female. The custody rate for this offence was lower for female offenders (19%) than for males (26%).
Practitioners
Over the last 5 years, there have been increases in female representation across almost all CJS organisations and in the proportion of senior staff
The largest increase in female representation was seen in court judges by 5 percentage points, to 32%. Other increases included a 3 percentage point increase in both magistrates and HMPPS (excluding probation) to 56% and 40%, respectively. Female representation within MoJ and CPS remained constant.
2. Introduction
Section 95 of the Criminal Justice Act 1991 states that:
The Secretary of State shall in each year publish such information as they consider expedient for the purpose… of facilitating the performance of those engaged in the administration of justice to avoid discriminating against any persons on the ground of race or sex or any other improper ground…
Documents fulfilling this requirement have been published since 1992, in the form of statistical information. This report is a compendium of information from a range of data sources from across the CJS on the representation of females (and males) among victims, suspects, defendants and offenders. The publication aims to help practitioners, policy makers, academics and members of the public understand trends in the CJS in England and Wales, and how these vary between the sexes and over time.
This is the latest biennial compendium of Statistics on Women and the Criminal Justice System and follows its sister publication Statistics on Race and the Criminal Justice System published last year. Her Majesty’s Prison and Probation Service (HMPPS) Equalities report was also released on the same day as this report. In 2018, the Ministry of Justice published the Female Offender Strategy, which sets out the department’s vision and plan to improve outcomes for women in the community and custody. The strategy sets out the Government’s commitment to a new programme of work for female offenders, which will take some years to deliver, driven by our vision to see:
- fewer women coming into the criminal justice system and reoffending
- fewer women in custody, especially on short-term sentences, and a greater proportion of women managed in the community successfully; and
- better conditions for those in custody.
The strategy aims to take an evidence-based approach to reducing crime and rehabilitating offenders. The analysis in this report addresses the key subject areas and goes some way to provide an evidence base for monitoring progress and aiding policy making decisions for the future.
Limitations on conclusions
Although we explore differences between sexes, it is important that inferences are not made about individuals from group-level data – since we consider averaged outcomes that do not take into consideration the unique sub-set of circumstances in each case. Full details on data limitations and conclusion can be found in the technical guide.
Recording of sex
‘Sex’ can be considered to refer to whether someone is male or female based on their physiology, with ‘gender’ representing a social construct or sense of self that takes a wider range of forms.
Throughout this report we refer to sex rather than gender, because the binary classification better reflects how individuals are generally reported or managed through the CJS. For example, prisons are either male or female institutions, with prisoners normally placed based on their legally recognised gender. However, given the range of recording practises (see technical guide for details) throughout the CJS, it is likely that most recording includes a mixture of physiological and personal identity. Similarly, we refer to females / males and women / men in this report, as a reflection of the binary classification in use.
Data
Every effort is made to ensure that the figures presented are accurate and complete. However, these data have been extracted from large administrative and survey data systems generated by the courts, police forces and other agencies. As a consequence, care should be taken to ensure the limitations of these data are taken into account.
All results relate to England and Wales unless explicitly stated otherwise. Large figures are generally presented rounded to the nearest thousand, and percentages to the nearest percentage point in the bulletin text (or however is most appropriate).
Data are presented in terms of calendar and financial years (usually 2019 or 2019/20), reflecting the reporting cycles and data collection of the agencies contributing information for this publication. For example, data on arrests are presented in financial years, while data from courts is presented in calendar years.
A 5-year time series’ have been presented wherever possible, of whichever length is most appropriate in context. There are few comparisons to the population as a whole, but we have considered this to be 51% female, as based on Mid-year Population Estimates from the Office for National Statistics.
The statistics reported in this bulletin are primarily National Statistics[footnote 1], as drawn from either other published National Statistics bulletins or the data underpinning them. However, as in previous reports, in order to present as full a picture as possible we have also included some statistics that do not have this badging where National Statistics are not held on important or new topics. These include:
-
National liaison and diversion services data from NHS England
-
Survey data from Her Majesty’s Inspectorate of Prisons Annual Report
-
Youth Custody data (Official Statistics)
-
(New) Understanding Educational Background of Offenders (MoJ/ DfE data share)
Where a source is not National Statistics, users should consider this when making judgements about the weight that can be put on related findings.
Information provided
-
Supplementary Excel (in an Open .ods format) tables accompany the chapters, providing additional data where the figures have not previously been published (or not published in that form). Where figures have been published, links are provided as part of the text and tables.
-
A technical document titled A Guide to Statistics on Women and the Criminal Justice System is available alongside this report, which provides users with information on the concepts and terminology used within the report, as well as information about data sources, data quality and references.
-
This report is also accompanied by an infographic summarising key findings.
The overall style and composition of the report have also been changed to align with Statistics on Race and the Criminal Justice System 2018, with the intention of making it easier for readers to interpret the relative experiences of males and females throughout the CJS.
The Ministry of Justice would welcome any feedback on the content, presentation or on any other aspect of this bulletin – we can be contacted through: CJS_Statistics@justice.gov.uk
3. Victims
Males maintain higher risk of personal crime than females.
In 2019/20, 3.9% of males were victim to personal crime, compared to 3.4% of females. Overall personal crime rates continue to decrease from 2015/16.
The proportion of females experiencing domestic abuse in 2019/20 was 7.3%, double that of males (3.6%).
In 2018/19, 671 homicides took place; 64% of victims were male and 36% were female.
In homicides where the principal suspect was known to the victim, 67% of cases with female victims suspected the partner/ex-partner.
This chapter explores the nature, extent and risks of victimisation, as reported in the Crime Survey for England and Wales (CSEW): year ending March 2020[footnote 2][footnote 3][footnote 4][footnote 5], Homicide in England and Wales: year ending March 2019, and associated publications including Domestic abuse in England and Wales: year ending March 2019, and the Nature of Violent Crime in England and Wales: year ending March 2019.
Further information on other strands of defendants prosecuted for domestic abuse, rape and child abuse can be found in the CPS Quarterly Data Summaries – Quarter 4 2019/20[footnote 6].
Crime Survey for England and Wales
Risks of victimisation
In the year ending March 2020 (referred to as 2019/20 throughout), the proportion of adults who were victim of a CSEW crime (excluding fraud and computer misuse) was 13.3%, down from 14.9% the year before, with no significant difference between men and women. Male children reported a significantly higher proportion of being a victim of a CSEW crime at 9.0%, compared to 4.0% of females[footnote 7][footnote 8]. These figures had also reduced significantly from the previous year (males: 13.8%; females: 7.1%).
Perceptions of the Criminal Justice System
In 2019/20, there was a significant difference between males (63.4%) and females (57.3%) who perceived the Criminal Justice System to be fair, as seen in previous years. In the same year, 51.7% of adults perceived the Criminal Justice System as effective; this did not significantly differ between sexes. Comparisons with previous years are not possible due to changes in the order of questions asked influencing overall trends.
Personal crime[footnote 9]
In 2019/20, 3.9% of male adults reported being the victim once or more of a CSEW personal crime (excluding fraud and computer misuse; down from 4.5%). This was significantly higher than the 3.4% of female adult victims in the same year (no significant change from 3.7% the previous year).
Figure 3.01: Percentage of adults who were victims of personal crime, by type, year ending March 2019
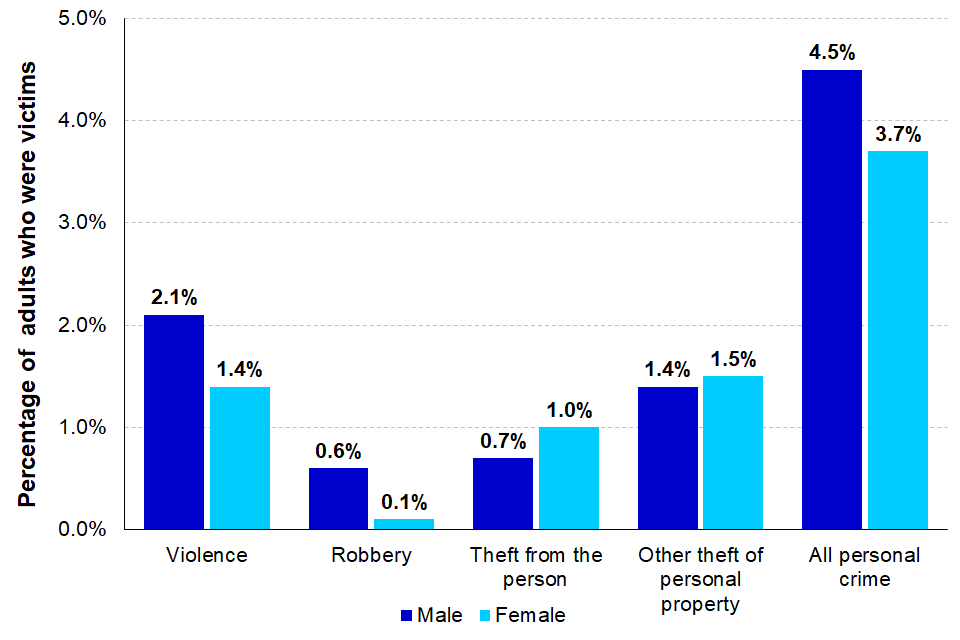
Percentage of adults who were victims of personal crime, by type, year ending March 2019
The CSEW 2018/19 provides the most recent breakdown of personal crime by offence (Figure 3.01)[footnote 10] . Males were significantly more likely to fall victim to violence and robbery compared to females, with a significant increase in male robbery victims since 2017/18. Significantly more females were victim to theft from the person, than males. Overall personal crime rates decreased significantly between 2018/19 and 2019/20. Adults of both sexes aged 16-24 reported the highest prevalence of personal crime in 2019/20, with the proportion generally /decreasing with increasing age.
Among children, 7.9% of males reported crimes against the person in 2019/20, significantly more than females did (3.7%).
Violent Crime
Violent crime was reported by a higher proportion of males (2.1%) than females (1.4%) in 2018/19. Similarly, males were twice as likely to be subjected to violence from a stranger (1.3%) than females (0.6%)[footnote 11][footnote 12].
Age
Violent crime was most prevalent in the 16-24 age group (Figure 3.02). The proportion of adults who experienced violent crime generally decreased with increasing age. The 75+ group was the only age group where prevalence of violent crime in highest among females. In 2019/20, 2.6% of all children were victims of violent crime. As with personal crime, a greater proportion of males were victims, than females (3.6% and 1.4%, respectively).
Figure 3.02: Percentage of adults who were victims of violent crime, by age group, year ending March 2019
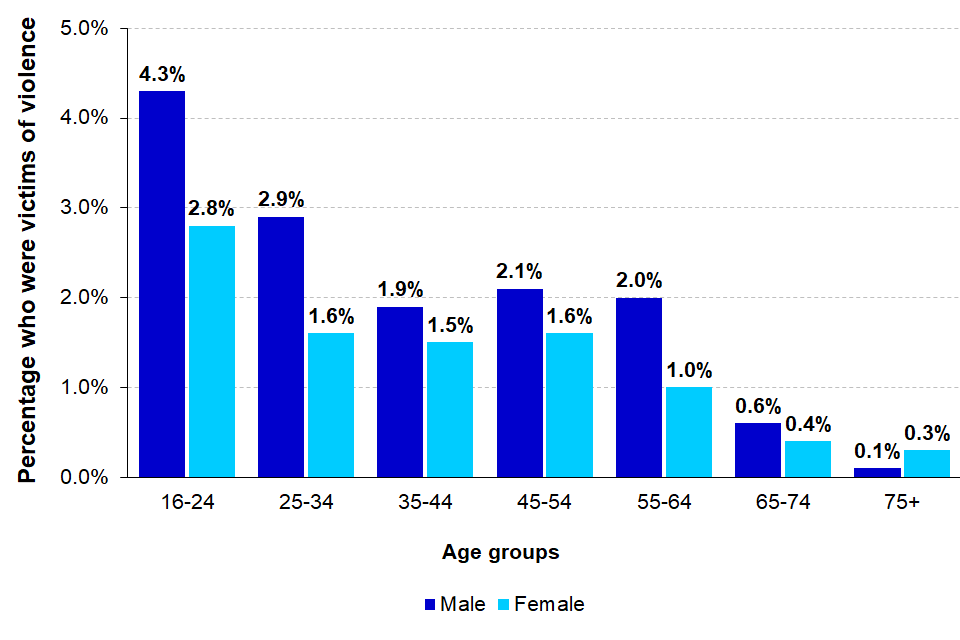
Percentage of adults who were victims of violent crime, by age group, year ending March 2019
Intimate violence
Intimate violence refers to a range of physical and non-physical abuse including domestic abuse, sexual assault and stalking. ‘Intimate’ reflects the nature of the relationship between victim and perpetrator or the nature or the abuse itself. Following past trends, females were disproportionately affected by all forms of intimate violence, according to CSEW data[footnote 13].
Sexual Assault[footnote 14][footnote 15]
In 2019/20, sexual assault towards females within the last year were over 4 times higher than towards males. Of all sexual offences, indecent exposure and unwanted touching had the highest prevalence rate. 2019/20 saw a fall in the prevalence of sexual assault in the last year for women aged 16 to 74 (3.7% in 2018/19 to 2.9% in 2019/20). This was driven by a decrease in prevalence of indecent exposure and unwanted touching, and rape excluding attempts. There was no significant difference in the prevalence of sexual assault in the last year among men aged 16-74 for 2019/20 (0.7%) compared to 2018/19.
Domestic abuse[footnote 16]
In 2019/20, 27.6% of females aged 16-74 reported being victims of domestic abuse once or more since age 16, double that of males (13.8%)[footnote 17]. Consistently, the proportion of females who reported experiencing domestic abuse in the last year (7.3%) was twice that of males (3.6%).
Over a three-year timeseries, a larger proportion of males aged 16-59 had experienced only one form of abuse in the last year (84.6%) compared to females the same age (77.9%)[footnote 18]. More females experienced two types of abuse (18.3%) than males (13.5%), often including domestic stalking. Females of all age groups were more likely to experience domestic abuse than males. Highest prevalence in females was seen in those aged 20-24 (15.1%), with younger males experiencing highest prevalence in the 16-19 age group (6.5%).
Homicide[footnote 19]
In 2018/19, 671 individuals were victims of homicide in England and Wales; 64% of which were males and 36%, females (Figure 3.03). The relative proportion of male and female victims has remained consistent over the last five years[footnote 20]. Female homicide victims were most often between 25-34 years old (17%). Male victims were comparatively younger, with equal proportions within the 16-24 and 25-34 age groups (both 22%). Male homicide victims had higher prevalence in all age groups, except those over 65, and 5-15, where females were more often the victim.
Method and Location
In 2018/19, the most frequent method of killing was ‘sharp instrument’ for both males (46%) and females (25%), accounting for 39% of all homicides, consistent with previous years. For females, this was followed by ‘strangulation, asphyxiation’ (17%), and, for males, ‘hitting, kicking, etc.’ (18%).
The majority of female homicides took place in or around a house/dwelling (71%), whereas only 39% of male homicides took place here. Males were proportionately more likely to be victims of homicide in public places, notably on the street (males: 30%; females: 6%). This reflects the difference in relationship to suspect in cases for men and women – with women much more likely to be killed by an acquaintance.
Relationship to Suspect and Circumstance
In homicides where the principal suspect was known to the victim, 67% of cases with female victims suspected the partner/ex-partner[footnote 21], whereas when the victim was male, only 9% of cases suspected the partner/ex-partner. In homicides with victims under the age of 16, where the principal suspect was identified, 31% of suspects were the parent (males: 21%; females: 42%).
Figure 3.03: Number of homicide offences currently recorded by the police, by sex of victim, 2008/09 to 2018/19
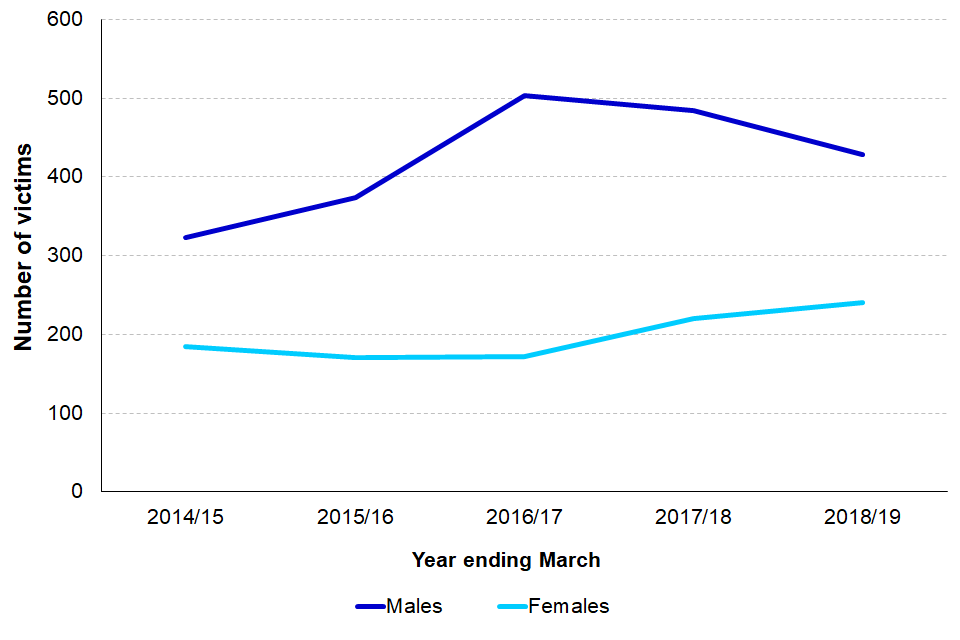
Number of homicide offences currently recorded by the police, by sex of victim, 2008/09 to 2018/19
4. Police Activity
The majority (85%) of arrests continue to be accounted for by males in 2019/20.
The number of arrests has remained stable over the last 3 years following a previously downward trend.
In 2018/19, 21% of the 85,900 adults who engaged with liaison and diversion services were female.
Females in contact with the services more often had suspected alcohol misuse, financial needs, were abuse victims and had mental health needs compared to males.
This chapter explores the activity of the police, by the sex of the suspect or offender they deal with. It covers statistics on arrests and detentions under the Mental Health Act (1983), which are published by the Home Office in the Police Powers and Procedures, England and Wales, year ending 31 March 2020 publication. There are also sections covering statistics on out of court disposals which come from the Criminal Justice Statistics Quarterly: December 2019, published by the Ministry of Justice, and experimental pilot data from national Liaison and Diversion services, as supplied by NHS England.
Arrests[footnote 22][footnote 23]
In 2019/20, 640,000 arrests were carried out by police in England and Wales, which has remained stable over the last 3 years following a previously downward trend. Females accounted for 15% of arrests, unchanged since 2015/16.
Age groups
The number of arrests has seen a larger percentage decrease for children than adults over the last 5 years, with decreases of 21% for adults and 27% for children since 2015/16. When split by sex, larger percentage decreases were seen over the last 5 years for female adults (25%) and children (31%) compared to males (21% and 26% respectively).
Figure 4.01: Number of arrests, by age group and sex, 2015/16 to 2019/20
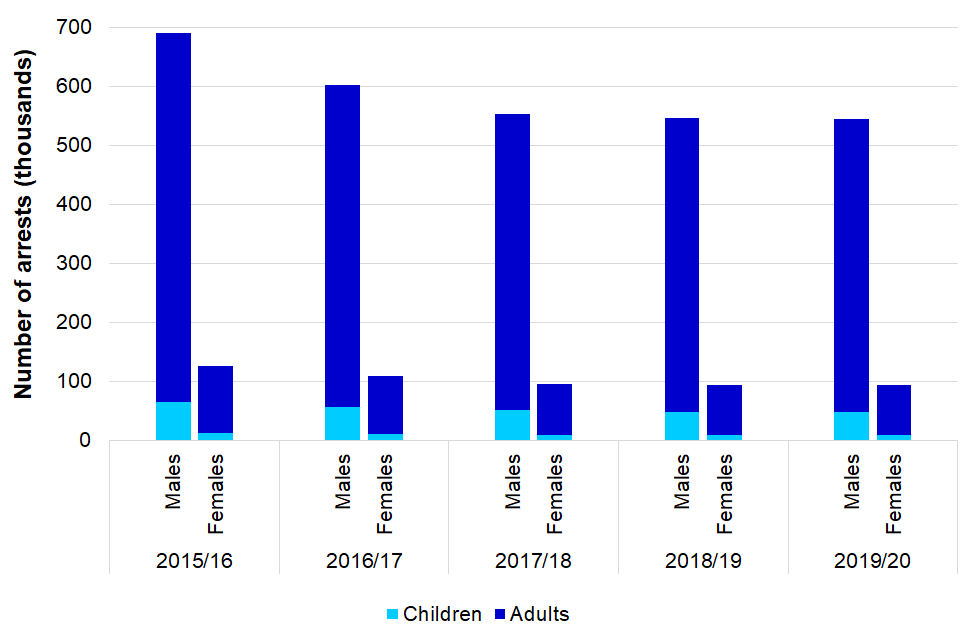
Number of arrests, by age group and sex, 2015/16 to 2019/20
Offence groups
In 2019/20, violence against the person and theft offences accounted for the largest proportion of arrests for both males and females. These offences accounted for a larger proportion of female arrests, whereas drug offences and sexual offences accounted for larger proportions of male arrests.
Figure 4.02: Proportion of arrests within each offence group, by sex, 2019/20
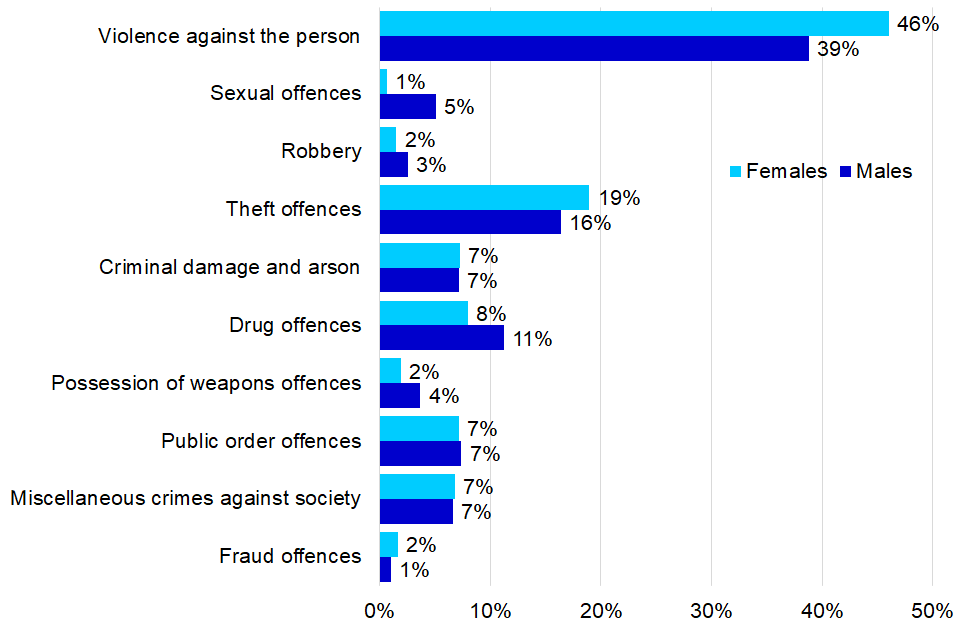
Proportion of arrests within each offence group, by sex, 2019/20
Detentions under section 136 of the Mental Health Act (1983)[footnote 25]
In 2019/20, 31,800 individuals were detained under section 136 of the Mental Health Act (1983) in England and Wales, a 2% increase when compared to the previous year[footnote 26]. Of the cases where the sex of the individual being detained was recorded, 45% were female and 55% were male.
Liaison and diversion services[footnote 27]
Adults
In 2018/19, a total of 85,900[footnote 28] adults engaged with liaison and diversion services, of which just over a fifth (21%) were females which is a higher proportion than those arrested (please see arrests section of this chapter). The main source of referral was police custody, accounting for 72% of males and 73% of females referred to liaison and diversion services.
The most common offence group[footnote 29] for those engaged with liaison and diversion services was violence against the person, for which a larger proportion of females were being dealt with compared to males (29% compared to 22%).
Higher proportions of females in contact with liaison and diversion services were suspected as having issues with alcohol misuse, had financial needs and were abuse victims. There was also a higher proportion of females with mental health needs, the majority of which were depressive illness which affected 25% of females compared to 20% of males.
Young people
In 2018/19, 12,300[footnote 30] young people engaged with liaison and diversion services, of which 19% were female. The main source of referral was the police, accounting for 60% of male and 68% of female young people.
As with adults, the most common offence group was violence against the person, for which 37% of female young people were being dealt with when referred to liaison and diversion services compared to 19% of male young people.
A higher proportion of young females were suspected as having issues with alcohol misuse, were identified at risk of suicide, self-harm or harm through personal neglect and in need of accommodation, education, employment or training. Mental health needs were higher for young females, the majority of which were for emotional and behavioural issues, affecting 31% of females and 18% of males.
Out of Court Disposals[footnote 31]
Penalty Notices for Disorder (PND)[footnote 32] issued
The number of PNDs issued has continued to decline over the last 5 years, falling from 47,400 in 2015 by 58% to 19,800 in 2019. The proportion of PNDs issued to females was stable at 22% until 2018 when it fell to 19% and then to 18% in 2019.
Figure 4.03: Number of Penalty Notices for Disorder issued, by sex, 2015 to 2019
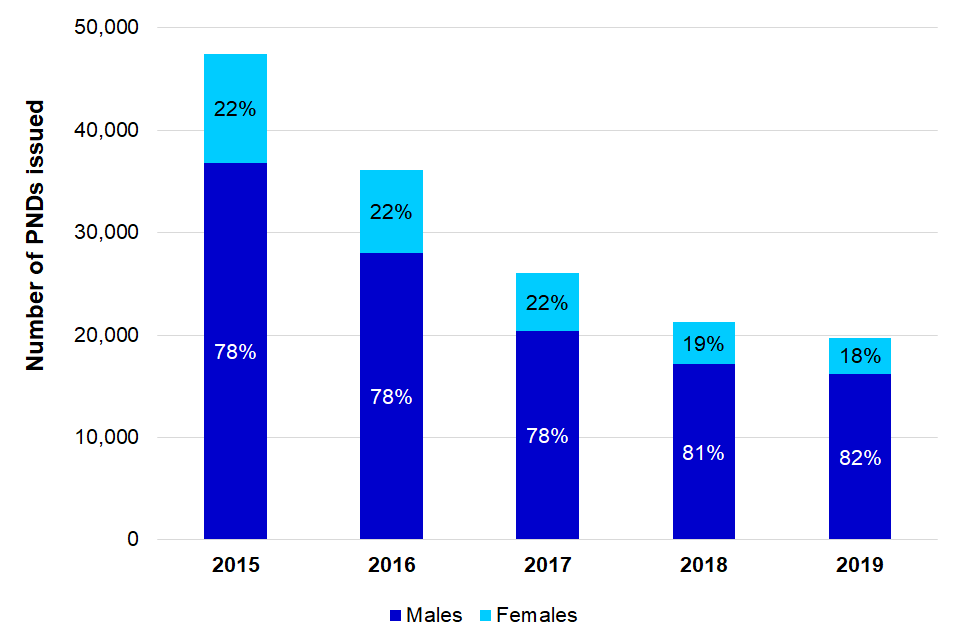
Number of Penalty Notices for Disorder issued, by sex, 2015 to 2019
Penalty Notices for Disorder - Offences
In 2019, the same proportion (98%) of PNDs issued were for higher tier offences for both males and females. 19.30This breakdown has remained relatively constant over the last 5 years.
Drunk and disorderly accounted for the highest proportion of PNDs issued for both males and females in 2019. In the latest year, a higher proportion of females were issued PNDs for theft (retail under £100) compared to males, whereas males were more often issued PNDs for possession of cannabis compared to females (see Figure 4.04).
Figure 4.04: Percentage of Penalty Notices for Disorder issued, by offence and sex, 2019
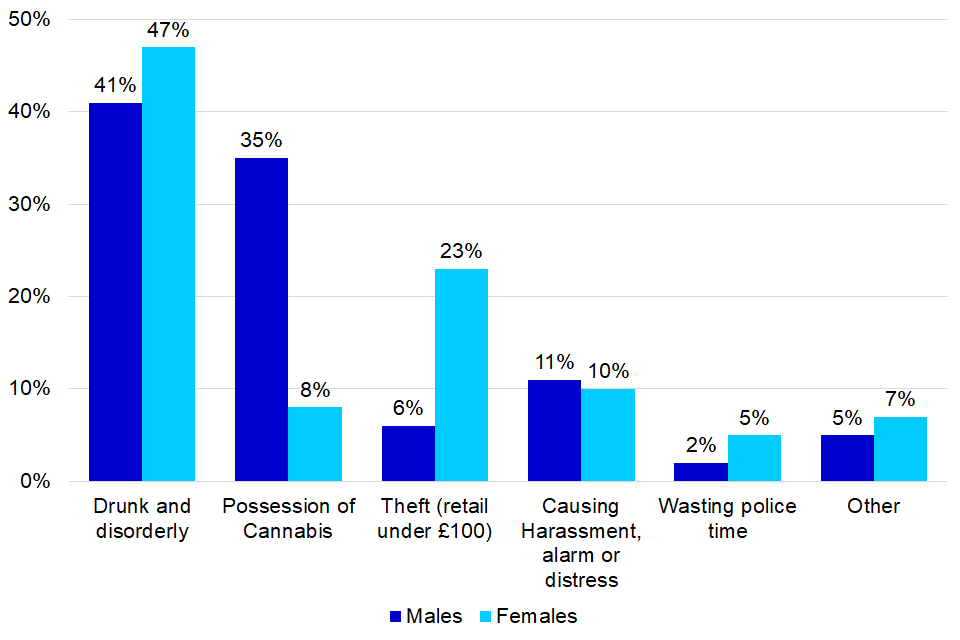
Percentage of Penalty Notices for Disorder issued, by offence and sex, 2019
Penalty Notices for Disorder - Payment
In 2019, 50% of PNDs were paid in full, and 35% resulted in a fine for late payment. A lower proportion of females paid their PNDs in full (47%) compared to males (51%) and had a slightly higher proportion of fines registered (36% compared to 35%).
Cautions issued[footnote 33][footnote 34] In 2019, 60,800 cautions were issued, 78% to males and 22% to females. The proportion issued to females has slightly decreased over the last 5 years, from 24% in 2015.
Figure 4.05: Number of cautions issued, by sex, 2015 to 2019
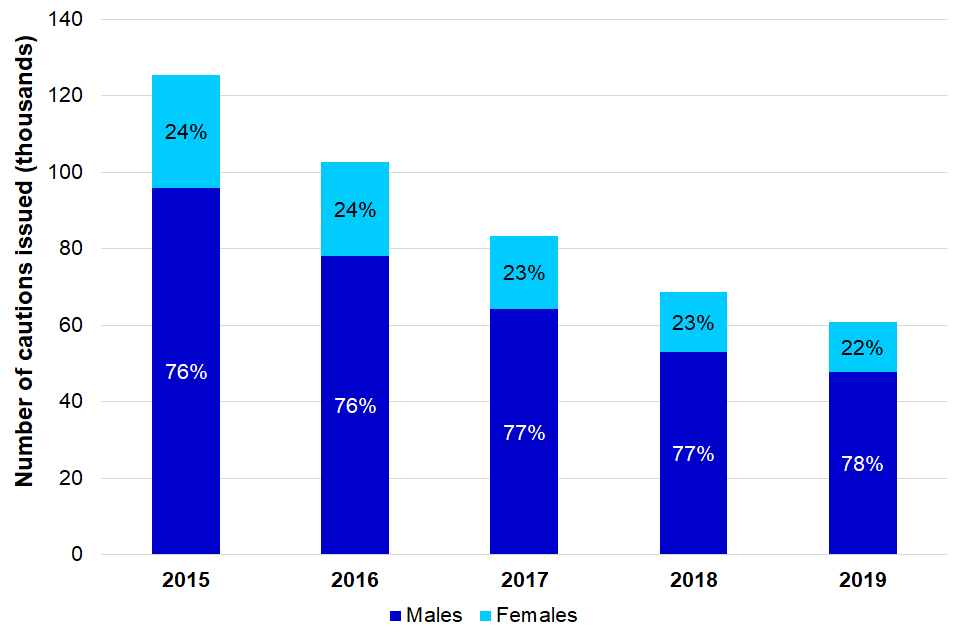
Number of cautions issued, by sex, 2015 to 2019
Cautions – Offences[footnote 35]
Of all cautions issued in 2019, 55% were for indictable offences, a proportion which has been increasing over the last 5 years, from 49% in 2015. The proportion of males issued a caution for indictable offences was 56%, compared to 52% for female offenders. As with PNDs, a larger proportion of female offenders were cautioned for theft offences (19% compared to 10% for males) whereas a larger proportion of male offenders were cautioned for drug offences (27% compared to 13% for females).
Cautioning rates[footnote 36]
The overall cautioning rate has been gradually decreasing over the last 5 years, from 18% in 2015 to 11% in 2019, and has been consistently lower for females than males, at 7% for females and 11% for males in 2019. Females had a higher cautioning rate for indictable offences (20%) and a lower rate for summary offences (4%) compared to males (14% and 9% respectively) in 2019.
5. Defendants
In 2019, 74% of individuals dealt with by the Criminal Justice System were male, and 26% were female.
These proportions have remained constant over the last 5 years.
Females were typically dealt with for less severe offences at court.
Of all female defendants prosecuted at court, 55% were prosecuted for summary non-motoring offences compared to 29% of male defendants in the latest year.
In 2019, the average custodial sentence length (ACSL) for male offenders was 19.7 months compared to 11.3 months for female offenders.
A greater proportion of female offenders are sentenced for offences that tend to receive shorter sentences.
This chapter explores outcomes for defendants in the Criminal Justice System (CJS) predominantly drawing on data from the Criminal Justice Statistics quarterly: December 2019 publication. Other sources in this chapter include Criminal Courts Statistics and Legal Aid Statistics. When a suspect is formally charged, they are brought before a magistrates’ court (as a defendant) as soon as possible. Following prosecution, defendants found guilty are subsequently convicted and sentenced. The defendant can be directed to appear in court or remanded on bail or custody.
Figure 5.01: The journey of males and females through the CJS, 2019
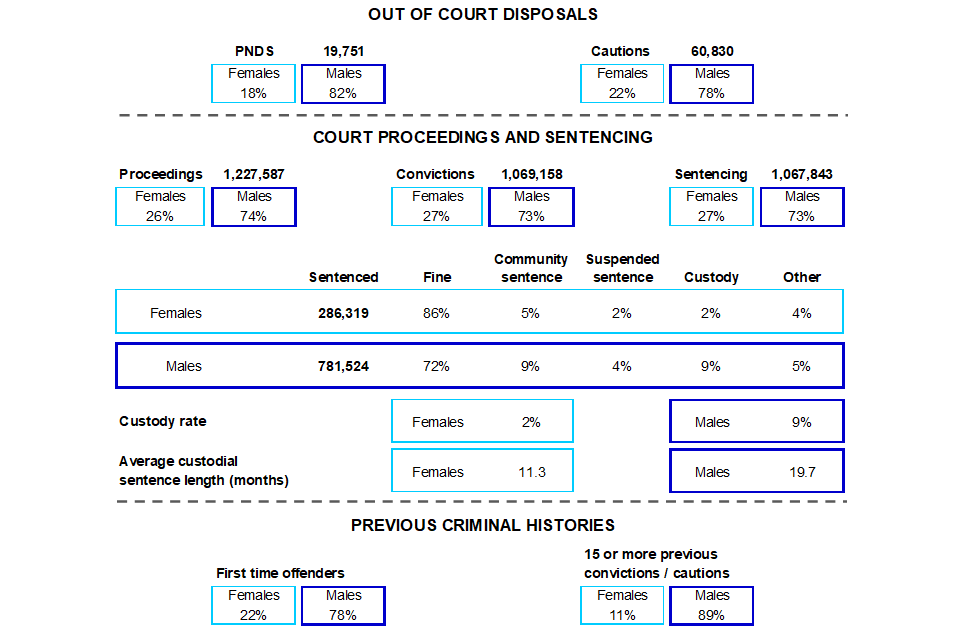
The journey of males and females through the CJS, 2019
Individuals[footnote 37] formally dealt with by the Criminal Justice System (CJS)[footnote 38]
In 2019, 341,000 females (26%) and 968,000 (74%) males were formally dealt with by the CJS, either by an out of court disposal (OOCD) or court proceedings. Over the last 5 years, the number of individual formally dealt with has decreased but the proportions have remained constant.
Figure 5.02: Individuals dealt with formally by the CJS, by sex, 2015 to 2019
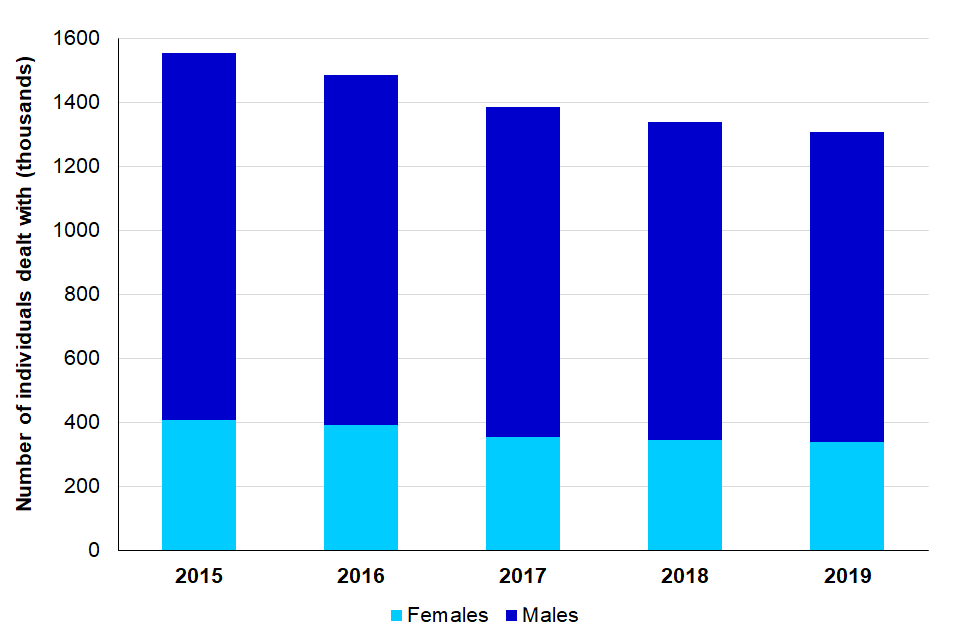
Individuals dealt with formally by the CJS, by sex, 2015 to 2019
Prosecutions[footnote 39]
Just over a quarter (26%) of all prosecutions were for female defendants in 2019, which has remained stable over the last 5 years.
Similar falls have been seen in the number of defendants prosecuted over the last 5 years when broken down by sex; the number of prosecutions for male defendants fell by 11% to 904,000 in 2019 and prosecutions for female defendants fell by 12% to 324,000 in 2019.
In 2019, over half (55%) of the prosecutions for female defendants were for summary non-motoring offences, compared to under a third (29%) of male defendants. A higher proportion of males were proceeded against for indictable offences (22%) compared to females (10%). Over the last 5 years, the proportion of prosecutions for summary non-motoring offences has been decreasing for both male and female defendants, offset by increases in both indictable and summary motoring offences.
Figure 5.03: Number of defendants proceeded against at magistrates’ courts, by offence type and sex, 2015 to 2019
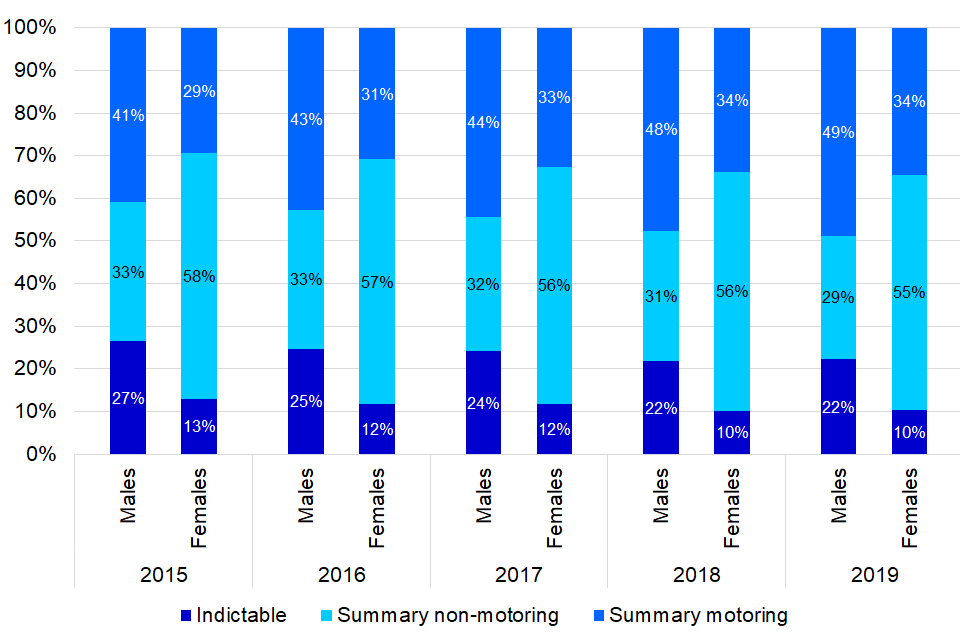
Number of defendants proceeded against at magistrates’ courts, by offence type and sex, 2015 to 2019
Prosecuting authority[footnote 40]
In 2019, 26% of the 1.25 million defendants of known sex that had a completed case were female. Of all female prosecutions, 56% were brought forward by a prosecuting authority other than the police, compared to 23% for male defendants. This has remained broadly stable since 2015.
Figure 5.04: Proportion of the defendants brought to magistrates’ court by prosecuting authority and sex, 2019
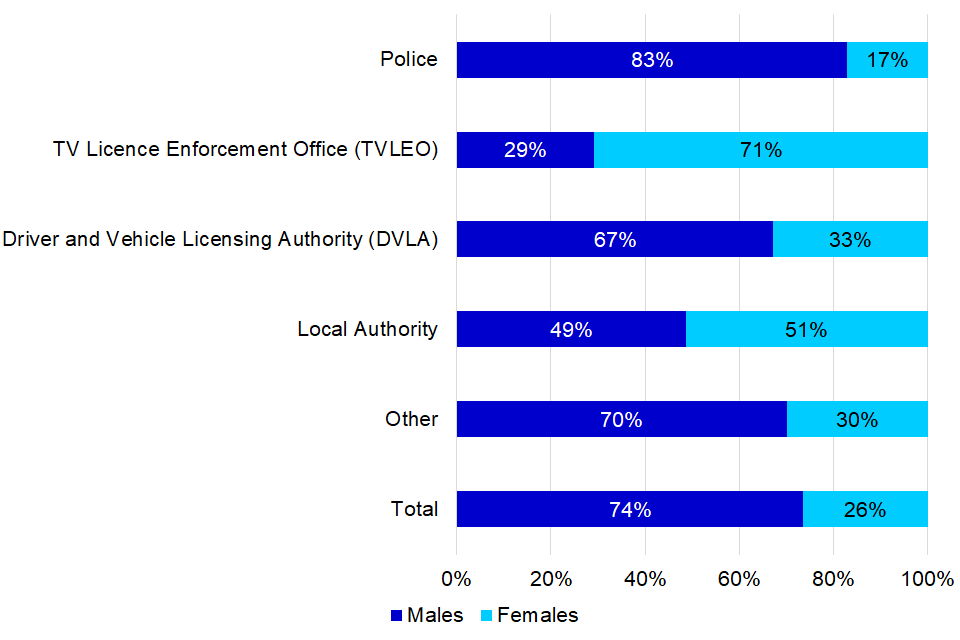
Proportion of the defendants brought to magistrates’ court by prosecuting authority and sex, 2019
The number of TVLEO prosecutions has decreased for both female (down 30%) and male (down 37%) defendants since 2015, although the decrease between 2018 and 2019 was negligible compared to previous years.
In 2019, females accounted for the highest proportion of Local Authority prosecutions for the first time since 2016. This can be explained by a 7% rise for females and a 4% fall for males between 2018 and 2019.
Criminal Legal Aid
Criminal legal aid consists of legal advice and representation provided to people being investigated or charged with a criminal offence, covering police stations, prisons, and the courts. Crime higher concerns legal representation in the Crown Court and above. Crime lower covers work carried out by legal aid providers regarding police station advice, magistrates’ court work and prison law.
In 2019, 15% of the total crime lower legal aid workload was for female clients and this proportion has remained stable over the last 5-year period[footnote 41]. The proportion of female legal aid recipients in the Crown Court was lower with 10% of the crime higher legal aid workload in 2019[footnote 42].
Figure 5.05: Crime lower legal aid workload by sex and legal aid category, 2019
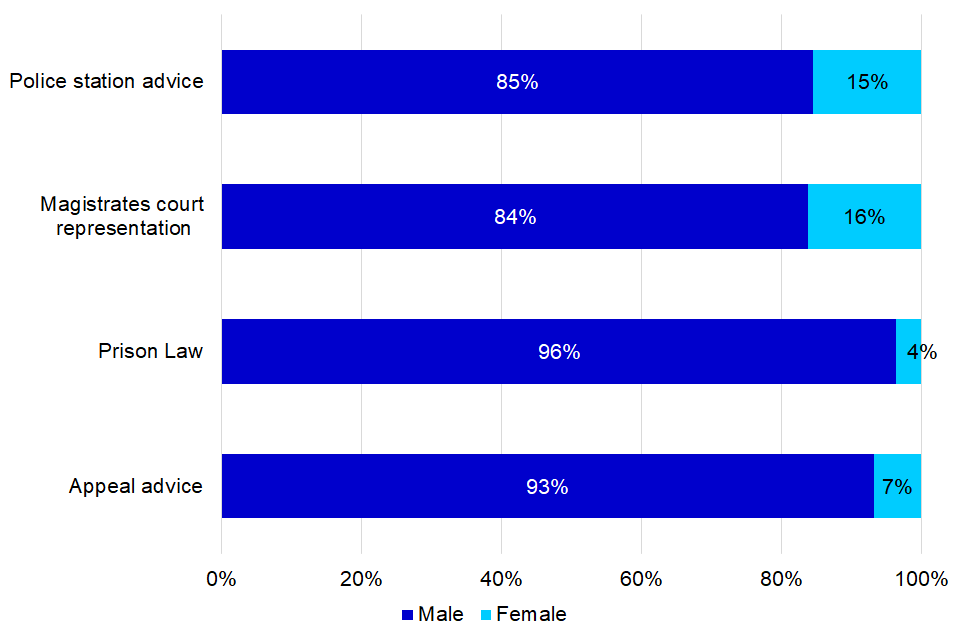
Crime lower legal aid workload by sex and legal aid category, 2019
Police station advice and magistrates’ court representation constitute the majority of the total crime lower work load (97%). Police station advice alone accounts for 71% of the workload for both sexes in 2019, increasing from around 60% since 2012.
Prison law comprised less than 1% of the female and 3% of the male workload; both proportions have remained steady in the last 5 years but reflect falling prison population figures.
In the Crown Court, 90% of crime higher legal aid work related to male clients. This proportion has remained very similar over the last 5-year period. As with crime lower, there has been a decreasing trend in the volume of crown court legal aid.
Crown Court cases
In 2019[footnote 43], the majority of defendants for triable-either-way cases that were sent to the Crown Court were sent on the direction of the magistrate (85%). This proportion was slightly less for females (83%), than for males (85%).
In 2019, 15% of males and 17% females elected to be tried at the Crown Court. Between 2015 and 2019 there was a rise in proportion of defendants electing to be tried at the Crown Court, up 7 percentage points for females and 8 percentage points for males.
Representation at the Crown Court
Following changes to the administrative systems at the Crown Court that completed in September 2019, estimates of defendants’ representation status at the Crown Court are not available for this release. It has not been possible to accurately replicate the existing methodology and produce robust estimates in time for this release following changes to the way that data are recorded.
It is our intention to develop and test a new methodology that maintains our high professional standards and ensures that accurate, consistent series are available to all. We will provide further updates regarding the availability of a consistent back series in subsequent Criminal Court Statistics publications[footnote 44].
Plea at the Crown Court[footnote 45]
A consistently lower proportion of female defendants entered a guilty plea over the last 5 years, at 66% in 2019 compared to 71% of male defendants.
Females also consistently had a higher guilty plea rate for indictable offences. In 2019, the guilty plea rates for indictable-only offences were 57% for males and 61% for females, and for triable-either-way offences they were 74% for males and 67% for females.
Convictions
The proportion of convicted offenders who were female was 27% in 2019 and has remained stable over the last 5 years.
The conviction ratio has been consistently higher for female offenders over the last 5 years, and was 88% in 2019, compared to 87% for males. Conviction ratios were higher for summary offences and as a higher proportion of female offences were summary, this in part explains the higher conviction ratio for female offenders.
Remands[footnote 46][footnote 47]
Police and pre-court remand
In 2019, 1.29 million defendants[footnote 48] were directed to appear at magistrates’ courts (including those who failed to appear). Over the last 5 years, a higher proportion of males were bailed or remanded in custody. A higher proportion of female defendants were not remanded by police, which may be due in part to the different types of offences for which females and males are prosecuted and hence the risk they are perceived as representing. The increasing trend for both male and female defendants who were not remanded and bailed by police has stabilised with small changes in the latest year.
Magistrates’ court remand
Remands at magistrates’ court followed similar trends to police remands over the last 5 years, with lower proportions of female defendants bailed or remanded in custody.
Figure 5.06: Remand status at magistrates’ courts, by sex, 2015 to 2019
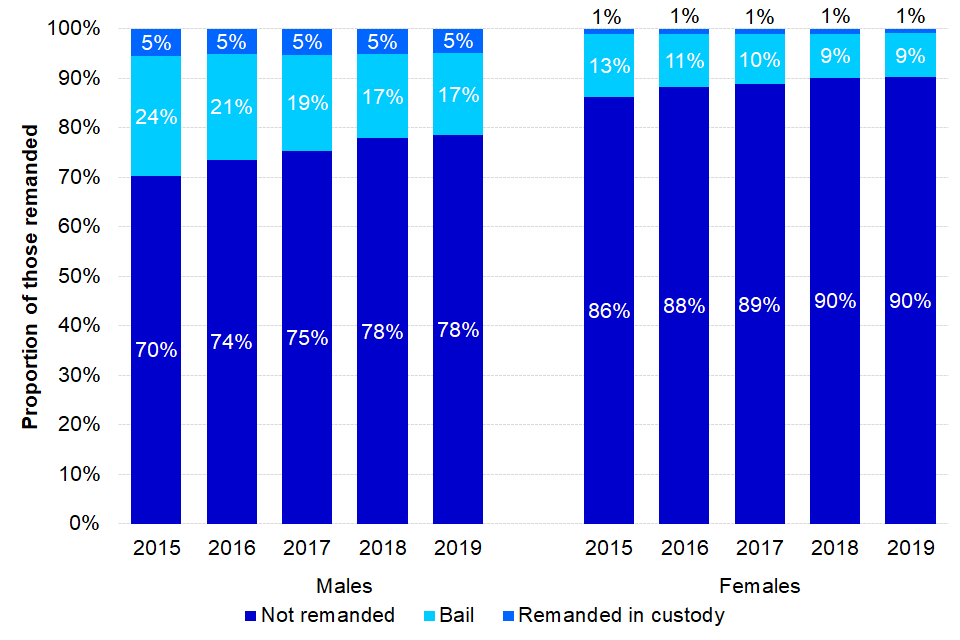
Remand status at magistrates’ courts, by sex, 2015 to 2019
Of those remanded in custody at magistrates’ court in 2019, 65% of male defendants were sent for trial or sentencing at Crown Court, compared to 50% of female defendants. This is reflected in the higher proportion of females remanded in custody who were sentenced to immediate custody at magistrates’ court, 17% in 2019 compared to 13% for males.
Crown Court remand
Over the last 5 years at Crown Court, there was a steady increase in the proportion of both male and female defendants who were not remanded, with a gradual increase of the proportion remanded in custody, offset by a decrease in the proportion of those bailed.
In contrast to what is seen for police and magistrates’ courts remand, females consistently had a higher proportion than males to be bailed at the Crown Court. This difference is likely to be linked to the greater seriousness of offences typically dealt with at the Crown Court.
Figure 5.07: Remand status at Crown Court, by sex, 2015 to 2019
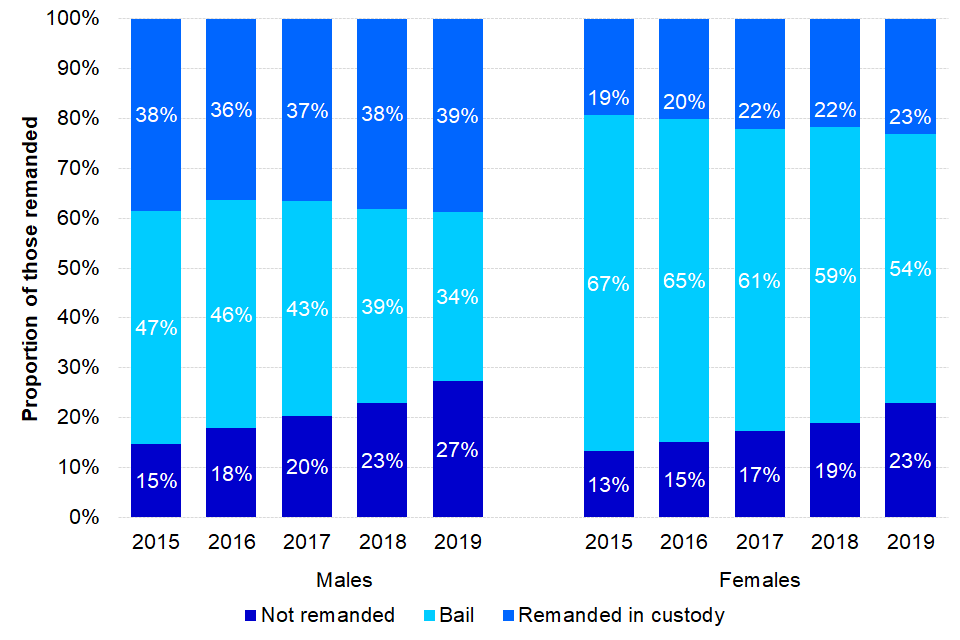
Remand status at Crown Court, by sex, 2015 to 2019
Outcomes for defendants remanded in custody at Crown Court
Of those remanded in custody at Crown Court in 2019, 76% of male offenders were sentenced to immediate custody compared to 60% of females. Over the last 5 years, these proportions have been gradually increasing. Compared to male offenders, a larger proportion of females were given suspended sentences.
Case Management[footnote 49]
Effectiveness of trials
The proportion of ineffective and cracked trials was higher for females (20% and 37%) than males (16% and 33%) in 2019. Consequently, there is a lower proportion of effective trials for females (43%) compared to males (50%).
Timeliness[footnote 50]
In 2019, the median average days from the offence to the completion of the criminal case was 153 days for females and 162 for males. This is a slight rise in median offence to completion from 2015 for females of 2% (150 days) and a larger rise of 9% for males (149 days).
- Between 2015 and 2019 the median time from offence to charge increased for both females and males to varying degrees, up 10% and 33% respectively. The median time from charge for first listing decreased for females (down 12%) but increased for males (up 15%).
The median offence to completion for all individual offence groups is higher for females than males except for violence against the person and theft offences.
-
The biggest difference between males and females in median days from offence to completion is the 102 days more (25%) for females in fraud offence cases, which can be explained by the 108 days higher offence to charge for females in comparison to males.
-
The largest percentage difference is for drug offences which have a median offence to completion that is 47% higher (49 days) for females in comparison to males. This is true for all stages of timeliness for drug offences.
Figure 5.08: Median number of days from offence to completion, by offence group and sex, 2019
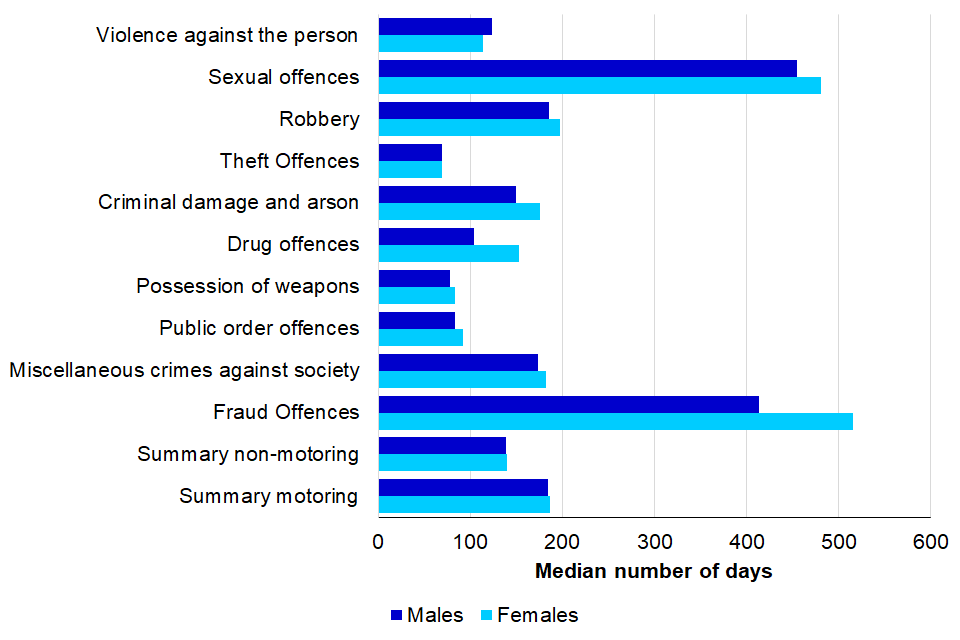
Median number of days from offence to completion, by offence group and sex, 2019
Pre-sentence reports[footnote 51]
In 2019, sentences for female offenders had a higher level of concordance with their pre-sentence report (excluding ‘Other’) (66%) than male offenders (59%). In the same period, 16% of court reports prepared were for females, a proportion which has remained consistent in the last five years.
In 2019, 43% of all PSRs were written, fast delivery PSRs[footnote 52] (females 39%, males 44%). At 53%, oral fast delivery PSRs[footnote 53] were more common, especially for females (females 60%, males 52%), while standard PSRs[footnote 54], which are given for more serious offences, were much less common and were given proportionally more often to male offenders (4%) compared with female offenders (1%). This aligns with the differences in the types of offence males and females were typically prosecuted for, as discussed in Chapter 8: Offence Analysis.
The overall level of concordance between sentences proposed and sentences given (excluding ‘Other’) has fallen from 74% in 2017 to 68% in 2018 and was 60% in 2019. In 2019, the highest level of concordance (excluding suspended sentence orders) for both males and females was in custodial sentences, at 89% for males and 79% for females[footnote 55].
Figure 5.09: The level of concordance between sentences proposed and outcomes for female and male offenders, by sentence type, 2019[footnote 56]
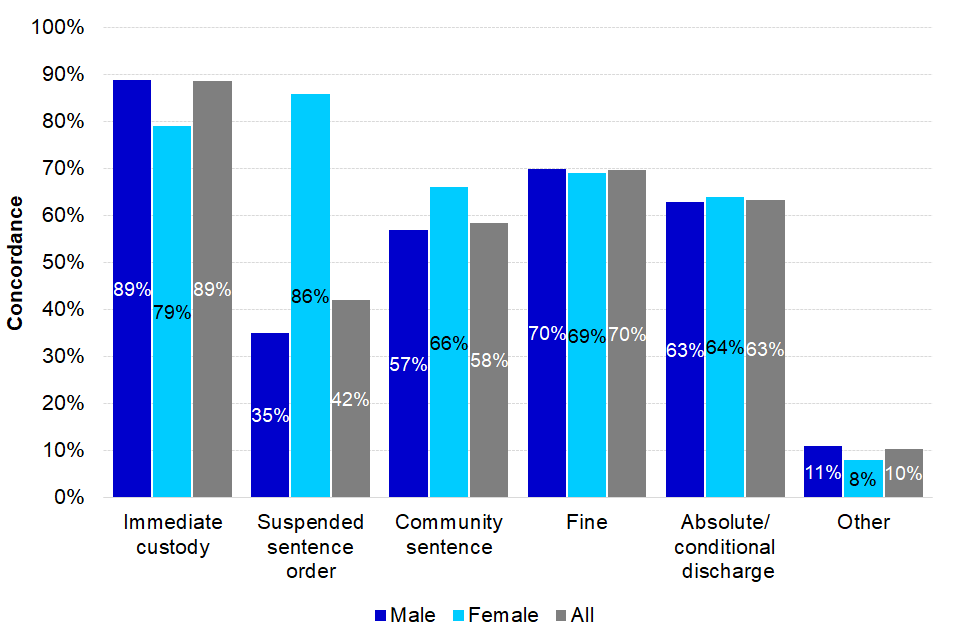
The level of concordance between sentences proposed and outcomes for female and male offenders, by sentence type, 2019
Sentencing[footnote 57]
In 2019, 1.07 million offenders were sentenced, of which 27% were female, a proportion which has remained stable over the last 5 years.
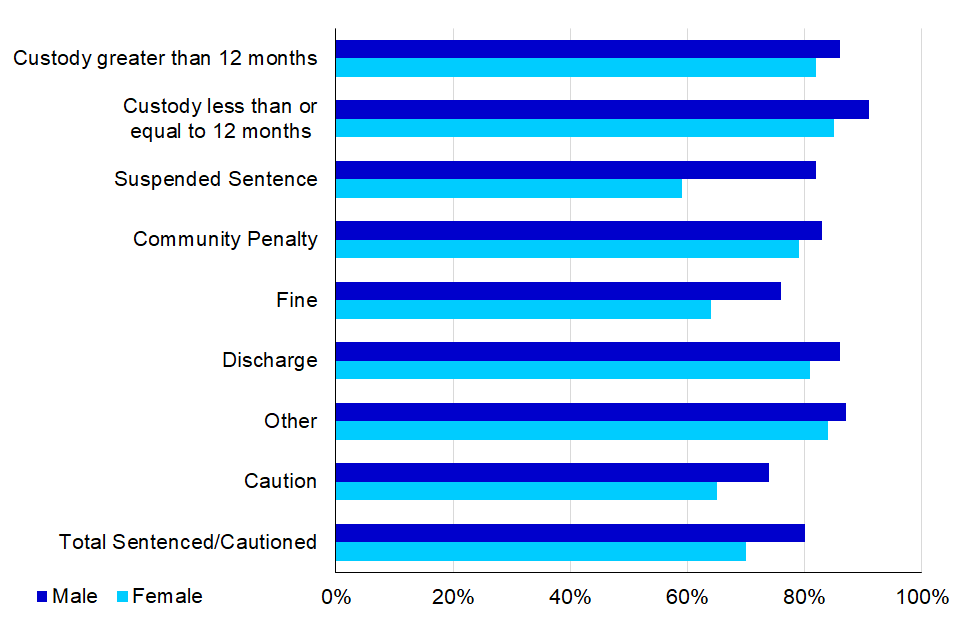
In 2019, fines were the most common sentence given to both male and female offenders sentenced at all courts, but females typically had less severe sentencing outcomes. Of those sentenced, a consistently higher proportion of female offenders were fined and had a lower average fine than male offenders over the last 5 years.
In 2019, 86% of female offenders were sentenced to a fine with an average fine of £230, compared to 72% of male offenders with an average fine of £302. Compared to male offenders, a larger proportion of female offenders were prosecuted for summary offences, which may account for this difference.
Figure 5.10: Proportion of offenders sentenced, by sentencing outcome and sex, 2019
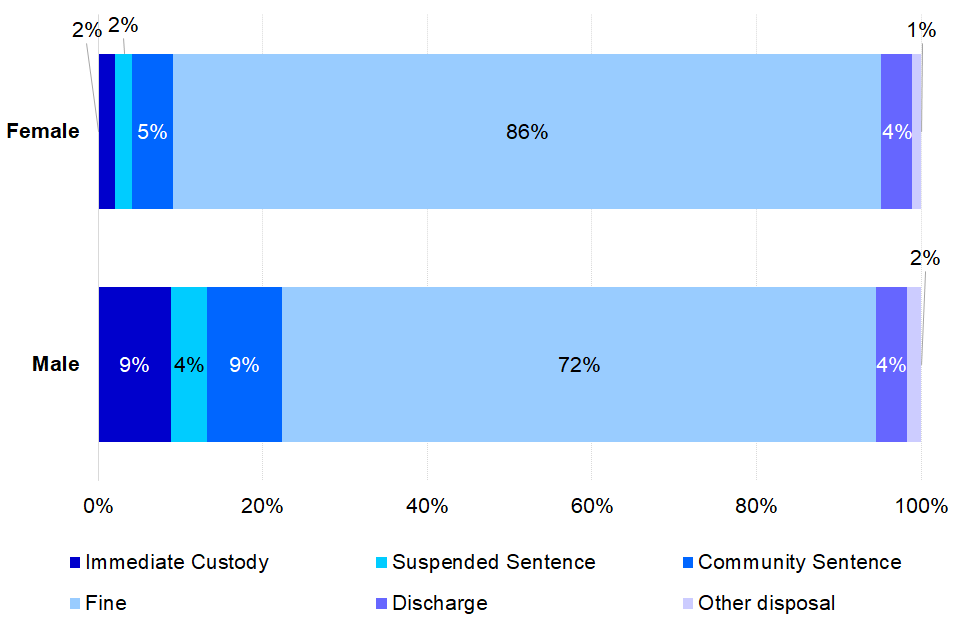
Proportion of offenders sentenced, by sentencing outcome and sex, 2019
Sentencing outcomes for indictable offences
In 2019, a smaller proportion of female offenders were sentenced for indictable offences at 10%, compared to 22% of male offenders.
When comparing sentencing outcomes for male and female offenders, a consistently larger proportion of male offenders receive custodial sentences whereas larger proportions of female offenders receive community sentences or a conditional discharge.
Figure 5.11: Proportion of offenders sentenced for indictable offences, by sentencing outcome and sex, 2019
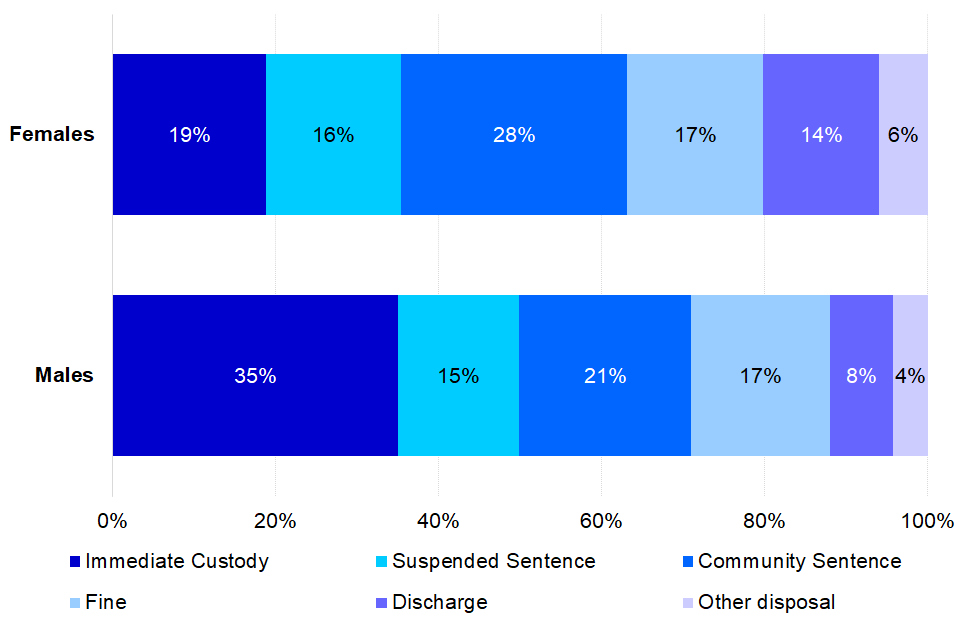
Proportion of offenders sentenced for indictable offences, by sentencing outcome and sex, 2019
Sentence lengths and average custodial sentence length (ACSL)
In 2019, 50% of female offenders who were sentenced to custody received sentences of up to and including 3 months, compared to 31% of males and these proportions have been decreasing for both female and male offenders over the last 5 years.
Figure 5.12: Proportion of offenders sentenced to immediate custody, by custodial sentence length and sex, 2019[footnote 58]
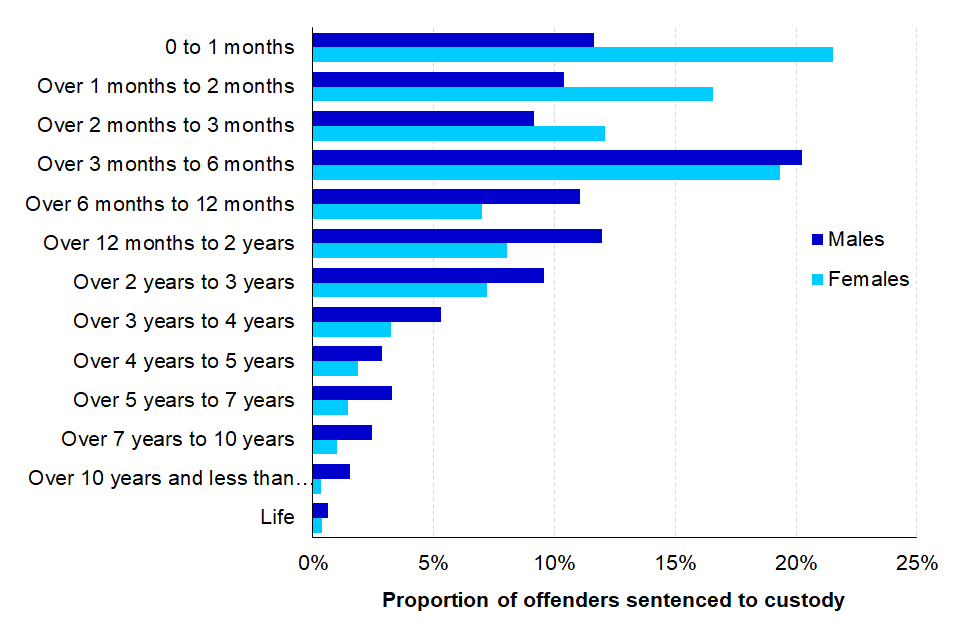
Proportion of offenders sentenced to immediate custody, by custodial sentence length and sex, 2019
The ACSL for male offenders in 2019 was 19.7 months compared to 11.3 months for female offenders. This is driven in part by a higher proportion of female offenders getting sentenced for offences that tend to receive shorter sentences.
The overall ACSL (where sex is known) has been increasing over the last 5 years, from 16.3 months in 2015 to 19.0 months in 2019.
Figure 5.13: Average custodial sentence length, by sex, 2015 to 2019
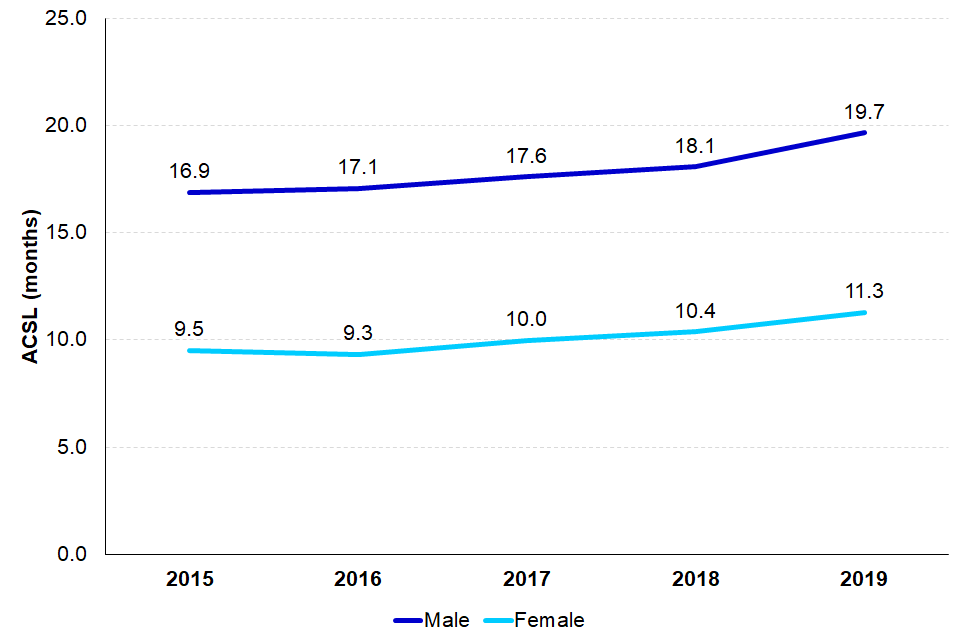
Average custodial sentence length, by sex, 2015 to 2019
6. Offenders under supervision or in custody
The majority (95%) of the prison population were male.
As at 30 June 2019, 5% of the prison population were female, this proportion has remained stable for the last 5 years.
Males were serving longer custodial sentence length.
As at 30 June 2019, 15% of females and 6% of males were serving sentences of less than 12 months.
In the 2019/20 HM Inspectorate of Prisons survey, females reported significantly more negative results for questions related to problems on arrival at prison.
Compared to males, a higher proportion of females reported: self-declared mental health problems, physical disability, having drug and alcohol problems, money worries and housing worries.
A higher proportion of female prisoners self-harmed in 2019.
In 2019, the number of individuals who self-harmed per 1,000 prisoners was 335 for females and 148 for males. Self-harm per individual was over twice as high for females at 9.3 instances, compared to 4.4 for males.
This chapter (largely drawing from the ‘Offender Management statistics Quarterly’) provides statistics relating to offenders in custody or under supervision in the community, by sex. Topics include: Prison Population, Youth Custody, Unsentenced prison remand population, Sentences served in prison (type and length) Receptions and Releases, Her Majesty’s Inspectorate for Prisons (HMIP) survey[footnote 59], Self-harm in custody, Probation (Community Orders and Suspended Sentence Orders).
Further information on the following topics related to offender management is available online: Substance Misuse Treatment Programmes, Offender Learning, Safety in Custody, Deaths in or following police contact, Discipline in Prison Establishments (Adjudications), Restricted Patients, Home Detention Curfew, Release on Temporary License, Licence Recalls.
The HMPPS Offender Equalities report 2019/20 (released on the same day as this report) also includes information on: Mother and Baby units, Sexual Orientation in the Prison Population, Accredited Programmes, Incentives and Earned Privileges and Electronic Monitoring.
Prison population
The total prison population as at 30 June 2019[footnote 60] was 82,700. Females represented 5% of the prison population and this proportion has remained stable over the last five years.
As at June 2019, the female prison population was 3,800 and has decreased 3% over the last 5 years, compared to 78,900 for the male prison population (decreasing 4% over the same time period).
Figure 6.01: Prison population, by sex, June 2015 to June 2019
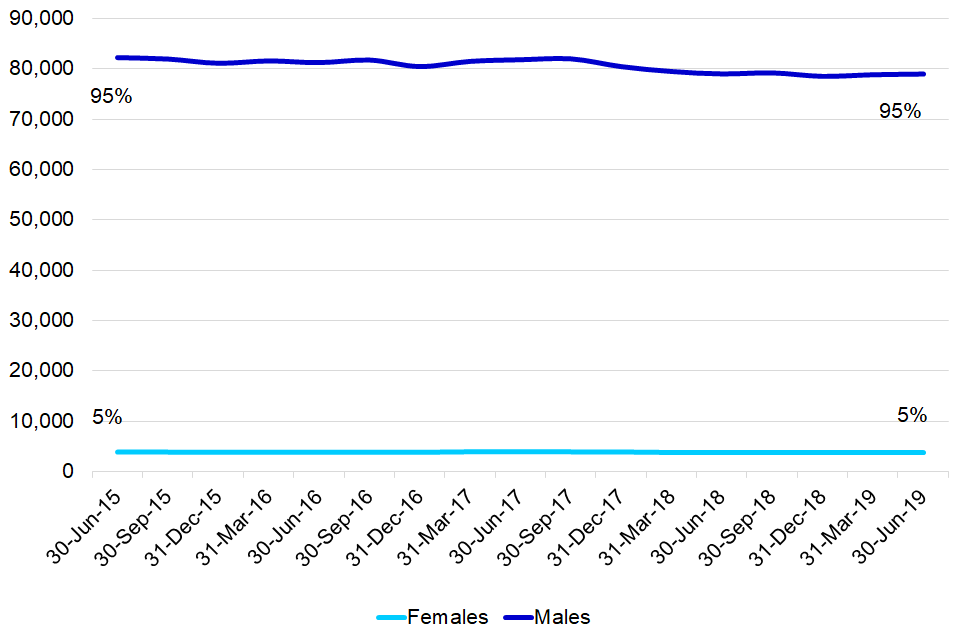
Prison population, by sex, June 2015 to June 2019
Unsentenced remand prison population
As at 30 June 2019, there were 9,100 prisoners held on remand (unsentenced), 6% of the prison population held on remand were female and this proportion was stable over the last 5 years.
Youth secure estate
In June 2019, the number of children and young people up to 18 years old in secure estates[footnote 61] was 885, of which 3% were female. This proportion has remained stable over the last 5 years (June 2015 – June 2019) despite the overall fall of 18% in the under 18 custody population.
Prison receptions[footnote 62] and releases[footnote 63]
In 2019, there were 72,200 first receptions into prison, of which 90% were male and 10% were female. Of the 62,800 offenders released from prison sentences in 2019, 91% were male and 9% female. This proportions differ from the total prison population, which were 95% and 5% respectively. This difference is driven by female offenders receiving shorter average custodial lengths than males.
Sentences served in prison
Of the sentenced prison population, sentences can be divided into two broad groups: determinate sentences which are for a fixed period, and indeterminate sentences (these include life sentences and indeterminate sentences for public protection – IPPs).
As at 30 June 2019, 13% of the sentenced male prison population were serving indeterminate sentences compared to 11% of the female population.
As at 30 June 2019, the sentence length profile of males and females under a determinate sentence differs, with a higher proportion of females (15%) serving sentences of less than 12 months, compared to 6% of males[footnote 64] (influenced by custodial sentencing in Chapter 5: Defendants and offence mix in Chapter 7: Offence Analysis).
Figure 6.02: Proportion of prisoners serving immediate custodial sentences by sentence length, sex, June 2019
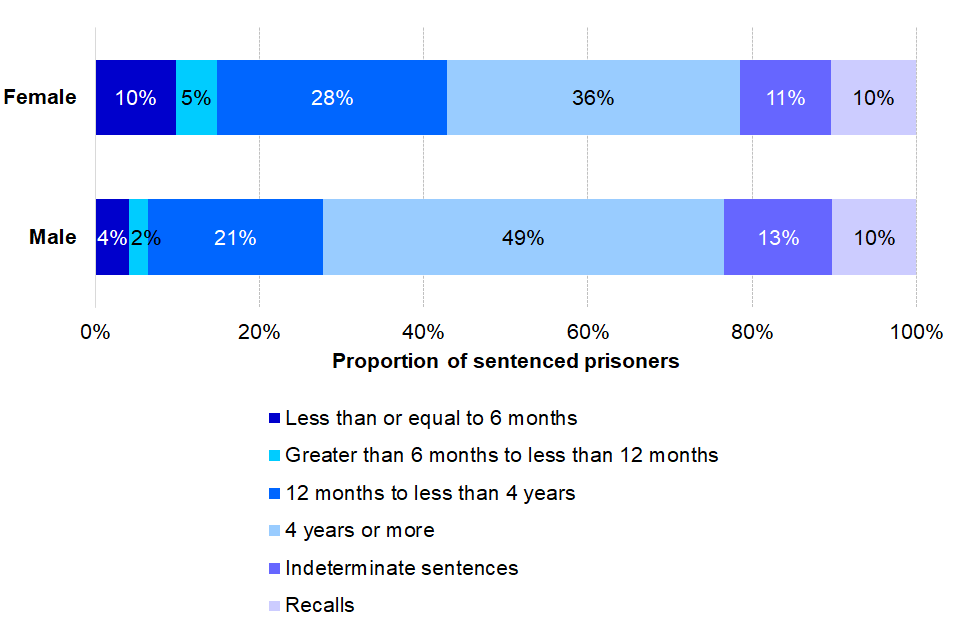
Proportion of prisoners serving immediate custodial sentences by sentence length, sex, June 2019
Her Majesty’s Inspectorate for Prisons (HMIP) Survey
Her Majesty’s Inspectorate of Prisons (HMIP) for England & Wales aims to ensure independent inspection of places of detention, report on conditions and treatment, and promote positive outcomes for those detained and the public. The HMIP Annual Report 2019/20 identifies differences in reported prison experiences between male and female prisoners[footnote 65].
In 2019/20, 7,002 prisoners completed the survey of which 694 were female. Compared to males, a significantly higher proportion of females reported: self-declared mental health problems, physical disability, having drug and alcohol problems, money worries and housing worries. A higher proportion of females also reported having a child under 18.
Once in prison, females generally reported a better experience when: on arrival, on the first night, induction and life on the wing. Despite this, a higher proportion of females reported verbal abuse, threats and bullying from other prisoners.
Females reported better conditions and facilities than males regarding: having their own cell, clean clothes, clean sheets, relationships with staff and contacting family and friends. Females reported that it was harder for family and friend to visit them in prison (this may be due to there being fewer female prisons so the average distance from home is greater).
Self-harm in prison
Self-harm in prison custody is defined as ‘any act where a prisoner deliberately harms themselves irrespective of the method, intent or severity of any injury.’ In the last 5 years, females consistently had a higher proportion of prisoners who self-harmed and a higher number of instances of self-harm per 1,000 prisoners[footnote 66].
In 2019, the number of individuals who self-harmed per 1,000 prisoners was 335 for females and 148 for males[footnote 67]. Instances of self-harm per individual was over twice as high for females at 9.3, compared to 4.4 for males.
Figure 6.03: Number of Self-harm individuals in prison per 1,000 prisoners by sex, 2015 to 2019
Number of Self-harm individuals in prison per 1,000 prisoners by sex, 2015 to 2019
Probation
This section looks at offenders starting supervision as a result of a court order, including those starting supervision as a result of a community order or a suspended sentence order[footnote 68].
In 2019, females made up 17% of offenders issued community orders and 14% of suspended sentence orders (with requirements). These proportions have remained stable for the last 5 years.
As with custodial sentences, females on average received shorter community orders (11.6 months) and suspended sentence orders (16.6 months) on compared to males (at 12.5 and 17.3 months respectively).
7. Offender characteristics
Ethnic minority groups accounted for a higher proportion of prosecutions against males compared to females.
In 2019, Black males were particularly over represented, accounting for 12% of all male prosecutions. This compared to Black females accounting for 6% of all female prosecutions.
The age distribution of female and male defendants is broadly similar.
For both sexes, the 30 to 39 age range represented the highest number of those prosecuted in 2019.
A higher proportion of female offenders were first time offenders, compared to males.
Of all female offenders cautioned or convicted in 2019, 35% were first time offenders, compared to 22% for males.
Females had a higher average number of reoffences per reoffender compared to males, at 4.33 and 3.99, respectively.
The proportion of all young offenders in the matched cohort that achieved 5 or more GCSEs (or equivalents) graded A* to C, including English and Maths, was slightly higher for the young female group, at 12%, compared to 10% for young males.
This was considerably lower than the proportion of pupils achieving this attainment level for the overall pupil population (including both offenders and non-offenders) in 2013/14 (62% for young females and 52% for young males) and 2014/15 (62% for young females and 53% for young males).
For both young males and young females that received a sentence/caution in the matched offender cohort, over half (57% of males and 61% of females) received Free School Meals (FSM).
This was higher than the proportion of pupils eligible for FSM in the overall pupil population (including both offenders and non-offenders) in 2013/14 and 2014/15 (14% for both young females and young males).
This chapter looks at the interaction between sex and other key characteristics throughout the Criminal Justice System including, ethnicity, age, offending history, and reoffending. This chapter also includes analysis on the educational attainment and overall educational background of offenders through a data sharing exercise between MoJ and DfE.
Ethnicity[footnote 69][footnote 70][footnote 71]
Prosecutions
Ethnic minority groups accounted for a higher proportion of prosecutions against males compared to females.
In 2019, Black males were particularly over represented, accounting for 12% of all male prosecutions. This compared to Black females, accounting for 6% of all female prosecutions White female defendants accounted for 87% of all female prosecutions, and this has been broadly stable since 2015.
Figure 7.01 Proportion of prosecutions for indictable offences by sex and ethnic group, England and Wales, 2019
Proportion of prosecutions for indictable offences by sex and ethnic group, England and Wales, 2019
Conviction ratio
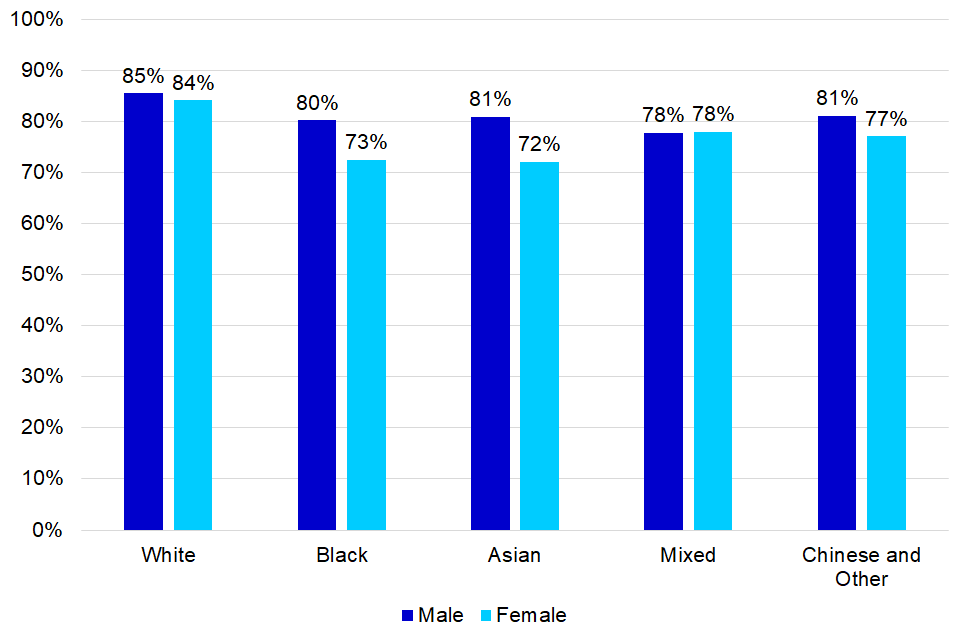
Of all ethnic groups, both White female and White male offenders had the highest conviction ratios[footnote 72] for indictable offences at 84% and 85%, respectively, a trend that has remained broadly stable since 2015.
Figure 7.02 Conviction ratios for indictable offences by sex and ethnic group, England and Wales, 2019
Conviction ratios for indictable offences by sex and ethnic group, England and Wales, 2019
Remands[footnote 73][footnote 74]
Of the females remanded in custody at the Crown Court for indictable offences in 2019, 80% were White, 10% were Black, 4% were Asian, 5% were Mixed and 2% were Chinese and Other. In comparison, 21,500 males were remanded in custody at the Crown Court for indictable offences: 72% of these were White, 14% were Black, 7% were Asian, 4% were Mixed and 2% were Chinese and Other.
Sentencing
Of all females sentenced in 2019, Black female offenders had the highest custody rate[footnote 75] at 23%. The custody rate ranged between 20% and 23% across all female ethnic groups. The custody rate for male offenders was highest for Chinese and Other at 37%. The other ethnic groups all had the same custody rate of 35%.
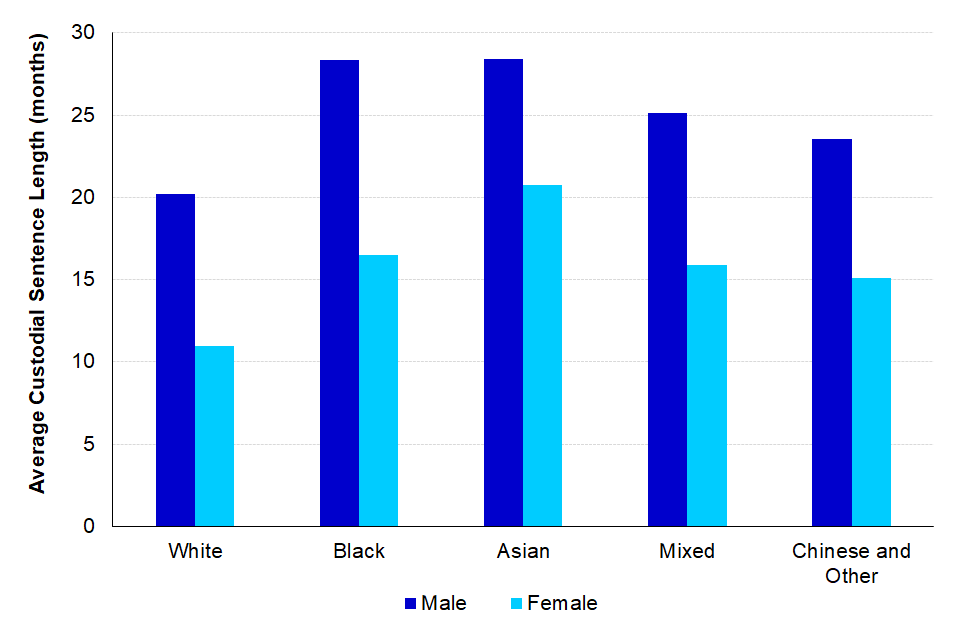
Average Custodial Sentence Length (ACSL)
Since 2015, the ACSL for indictable offences has risen for both male and female offenders from all ethnic groups[footnote 76]. Consistently, White females and males had the shortest ACSL while Asian females and males had the longest ACSL for indictable offences in 2019 at 20.8 months and 28.4 months, respectively.
Figure 7.03: Average Custodial Sentence Lengths (ACSL) for indictable offences by sex and ethnic group, England and Wales, 2019
Average Custodial Sentence Lengths (ACSL) for indictable offences by sex and ethnic group, England and Wales, 2019
In 2019, prosecutions by age distribution of males and female defendants was broadly similar, with the majority of defendants concentrated between the ages of 18 and 59. For both sexes, the 30 to 39 age range represented the highest number of those prosecuted in 2019. For each age range from 21 and over, males consistently had a larger number of prosecutions (approximately three times more).
Figure 7.04: Age distribution of male and female defendants, England and Wales, 2019
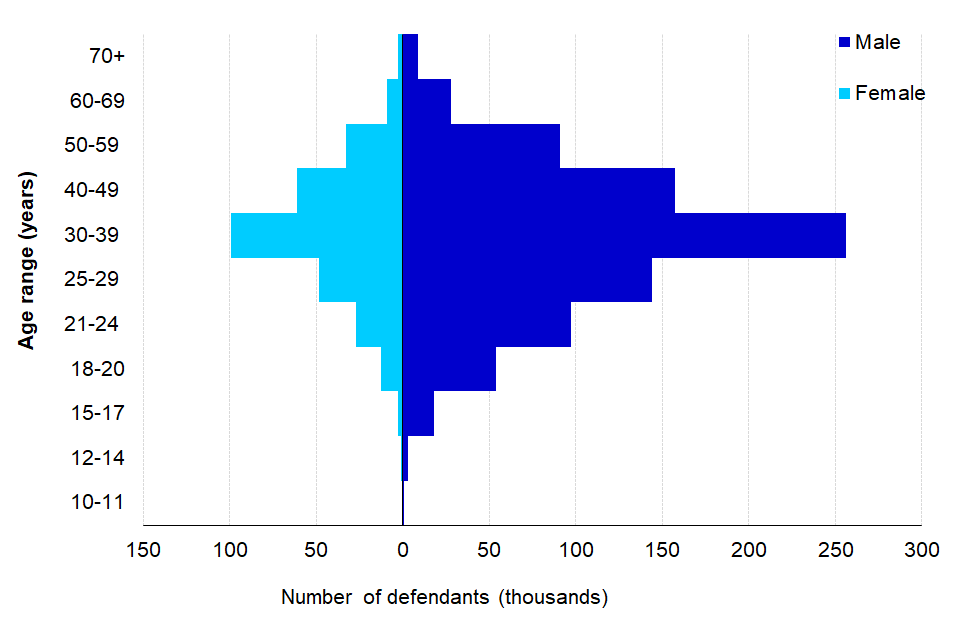
Age distribution of male and female defendants, England and Wales, 2019
Children[footnote 79]
The following section discusses child offenders at different stages of the Criminal Justice System. Reference will usually be made to ‘children’ by which we refer to individuals aged 10 to 17 years of age[footnote 80][footnote 81]. It should be noted that because children comprise less than 10% of all offenders prosecuted for an indictable offence (where sex and age of the defendant is known), trends should be interpreted with caution.
Figure 7.05: Proportion of children in the Criminal Justice System, by sex, England and Wales, 2019
Proportion of children in the Criminal Justice System, by sex, England and Wales, 2019
Prosecutions
In 2019, the proportion of children prosecuted for indictable offences that were females was 10%. This proportion was 5 percentage points lower than the proportion of adult females that were prosecuted for indictable offences, at 15%.
The number of children prosecuted for indictable offences has fallen by 29% since 2015, compared to the 25% decrease seen in adult prosecutions. Between 2015 and 2019, female children saw the largest decline, a decrease of 35% in prosecutions, compared to a 29% decrease for male children that were prosecuted over the same period.
Conviction ratio[footnote 82]
The overall child conviction ratio for indictable offences remained broadly stable since 2015, at 70%. The conviction ratio for female children in 2019 was 67%, 4 percentage points lower than in 2015 and 3 percentage points lower than the male child conviction ratio (70%) in 2019.
Remands
In 2019, 46% of children remanded at Crown Court for indictable offences were remanded in custody. The proportion of female children remanded in custody (17%) was lower than male children (48%). A higher proportion of female children were remanded on bail (72%) than male children (38%).
Custody Rate and Average Custodial Sentence Length (ACSL)[footnote 83]
In 2019, 96% of child custodial sentences were given to male children[footnote 84]. For both sexes, the child custody rate has remained broadly stable since 2015, at 8% for males and 2% for females. It is important to note that the number of female children receiving custodial sentences was lower than males (approximately 50 females compared to 1,100 males).
In 2019, male children had an ACSL of 19.1 months and female children had an ACSL of 19.0 months.
Offending Histories[footnote 85][footnote 86]
First Time Offenders
A first time offender is an offender who has been arrested by police in England or Wales; and who has received a first conviction, caution or youth caution for any offence[footnote 87] recorded on the Police National Computer. For example, an offender who had a conviction or caution outside England and Wales and was arrested by a police force in England and Wales would be counted as a first time offender. In this section any analysis is conducted where the gender of the offender is known.
First time offenders accounted for 24% of offenders who were cautioned or convicted In England and Wales in 2019, of which 78% were male and 22% females[footnote 88]. Of all female offenders cautioned or convicted in 2019, 35% were first time offenders, compared to 22% for males.
In 2019, 13% of females were cautioned or convicted as first time offenders for theft offences, compared with 7% of males. In contrast, a higher proportion of male than female first time offenders were cautioned or convicted for drug offences over the last 5 years (13% and 5% respectively in 2019). The greater tendency for female first time offenders to be cautioned or convicted for theft aligns with trends for offenders more generally, as discussed in Chapter 4: Police Activity.
Offenders with 1 to 14 previous cautions or convictions
Offenders with 1 to 14 previous cautions or convictions accounted for 51% of all offenders in 2019, 86% were male, compared to 14% who were female.
Offenders with 15 or more previous cautions or convictions
In 2019, offenders with 15 or more previous cautions or convictions comprised 25% of all offenders, 89% of offenders were male, compared to the 11% who were female.
Figure 7.07: Proportion of males and female offenders by offending history, England and Wales, 2015 and 2019
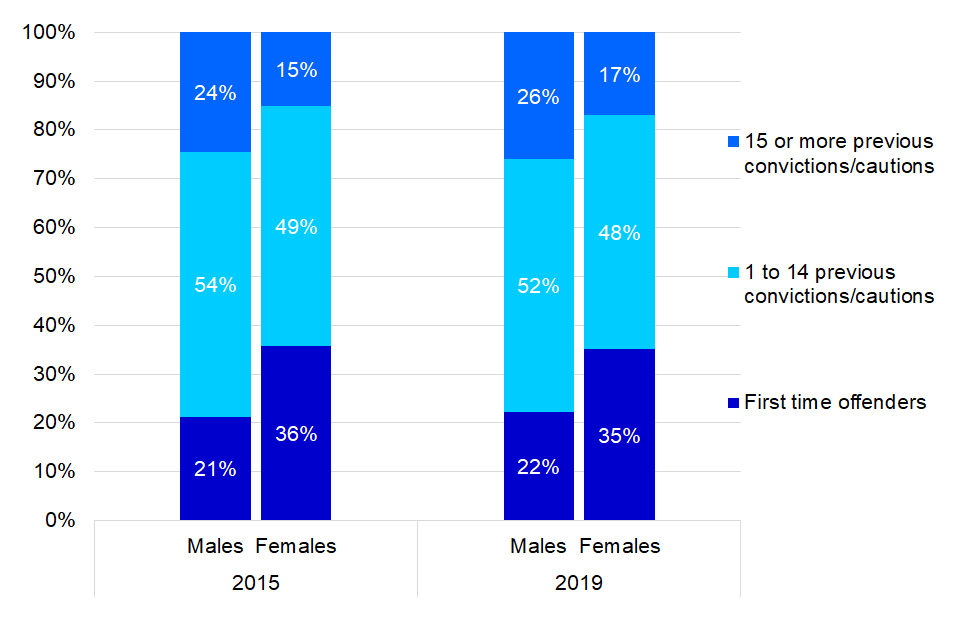
Proportion of males and female offenders by offending history, England and Wales, 2015 and 2019
Proven reoffending[footnote 89]
A proven reoffence is defined as any offence committed in a one-year follow-up period that leads to a court conviction, caution, reprimand or warning within that year or within a further six-month waiting period to allow the offence to be proven in court.
In the 2017/18 cohort, the reoffending rate was higher for males at 30%, compared to 23% for females.
Among both adult female and male offenders, the reoffending rate was highest for those aged 35 to 39 at 30.4% and 34.4%, respectively.
In the most recent year, females had a higher average number of reoffences per reoffender (also known as the frequency rate) compared to males, at 4.33 and 3.99, respectively.
The highest frequency rate was observed amongst female offenders aged 30 to 34, at 4.83, whilst for male offenders, it was highest in both the 30-34 and 35-39 age groups, at 4.44 reoffences per reoffender.
Figure 7.08: Adult reoffending rate by age group and sex, April 2017 to March 2018 offender cohort, England and Wales
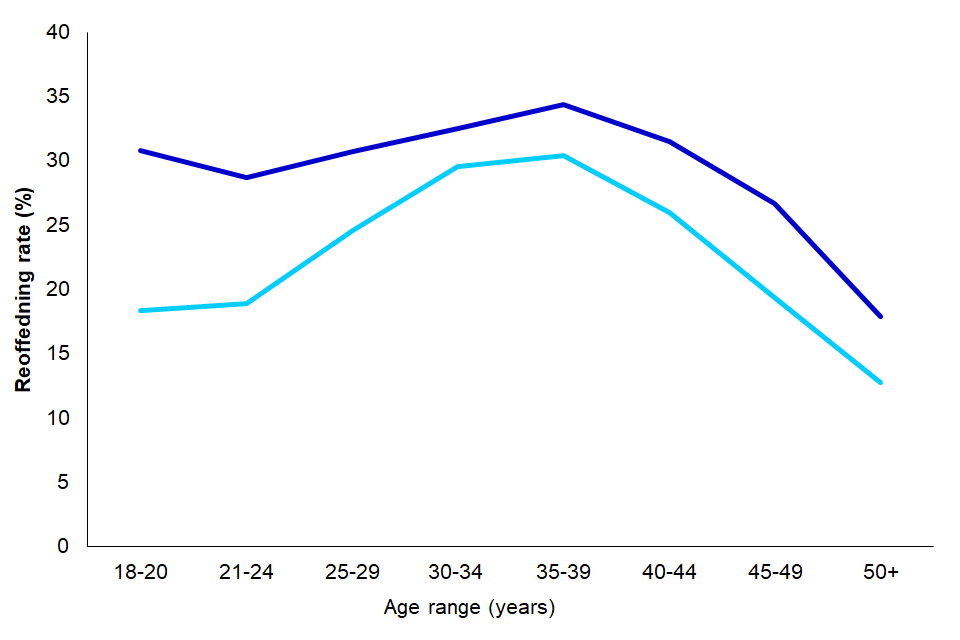
Adult reoffending rate by age group and sex, April 2017 to March 2018 offender cohort, England and Wales
Comparing the educational background of young offenders in Key Stage 4[footnote 90]
Findings from a recent data sharing exercise between the MoJ and the Department for Education (DfE) are presented here, with analysis on a matched cohort of those who were in Year 6 in either 2008/09 or 2009/10 and who were aged ten at the start of those academic years[footnote 91][footnote 92]. To avoid inconsistency in the length of their offending histories, for those with an academic year of 2008/09 their offending data has been considered up to 31 August 2016 and for those with an academic year of 2009/10 it has been considered up to 31 August 2017.
This analysis compares the genders in the matched young offender cohort, broken down by disposal, educational attainment, pupil characteristics, persistent absence and exclusion.
There is a glossary that explains the definition of each disposal in the technical guide, along with a summary of the data share.
It is important to note in the following analysis that there are many young people in the overall pupil population that have the characteristics described and do not go on to offend[footnote 93]. Some of the proportions presented in this analysis are based on small sample sizes so care should be taken when comparing results for different genders.
Educational attainment at Key Stage 4
5 or more GCSEs (or equivalents) graded A* to C, including English & Maths
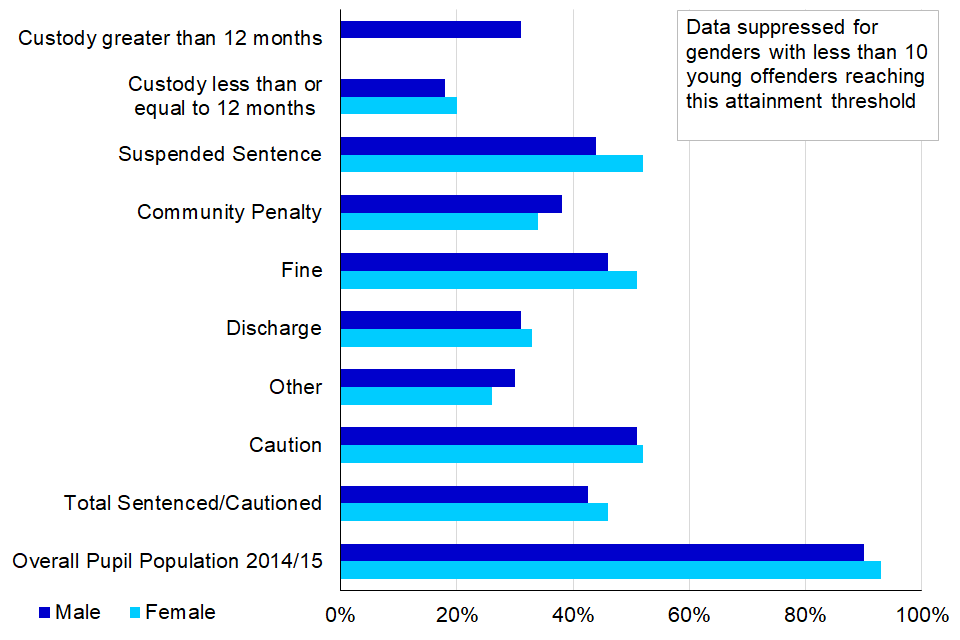
The proportion of all young offenders in the matched cohort that achieved 5 or more GCSEs (or equivalents) graded A* to C, including English and Maths, was slightly higher for the young female group, at 12%, compared to 10% for young males. This was considerably lower than the proportion of pupils achieving this attainment level for the overall pupil population (including both offenders and non-offenders) in 2013/14[footnote 94] (62% for young females and 52% for young males) and 2014/15[footnote 95] (62% for young females and 53% for young males).
Amongst those receiving cautions, discharges and fines, a greater proportion of young female offenders attained 5 or more GCSEs (or equivalents) graded A* to C, including English and Maths, than the young male group. The difference was greatest amongst those receiving fines, where a greater proportion of young females attained this level (22%) than the young male group (15%).
5 or more GCSEs (or equivalents) graded A* to G, including English & Maths
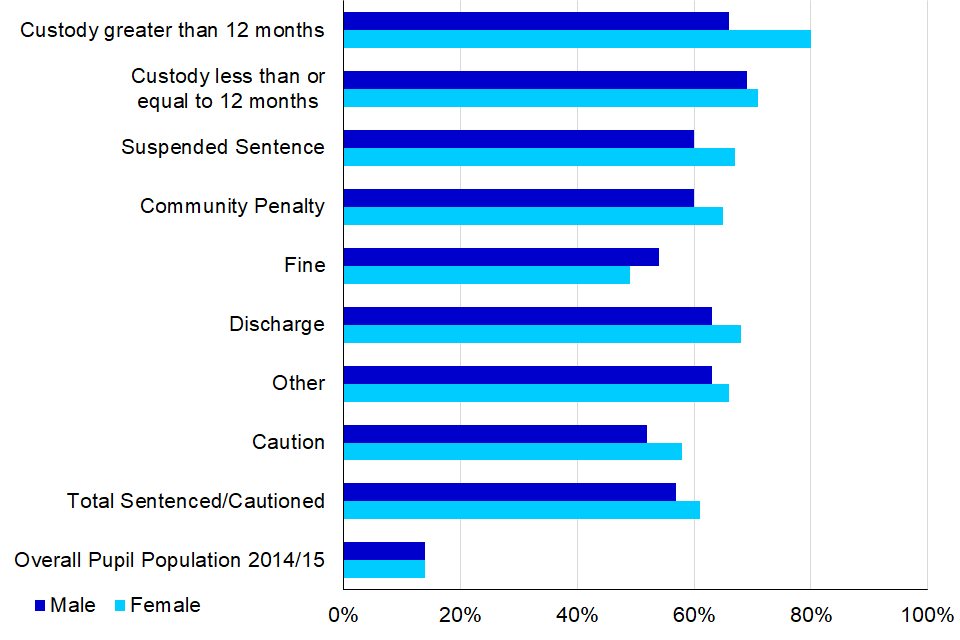
The overall levels of attainment for the cohort are slightly higher for the young female group, with 46% achieving 5 or more GCSEs (or equivalents) graded A* to G, including English and Maths, compared to 43% for young males. This was considerably lower than the proportion of pupils achieving this attainment level for the overall pupil population (including both offenders and non-offenders) in 2013/14[footnote 96] and 2014/15[footnote 97] (93% for young females and 90% for young males). For both young males and young females in the matched cohort, those who were sentenced to custody for 12 months or less had the lowest proportion attaining 5 or more GCSEs (or equivalents) graded A* to G.
Figure 7.08 shows that across most disposal types, a greater proportion of young females attained this level than young males. For example, 52% of young females who received a suspended sentence had 5 or more GCSEs graded A* to G, compared to 44% of young males.
Figure 7.08: Proportion of young offenders who finished Key Stage 4 in either 2013/14 or 2014/15 that achieved 5 or more GCSEs (or equivalents) graded A* to G by gender and disposal category[footnote 98] (Source: Table 7.1)
Proportion of young offenders who finished Key Stage 4 in either 2013/14 or 2014/15 that achieved 5 or more GCSEs (or equivalents) graded A* to G by gender and disposal category
Any pass in GCSEs (or equivalents)
The proportion of all young offenders in the matched cohort that achieved any pass in their GCSEs (or equivalents) was high; 80% for males and 83% for females. However, this was lower than the proportion of pupils achieving this attainment level for the overall pupil population (including both offenders and non-offenders) in 2013/14[footnote 99] and 2014/15[footnote 100] (99% for young females and 98% for young males).
There were some differences between the gender groups at this attainment level across all disposals. For example, young males receiving more than 12 months in custody were more likely to receive any pass in GCSEs than young females (69% v 64%), whereas the reverse was true for young males receiving 12 months or less in custody. Young males receiving less than 12 months in custody were less likely to receive any pass in GCSEs than young females (60% v 67%).
Pupil characteristics
In this section, all analysis looks at those in the matched offender cohort who were eligible for Free School Meals (FSM) and/or had Special Education Needs (SEN), at any point during KS4.
Free School Meals[footnote 101]
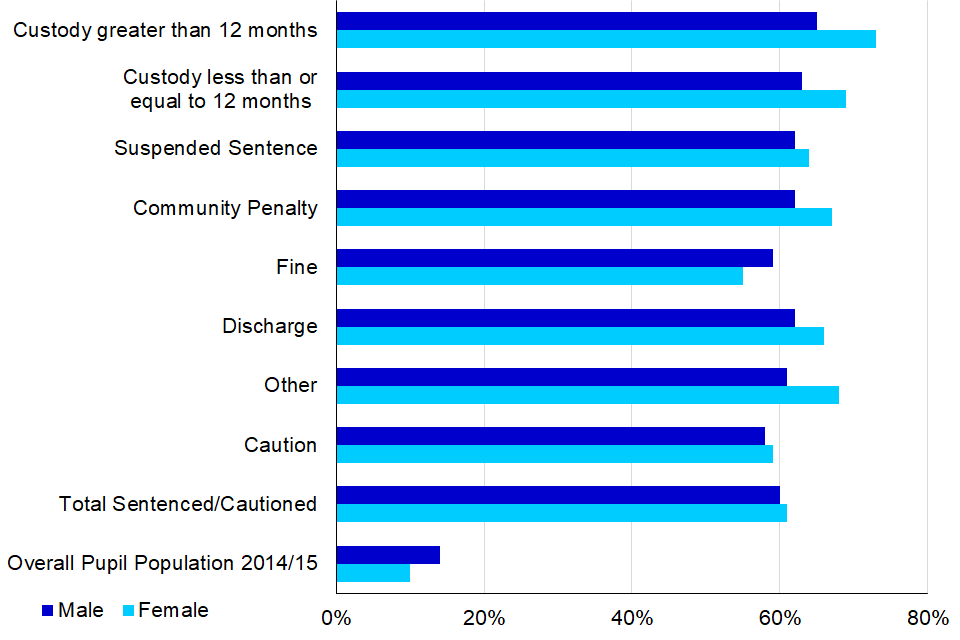
For both young males and young females that received a sentence/caution in the matched cohort, over half received FSM. The overall levels of FSM eligibility for the cohort was slightly higher for the young female group (61%) compared to the young male group (57%). This was considerably higher than the proportion of pupils eligible for FSM in the overall pupil population (including both offenders and non-offenders) in 2013/14[footnote 102] and 2014/15[footnote 103] (14% for both young females and young males).
Young females had higher levels of FSM eligibility across all disposals, except for fines, compared to young males. In general, the higher the proportion of students who received FSM, the higher the severity of the disposal category.
Figure 7.09: Proportion of young offenders who finished Key Stage 4 in either 2013/14 or 2014/15 who receiving Free School Meals, by gender and disposal category (Source: Table 7.2)
Proportion of young offenders who finished Key Stage 4 in either 2013/14 or 2014/15 who receiving Free School Meals, by gender and disposal category
Special Educational Needs (SEN)[footnote 104]
Young male offenders had a higher proportion with SEN with a statement[footnote 105] overall (17%), compared to young female offenders (7%). This was much higher than the proportion of all year 11 pupils who had SEN with a statement (including both offenders and non-offenders) in 2013/14[footnote 106] and 2014/15 [footnote 107](2% for young females and 5% for young males).
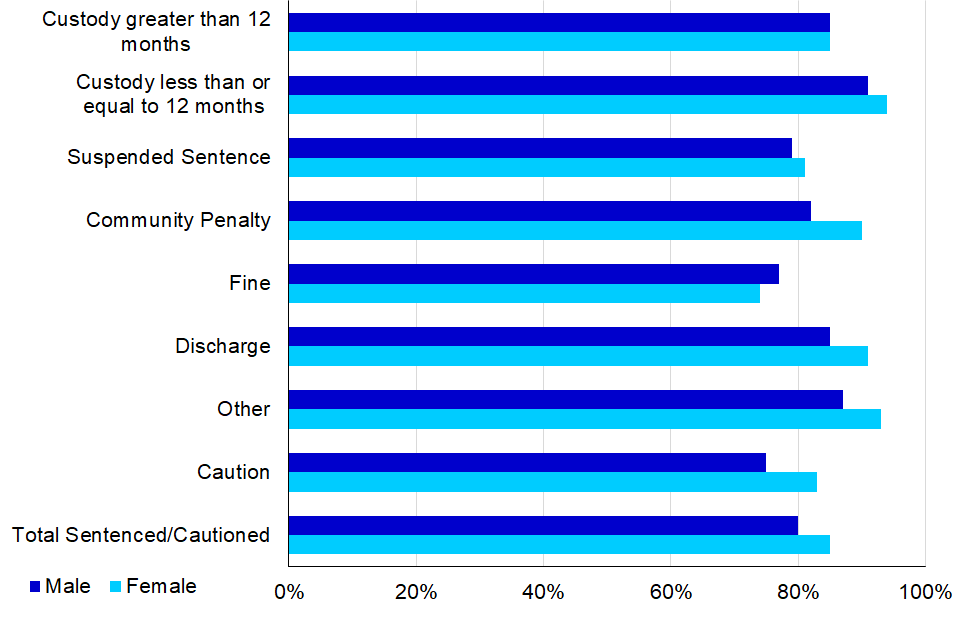
Overall, over half of young offenders sentenced or cautioned in the matched cohort had SEN without a statement, 61% for young females and 60% for young males. This was much higher than the proportion of all year 11 pupils who had SEN without a statement (including both offenders and non-offenders) in 2013/14[footnote 108] (13% for young females and 18% for young males) and 2014/15[footnote 109] (10% for both young females and 14% for young males).
The proportion of young offenders with SEN without a statement across each disposal (except fine) was slightly higher for young female offenders, particularly for custodial sentences. Young females who were sentenced to custody for more than 12 months had a 73% proportion with SEN without a statement compared to 65% for young males.
Figure 7.10: Proportion of young offenders who finished Key Stage 4 in either 2013/14 or 2014/15 with Special Educational Needs without a statement, by gender and disposal category (Source: Table 7.3)
Proportion of young offenders who finished Key Stage 4 in either 2013/14 or 2014/15 with Special Educational Needs without a statement, by gender and disposal category
Persistent absence and exclusion
The matched cohort data also provided information on the proportion of those sentenced/cautioned that have a history of being persistently absent[footnote 110] from school, have a previous record of being permanently excluded[footnote 111] from school, or have received a fixed period exclusion[footnote 112], at any point during KS4.
Persistent absence
Overall, of the young offenders sentenced/cautioned, a smaller proportion of young males (80%) had a record of persistent absence compared to young females (85%). The largest difference between genders in proportions of persistent absence was seen for those who were dealt with by a community penalty. Among young females who were dealt with by a community penalty, 90% had a record of persistent absence, compared to 82% of young males; a 9 percentage point difference.
Figure 7.11: Proportion of young offenders who finished Key Stage 4 in either 2013/14 or 2014/15 with a record of persistent absence, by gender and disposal category (Source: Table 7.4)
Proportion of young offenders who finished Key Stage 4 in either 2013/14 or 2014/15 with a record of persistent absence, by gender and disposal category
Fixed Period Exclusion
Across all disposals, a larger proportion of young males had a record of receiving a fixed period exclusion compared to young females. The largest difference in proportions between genders for fixed period exclusion was seen for those who were dealt with by a suspended sentence. Among young males who were dealt with by a suspended sentence, 82% had a record of fixed period exclusion, compared to 59% of young females; a 24 percentage point difference.
Figure 7.12: Proportion of young offenders who finished Key Stage 4 in either 2013/14 or 2014/15 with a record of fixed period exclusion, by gender and disposal category (Source: Table 7.5)
Proportion of young offenders who finished Key Stage 4 in either 2013/14 or 2014/15 with a record of fixed period exclusion, by gender and disposal category
Permanent exclusion
Overall, of the young offenders sentenced/cautioned, a larger proportion of young males (14%) had been permanently excluded compared to young females (10%).
The disposal where there was the greatest difference between genders was for fines. The proportion of young females who had been permanently excluded and sentenced to a fine was 9%, compared to 15% for young males, a 6 percentage point difference.
8. Offence analysis
TV licence evasion was the most common offence for which females were convicted in 2019.
In 2019, 74% of those convicted for TV licence evasion were female. This offence accounted for 30% of all female convictions, compared to 4% of male convictions.
Theft from shops was the most common indictable offence for which 34% of females and 14% of males were convicted in 2019.
Of the 34,300 defendants convicted for shoplifting, 9,600 (28%) were female. The custody rate for this offence was lower for female offenders (19%) than for males (26%).
As discussed in Chapter 5: Defendants, in 2019, 26% of individuals[footnote 113] prosecuted in England and Wales were female[footnote 114]. This varies by offence type, females accounted for a higher proportion of prosecutions for summary offences (29%) than indictable offences (14%). Similar proportions are seen in convictions.
Figure 8.01: The proportion of male and female offenders prosecuted for each offence group, England and Wales, 2019
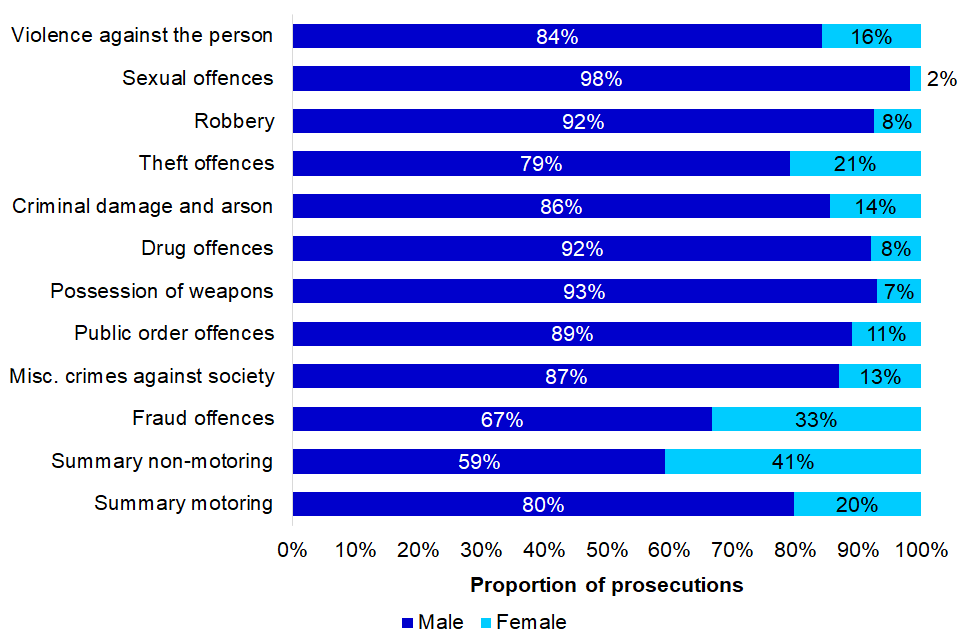
The proportion of male and female offenders prosecuted for each offence group, England and Wales, 2019
The indictable offence groups with the highest proportion of females prosecuted were fraud offences (33% female) and theft offences (21% female), while the groups with the highest proportion of males prosecuted were sexual offences (98% male) and possession of weapons (93% male).
Change in prosecutions by offence group since 2015
Prosecutions for indictable offences for females have decreased by 29% since 2015, from 48,000 to 33,800. A similar trend was seen in male prosecutions over the last five years, where the number of males prosecuted for indictable offences was 25% lower in 2019 than in 2015.
Most of this decrease is accounted for by a reduction in the number of females prosecuted for theft offences (10,500 fewer in 2019 than in 2015), particularly theft from shops, for which there were 8,200 fewer prosecutions. A decrease in prosecutions was also seen for Class B drug offences (1,000 fewer), benefit fraud (1,500 fewer) and absconding from bail (1,200 fewer).
There was an increase in the number of females prosecuted for violence against the person offences. This is largely due to the introduction of the offence of assaulting an emergency worker in 2018, for which 3,300 females were prosecuted in 2019.
Figure 8.02 Change in female prosecutions for indictable offences, by offence group England and Wales, 2015 to 2019
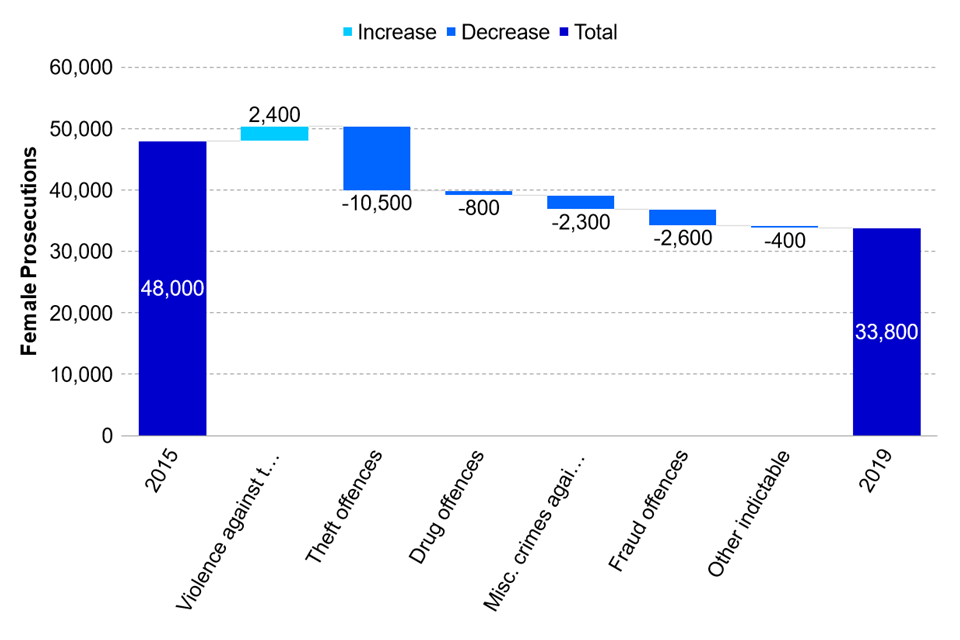
Change in female prosecutions for indictable offences, by offence group England and Wales, 2015 to 2019
Convictions for summary offences
Figure 8.02: Summary offences with the highest proportion of female convictions, England and Wales, 2019
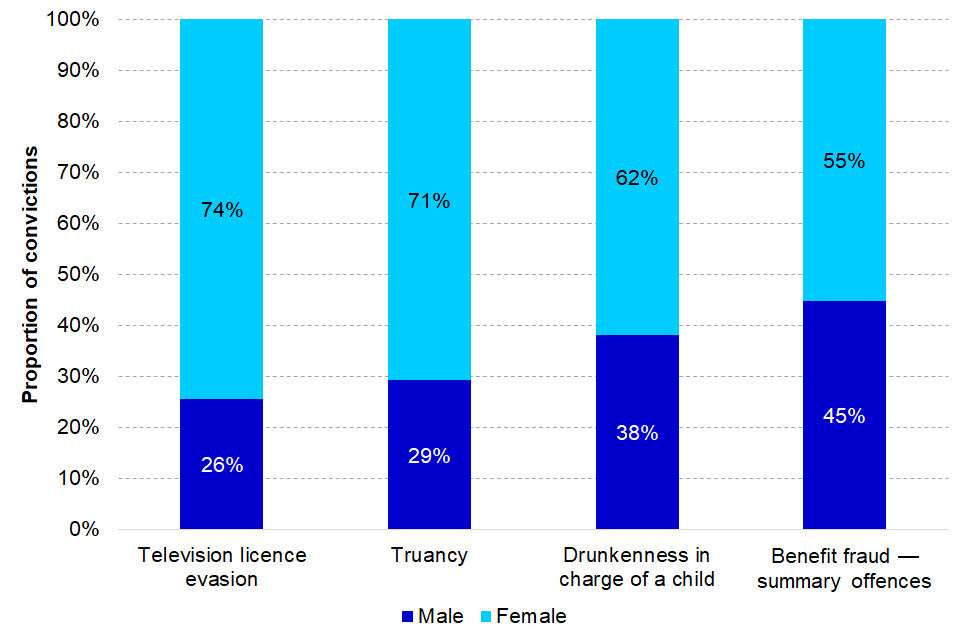
Summary offences with the highest proportion of female convictions, England and Wales, 2019
The summary offences with the highest proportion of females among those convicted in 2019 were[footnote 115]:
-
TV licence evasion — females made up 74% of the 114,000 convictions in 2019, up 3 pp from 2015. TV licence evasion made up 30% of all female convictions, compared to 4% of male convictions. A contributing factor is the greater availability of females when an enforcement officer visits the home[footnote 116]. Fines accounted for 99% of those sentenced for TV licence evasion in 2019 across both sexes.
-
Truancy — females made up 71% of the 19,600 convictions in 2019, down 2 pp from 2015. Lone parents with dependent children represented 17% of all families with dependent children in 2019, and females accounted for 91% of these lone parents[footnote 117]. In 2019, the most common sentence for this offence was a fine, received by 87% of females sentenced and 90% of males.
-
Drunkenness in charge of a child — females made up 67% of the 162 convictions, up 6 pp from 2015. Fines accounted for 34% of females sentenced in 2019 and 33% received a community sentence, compared with 44% and 30% for males.
-
Benefit fraud — females made up 55% of the 98 summary convictions in 2019, down 3 pp from 2015. The disparity in convictions for these offences may reflect the fact that females make up a slightly larger proportion of benefit claimants[footnote 118]. The most common sentence for summary benefit fraud offences was a community sentence, received by 45% of females and 58% of males convicted for this offence in 2019.
Convictions for indictable offences
Figure 8.03: Indictable offences with the highest proportion of female convictions, England and Wales, 2019
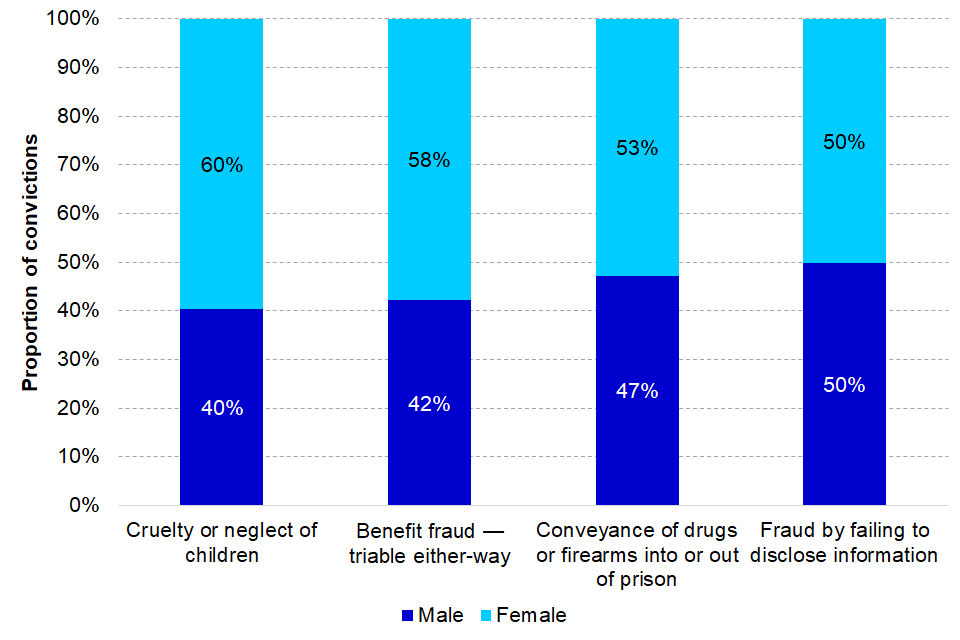
Indictable offences with the highest proportion of female convictions, England and Wales, 2019
The indictable offences with the highest proportion of females among those convicted in 2019 were:
-
Cruelty to or neglect of children — females made up 60% of the 427 convictions in 2019, the same proportion as in 2015. The custody rate for this offence was 14% for females and 34% for males in 2019.
-
Benefit fraud — females made up 58% of the 1160 convictions for indictable benefit fraud offences up 2 pp from 2015. The most common sentence for indictable benefit fraud offences was a community sentence, received by 51% of females and 53% of males sentenced in 2019.
-
Conveyance of drugs or weapons into or out of prison — females made up 53% of 324 convictions in 2019, up 8 pp since 2015. In 2019, the custody rate for these offences was 46% for females and 72% for males. 41% of females received a suspended sentence for this offence, compared with 20% of males.
-
Fraud by failing to disclose information — females made up 50% of 281 convictions in 2019, down 1 pp since 2015. The custody rate for this offence was 19% for females in 2019, compared with 26% for males.
Custody rate for the most common indictable offences
The indictable offences for which the highest numbers of female offenders were sentenced in 2019 were:
-
Theft from shops (9600 were sentenced, 3% of all sentences given to female offenders in 2019);
-
Assault of an emergency worker (2700 sentenced);
-
Fraud by false representation: cheque, plastic card and online bank accounts (940 sentenced);
-
Possession of a Class A drug (870 sentenced); and
-
Possession of an article with blade or point (760 sentenced).
For each offence, the proportion of those who were sentenced to immediate custody was lower for female offenders than for males.
Figure 8.05: Custody rate by sex for indictable offences with the highest number of female offenders sentenced, England and Wales, 2019
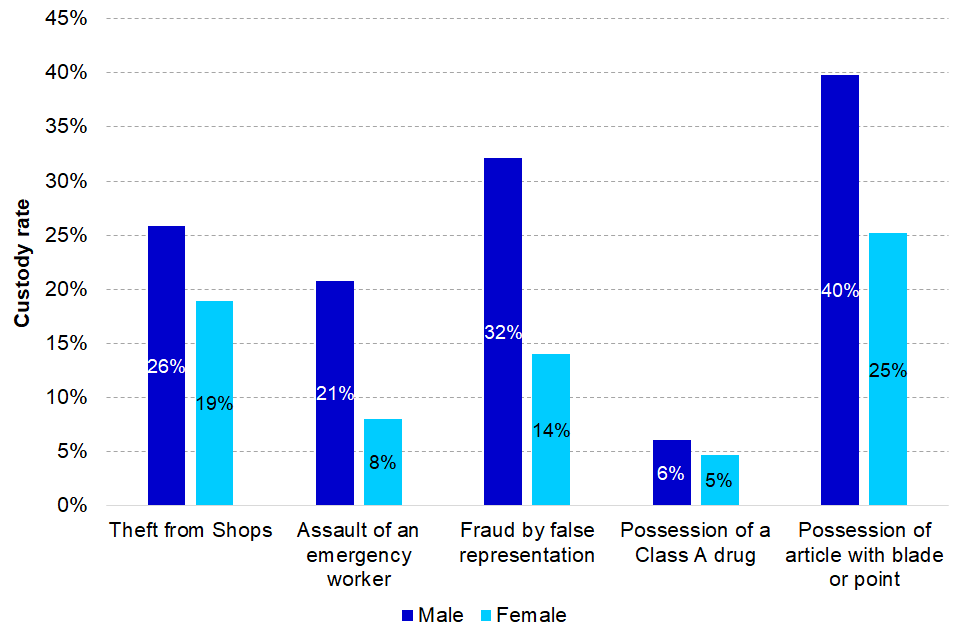
Custody rate by sex for indictable offences with the highest number of female offenders sentenced, England and Wales, 2019
9. Practitioners
Over the last 5 years, there have been increases in female representation across almost all CJS organisations and in the proportion of senior staff.
The largest increase in female representation was seen in court judges by 5 percentage points, to 32%. Other increases included a 3 percentage point increase in both magistrates and HMPPS (excluding probation) to 56% and 40%, respectively. Female representation within MoJ and CPS remained constant.
This chapter reports on the trends in the composition of staff and practitioners throughout the criminal justice system (CJS) by sex. It draws upon published extracts of human resources records for the police (2019/20), Ministry of Justice (MoJ; 2018/19), Crown Prosecution Service (CPS; 2018/19), Her Majesty’s Prison and Probation Service (HMPPS; 2019/20), magistracy[footnote 119] and judiciary[footnote 120]. To allow for variable changes in headcount throughout the period considered, the sexes are best considered in terms of proportions of staff rather than absolute numbers.
Trends in CJS organisations
The proportions of female practitioners vary across the CJS organisations (Figure 9.01)[footnote 121]. Over the last five years, female representation has remained constant within the MoJ (67% in 2019). Likewise, only slight changes have been seen since 2015 regarding female representation in CPS staff (65% in 2015; 66% in 2019).
A 2.6 pp increase over the last five years brought female representation among in-post police officers up to 31% in 2019.
Female representation among court judges continued to steadily increase, similarly to the last five years (28% in 2016; 32% in 2020). The female majority in Magistrates’ Court staff has continued to increase, also, recorded at 56% in 2020.
The representation of females among HMPPS staff (excluding NPS)[footnote 122] has increased over the last five years, from 39% to 42%. This differs between functions within HMPPS, with the Prison Service (including Youth Custody Service) representing a lower proportion of females than the HMPPS as a whole, rising from 37% to 39%. Contrastingly, the HMPPS HQ (and Area Services) has a majority female staff, increasing to 59% in 2020.
Figure 9.01: Proportion of practitioners in organisations involved in the CJS of each sex, by organisation, most recent year available vs. five years prior.
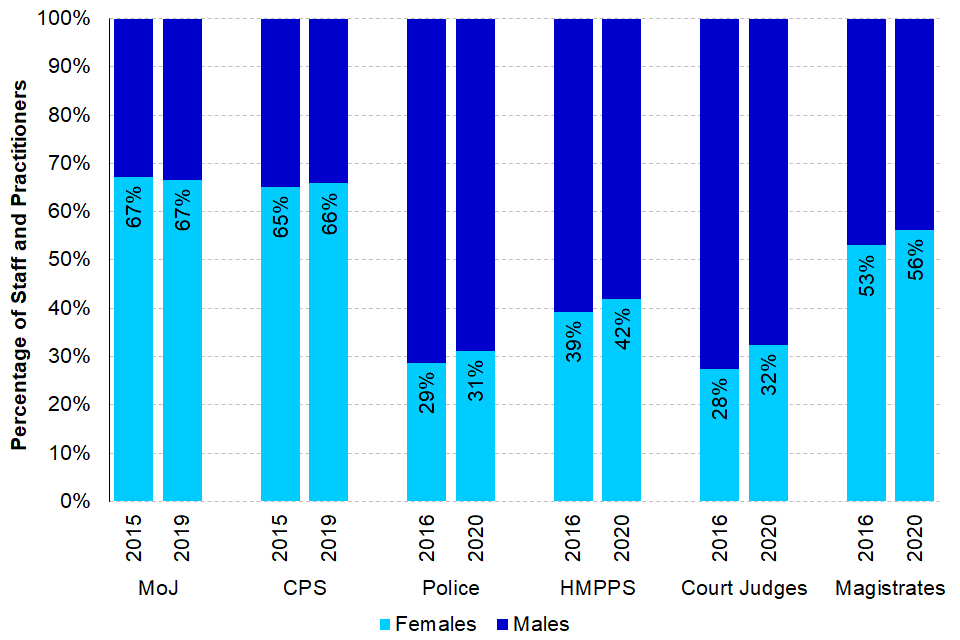
Proportion of practitioners in organisations involved in the CJS of each sex, by organisation, most recent year available vs. five years prior.
Trends in senior staff and practitioners[footnote 124][footnote 125]
All organisations within the CJS have increased female representation among senior staff over the last 5 years. However, the proportion of senior staff who were female was lower than the proportion of staff at all grades across the CJS organisations considered in this section.
In the most recent year, the CPS and MoJ had the highest proportions of senior staff who were female at 57% and 51%, respectively; these were the only organisations where the representation of females in senior positions was higher than that of males. Senior police officers increased their female representation to 27% in 2020, from 23% five years ago. HMPPS (excluding NPS) have seen the largest increase in female representation of senior staff, increasing by 10 percentage points, to 45% in 2020. Court judges have seen similar increases to 26% female staff, largely driven by High Court Judge appointments.
Revisions policy
In accordance with Principle 2 of the Code of Practice for Official Statistics, the Ministry of Justice is required to publish transparent guidance on its policy for revisions. A copy of this statement can be found at:
http://www.justice.gov.uk/downloads/statistics/mojstats/statistics-revisions-policy.pdf
The Ministry of Justice aims to avoid the need for revisions to publications unless they are absolutely necessary and put systems and processes in place to minimise the number of revisions.
Within the Ministry of Justice’s statistical publications there can be three main reasons for statistics to be revised:
-
Changes in how either source administrative systems collect information or a change in statistical methodology to improve accuracy and measurement.
-
Receipt of subsequent information which alters our understanding of previous periods (for example – late recording on one of the administrative IT systems used operationally).
-
Errors in our statistical systems and processes.
Our policy in handling revisions is to be transparent with users about:
-
The need for revisions.
-
How and when to expect revisions as part of our standard processes.
-
The processes by which other revisions will be communicated and published.
To meet these commitments, all of our statistical publications will:
-
Ensure that the need for major revisions for any series are pre-announced on the Ministry of Justice website.
-
Include a detailed revisions policy within every release.
-
Detail how users will be informed of the need for revisions.
-
Give detailed and full explanations as to why the revisions were necessary.
In addition, the annual report from the Head of Profession to the National Statistician will:
-
Provide information on how many revisions were required to our publications and the reasons for these.
-
Publish a time-series of revisions due to errors in our statistical processes and procedures so we can monitor the quality of our outputs.
Further information
National Statistics status
National Statistics status means that official statistics meet the highest standards of trustworthiness, quality and public value.
All official statistics should comply with all aspects of the Code of Practice for Statistics. They are awarded National Statistics status following an assessment by the Authority’s regulatory arm. The Authority considers whether the statistics meet the highest standards of Code compliance, including the value they add to public decisions and debate.
It is the Ministry of Justice’s responsibility to maintain compliance with the standards expected for National Statistics. If we become concerned about whether these statistics are still meeting the appropriate standards, we will discuss any concerns with the Authority promptly. National Statistics status can be removed at any point when the highest standards are not maintained and reinstated when standards are restored.
Contact
Press enquiries should be directed to the Ministry of Justice press office:
Tel: 020 3334 3536
Email: newsdesk@justice.gov.uk
Other enquiries about these statistics should be directed to the Justice Statistics Analytical Services division of the Ministry of Justice:
Damon Wingfield, Responsible Statistician and Head of Criminal Justice System Statistics
Ministry of Justice, 3rd Floor, 10 South Colonnade, London, E14 4PU
Email: CJS_Statistics@justice.gov.uk
General enquiries about the statistical work of the Ministry of Justice can be e-mailed to: ESD@justice.gov.uk
Feedback
The structure and content of this report is continually being reviewed to reflect user requirements. If you have any feedback about the changes referred to in the introduction, or the report more generally, please contact the production team through the Justice Statistics Analytical Services division of the Ministry of Justice: Email: CJS_Statistics@justice.gov.uk
© Crown copyright
Produced by the Ministry of Justice
Alternative formats are available on request from ESD@justice.gov.uk
-
Available at https://www.statisticsauthority.gov.uk/code-of-practice/ ↩
-
Fieldwork for the year to March 2020 was suspended two weeks early on Wednesday the 18th March 2020, just prior to the lockdown restrictions being announced by the Government on the 23rd March 2020. Estimates for the year 2019 to March 2020 were therefore unaffected by the lockdown restrictions. ↩
-
Details can be found in the Technical Guide published alongside this report. ↩
-
Bespoke analysis can be found in the Chapter 3: Victims Tables published alongside this report. ↩
-
Statistics used are from the CSEW 2019/20 unless stated otherwise; when differences are not referred to as statistically significant these are either not statistically significantly different, or differences have not been tested. ↩
-
In 2019/20, the CPS moved from annual reporting, in the Violence Against Women and Girls annual report, to quarterly data. Data mentioned can be found on the page linked. ↩
-
In this chapter, ‘children’ refers to those aged 10 to 15 unless stated otherwise. ↩
-
Other demographic data, such as age and ethnicity, are available in the Crime in England and Wales Annual Trend and Demographic Tables. Tests for statistical significance are published in the Victims tables alongside this report. ↩
-
Personal crimes are those against an individual that relate to the respondent’s own personal experience rather than others in the household. Personal crime is defined by the CSEW as comprising of all violence and thefts. ↩
-
Breakdown by offence type is not available in the CSEW 2019/20 data. Therefore, Figure 3.01 refers to the previous year, 2018/19. ↩
-
Data from Nature of Violent Crime, England and Wales: year ending 2019 (appendix tables) ↩
-
Data on victims of Domestic abuse in 2019/20 is discussed in more detail further into this chapter. ↩
-
From April 2017, the upper age limit for the self-completion module was increased to ask all respondents aged 16 to 74. Previous data representing ages 16-59 are therefore incomparable to data after April 2017. ↩
-
Questions on the offence category ‘Causing sexual activity without consent’ were removed from the CSEW 2019/20, therefore the total category of any sexual assault (including attempts) no longer includes this category. ↩
-
From April 2017, the upper age limit for the self-completion module was increased to ask all respondents aged 16 to 74. All data refers to this age group throughout the section, unless stated otherwise. ↩
-
Domestic abuse is made up of partner or family non-physical abuse, threats, force, sexual assault or stalking. ↩
-
Data is from CSEW 2019 annual supplementary tables. ↩
-
Data is from Domestic abuse in England and Wales: year ending March 2019. Five-year time series refers to 2014/15 to 2018/19. Three-year time series refers to 2016/17 to 2018/19. ↩
-
Data are from the most recently published Homicide in England and Wales, 2018/19. ↩
-
This is not including the 96 victims of the Hillsborough disaster in 2016/17, where 89 were male and 7, female. ↩
-
Where there are multiple suspects in a homicide case, they are categorised in the Homicide Index as either the principal or a secondary suspect. There is only ever one principal suspect per homicide victim. If there is conviction information available, the suspect with the longest sentence/most serious conviction is determined as the principal suspect. In the absence of any court outcome, the principal suspect is either the person considered by the police to be the most involved in the homicide or the suspect with the closest relationship to the victim. ↩
-
The data in this section refers to arrests for notifiable crimes recorded by the police. ↩
-
Lancashire Constabulary and Greater Manchester Police were unable to supply complete data for 2018/19 and for 2019/20 respectively. Therefore, to ensure comparability with previous years, these police forces are excluded from arrests analyses. ↩
-
See technical guide for information on the use of section 136 of the Mental Health Act (1983). ↩
-
In 2018/19 Lancashire, Warwickshire and West Mercia stated that new IT systems and/or processes had led to changes in recording of detentions under section 136 of the Mental Health Act. Therefore, to ensure comparability across year, these forces have been excluded from the calculations for the year on year change. ↩
-
See technical guide for more information on what this service covers. ↩
-
2% of adults identified as intersex or did not disclose this information. They have been excluded from all analyses in this chapter. ↩
-
National liaison and diversion services offence groups are based on those used by the Home Office and are not directly comparable to those used in Criminal Justice Statistics quarterly: December 2019, which are used throughout the majority of this bulletin. ↩
-
3% of young people identified as intersex or did not disclose this information. They have been excluded from all analyses in this chapter. ↩
-
Out of court disposals available to the police and CPS in 2019 included: simple and conditional cautions; cannabis and khat warnings; penalty notices for disorder (PNDs); and community resolutions. Caution data cannot be split by simple and conditional, and data broken down by sex is not available for cannabis and khat warnings or community resolutions, therefore these will not be included in the totals. ↩
-
See technical guide for more information on PNDs. ↩
-
Figures on cautions exclude cases where sex is not known (in 1% of cases) ↩
-
Summary motoring offences are not considered in relation to cautions or cautioning rates as these tend to be addressed using Fixed Penalty Notices. There is no published data available on Fixed Penalty Notices by sex. ↩
-
Indictable offences are more serious offences that may (if triable-either-way) or must (if indictable only) be passed on to the Crown Court; while summary offences are typically less serious and almost always dealt with entirely in magistrates’ courts. See accompanying technical guide for further details. ↩
-
The cautioning rate is the number of offenders who were given a caution divided by the number who were either cautioned or convicted (excluding summary motoring offences). ↩
-
A single individual (includes people and companies) can be counted more than once in a year if they are dealt with by the CJS on more than one occasion. The number of individuals formally dealt with by the CJS includes defendants prosecuted at magistrates’ court and individuals given a caution or Penalty Notice for Disorder (PND). Cannabis warnings and community resolutions will not be considered when looking at out of court disposals because they are not recorded by sex. For more detailed analysis on out of court disposals, see Chapter 4: Police Activity. ↩
-
This section looks at persons only and excludes those where sex is not stated. Other defendants such as companies and public bodies are also excluded. ↩
-
This section looks at persons only and excludes those where sex is not stated. Other defendants such as companies and public bodies are also excluded. Defendants with sex not stated accounted for 10% of all court proceedings in 2019, companies and public bodies accounted for 1%. ↩
-
The data used for this section are sourced from the magistrates’ court administrative database LIBRA-MIS. They represent experimental statistics and tables on this data are provided in the accompanying overview tables. ↩
-
Where sex is known. 2% of crime lower legal aid clients had an unstated sex. ↩
-
Where sex is known. 4% of crime higher legal aid clients had an unstated sex. ↩
-
Figures from this paragraph are sourced from the data underpinning the Criminal Court Statistics (annual): January to March 2020 bulletin. These figures are calculated differently from those used for the Criminal Justice Statistics Quarterly: December 2019 bulletin, which is used as the basis for the section on plea at the Crown Court and the remainder of the Crown Court committal section – they are not directly comparable to these sections. Please refer to the accompanying technical guide for further details. ↩
-
Further information regarding the impacts on published estimates of the ongoing data reforms seen in the criminal courts can be found at the following link: https://www.gov.uk/government/publications/criminal-court-statistics-quarterly-april-to-june-2020/criminal-court-statistics-quarterly-april-to-june-2020 ↩
-
Plea data is sourced from the Criminal Justice Statistics Quarterly: December 2019 bulletin and excludes companies, defendants with unknown sex and unknown plea. ↩
-
Defendants are reported against their principal (i.e. most serious) remand status. Court custody includes those remanded in custody at any stage of proceedings at magistrates’ or Crown Court who may also have been given bail or not remanded at some stage of those proceedings. Court bail includes those remanded on bail at any stage of proceedings at magistrates’ or Crown Court who were never remanded in custody but who may also have been not remanded at some stage of those proceedings. ↩
-
The data in this section relates to persons remanded in each completed court case rather than to the number of remand decisions (a person may be remanded several times during a case). ↩
-
Excluding companies and those of unknown sex, which accounted for 10% of the total number of defendants in 2019. The total number of defendants in 2019 including those who fail to appear, companies and where gender is unknown was 1.44 million. ↩
-
Statistics on case management come from Criminal Court Statistics. ↩
-
These are sourced from linked magistrates’ courts and Crown Court administrative data systems – with a match rate of around 90%. For more information and statistics on criminal court timeliness please refer to the Criminal Court Statistics (quarterly): January to March 2020 bulletin. ↩
-
PSRs provide information to the court about the offender and any circumstances surrounding the offence, to help decide on a suitable sentence. Data on PSRs relates to those aged 18 or older and all offence types. All court reports included in published PSR statistics relate to offenders of known sex. Statistics on PSRs are published alongside Offender Management Statistics. ↩
-
Fast Delivery PSR (written) – Normally completed on day of request and must be completed within 5 days. A fast delivery PSR is only suitable where the case was of ‘low seriousness’ or ‘medium seriousness’, and where the court indicates that a community sentence is being considered. May in certain circumstances also be suitable when the Court is considering custody. These reports may include a full risk assessment of the offender. ↩
-
Fast Delivery PSR (oral) – The Criminal Justice Act 2003 removed the requirement for all PSRs to be written. An oral report is usually completed within 24 hours of conviction where a limited amount of information is required by the sentencing court. ↩
-
Standard PSR – A standard delivery (adjourned) Pre-Sentence Report is based on a full risk assessment and is suitable for ‘medium’ and ‘high’ seriousness cases and/or where a custody is being considered. ↩
-
Guidance to National Probation Service staff on proposing suspended sentence orders (SSO) changed in 2018, which led to substantial drops in the numbers of SSOs proposed in 2018 and 2019 resulting in volumes too low for a robust comparison. See technical guide for more information. ↩
-
See above footnote. ↩
-
This section excludes those where sex is not stated and other defendants such as companies and public bodies – in total these accounted for 10% of all defendants in 2019. ↩
-
Please note that the spacing of the time period displayed does not align with the actual time scale, for example the time between sentenced to custody for 0-1 month is smaller than 6 to 12 months. ↩
-
Bespoke analysis from the 2019-20 Her Majesty’s Inspectorate of Prisons (HMIP) annual report can be found in the chapter tables, published alongside this report. ↩
-
Data on Prison Population uses the 30 June 2019 snapshot from the Offender management statistics quarterly: January to March 2019. ↩
-
Monthly Youth Custody Official Statistics on the population in custody of children and young people within secure children’s homes (SCHs), secure training centres (STCs) and young offender institutions (YOIs) are published by the Youth Custody Service. ↩
-
A first reception is a measure which counts a prisoner’s first movement into custody following a court hearing for a particular set of offences committed. ↩
-
A release is defined as a release from prison where the prisoner has finished serving the custodial term of their sentence and excludes unsentenced prisoners on remand. ↩
-
Where sentence was known. ↩
-
The detailed results of the survey can be found in the offenders under supervision or in custody tables. ↩
-
Published figures for self-harm in prison can be found in Safety in Custody Statistics. ↩
-
Individuals self-harming rates are derived by 1,000 x (number of individual in year)/(average monthly population for year). Prison population figures are from the Offender Management Statistics quarterly bulletin and are averaged across 12 months. ↩
-
Published figures for probation can be found in Offender Management Statistics quarterly. ↩
-
Court outcomes figures split by sex and ethnicity is limited to indictable offences where is a robust proportion with known ethnicity. ↩
-
Where ethnicity was known. Defendants with unknown or not stated ethnicity accounted for 28% of all indictable prosecutions in 2019. ↩
-
This section looks at indictable offences only. ↩
-
The conviction ratio is calculated by dividing the total number of defendants convicted by the total number of defendants prosecuted in the same period. ↩
-
Remands data in this section are based on the Crown Court’s decision on whether a defendant prosecuted for a criminal offence, should – during the court proceeding – go on to be placed in custody or released on bail. ↩
-
Figures refers only to those with known ethnicity; for this group, ethnicity coverage was 72% in 2019. ↩
-
The custody rate is the proportion of all offenders sentenced to immediate custody, out of all sentencing outcomes. ↩
-
The overall increase in ACSL may be connected to changes in sentencing guidelines – see accompanying technical guide for further details. ↩
-
The analysis in this chapter excludes defendants where age or sex is unknown unless stated otherwise. ↩
-
This section looks at all offence types. ↩
-
Defendants with unknown age and sex are excluded. ↩
-
In some cases, such as in the prison population, the age band for children is defined differently. ↩
-
In this section, children are the standard unit we are describing, even when not explicitly stating so in the text. The only exceptions are when we are deliberately discussing ‘all aged’ offenders. ↩
-
The conviction ratio is defined as the ratio of convictions to prosecutions for a principle offence over one year. ↩
-
For both indictable and summary offences. ↩
-
Children can be sentenced to custody in three different establishment types: Young Offender Institutions are for males aged 15-17 only, no females. Secure Children’s Homes and Secure Training Centres are for males (those who are younger or have more complex needs) and females aged 10-17. ↩
-
Data for offending history includes both indictable and summary offences - unless otherwise stated. ↩
-
Where sex is known. ↩
-
Where there were multiple offences on the same occasion, only the primary offence as recorded on the Police National Computer (PNC) would be counted. ↩
-
Offenders whose sex was unknown were excluded from all analyses in this section, which might lead to very small inconsistencies with other published statistics on offenders. Between 2015 and 2019, offenders of unknown sex comprised less than 1% of offenders. ↩
-
Proven reoffending statistics are reported based on cohorts of offenders who are released from custody, received a non-custodial conviction at court, or received a caution within a three-month period. Annual figures are then produced by aggregating the four 3-monthly cohorts within each given year. This may result in a single offender being included in the annual cohort more than once. Refer to https://assets.publishing.service.gov.uk/government/uploads/system/uploads/attachment_data/file/930457/Guide-to-proven-reoffending_Oct20.pdf for further details on methodology. The most recent annual reoffending data available is for the 2017/18 (i.e. April 2017 to March 2018) offender cohort. ↩
-
Pupils at the end of Key Stage 4 are typically aged 15 and 16. ↩
-
Equivalently, a Key Stage 4 (KS4) academic year of 2013/14 and 2014/15. ↩
-
Analysis of attainment data focuses on those sentenced/cautioned that were at the end of KS4 in the 2013/14 and 2014/15 academic years. Analysis of offender characteristics such as SEN and FSM is also based on academic years 2013/14 and 2014/15. Further information on the methodology and cohort size can be found in the technical guide. ↩
-
We were only able to match data on those children who are both in DfE and MoJ datasets so cannot provide analysis specifically for non-offenders with these characteristics. ↩
-
Source: GCSE and equivalent results: 2013 to 2014 (revised) – National tables: Table 3a: GCSE and equivalent entries and achievements of pupils at the end of key stage 4 by type of school and gender. ↩
-
Source: GCSE and equivalent results in England: 2014 to 2015 (revised) – Main national tables: Table 3a: GCSE and equivalent entries and achievements of pupils at the end of key stage 4 by type of school and gender. ↩
-
Only two sentence length categories have been used for analysis of the MoJ-DfE data due to small volumes when the data is broken down. ↩
-
Source: GCSE and equivalent results: 2013 to 2014 (revised) – National tables: Table 3a: GCSE and equivalent entries and achievements of pupils at the end of key stage 4 by type of school and gender. ↩
-
Source: GCSE and equivalent results in England: 2014 to 2015 (revised) – Main national tables: Table 3a: GCSE and equivalent entries and achievements of pupils at the end of key stage 4 by type of school and gender. ↩
-
A young person may be eligible to claim for FSM if they or their family meet certain criteria related to their income and benefits received. ↩
-
Source: GCSE and equivalent attainment by pupil characteristics: 2014 - National and local authority tables: Table 1 ↩
-
Source: GCSE and equivalent results in England: 2014 to 2015 (revised) – Characteristics national tables: Table CH1: GCSE and equivalent entries and achievements of pupils and the end of key stage 4 by pupil characteristics. ↩
-
For 2014/15, following SEND reforms, SEN pupils are categorised as ‘SEN with a statement or Education, health and care (EHC) plan’ and ‘SEN support’. SEN support replaces school action and school action plus but some pupils remain with these provision types in first year of transition. More detailed information on the reforms can be found at the following: SEND code of practice: 0 to 25 years. ↩
-
A SEN statement is a document which sets out a child’s SEN and any additional help that the child should receive. Having a SEN statement may indicate a higher level of need. ↩
-
Source: GCSE and equivalent attainment by pupil characteristics: 2014 - National and local authority tables: Table 1 ↩
-
Source: GCSE and equivalent results in England: 2014 to 2015 (revised) – Characteristics national tables: Table CH1: GCSE and equivalent entries and achievements of pupils and the end of key stage 4 by pupil characteristics. ↩
-
Persistent absence is when a pupil enrolment’s overall absence equates to 10 per cent or more of their possible sessions. ↩
-
A permanent exclusion refers to a pupil who is excluded and who will not come back to that school (unless the exclusion is overturned). ↩
-
Fixed period exclusion refers to a pupil who is excluded from a school for a set period of time. A fixed period exclusion can involve a part of the school day and it does not have to be for a continuous period. [A pupil may be excluded for one or more fixed periods up to a maximum of 45 school days in a single academic year. This total includes exclusions from previous schools covered by the exclusion legislation.] ↩
-
Individuals with known sex. Defendants with unknown or not stated sex accounted for 10% of all prosecutions in 2019. ↩
-
See the ‘Criminal justice statistics outcomes by offence data tool’ in Criminal Justice Statistics Quarterly: December 2019 to obtain all statistics on prosecutions, convictions and sentencing quoted in this chapter. ↩
-
For the detailed statistics for specific offences used in this chapter, see the ‘Principal offence proceedings and outcomes by Home Office offence code data tool’ in Criminal Justice Statistics Quarterly: December 2019. ↩
-
If enforcement officers suspect a household of watching or recording live TV without a valid licence and are not able to contact anyone at the property by letter or by telephone, they visit the household in person. ↩
-
See the Families and Households 2019 dataset for further information on household types. ↩
-
Self-declared from HR records, for serving magistrates, as at 1 April 2020. Reported in the Judicial Diversity Statistics 2019 publication. ↩
-
Self-declared from HR records, as at 1 April 2019. Reported in the Judicial Diversity Statistics 2020 publication, the quoted figures cover all court judges, i.e. those who deal with civil, family law and criminal cases. ↩
-
Information about sex was provided for all individuals in this chapter; there are no unknown or not stated cases for any of the CJS organisations discussed. ↩
-
Following the Transforming Rehabilitation reforms to probation and creation and subsequent transfer of the National Probation Service (NPS) into NOMS on 1 June 2014, it is not possible to make a direct comparison to previous years for probation staff. Data is not available for Community Rehabilitation Companies. ↩
-
Caution should be taken when comparing figures for senior staff, however, because the numbers of individuals represented are small - changing a single case could have a noticeable effect. ↩
-
Senior roles are as follows: CPS: Senior Legal Manager, Chief Crown Prosecutor and Senior Civil Servant; MoJ: Senior Civil Servant; HMPPS: Senior Civil Servant; Police: Chief Inspector, Superintendent, Chief Superintendent, and Chief Officers; Judiciary: High Court Judges, Heads of Division and Lord Justices of Appeal. ↩