Why do children go into children’s homes?
Published 13 April 2022
Applies to England

© Crown copyright 2022
This publication is licensed under the terms of the Open Government Licence v3.0 except where otherwise stated. To view this licence, visit nationalarchives.gov.uk/doc/open-government-licence/version/3 or write to the Information Policy Team, The National Archives, Kew, London TW9 4DU, or email: psi@nationalarchives.gov.uk.
Where we have identified any third party copyright information you will need to obtain permission from the copyright holders concerned.
This publication is available at https://www.gov.uk/government/publications/why-do-children-go-into-childrens-homes/why-do-children-go-into-childrens-homes
Introduction
Not very much is known, particularly on a qualitative basis, about why children enter children’s homes. For example, the Department for Education (DfE)’s national data collections do not currently capture this information.
We have therefore carried out a study to find out how well matched children are to their homes and the extent to which their participation, views, wishes and feelings are considered in the decision-making process. Our study looks at a small group of children who have a very wide and diverse set of needs and who live in children’s homes that were visited by Ofsted inspectors in late 2019.
We have collated the rich knowledge that individual inspectors gathered from questionnaires during these selected inspections in a structured way. From this, we look at aspects of the matching process, but also provide insights into the diverse and complex needs of children who go into children’s homes and the life experiences that, partly or wholly, led to them living there.
This study shows just how challenging it is to provide sufficient care for children, particularly for those whose needs are complex. There simply being a vacancy in a children’s home reasonably near to where a child currently lives does not mean that the home can meet the needs of that particular child.
Local authorities (LAs) in England have a ‘sufficiency duty’ to ensure, so far as is ‘reasonably practicable’, that there is sufficient accommodation within their area to meet the needs of its children in care. The lack of suitable accommodation for children and the uneven distribution of children’s homes across the country is well documented. This is alongside an increasing need for homes and carers that can meet the diverse and complex needs of children. Across the country, there are children who are living outside of their LA, particularly in children’s homes. (For some children, this may be by choice and be a positive outcome for them.)
In order to understand the barriers that exist to LAs achieving sufficiency, we must consider the needs of the children who go into children’s homes. We have also started to explore the other side of the equation: what services children’s homes provide and what needs they are able to meet.[footnote 1] We will be publishing more on this later in 2022.
Main findings
Our main findings from the questionnaire responses of those who took part in the study show that:
- the current placement was the first time ever in care for almost one fifth of the children
- residential care was part of the intended care plan for just over half of the children
- foster care was part of the original care plan for just over one third of the children
- two thirds of the children entered a children’s home because of some form of interruption in their previous care: foster placement breakdown (41%), children’s home breakdown (15%) or family breakdown (12%)
- the move to a children’s home was planned for almost four fifths of the children; that is, all the necessary preparations were made in advance
- the move to a children’s home was an emergency move for one fifth of the children; that is, events either at home or in another care placement meant that urgent action had to be taken that resulted in the child entering the children’s home
- around three quarters of the children were judged – by the inspector and registered manager – to be well matched to the home
Methodology
Each year, Ofsted inspectors visit at least 6,500 children living in children’s homes. As part of the inspection, they have discussions with children, care home staff and stakeholders[footnote 2] about the children’s needs, their care history and how their needs are being met.
Although inspectors hold these discussions in over 2,300 homes each year, we have not collated and analysed the rich information they provide in this way before. Furthermore, although there have been some studies of this subject, the existing academic evidence is limited.
As part of this study, we devised a questionnaire for inspectors to use on their inspections of children’s homes. This included questions that inspectors normally ask on inspection such as:
- basic characteristics of the child (age on entry, gender, legal status and ethnicity)
- details about the home, the date of the child’s admission and the LA that placed them in the home
- whether the placement was planned
- the number of previous placements
- the reasons for the placement
- the degree to which the child was well matched to the home
This study involved 83 homes and 113 children. They were selected randomly. Some information was not collected for every child or home and so each section throughout this report will state the number of respondents that we collected data for.
In some respects, the selection is representative of the children’s homes estate and the residential population. However, in other respects, such as the age and sex of the children, and the location (in or out of a child’s home LA) and size of the home in which the children lived, it is not.
The results of our study cover some new ground, particularly about whether the admission to the home was planned, the reasons why a child came to the home, whether the child was well matched to the home and whether the child’s needs were met.
We collected the data in late 2019 and completed most of the analysis by early 2020. However, plans to publish the report were revised because of the COVID-19 pandemic. This means that the study was carried out before some major recent publications, including the Independent Care Review.[footnote 3] The results will be of interest to those wanting to understand the complexity of the subject of sufficiency – the provision of the right care, in the right place, at the right time, in order to best help children in need of care achieve the best outcomes. For example, our report may shed further insight into the issues highlighted in the recent Competitions and Markets Authority report on the social care market.[footnote 4]
Our sample size was small and may not be representative of all children who are resident in children’s homes. However, even this limited selection of children and children’s homes shows that children in care are very diverse. Our findings illustrate the crucial part that children’s needs play in the discussion about sufficiency, and that their needs can be multifaceted.
See Appendix 1 for further details about the methodology and limitations of the research and Appendix 2 for more details about the sample.
What research has already been done on the topic?
Children’s homes are never far from the forefront of public debate. In 2020 alone, Research in Practice and the Children’s Commissioner both published major research on children’s homes.[footnote 5] Both challenged the status quo on the subject and proposed an overhaul of the care sector. More recently, in 2021, the Local Government Association published research on the topic, and it is an important focus of the Independent Care Review.[footnote 6]
Many aspects of children’s homes have been researched: how children’s homes function; children’s outcomes; the quality of care; why children go missing from children’s homes; the role of youth justice; the qualities of effective homes; children’s views of their own care; leadership and management; and, most recently, the workforce.[footnote 7] Each of these studies touches on some aspects of children’s characteristics, and some feature a high-level view of children’s needs, but they rarely include the reasons why children went into children’s homes. This is possibly because of 3 commonly held views:
- The first is that, compared with their peers in foster care, children in children’s homes have often had ‘by far the most troubled histories and a greater combination of adversities’.[footnote 8]
- The second is that children’s homes are where children with very complex needs go when either their family arrangements or their other care placements break down.
- The third is that residential children’s homes are often, albeit wrongly, seen as a last resort or second best to foster homes.[footnote 9] Perhaps, consequently, the reasons why children go into homes are often just assumed and not discussed at much length.
This paper aims to challenge and moderate some of these views.
One study that is an exception and that does include the reasons why children went into children’s homes is ‘Living in children’s residential homes’, which is co-authored by David Berridge, an academic who has done a lot of research on children’s homes.[footnote 10] His study selected children from 48 children’s homes to look at the main reason for their placement, as well as some other areas of interest, such as the number of care placements before the current one. Although it did not touch on the events that had precipitated the placement, it found that the 2 most common reasons for placement were long-term care and upbringing and preparation for independence.
Most recently, What Works for Children’s Social Care has published its ‘Are local authorities achieving effective market stewardship for children’s social care services?’ report. Among its key findings are the lack of availability of local specialist, emergency and therapeutic placements and that LAs are ‘struggling to navigate the marketised system of children’s residential care’.[footnote 11]
What did we find?
Commonly, children will have more than one reason for going into a children’s home. For example, of the 18 children for whom this was a first placement, family breakdown occurred for 13 children, 7 experienced child sexual exploitation, 5 experienced mental health issues and 5 had gone missing.
The largest groups of children who went into residential care were those aged 14 and 15, respectively. This was for multiple reasons that we summarise later. Some children had been in long-term foster care or with family or kinship care and had reached a pivotal point in their teenage years that had resulted in a placement breakdown. Our questionnaire did not include questions that would help to identify whether early intervention with the family or foster carer might have prevented the breakdown. The absence of early help for families of adolescents or the need for more intensive therapeutic mental health support combined with the developmental changes associated with that period in a child’s life are likely to be among further reasons for children entering residential care.
Further breakdown by age and prior placement is in figures 1, 2, 3 and 4 (see Appendix 2).
Was residential care the original plan for the child and, if not, what was the original plan?
Out of 111 children, residential care was the original plan for just over half (59). The vast majority of this group were older children: 49 were 14 or older.
Of the 59 children:[footnote 12]
- 18 had experienced a family breakdown
- 18 had experienced sexual exploitation
- 16 had gone missing from previous placements necessitating residential care
- 11 had experienced mental health issues
- 10 had experienced a breakdown with foster carers
- 10 had experienced criminal exploitation
- 8 had experienced a children’s home breakdown
- 5 had experienced substance misuse
- 1 had experienced adoption breakdown
- 2 had a secure order (they had been in secure accommodation on welfare grounds)
Of the other 52 children, just over half (27) were 13 and under. Their original plan was as follows:
| Original plan | Number of children |
|---|---|
| Foster care | 39 |
| Kinship care or special guardianship order | 5 |
| Foster care or children’s home | 3 |
| Other, including: adopted, returned to their family/community or had been turned down by over 70 providers that could not meet their needs | 5 |
The data for this group, where just under half were not originally going to go to a children’s home, chimes with the narrative that children’s homes are a last resort and fostering is the better care alternative. Yet, a child and adolescent counsellor, exploring the possible impact of professionals’ own negative views of children’s homes, wrote in 2019:[footnote 13]
There are many reasons why a good quality children’s home may be a better option than a foster home for some children in care. Perhaps living with a substitute family is simply too painful – too stark a reminder of what they have lost or never had – or perhaps a child might feel that if they attach or bond with another family, they will be betraying their own. It could also be [that] a child’s early experience of a family home was frightening and abusive – so they just do not feel safe in that environment.
Of the 52 children whose original plan was not residential care, 31 entered a children’s home because their foster care placement had broken down. Most of this group (28) had 3 or more previous fostering breakdowns. This data tallies with The Fostering Network’s ‘State of the nation’s foster care’ report,[footnote 14] which stated that one third of foster carers said that the child’s placement had an unplanned ending. Alongside the rise in the number of children in care, the Association of Directors of Children’s Services has documented that there has been a change in the last few years of the profile of children in care.[footnote 15] Children have more complex difficulties, including serious physical and mental health problems, as well as developmental problems. The Fostering Network reported that 48% of foster carers said that children do not have access to suitable mental health support.[footnote 16] To what extent, therefore, are unmet mental health needs contributing to the breakdown of foster care placements?
Was this a planned move?
Out of 113 children, 99 had a planned move to a children’s home. This means that children had experienced planning that typically included one or more of the following: visits, overnight stays and ongoing communication between the home and the placing authority.
Out of those who had a planned move to a children’s home, for around half (46), residential care was not the original plan for the child. For most of this group (42, or 37% of all the children), another foster care placement had been the original plan. This may have been because their needs had changed or been better articulated following their fostering placement.
Around 10% of the 113 children (14) had an unplanned move, where no detailed preparation was completed in advance. This was mostly due to a breakdown of an existing fostering placement (5) or an existing children’s home placement (4), or because of a family breakdown necessitating a first episode of care (3). Of this group, half were not originally supposed to go into a children’s home.
Was this an emergency move?
Around 1 in 6 of 105 children (19) experienced an emergency move. An emergency placement is an immediate or same-day move.
Most of these emergencies were due to changing needs, which had therefore triggered a social care intervention. The emergencies had a diverse range of causes, such as mental ill-health, the child going missing or other serious incidents, that had led to some form of family or foster care breakdown. One child, for example, came to a children’s home after their father had died because the rest of the family were unable to cope. Of those who had an emergency move, 6 children were entering care for the first time.
What was the event(s) that led to the child living at the home?
The reasons why the children in our study entered children’s homes were often complicated, and there were almost always multiple causes. The immediate cause (for example, a placement breakdown) signals more complex causes that are to do with the child’s needs and past experiences, in and out of care.
For 67% of 113 children (76), the child had entered the home because of some form of interruption in their previous care as follows:
| Interruption | Number of children |
|---|---|
| Foster placement breakdown | 46 |
| Children’s home breakdown | 17 |
| Family breakdown | 13 |
| Return to care following adoption placement breakdown | 4 |
The most common risks that led to a child moving to a children’s home were:
| Risk | Number of children |
|---|---|
| Child sexual exploitation | 25 |
| Going missing | 24 |
| Criminal exploitation | 11 |
| Staff/foster carers unable to manage behavioural needs | 10 |
The full list, taken from free-text responses, is in table 12 (see Appendix 2).
Why was this home chosen?
The inspectors identified the factors that influenced the choice of the home, and reflected the views of social workers in these responses. For almost half of 112 children (47), the home was chosen because it could meet the child’s needs. As can be seen from table 12 in Appendix 2, those needs were many and often complex. This does not mean that the homes chosen for the remaining children were inappropriate; it means that the reason for the choice was not noted down.
In 18 cases, it was particularly important that the children were placed within their home LA, and therefore close to their original homes. Inspectors identified this as important because children are more likely to go to a children’s home outside their home LA than one within it: 64% of those included in research by the Children’s Commissioner[footnote 17] did so, compared with 83% of our sample.
In 14 cases, the choice of home was influenced by the need to ensure continuity in family relationships and, in 14 cases, continuity in the child’s education. In 3 cases, a home specialising in child sexual exploitation was needed.
In 23 cases, the child was placed in the home because it offered a therapeutic environment.[footnote 18] We will be publishing further work on the specialist support that homes provide later in 2022.
In 6 cases, the child was placed in the home because it was the only available placement.
What did the study tell us about current needs and risks?
The most numerous risks and needs were as follows:
| Risk/need | Number (%) of children |
|---|---|
| At risk of going missing | 28 (25%) |
| Staff unable to safely manage behavioural needs | 23 (20%) |
| At risk of child sexual exploitation | 20 (18%) |
| At risk of self-harm | 10 (9%) |
| Autism spectrum disorder | 8 (7%) |
Please see table 12 in Appendix 2 for a comprehensive list.
In 98 cases, the referral document reflected the child’s current risks and needs well;[footnote 19] however, in 14 cases, it did not. In 9 of these cases, the inspector recorded concerns about the referral document. In 3 of the documents, there was a general lack of detail or understanding of complexity. Also missing from referral documents was current information on the child’s behaviour, including the severity of behaviour and threats to self-harm, and, in 1 case, a psychiatric report.
Is the child well matched to the home?
To assess how well matched children were to the home, inspectors used their own experience of meeting the child in the home during the inspection, the child’s views, the views of the social workers and the managers of each home to establish whether the child was settled and thriving. The inspectors’ views, though, were also influenced by the context of what alternative provision was available at the time for the child, and the possible limitations of this will have impacted on what they recorded. Inspectors judged that 75% (82) of 109 children were well matched to the home and that 25% (27) were not well matched.
One example of a well-matched placement was a 14-year-old who was at risk of going missing and of child sexual exploitation. The young person was ‘now engaging with the home, social workers, agencies and education, and the risks have reduced’. The reasons why other placements were working were, again, diverse, but often they had similar themes to this. For another child, an inspector noted: ‘the home is nurturing, staff are well trained to meet young people’s emotional needs and education is a key focus. Significant progress [is] already evident since [they were] placed.’
Of the 82 children found to be well matched to their children’s home placement, 36 had some form of foster care as their original care plan.
Where the children were not well matched, the reasons were diverse, but were often based on the following 2 points, sometimes linked and sometimes independent of each other:
- the needs of the child were so high and so challenging that another home was more suitable
- the current home did not have the knowledge or skills to provide effective care for the child
Sometimes a child was not well matched because other children were bullying and intimidating them; sometimes it was because it became clear over time that the child needed a solo placement in order to thrive; and sometimes it was because there was no suitable education available nearby. Of the 23 children that there was detailed data for, no two were alike in either their complex needs or in the reasons why they were in a placement unable to fully meet their needs.
For each child thought to be not well matched, discussions were already underway between the manager and the commissioning LA about what was best for the child in the near future.
Summary
The limited number of questions (see Appendix 3) that inspectors asked about our small group of children has produced some rich data in several areas. The complexities of the children’s past lives, and the diversity of their needs and experiences, as they were in the autumn of 2019, are amply documented.
The information we have gathered helps to illustrate the challenges faced by the children, and by social workers and commissioners trying to find suitable care for them, as well as by the children’s homes that are aiming to meet the children’s needs.
The children’s homes in this selection broadly met the needs of 2 main groups: children, mostly older, for whom residential care was seen as the best option; and children, mostly younger, for whom other kinds of care were either envisaged or had been tried first.
Around two thirds of the children entered the children’s home because of some form of interruption in their previous care. Breakdown of a foster placement was the likeliest event, followed by children’s home breakdown and family breakdown. In the case of 4 children that experienced a breakdown of an adoption placement, it was a return to care (for more details, see Appendix 2).
For the vast majority of the children, the move to the children’s home was planned. For a small minority, it was unplanned. And for a slightly larger group, it was an emergency move, in response to a breakdown of either a previous care placement or in family life.
The evidence from this group of children is that, even though just under half of them were originally supposed to go to destinations other than children’s homes, around three quarters were thought to be well matched to the home. This demonstrates the flexibility of many homes to adapt to children’s needs.
We plan to publish more on the diversity of needs that children’s homes try to meet, and, separately, something on how far children travel to those homes. These are important elements in the discussion about how to ensure that there is sufficient provision.
The breadth of needs described here for our small group of children touches on other areas where our collective knowledge is poor. Although the DfE’s national collection of data on children in care captures some information, this is at a very high level and only captures one element of need. To understand sufficiency properly, we must better understand the extent of the needs of children in care, and better understand the dynamics experienced by the children, their carers, LA senior managers, social workers, commissioners and independent reviewing officers. In order to do this, it is necessary to carry out a proper national audit of the needs of children in care.
The authors of the Independent Care Review’s ‘The case for change’, while discussing the social care market and the role of commissioning, observed that ‘in all of this it is easy for the child’s experience to be lost’.[footnote 20] One of the aspects of this small study was to try and capture some of that experience. One of the inspectors recording the needs of an 8-year-old child whose mother had died recently, and who was distressed, wrote that the child had a ‘high need for love and nurture’. This applies in all sorts of different ways to all the vulnerable children in this selection, as well as to all children in care. Meeting those needs, and ensuring that the needs of all children in care are met, is at the heart of the work of all of those who contributed to this data study.
With thanks to the members of the Ofsted Social Care Research Group: Amanda Ellis, Catherine Sikakana, Sarah Junor-Fitzpatrick, Anne Waterman and Louise Warren, as well as to Edward Jones and Adam King.
Appendix 1: Methodology and limits of study
The research group devised a questionnaire that included questions about the children and about some of the reasons why they entered the children’s homes. These are the usual questions that inspectors ask during the discussions about children that form part of every inspection of a children’s home. We compiled these questions into a questionnaire for this study to ensure consistency in information-gathering.
This research was carried out in 2 phases. In the first phase, inspectors used a questionnaire with 15 questions (see Appendix 3). In the second phase, the group revised the questionnaire and added questions on the home’s unique reference number (URN), the placing authority and the date the child was admitted. Inspectors asked the questions to the registered manager and at least 1 child in each home who had come to live at the home since the previous inspection.
The children’s homes in this study excluded secure children’s homes, residential special schools registered as children’s homes and short-break-only children’s homes.
Thirty regulatory inspectors collected the data during their inspections between September 2019 and December 2019. The homes visited were located in 48 separate LAs, in all 8 Ofsted regions: East Midlands (4); East of England (1); London (4); North East, Yorkshire and the Humber (13); North West (8); South East (5); South West (4); and West Midlands (9).
We collected data on a total of 113 children from a random sample of inspections of homes: 28 children in the first phase and 85 children in the second phase. This equates to about 2% of all children living in children’s homes at any one time in the relevant year.
There was no attempt to make this a representative sample of the population of children in children’s homes, which was around 6,800, or of types of homes. So, while it reflects the information on the children at the time of inspection, and the views of the individual inspectors who collected the information, it may not represent the wider group of children living in children’s homes.
We have a complete dataset for 69 of the 113 children. For 33 children’s questionnaires, data was not completed for much of the following: Ofsted URN (not collected in phase 1); placing authority (not collected in phase 1); the LA in which the home was located; whether the child was placed in or out of their home LA; the size of the home; the latest overall effectiveness judgement and the date of admission (not collected in phase 1). What data is available is indicated in each section. Comparator population data was taken for all children in care in children’s homes from the unpublished DfE SSDA903 data collection for 2019–20.
Appendix 2: Supplementary tables and data
The sources for all data below are the Ofsted data collected as part of this study and the unpublished DfE SSDA903 data for 2019–20.
Children’s characteristics
Age
The data available for children’s age was from 113 children in the study.
Figure 1: Age of children when they entered a children’s home
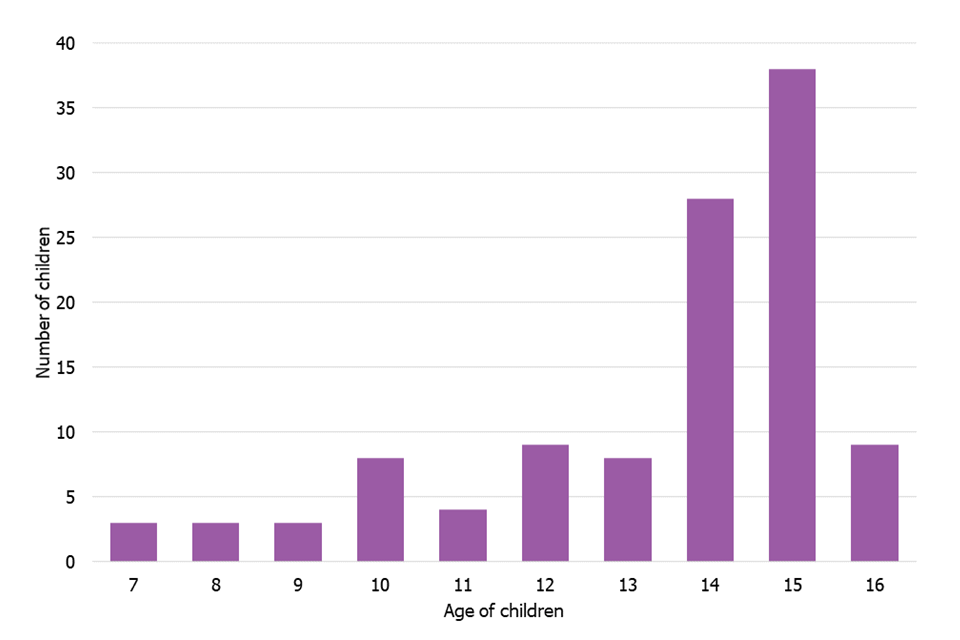
Source: Ofsted study data, 2019.
View data in an accessible table format.
Children in the sample were most likely to have started living at their home at the age of 14 or 15. No children began living at their home when they were below the age of 7. Compared with the most recently available child-level data, for 31 March 2020, the children in this selection were exceptionally young when they entered the homes.
Figure 2: Percentage of ages of children at the start of their children’s homes placement
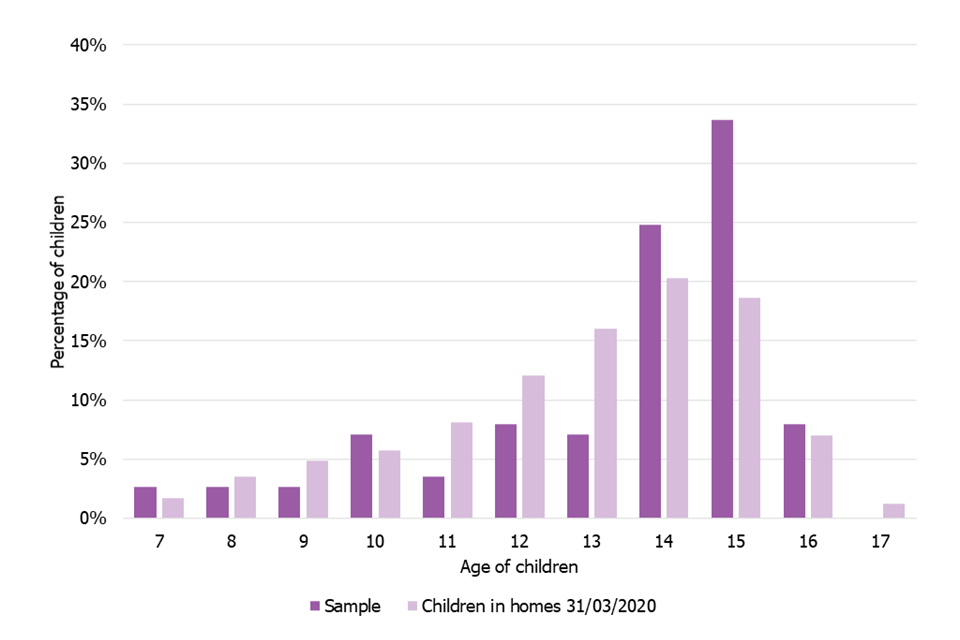
Sources: Ofsted study data, 2019; DfE SSDA903 data, 2020.
View data in an accessible table format.
Children aged 14 and, particularly, 15 were over-represented in the sample, while the 11 to 13 age group was under-represented, particularly children aged 13.
Ethnicity
The data available for children’s ethnicity was from 113 children in the study.
The ethnic breakdown of children was similar to that of the total children’s homes population.
Table 1: Ethnicity of children
| Ethnic group | Number of children (Ofsted study data) | % (Ofsted study data) | % in children’s homes (DfE data) |
|---|---|---|---|
| White | 91 | 81% | 80% |
| Black/Black British | 10 | 9% | 6% |
| Mixed heritage | 9 | 8% | 9% |
| Asian/Asian British | 0 | 0% | 3% |
| Other | 3 | 3% | 2% |
| Total | 113 | - | - |
Sources: Ofsted study data, 2019; DfE SSDA903 data, 2020.
Three quarters of children were White British. Black British children were slightly over-represented and Asian British children under-represented.
Gender
The data available for children’s gender was from 113 children in the study.
There were 55 girls and 58 boys in our sample.
Table 2: Gender of children
| Gender | % (Ofsted study data) | % in children’s homes (DfE data) |
|---|---|---|
| Female | 49% | 37% |
| Male | 51% | 63% |
Sources: Ofsted study data, 2019; DfE SSDA903 data, 2020.
Boys were under-represented, as they made up almost two thirds of the general population of children in homes in the year, but only around half of the sample.
Legal status
The data available for children’s gender was from 112 children in the study.
Of these children:
- 70 were under section 31 of the Children’s Act 1989 (full care order)
- 31 were under section 20 of the Children’s Act 1989 (voluntary care arrangement)
- 10 were under section 38 of the Children’s Act 1989 (interim care order)
Table 3: Legal status of children
| Legal status | % (Ofsted study data) | % in children’s homes (DfE data) |
|---|---|---|
| Section 31 | 63% | 65% |
| Section 20 | 28% | 28% |
| Section 38 | 9% | 7% |
Sources: Ofsted study data, 2019; DfE SSDA903 data, 2020.
Care experience
The data available for the number of care experiences was from 107 children in the study.
For 17% of the children (18), this was their first care experience. Most of these children were in adolescence when they entered the home. For 45% of the children (48), it was their first or second care experience. The average number of prior placement moves was just under 3 per child.
Figure 3: Number of placements before entering the children’s home
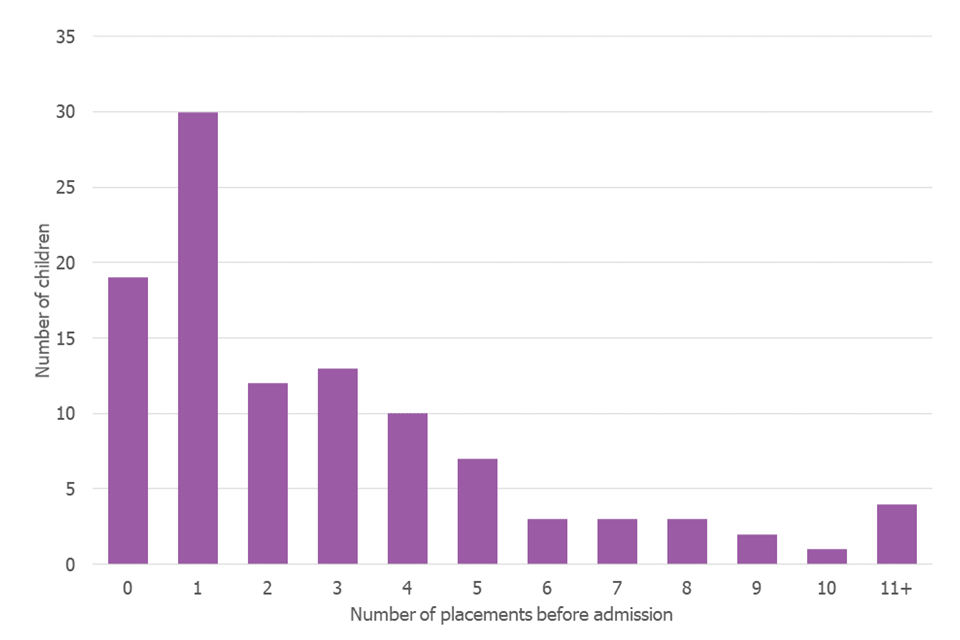
Source: Ofsted study data, 2019.
View data in an accessible table format.
Figure 4: Percentage of placements before entering the children’s home: sample and 2019 population comparison
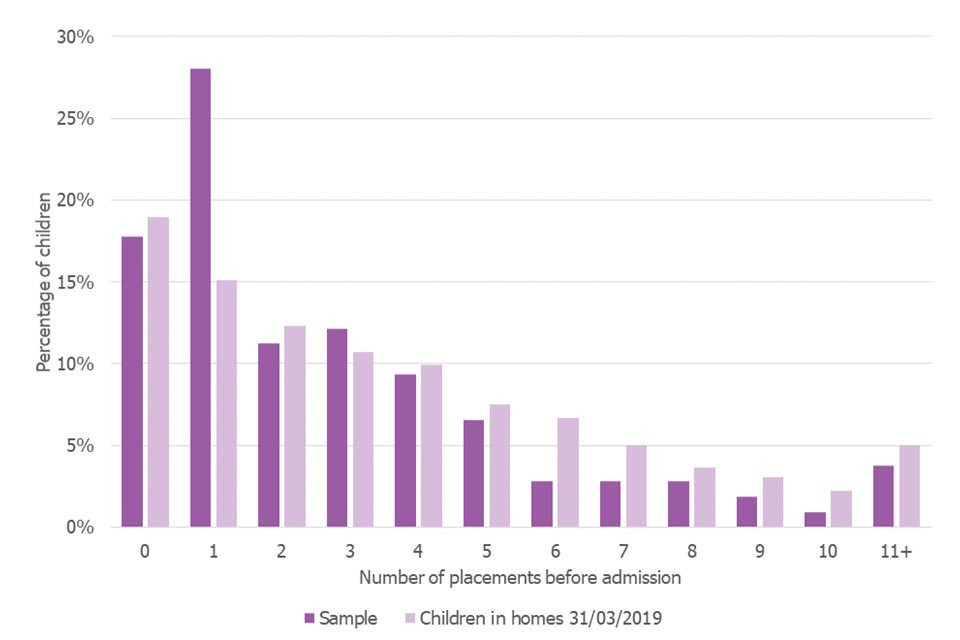
Sources: Ofsted study data, 2019; DfE SSDA903 data, 2019 (2020 data not yet calculated).
View data in an accessible table format.
Children with no care experience were slightly over-represented in the sample, and those with 1 previous placement were heavily over-represented. Children with 4 or more previous placements were under-represented.
Of the 17% (18) of children for whom this was the first placement, most (14) were aged between 14 and 16. Of the 30 for whom it was the second placement, just over half (19) were aged 14 to 16.
Children suffering significant disruptions
This study also identified members of another sub-group of children who had suffered significant disruption. This very small sample of children (8 of the children selected) had experienced some form of adoption breakdown in their past. This figure was higher than might be expected from a random sample of children in care: published research found that the rate of breakdown for adoptions was 3.24% over a period of 12 years following an adoption order.[footnote 21] Conversely, though, the sample of children did not feature any who had left care on either a residence order or a special guardianship order, whose rates of disruption we found to be higher.
Information about the homes
Size of home
The data available for the size of the children’s home was from 83 homes in the study.
Figure 5: Size of children’s homes in the selection
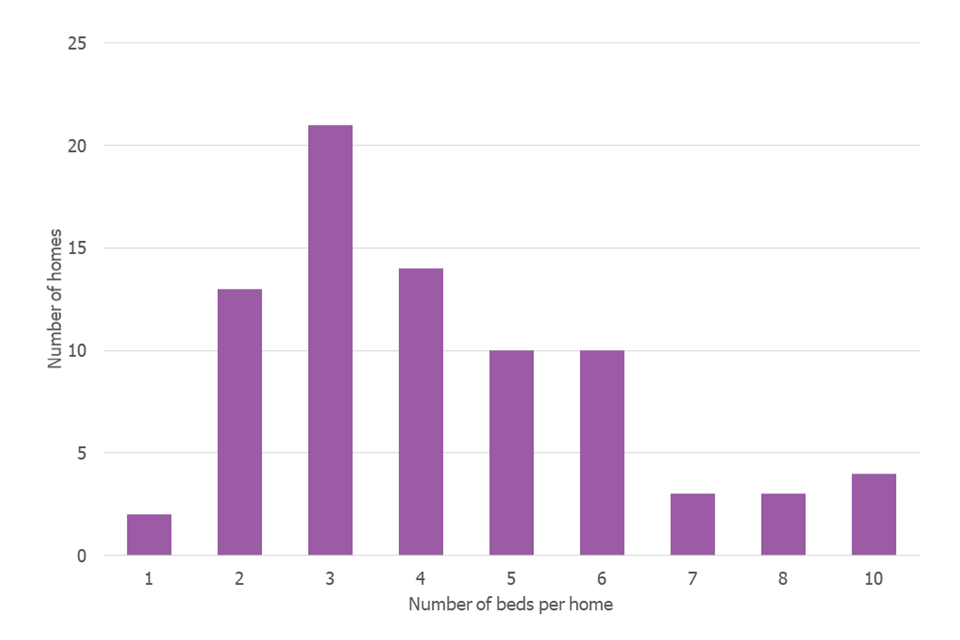
Source: Ofsted study data, 2019.
View data in an accessible table format.
Most children in the sample, and in the wider population, are living in homes with a capacity of 5 children or fewer.
Figure 6: Size of homes, selection versus all homes
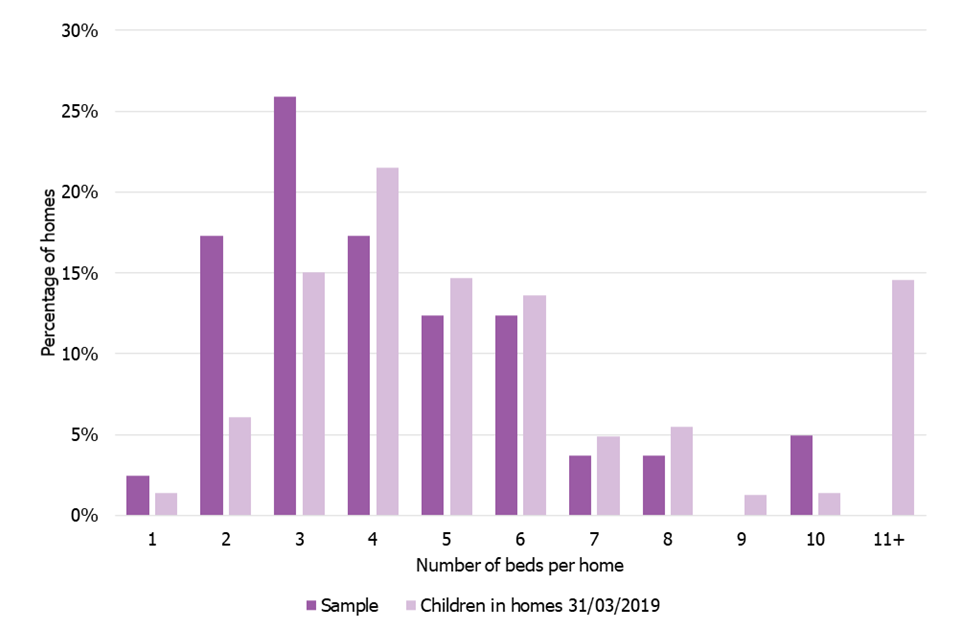
Sources: Ofsted study data, 2019; DfE SSDA903 data, 2019 (2020 data not yet calculated).
View data in an accessible table format.
However, children in 2- and 3-bedroom homes are very over-represented in the sample and children in homes with more than 10 beds (14% of the population) are not represented at all.
Sector
The data available for the sector of the children’s home was from 83 homes in the study.
Of the 83 homes for which we had URNs, 66 were run privately, 10 were run by the LA and 7 were from the voluntary sector.
Table 4: Sector of homes
| Sector | % (Ofsted study data) | % in children’s homes (DfE data) |
|---|---|---|
| Private | 79% | 77% |
| LA | 12% | 16% |
| Voluntary | 9% | 7% |
Sources: Ofsted study data, 2019; DfE SSDA903 data, 2020.
The sample reflects the sectoral split of the population reasonably closely, though private homes were slightly over-represented and LA homes slightly under-represented. These sample figures reflect the heavy reliance by LAs on private sector provision in children’s homes. This reliance is increasing each year as the number of private sector homes grows and the number of LAs shrinks.[footnote 22]
Placing LAs
The data available for children’s placing LAs was from 80 children in the study.
Information on the LAs that were responsible for the relevant children in care showed that children were living at some distance from their home: 14 were living in homes within their own LA and 66 were living outside their own LA.
Table 5: Location of children, whether inside or outside of their LA
| Home location | % (Ofsted study data) | % in children’s homes (DfE data) |
|---|---|---|
| In LA | 18% | 34% |
| Outside LA | 83% | 66% |
Sources: Ofsted study data, 2019; DfE SSDA903 data, 2020.
Although most children live in children’s homes that are outside their own LA area (64%), this group was heavily over-represented in the sample (83%).
Fifty-five placing LAs were represented in the sample, 2 of which were Welsh. All English regions were represented (see Table 8).
The inclusion of the Welsh councils – Conwy and Wrexham – offers a rare glimpse of a group that there is no formal data collection for: children from outside of England living in English children’s homes.[footnote 23] This remains a relatively unexplored topic.
The home’s location
The data available for the location of the children’s home was from 80 homes in the study.
These homes were located in 48 separate LAs, one third of the number of LAs that had homes at the time. Again, all regions were represented. A list of the LAs is in table 8.
Overall effectiveness
The data available for the latest Ofsted overall effectiveness judgement of the children’s home was from 77 homes in the study.
Table 6: Latest Ofsted overall effectiveness judgement for the homes selected
| Overall effectiveness judgement | Number of homes |
|---|---|
| Outstanding | 11 |
| Good | 52 |
| Requires improvement to be good | 11 |
| Inadequate | 3 |
| Not yet inspected | 3 |
Good or outstanding homes, 63 out of 77 (82%), were slightly over-represented in the sample. In March 2020, 80% of homes were good or outstanding.
Table 7: Age of entering the children’s home and number of prior placements
| Number of placements | Age 7–10 at entry | Age 11–13 at entry | Age 14–16 at entry | All |
|---|---|---|---|---|
| 0 | 2 | 2 | 15 | 19 |
| 1 | 4 | 7 | 19 | 30 |
| 2 | 3 | 0 | 9 | 12 |
| 3 | 0 | 4 | 8 | 12 |
| 4 | 2 | 2 | 7 | 11 |
| 5 | 0 | 2 | 5 | 7 |
| 6+ | 4 | 4 | 8 | 16 |
| Total | 15 | 21 | 71 | 107 |
Table 8: LAs of the homes
| LA of home | LA of home |
|---|---|
| Barnet | Leeds |
| Barnsley | Milton Keynes |
| Birmingham | Newcastle upon Tyne |
| Blackpool | Northamptonshire |
| Bradford | Northumberland |
| Cheshire East | Nottingham |
| Cheshire West and Chester | Nottinghamshire |
| Cornwall | Plymouth |
| Darlington | Redbridge |
| Derbyshire | Sandwell |
| Devon | Sheffield |
| Doncaster | Shropshire |
| Durham | Somerset |
| Ealing | Staffordshire |
| Essex | Stockport |
| Hampshire | Stockton-on-Tees |
| Herefordshire | Sunderland |
| Hillingdon | Tameside |
| Isle of Wight | Telford and Wrekin |
| Kent | Trafford |
| Kingston upon Hull | Walsall |
| Kirklees | Wiltshire |
| Knowsley | Wolverhampton |
| Lancashire | Worcestershire |
Table 9: Placing LAs
| Placing LA | Placing LA |
|---|---|
| Barnsley | Luton |
| Birmingham | Manchester |
| Bolton | Middlesbrough |
| Bradford | Northamptonshire |
| Bromley | Nottingham |
| Cheshire East | Nottinghamshire |
| Cheshire West and Chester | Oldham |
| Conwy | Oxfordshire |
| Cornwall | Plymouth |
| Croydon | Redcar and Cleveland |
| Darlington | Rotherham |
| Derbyshire | Sheffield |
| Devon | South Tyneside |
| Doncaster | Southampton |
| Durham | Staffordshire |
| Ealing | Stockport |
| Essex | Stoke-on-Trent |
| Gateshead | Sunderland |
| Hackney | Surrey |
| Hampshire | Sussex |
| Haringey | Swindon |
| Hertfordshire | Thurrock |
| Isle of Wight | Torbay |
| Kingston Upon Hull | Wakefield |
| Kirklees | Walsall |
| Lancashire | Worcestershire |
| Lewisham | Wrexham |
| Liverpool | - |
Table 10: Events that led to the child living at the home recorded in free text
| Event that led to the child living at the home | Frequency |
|---|---|
| Foster placement breakdown | 42 |
| Family breakdown | 26 |
| Child sexual exploitation | 25 |
| Going missing | 24 |
| Children’s home placement breakdown | 16 |
| Mental health issues | 15 |
| Child criminal exploitation | 11 |
| Aggression issues | 10 |
| Sexualised behaviours | 6 |
| Substance misuse | 5 |
| Adoption breakdown | 3 |
| Special educational needs and/or disabilities | 4 |
| Health | 3 |
| Secure order had expired | 3 |
| Attachment issues; children’s home placement breakdown (involuntary); deprivation of liberty; independent living (hotel accommodation); learning disability; move from residential special school; placement breakdown; release from prison; risk-taking; risky behaviours; trafficking | 2 or fewer |
‘Frequency’ refers to a count of events. Some children experienced multiple events, so there will be some double counting.
Table 11: Reasons why the home was chosen recorded in free text
| Reasons why the home was chosen | Frequency |
|---|---|
| Appropriate placement to needs | 47 |
| Therapeutic environment | 23 |
| Home within placing authority | 18 |
| Educational continuity | 14 |
| Family continuity | 14 |
| Educational offer | 9 |
| Out-of-LA placement needed | 8 |
| Only available placement | 6 |
| Already known to the home | 4 |
| Child sexual exploitation designated home | 3 |
| Home close to placing authority | 3 |
| Social continuity | 3 |
| Deprivations of liberty; family proximity; gender specific; identified address; short-term placement; solo placement; transition to semi-independence; unoccupied home | 2 or fewer |
‘Frequency’ refers to a count of events. Some children experienced multiple events, so there will be some double counting.
Table 12: Frequency table of data on risks and needs recorded in free text
| Risks and needs | Number of children |
|---|---|
| Missing | 28 |
| Child sexual exploitation | 20 |
| Aggression | 17 |
| Behaviour | 16 |
| Education | 13 |
| Self-harm | 10 |
| Autism | 8 |
| Trauma | 7 |
| Violence | 6 |
| Therapy | 5 |
| Boundaries | 4 |
| Child sexual exploitation | 4 |
| Drugs | 4 |
| Emotional | 4 |
| School attendance | 4 |
| Sexually harmful behaviour | 4 |
| Substance misuse | 4 |
| Alcohol | 3 |
| Criminal behaviour | 3 |
| Gaming | 3 |
| Learning disabilities | 3 |
| Mental health | 3 |
| Out of education | 3 |
| Property damage | 3 |
| Adoptive family breakdown; anxiety; assault on carers; assaults to adults; attachment; attention deficit hyperactivity disorder; behaviour; bereavement; blindness; bullying; care; challenging behaviour; communication; complex health needs; complex needs; criminal damage; cultural needs; dangerous behaviour; delayed speech; depression; developmental needs; domestic violence in family; eating disorder; education, health and care plan; encopresis; enuresis; epilepsy; exclusions; experienced abuse; experienced alleged sexual abuse; gangs; grooming; harm; harm to animals; harm to others; health conditions; health risks; hoarding; identity; impulsive behaviour; inability to manage own feelings/emotions; independent living skills; intimidation; learning disability; learning needs; life story; limited English; loss; making allegations; manage chronic eczema; neglect; offending; online abuse; oppositional defiant disorder; overweight; physical aggression; physical assault; placement breakdown; poor relationship with parents; possible special educational needs; post-traumatic stress disorder; rehabilitate back to adoptive parents; risk of exploitation; risk of trafficking; running away; safety; self-esteem issues; self-harm; sensory; sexual behaviour; sexualised behaviour; sexually abused; soiling; stability; substance abuse; suicidal ideation; suitable mix of both male and female where needs can be met; supported for semi-independence; transition to independence; verbal aggression; violent behaviour; vulnerable; vulnerable due to age; vulnerable to exploitation; vulnerable to grooming | 2 and fewer |
Appendix 3: Questionnaire
- What is the URN?
- What is the placing authority?
- What was the date of admission?
- What was the age at entry to the home?
- What is the gender of the child?
- What is the ethnicity of the child?
- What is the legal status of the child?
- Was this a planned placement?
- Was this an emergency placement?
- Was residential care the original plan for the child?
- If not, what was the original plan?
- How many placements has this child had prior to admission to the home?
- What was the event(s) that led to the child entering the home?
- Why was this home chosen?
- Are the current needs and risks well reflected in the referral document?
- What are the risks and current needs?
- If current needs and risks are not well reflected in the referral document, please briefly summarise in what way.
- Is the child well matched to the home?
Appendix 4: Data tables for figures
Data table for figure 1: Age of children when they entered a children’s home
| Age of children | Number of children |
|---|---|
| 7 | 3 |
| 8 | 3 |
| 9 | 3 |
| 10 | 8 |
| 11 | 4 |
| 12 | 9 |
| 13 | 8 |
| 14 | 28 |
| 15 | 38 |
| 16 | 9 |
See Figure 1.
Data for figure 2: Percentage of ages of children at the start of their children’s homes placement
| Age of children | % of sample | % of children in homes 31/03/2020 |
|---|---|---|
| 7 | 3% | 2 |
| 8 | 3% | 4 |
| 9 | 3% | 5 |
| 10 | 7% | 6 |
| 11 | 4% | 8 |
| 12 | 8% | 12 |
| 13 | 7% | 16 |
| 14 | 25% | 20 |
| 15 | 34% | 19 |
| 16 | 8% | 7 |
| 17 | 0% | 1 |
See Figure 2.
Data for figure 3: Number of placements before entering the children’s home
| Number of places before admission | Number of children |
|---|---|
| 0 | 19 |
| 1 | 30 |
| 2 | 12 |
| 3 | 13 |
| 4 | 10 |
| 5 | 7 |
| 6 | 3 |
| 7 | 3 |
| 8 | 3 |
| 9 | 2 |
| 10 | 1 |
| 11+ | 4 |
See Figure 3.
Data for figure 4: Percentage of placements before entering the children’s home: sample and 2019 population comparison
| Number of places before admission | % of sample | % of children in homes 31/03/2019 |
|---|---|---|
| 0 | 18 | 19 |
| 1 | 28 | 15 |
| 2 | 11 | 12 |
| 3 | 12 | 11 |
| 4 | 9 | 10 |
| 5 | 7 | 7 |
| 6 | 3 | 7 |
| 7 | 3 | 5 |
| 8 | 3 | 4 |
| 9 | 2 | 3 |
| 10 | 1 | 2 |
| 11+ | 4 | 5 |
See Figure 4.
Data for figure 5: Size of children’s homes in the selection
| Number of beds per home | Number of homes |
|---|---|
| 1 | 2 |
| 2 | 13 |
| 3 | 21 |
| 4 | 14 |
| 5 | 10 |
| 6 | 10 |
| 7 | 3 |
| 8 | 3 |
| 10 | 4 |
See Figure 5.
Data for figure 6: Size of homes, selection versus all homes
| Number of beds per home | % of sample | % of children in homes 31/03/2019 |
|---|---|---|
| 1 | 2 | 1 |
| 2 | 17 | 6 |
| 3 | 26 | 15 |
| 4 | 17 | 22 |
| 5 | 12 | 15 |
| 6 | 12 | 14 |
| 7 | 4 | 5 |
| 8 | 4 | 5 |
| 9 | 0 | 1 |
| 10 | 5 | 1 |
| 11+ | 0 | 15 |
See Figure 6.
Print or save to PDF
To print this content you can:
- use the ‘Print this page’ button under the Contents menu
- right-click or secondary click on the page and choose ‘Print’ in the menu
- press Ctrl + P on a Windows keyboard or Command + P on a Mac
To save, use any of the options above and change the printer destination to save the content as a PDF.
Instructions may vary depending on which internet browser you use, such as Internet Explorer or Google Chrome, and the type of device you use, such as a phone or laptop. You can find your print and save options in your browser’s menu.
-
On lack of current data on the need of children, see M Stanford and M Lennon, ‘Estimating Children’s Services spending on vulnerable children’, Children’s Commissioner, July 2019, page 13. For some preliminary work on what services children’s homes provide, see our paper on short-break-only homes: ‘Children’s homes providing short breaks’, Ofsted, August 2021. ↩
-
Stakeholders can include parents, carers, LAs, educational establishments, child and adolescent mental health services, youth justice services, and a range of other child-specific services. ↩
-
‘The case for change’, The Independent Review of Children’s Social Care, June 2021. ↩
-
‘Children’s social care market study interim report’, Competition and Markets Authority, March 2022. ↩
-
‘Reimagining residential children’s homes: understanding the national picture’, Research in Practice, April 2020; ‘Private provision in children’s social care’, Children’s Commissioner, November 2020. ↩
-
‘Local Government Association children’s homes research’, SEC Newgate Research, January 2021; ‘The case for change’, The Independent Review of Children’s Social Care, June 2021. ↩
-
There is a lot of literature on these topics, but see, for example: D Berridge, ‘Children’s homes’, Wiley Blackwell, 1985; D Berridge and I Brodie, ‘Children’s homes revisited’, Jessica Kingsley Publishers, 1998; L Hicks, I Gibbs, H Weatherly and S Byford, ‘Managing children’s homes: developing effective leadership in small organisations’, Jessica Kingsley Publishers, 2007; D Berridge, ‘Theory and explanation in child welfare: education and looked after children’, in ‘Child & Family Social Work’, Volume 12, 2007, pages 1 to 10; D Berridge, N Biehal, E Lutman, L Henry and M Palomares, ‘Raising the bar? Evaluation of the social pedagogy pilot programme in residential children’s homes’, Department for Education, July 2011. ↩
-
Cited in D Berridge, N Biehal, E Lutman, L Henry and M Palomares, ‘Raising the bar? Evaluation of the social pedagogy pilot programme in residential children’s homes’, Department for Education, July 2011, page 2. ↩
-
See, for a recent reiteration of this, ‘Local Government Association children’s homes research’, SEC Newgate Research, January 2021, page 7. ↩
-
D Berridge, N Biehal and L Henry, ‘Living in children’s residential homes’, Department for Education, March 2012. ↩
-
AM Bach-Mortensen, H Murray, B Goodair, E Carter, E Briggs and A O’Higgins ‘Are local authorities achieving effective market stewardship for children’s social care services?’, What Works for Children’s Social Care, March 2022, page 3. ↩
-
Children may have had more than one issue that had led to their needing to go to a children’s home, so there is some double counting in this list. ↩
-
‘You need to work towards going back to foster care’: how the narrative around children’s homes harms young people’, Community Care, May 2019. ↩
-
K Lawson and R Cann, ‘State of the nation’s foster care’, The Fostering Network, February 2019, page 36. ↩
-
‘Safeguarding pressures phase 7’, Association of Directors of Children’s Services, February 2021, page 77. ↩
-
K Lawson and R Cann, ‘State of the nation’s foster care’, The Fostering Network, February 2019, page 5. ↩
-
‘Pass the parcel: children posted around the care system’, Children’s Commissioner, December 2019. ↩
-
‘Therapeutic environment’ is a term commonly used in providers’ statements of purpose. Inspectors challenge the use of this term to ensure that providers use clear and factually accurate language. The social care common inspection framework (SCCIF), the Children’s Homes Regulations 2015 and the registration guidance do not refer to the term ‘therapeutic’. ↩
-
The referral document is the file on the child that the LA commissioner and social worker prepare before the child joins the home. ↩
-
‘The case for change’, The Independent Review of Children’s Social Care, June 2021, page 59. ↩
-
J Selwyn, S Meakings and D Wijedasa, ‘Beyond the adoption order: challenges, interventions and adoption disruption’, University of Bristol, School for Policy Studies Hadley Centre for Adoption and Foster Care Studies and the Department for Education, April 2014, page 62. ↩
-
‘Children’s social care data in England’, Ofsted, July 2021. ↩
-
Although the DfE’s SSDA903 collection captures data from English LAs on the several hundred children placed in Wales and Scotland, Wales and Scotland do not collect similar child-level data. ↩