UK House Price Index summary: June 2018
Published 15 August 2018

© Crown copyright 2018
This publication is licensed under the terms of the Open Government Licence v3.0 except where otherwise stated. To view this licence, visit nationalarchives.gov.uk/doc/open-government-licence/version/3 or write to the Information Policy Team, The National Archives, Kew, London TW9 4DU, or email: psi@nationalarchives.gov.uk.
Where we have identified any third party copyright information you will need to obtain permission from the copyright holders concerned.
This publication is available at https://www.gov.uk/government/statistics/uk-house-price-index-summary-june-2018/uk-house-price-index-summary-june-2018
1. Headline statistics for June 2018
the average price of a property in the UK was
£228,384
the annual price change for a property in the UK was
3.0%
the monthly price change for a property in the UK was
0.4%
the monthly index figure (January 2015 = 100) for the UK was
119.8
Estimates for the most recent months are provisional and are likely to be updated as more data is incorporated into the index. Read Revisions to the UK HPI data.
Next publication of UK HPI
The July 2018 UK HPI will be published at 9.30am on Wednesday 19 September 2018. See the calendar of release dates.
2. Economic statement
UK house prices rose by 3.0% in the year to June 2018, down from 3.5% in the year to May 2018. This is the lowest UK annual rate since August 2013 when it was also 3.0%.
Looking at the demand for housing, the Royal Institution of Chartered Surveyors’ (RICS) UK Residential Market Survey for June 2018 revealed their new buyer enquiries series was flat, having been negative since early 2017.
On the supply side, RICS reported their new vendor instructions series recorded a positive balance for two consecutive months, the first time this has occurred since early 2016. The average stock per estate agent has been edging up very marginally in recent months.
There has been a rise in time taken to complete a property sale from 16 weeks last year to 18 weeks on average at present. The twelve-month sales expectations series has dropped to zero. Price expectations remain in the positive territory for the next 12 months, albeit less so than previously.
The UK Property Transaction Statistics for June 2018 showed that on a seasonally adjusted basis, the number of transactions on residential properties with a value of £40,000 or greater was 96,340. This is 5.7% lower compared to a year ago. Between May and June 2018, transactions decreased by 3.0%.
The Bank of England’s Money and Credit statistics for June 2018 showed that on a seasonally adjusted basis, 65,619 mortgages were approved in June 2018. This is an increase of 1.4% from the previous month and is above the 6-month average of 63,858. Mortgage approvals are seen to be a leading indicator of transactions volumes.
West Midlands was the fastest growing region with an annual growth rate of 5.8%, up from 5.0% in the previous month. London was the slowest growing region, falling by 0.7% in the year to June 2018, down from negative 0.2% in the previous month.
3. Price changes
3.1 Annual price change
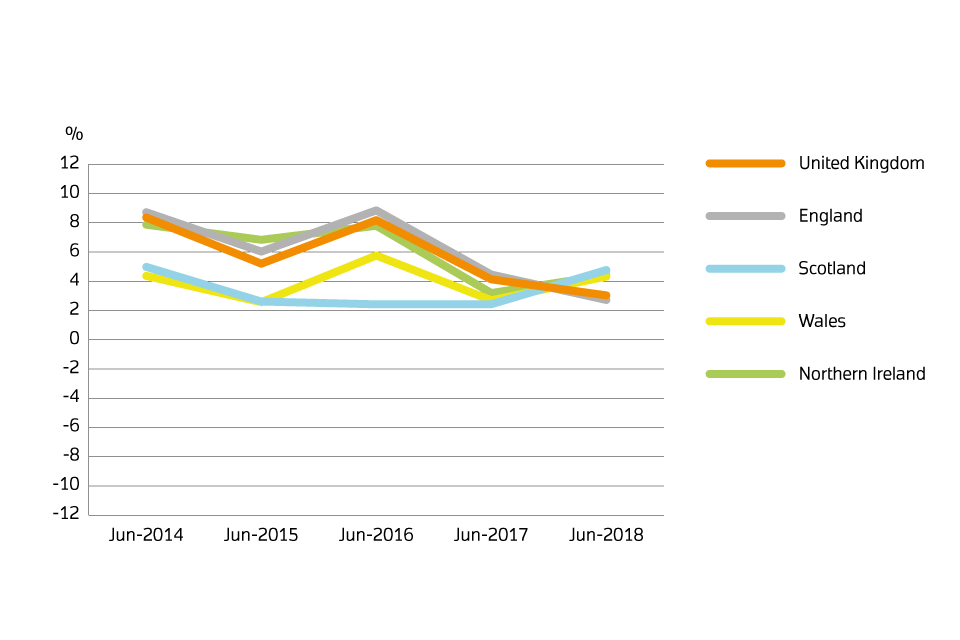
Annual price change for UK by country over the past 5 years
Annual price change for UK by country over the past 5 years
Download this chart’s data (CSV, 1KB)
Average house prices in the UK increased by 3.0% in the year to June 2018 (down from 3.5% in May 2018).
At the country level, the largest annual price growth was recorded in Scotland, where house prices increased by 4.8% over the year to June 2018.
Wales saw house prices increase by 4.3% over the last 12 months.
In England, the average price increased by 2.7% over the year.
The average price in Northern Ireland increased by 4.4% over the year to quarter 2 (April to June) 2018.
3.2 Average price by country and government office region
Price, monthly change and annual change by country and government office region
| Country and government office region | Price | Monthly change | Annual change |
|---|---|---|---|
| England | £245,076 | 0.3% | 2.7% |
| Northern Ireland (Quarter 2 - 2018) | £132,795 | -1.0% | 4.4% |
| Scotland | £150,472 | 0.8% | 4.8% |
| Wales | £156,886 | 1.7% | 4.3% |
| East Midlands | £187,553 | -0.5% | 4.1% |
| East of England | £292,632 | 1.0% | 3.3% |
| London | £476,752 | -0.6% | -0.7% |
| North East | £127,271 | -1.9% | -0.6% |
| North West | £159,801 | 0.5% | 3.1% |
| South East | £325,107 | 0.6% | 2.1% |
| South West | £252,558 | -0.5% | 3.1% |
| West Midlands Region | £196,015 | 1.9% | 5.8% |
| Yorkshire and The Humber | £160,727 | 0.9% | 3.2% |
Download this table’s data (CSV, 1KB)
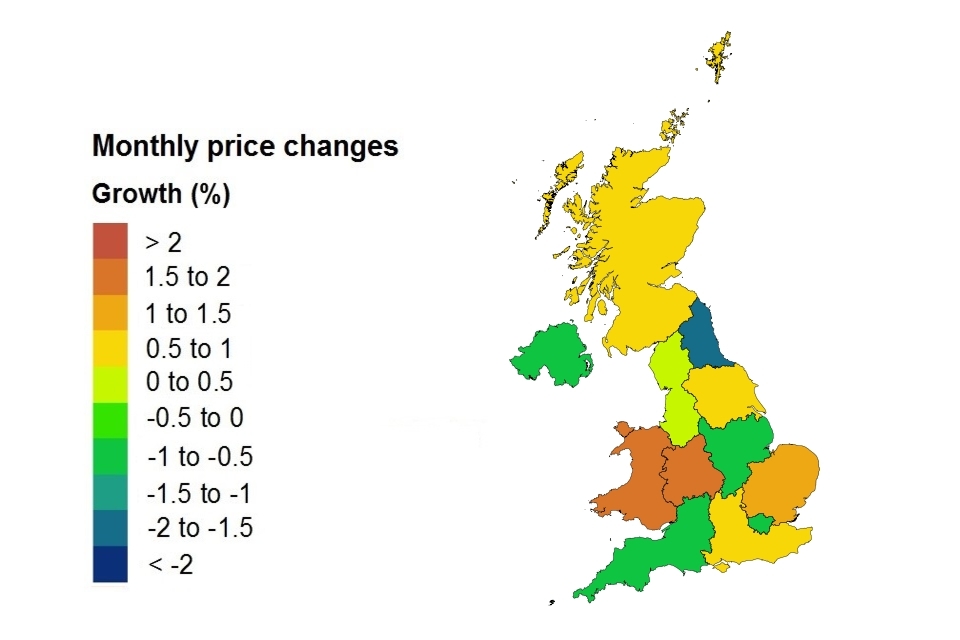
Price changes by country and government office region
Price changes by country and government office region
On a seasonally adjusted basis, average house prices in the UK were unchanged (0.0%) between May 2018 and June 2018, compared with an increase of 0.5% in average prices during the same period a year earlier (May 2017 and June 2017). In the three months to June 2018 average house prices increased by 0.6% compared with the three months ending March 2018.
Note that the Northern Ireland figure represents a three-month change and is not comparable with the other regions and countries.
3.3 Average price by property type
Average monthly price by property type
| Property type | June 2018 | June 2017 | Difference |
|---|---|---|---|
| Detached | £342,739 | £332,061 | 3.2% |
| Semi-detached | £216,218 | £207,131 | 4.4% |
| Terraced | £185,623 | £179,251 | 3.6% |
| Flat or maisonette | £204,247 | £203,268 | 0.5% |
| All | £228,384 | £221,670 | 3.0% |
Download this table’s data (CSV, 1KB)
4. Sales volumes
The amount of time between the sale of a property and the registration of this information varies. It typically ranges between 2 weeks and 2 months but can be longer. Volume figures for the most recent two months are not yet at a reliable level for reporting, so they are not included in the report. Published transactions for recent months will increase as later registered transactions are incorporated into the index.
Sales volume data is also available by property status (new build and existing property) and funding status (cash and mortgage) in our downloadable data tables. Transactions involving the creation of a new register, such as new builds, are more complex and require more time to process. Read Revisions to the UK HPI data for more information.
4.1 Sales volumes
Number of sales volumes by country
| Country | April 2018 | April 2017 | Difference |
|---|---|---|---|
| England | 50,308 | 62,318 | -19.3% |
| Northern Ireland (Quarter 2 - 2018) | 5,308 | 6,099 | -13.0% |
| Scotland | 7,371 | 8,139 | -9.4% |
| Wales | 3,005 | 3,490 | -13.9% |
Note: The annual % change in the ‘Difference’ column will be influenced primarily by level of completeness of the latest month’s data reported and does not necessarily reflect the genuine trends.
Download this table’s data (CSV, 1KB)
The estimate for April 2018 is calculated based on around 85% of the final registered transactions. The number of property transactions for April 2018 will increase as more transactions are incorporated into the index.
UK Property Transaction Statistics published by HM Revenue & Customs (which differ in coverage but are more complete for this period) report that on a non-seasonally adjusted basis, volume transactions fell by 4.4% in England, 6.2% in Scotland and 3.5% in Wales in the year to April 2018.
4.2 Sales volumes for the UK over the past 5 years
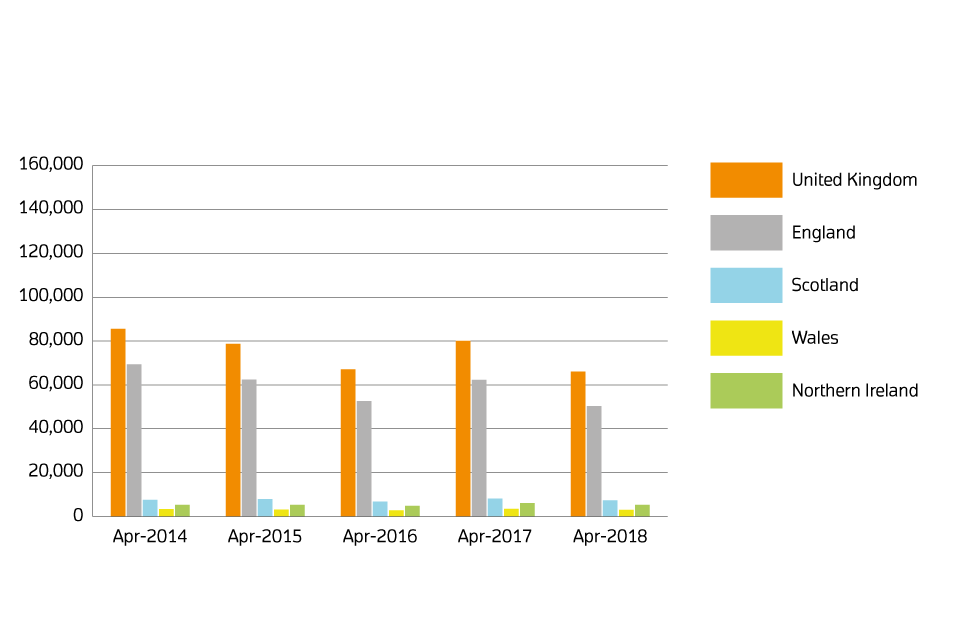
Sales volumes for 2014 to 2018 by country: April
Sales volumes for 2014 to 2018 by country: April
Download this table’s data (CSV, 1KB)
In April 2018, the number of property transactions completed in the UK decreased by 17.5% when compared to April 2017. Compared to March 2018, the number of property transactions completed in the UK decreased by 16.4%.
The estimate for April 2018 is calculated based on around 85% of the final registered transactions. The number of property transactions for April 2018 will increase as more transactions are incorporated into the index.
See our revisions policy for more information.
UK Property Transaction Statistics published by HM Revenue & Customs (which differ in coverage but are more complete for this period) report that on a seasonally adjusted basis, UK volume transactions fell by 4.8% in the year to April 2018.
5. Property status for UK
New build and existing resold property
| Property Status | Average price April 2018 | Monthly change | Annual change |
|---|---|---|---|
| New build | £294,070 | 3.8% | 9.6% |
| Existing resold property | £222,087 | 0.9% | 3.3% |
Download this table’s data (CSV, 1KB)
Note: since October 2017 release, amendments have been made to our estimation model when calculating our provisional estimate. Find out further information and the impact of this change in methods used to produce the UK HPI.
6. Buyer status for Great Britain
First time buyer and former owner occupier
For Great Britain only, Northern Ireland data is not available for buyer status.
| Type of buyer | Average price June 2018 | Monthly change | Annual change |
|---|---|---|---|
| First time buyer | £193,006 | 0.7% | 2.8% |
| Former owner occupier | £264,498 | 0.2% | 3.1% |
Download this table’s data (CSV, 1KB)
7. Funding status for Great Britain
Cash and mortgage
For Great Britain only, Northern Ireland data is not available for funding status.
| Funding status | Average price June 2018 | Monthly change | Annual change |
|---|---|---|---|
| Cash | £217,306 | 0.2% | 2.7% |
| Mortgage | £238,438 | 0.5% | 3.2% |
Download this table’s data (CSV, 1KB)
8. Access the data
Download the data as CSV files or access it with our UK HPI tool.
Data revisions
View any revisions to previously published data in the data downloads or find out more about revisions in our guidance About the UK HPI.
9. About the UK House Price Index
The UK House Price Index (UK HPI) is calculated by the Office for National Statistics and Land & Property Services Northern Ireland. Find out about the methodology used to create the UK HPI.
Data for the UK House Price Index is provided by HM Land Registry, Registers of Scotland, The Land & Property Services/Northern Ireland Statistics & Research Agency and the Valuation Office Agency.
Find out more about the UK House Price Index.
10. Contact
Eileen Morrison, Data Services Team Leader, HM Land Registry
Email eileen.morrison@landregistry.gov.uk
Telephone 0300 006 5288
Aimee North, Head of Housing Market Indices, Office for National Statistics
Email aimee.north@ons.gov.uk
Telephone 01633 456400
Ciara Cunningham, Statistician for the Northern Ireland HPI
Email ciara.cunningham@finance-ni.gov.uk
Telephone 028 90 336035
Anne MacDonald, Land & Property Data Team, Registers of Scotland
Email Anne.MacDonald@ros.gov.uk
Telephone 0131 378 4991