Taking Part Web Panel COVID-19 Report
Updated 16 September 2020

© Crown copyright 2020
This publication is licensed under the terms of the Open Government Licence v3.0 except where otherwise stated. To view this licence, visit nationalarchives.gov.uk/doc/open-government-licence/version/3 or write to the Information Policy Team, The National Archives, Kew, London TW9 4DU, or email: psi@nationalarchives.gov.uk.
Where we have identified any third party copyright information you will need to obtain permission from the copyright holders concerned.
This publication is available at https://www.gov.uk/government/publications/taking-part-web-panel-data-engagement-during-the-covid-19-pandemic/taking-part-web-panel-covid-19-report
1. Introduction and Background
Levels of cultural, digital and sporting engagement have been affected by the COVID-19 coronavirus pandemic. A bespoke questionnaire, asking about participation in activities which could be done under social distancing guidance, was developed and run by Ipsos MORI on behalf of DCMS. The survey used respondents of the Taking Part web panel. These adults (16+) have agreed to join a longitudinal panel after being randomly selected to complete a face-to-face Taking Part questionnaire in recent years.
To note, the Taking Part web panel is not fully representative of the population, and estimates are therefore only indicative of engagement. Respondents were questioned using an online collection mode, and therefore our estimates do not include those adults who do not have access to the internet. Furthermore, the web panel is biased towards those who engage in DCMS related activities. These data are therefore not fully comparable with the figures in the rest of the Taking Part report.
Fieldwork ran in the following three periods, asking about activities done in the preceding 4 weeks:
- 6th – 21st May 2020
- 3rd – 18th June 2020
- 1st – 16th July 2020
In this time, government guidelines and restrictions put in place to slow the spread of COVID-19 changed and changes in engagement are likely to be driven by the changing guidance. Further details on changing policy and health system responses can be found here.
- March 2020 - Introduction of social distancing and shielding measures, banning on mass gatherings, closing of entertainment, hospitality and indoor leisure premises
- April 2020 – Announcement that current social distancing measures must remain in place until at least June
- May 2020 – Public advised to wear face coverings in enclosed public spaces, new guidance on staying alert and safe introduced, NHS contact tracing system goes live
- June 2020 – Those shielding able to spend time outdoors, people are able to exercise outside with other from different households while socially distancing, some school years return to school, single adult households able to join with other households, shops selling non-essential goods can open
- July 2020 – Further lockdown easing including opening of restaurants, pubs, cafes, holiday accommodation, museums, galleries, cinemas, libraries if this can be done safely
Full datasets for engagement during the COVID-19 pandemic can be found here or downloaded from below:
- Participation
- Participation – Demographic Breakdowns
- Comfortable Visiting
- Volunteering and Charitable Giving
- Learning New Skills
- Internet
- Wellbeing
2. Arts
2.1 Creative activities in the home
A respondent was deemed to have done creative activities in the home if they had done any of the following in the preceding 4 weeks:
- Written stories, plays, or poetry
- Painting, drawing, printmaking or sculpture
- Choreographed or performed a dance routine
- Written or performed music
- Made films or videos as an artistic activity
- Designed or programmed video games
- Other arts, crafts, or creative activities at home
In May, 49% of respondents reported doing creative activities in the home, though this dropped to 42% of respondents by July. This was accompanied by a decrease in participation by 35-44 year olds from 59% in May to 40% in July.
The most popular activity was ‘painting, drawing, printmaking or sculpture’, with 15% of all respondents in July reporting they had done this in the last 4 weeks. Participation in specific activities asked about did not significantly change from May to July
Across all three months, women participated more than men (50% vs 32% in July).
Figure 8.1 Popularity of creative activities in the home in the last 4 weeks, May – July 2020
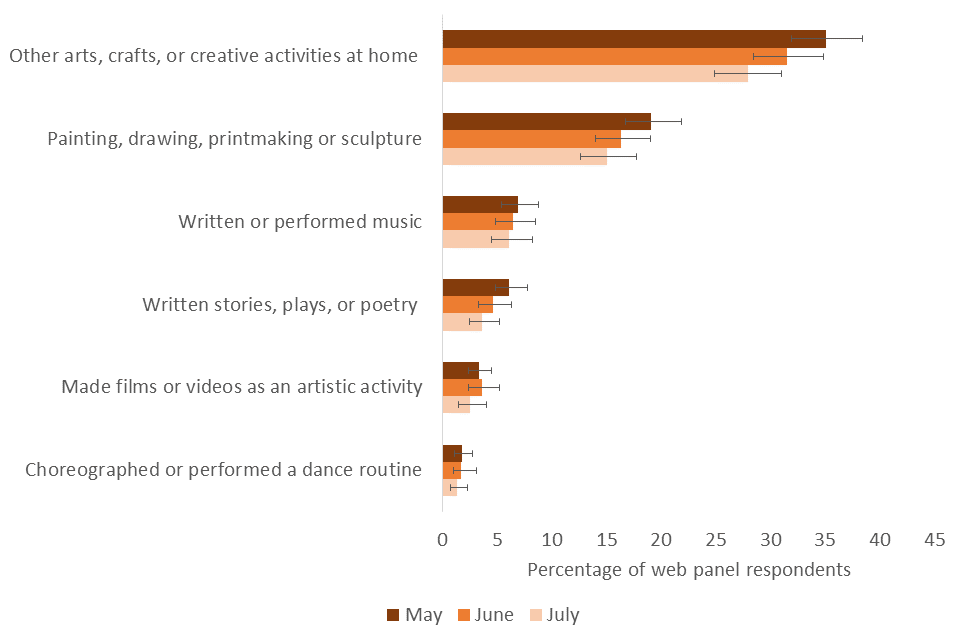
Popularity of creative activities in the home by web panel respondents in May, June, and July
2.2 Watching arts/music online
A respondent was deemed to have watched arts/music online if they had done any of the following in the preceding 4 weeks:
- Watched a live arts event online
- Watched a pre-recorded arts event online
- Watched a live music or dance performance online
- Watched a pre-recorded music or dance performance online
The proportion of respondents who watched arts or music online remained stable from May to July, with 38% of respondents in July having done this in the preceding 4 weeks. Watching a pre-recorded music or dance performance online was the most popular activity in each of the three months (around a quarter of all respondents). Watching a live music/dance performance online decreased in popularity from 15% in May to 10% in July.
In July, men were more likely to have watched live arts/music than women (44% vs 33%).
Figure 8.2 Popularity of watching arts/music online in the last 4 weeks, May – July 2020
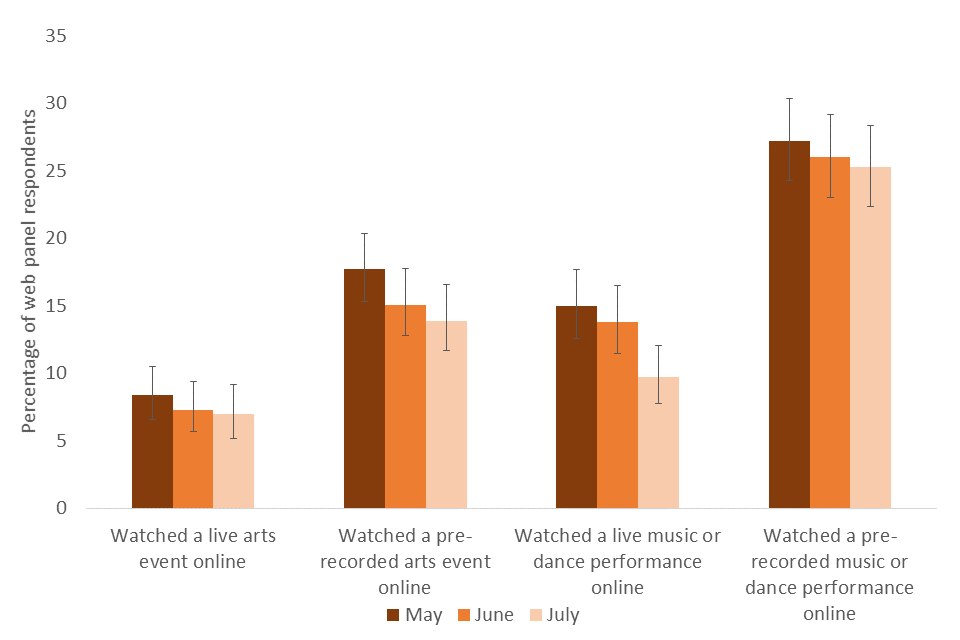
Popularity of watching music or arts events online by web panel respondents in May, June, and July
2.3 Playing video games
The proportion of respondents who reported playing video games in the last 4 weeks (36% in July) maintained a stable trend in popularity. However, a decrease in the percentage of working respondents who had played was seen from May (46%) to July (34%). Single player video games were the most popular option (28% of respondents in July).
Across all three months, men were more likely to have played video games than women (46% vs 28% in July). Similarly, younger age groups showed a higher proportion of respondents playing (e.g. 74% of 16-24 year olds vs 18% of 75+ year olds in July).
Figure 8.3 Percentage of respondents who had played video games in the last 4 weeks by age, May-July 2020
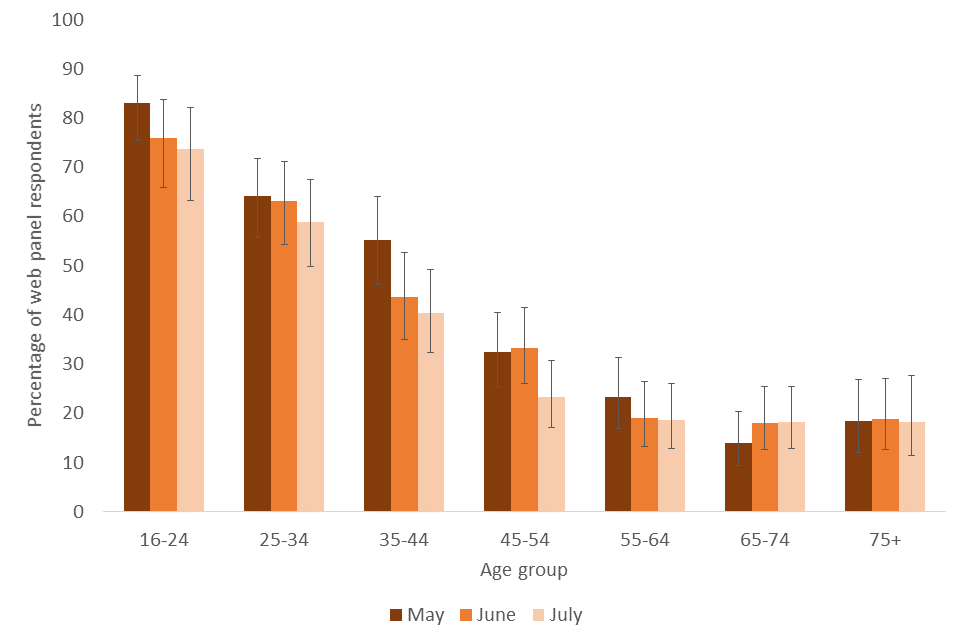
Popularity of playing video games by web panel respondents by age group in May, June, and July
In addition, BAME respondents were more likely to have played video games than White respondents in May (60% vs 40%), although there was no significant difference between these two demographics in June or July.
2.4 Further arts measures
Respondents were asked whether they had spent more or less time in the last 4 weeks doing each activity compared to before 23rd March 2020. For many arts activities, our estimates showed a trend towards increased participation compared to before the pandemic.
In July, a tendency towards increased participation was seen for:
- Painting, drawing, printmaking or sculpture (14% more time, 6% less time)
- Watching pre-recorded arts events online (13% more time, 5% less time)
- Watching pre-recorded music or dance performances online (13% more time, 6% less time)
- Playing video games with others in your household (11% more time, 5% less time)
- Playing video games with others online (13% more time, 4% less time)
- Playing single player video games (19% more time, 5% less time)
The percentage of respondents who plan to do an activity again in the next 4 weeks gives an additional, though less certain, indication of popularity. For each arts activity, a majority of respondents planned to repeat the activity in the next 4 weeks, with this trend persisting from May to July. For example, approximately 90% of those who said they had played single player video games planned to do so in the next 4 weeks in May, June and July.
3. Heritage
Engagement in digital heritage, or visiting a place of interest to walk or exercise was defined as engaging with heritage.
A respondent was deemed to have engaged in digital heritage if they had done any of the following in the preceding 4 weeks:
- Taken a virtual walking tour of a historic town or city, heritage site, castle or monument
- Researched local history online
A respondent was deemed to have visited a place of interest to walk or exercise if they had done any of the following in the preceding 4 weeks:
- Visited a historic park or garden to walk or exercise
- Visited a site of archaeological interest to walk or exercise e.g., Roman villa or ancient burial site
- Visited a National Park, Area of Outstanding Natural Beauty, or ancient woodland to walk or exercise e.g., Lake District National Park, Brecon Beacons, or Epping Forest
Researching local history online was done by around 10% of respondents in each month, and was the most popular heritage-related activity reported in May. However in July, visiting a National Park or area of outstanding natural beauty to walk or exercise was more often reported (16% of respondents).
From May to June, there was an increase in the percentage of respondents who reported engaging in heritage, from 21% to 27%. In May, more men engaged in heritage than women (25% v 17%), but in June, no difference was seen with gender, following a significant increase in engagement by women (17% in May, 25% in June).
Visiting a place of interest to walk or exercise, which includes a historic park or garden, site of archaeological interest or National Park, increased from May (10%) to June (18%). This was driven by more respondents visiting historic parks or gardens (4% in May, 8% in June), and visiting National Parks (7% in May, 12% in June), possibly a reflection on these facilities being more accessible in June.
Digital heritage participation, which encompassed taking a virtual walking tour or researching history online, was done by around 13% of respondents each month.
3.1 Further heritage measures
Though we observed an increasing participation in heritage from May to July, for many heritage activities, our estimates showed a trend towards decreased participation compared to before the pandemic. Respondents were asked whether they had spent more or less time in the last 4 weeks doing each activity compared to before 23rd March 2020.
In July, a tendency towards decreased participation was seen for:
- Taking a virtual walking tour of a historic town or city, heritage site, castle or monument (4% more time, 8% less time)
- Visiting a historic park or garden to walk or exercise (10% more time, 43% less time)
- Visiting a site of archaeological interest to walk or exercise (3% more time, 39% less time)
- Visiting a National Park, Area of Outstanding Natural Beauty or ancient woodland to walk or exercise (10% more time, 46% less time)
The percentage of respondents who plan to do an activity again in the next 4 weeks gives an additional, though less certain, indication of popularity. For each heritage activity, a majority of respondents planned to repeat the activity in the next 4 weeks, with this trend persisting from May to July. For example, approximately 60% of those who said they had researched local history online planned to do so in the next 4 weeks in each month.
4. Sport
Participation in sport changed throughout the three months measured, with outdoor exercise becoming more popular over time, and home-based exercise becoming less popular.
Further data is available from Sport England.
4.1 Outdoor exercise
Visiting a park or public outside space, or a place of interest, to walk or exercise was defined as visiting an outdoor space to walk or exercise.
In May, 67% of respondents reported visiting an outdoor space to walk or exercise, which increased to 74% of respondents in both June and July. Visiting a park or public outdoor space was done by 65% of respondents in May, increasing to 72% in July.
Outdoor exercise was more popular for White respondents (70%) than BAME respondents (43%) in May. In June and July, no difference in participation with ethnicity was seen.
4.2 Home exercise
A respondent was deemed to have exercised at home they had done any of the following in the preceding 4 weeks:
- Followed a live online or TV exercise or dance class at home
- Followed a pre-recorded online or TV exercise or dance class at home
- Independent fitness training at home (including exercising with others in your household)
- Informal or play-based activities in the home or garden such as running games e.g., playing catch or kicking a football around
- Other form of sport or exercise at home
Similar to outdoor exercise, 67% of respondents reported exercising at home in May. However, this decreased to 60% in June. This may have been driven by a decrease in those who followed live online or TV exercises at home (from 18% in May to 9% in July).
From May to June, participation in exercise at home by women dropped from 70% to 61%, while male participation did not change significantly. In July, participation by both men (50%) and women (58%) was lower than in May (65% and 70%), though no significant differences were seen between genders in any month.
Figure 8.4 Participation in home exercise by gender, May – July 2020
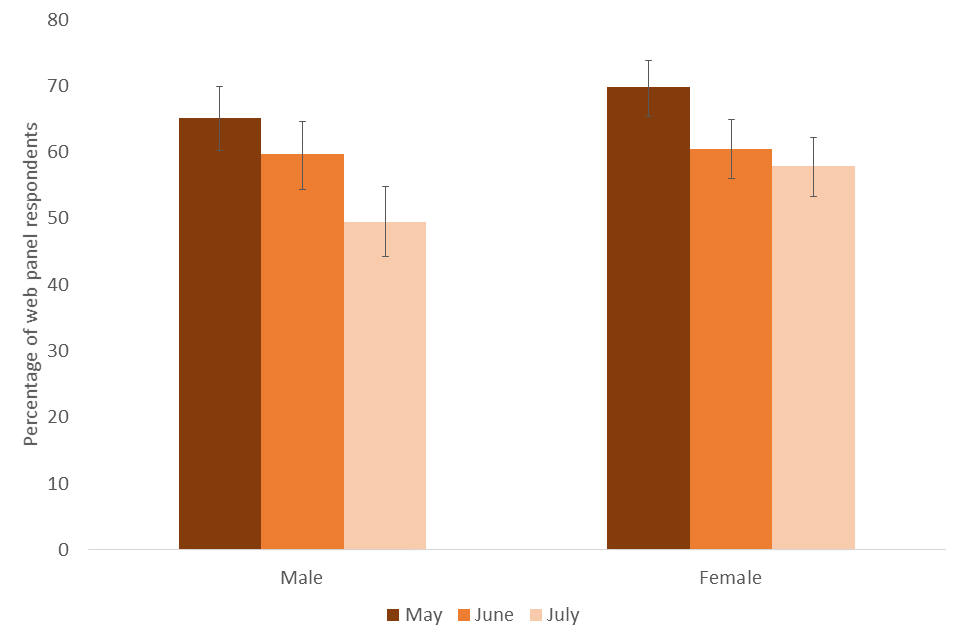
Popularity of exercising at home by web panel respondents by gender in May, June, and July
From May to July, a decrease in exercising at home was seen for the North East (70% to 37%), the North West (69% to 47%), and the South West (70% to 43%). Looking at ethnicity, participation in home exercise by White respondents decreased from 67% in May to 52% in July, whereas no change was observed for BAME respondents.
Though we are able to confidently identify differences in these cases, the exact values for our estimates are not fully certain due to small sample sizes for many demographic groups.
4.3 Further sport measures
For home-based sports activities, our estimates showed a trend towards increased participation compared to before the pandemic. Respondents were asked whether they had spent more or less time in the last 4 weeks doing each activity compared to before 23rd March 2020.
In July, a tendency towards increased participation was seen for:
- Following a live online or TV exercise or dance class at home (14% more time, 4% less time)
- Following a pre-recorded online or TV exercise or dance class at home (18% more time, 4% less time)
- Independent fitness training at home (27% more time, 6% less time)
- Informal or play-based activities in the home (15% more time, 6% less time)
- Other form of sport or exercise at home (27% more time, 10% less time)
The percentage of respondents who plan to do an activity again in the next 4 weeks gives an additional, though less certain, indication of popularity. For each sport activity, a majority of respondents planned to repeat the activity in the next 4 weeks, with this trend persisting from May to July. For example, just over 90% of those who said they done independent fitness training at home planned to do so in the next 4 weeks in each month.
5. Volunteering and Charitable Giving
From May to July, we observed a decrease in the proportion of web panel respondents who had volunteered in the preceding 4 weeks, but saw a stable trend in the proportion who donated to charity. The definitions used for volunteering and charitable giving here differ from those used in our Official Statistics reports, and are only presented to identify changes from May to July 2020. For more information on volunteering and charitable giving in previous years, please see the Community Life Survey
Figure 8.5 Percentage of respondents who had volunteered or donated to charity in the last weeks, May-July 2020
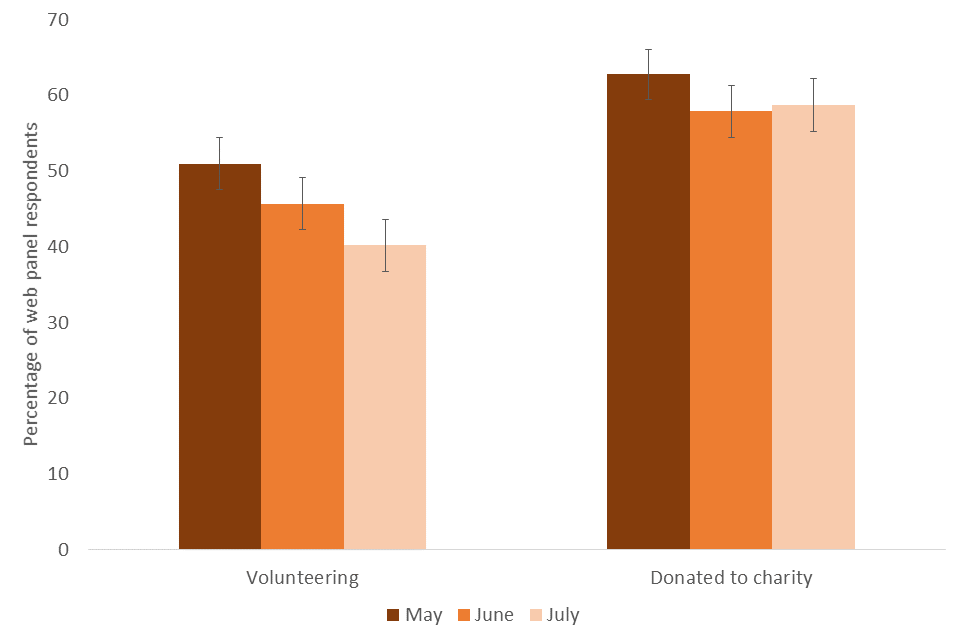
Popularity of volunteering or donating to charity by web panel respondents in May, June, and July
5.1 Volunteering
In May, 51% of respondents reported having volunteered in the preceding 4 weeks, and this decreased to 40% of respondents in July. The most popular volunteering activity, chosen from a pre-determined list, was collecting or delivering shopping for others you don’t live with. This was done by 40% of respondents in May, decreasing to 28% in July.
The proportion of those participating in volunteering varied by demographics. A significant decrease in participation in volunteering was seen for the age group 35-44 years old, dropping from 55% in May to 37% in July. Decreases were also seen for respondents who were either working, or had stopped working since the start of 2020, but not for those who were not working at the start of 2020.
For volunteering, our estimates showed a trend towards decreased participation compared to before the pandemic. Respondents were asked whether they had spent more or less time in the last 4 weeks doing each activity compared to before 23rd March 2020. In July, 20% of respondents said they were volunteering less than before the pandemic and 9% said they were volunteering more.
The percentage of those who had volunteered in the preceding 4 weeks were asked about their plans for the next 4 weeks, with approximately 6% each month stating that they plan to spend more time volunteering.
5.2 Charitable giving
The percentage of respondents who had given to charity in the last 4 weeks remained stable from May to July, with 59% of respondents reporting charitable giving in July.
Some specific methods for giving charitably showed a decrease from May to July:
- Donating money to an online crowdfunding platform (14% in May, 9% in July)
- Making a voluntary donation during an online event (8% in May, 4% in July)
Across all 3 months, younger age groups were less likely to have given to charitably than some older age groups. For example in July 37% of 16-24 year olds had given charitably compared to 70% of 65-74 year olds. This is consistent with the findings from the Community Life Survey .
6. Internet
Web panel respondents were asked about their satisfaction in various aspects of their internet connection. Between May and July, the percentage of respondents reporting they were satisfied with each aspect remained stable.
In July:
- 83% were satisfied with the speed of their internet connection
- 82% were satisfied with the reliability of their internet connection
- 70% were satisfied with the value for money of their internet connection
Of note, the percentage of respondents satisfied with the value for money of their internet connection was consistently lower than the percentage of respondents satisfied with either the speed or reliability.
7. New skills
Respondents were asked about whether they had learnt any new skills in the preceding 4 weeks, including online skills or IT skills.
7.1 Online skills
The definition of online skills used here includes learning any of the following skills online.
- Buying groceries
- Other online shopping
- Managing my money
- Accessing NHS, GP or other healthcare services
- Accessing other Government services
- Paying bills or taxes
- Video calls with family, friends or colleagues
In May, 63% of respondents reported learning online skills in the last 4 weeks, which decreased to 53% in July. This was accompanied by a drop in those reporting they had learnt how to buy groceries online (20% in May to 14% in July) and those reporting they had learned how to video call friends, family or colleagues, although this was still a fairly high proportion – 51% in May, 43% in June and 39% in July. (51% in May, 39% in July).
In June and July, women were more likely to have learned online skills than men (58% vs 47% in July).
Some variability was seen with age, with 25-34 year olds in May less likely to have learnt online skills compared to over 75 year olds (48% vs 75%). Additionally, 55-64 year olds were less likely to have learned online skills in the last 4 weeks in July (48%) compared to May (74%).
Between regions in any given month, no variability in the likelihood of learning online skills was seen. However, from May to June, a significant increase was seen for the North East (64% to 90%), and from May to July, a significant decrease was seen for the South East (65% to 48%). Though we are able to confidently identify differences in these cases, the exact values for our estimates are not fully certain due to small sample sizes for many demographic groups.
Nearly two thirds of those who reported learning online skills said they had done this by finding information online. Around a third said that someone in the household showed or taught them. These methods did not change in popularity from May to July.
7.2 IT skills
The definition of IT skill used here includes learning any of the following skills.
- Improve IT skills e.g., backing up documents, scheduling automatic updates, or managing security settings
- Programming websites or apps
- Writing computer code for another purpose
In July, 13% of respondents had learned IT skills in the past 4 weeks, remaining similar to May and June. In both June and July, BAME respondents were more likely to have learned IT skills than White respondents.
8. Wellbeing and Loneliness
8.1 Wellbeing
Web panel respondents were asked questions about their wellbeing and how often they felt lonely. These questions come from recommendations by the Office for National Statistics on harmonised principles for wellbeing and loneliness.
** Figure 8.6 Proportion of web panel respondents with scores of 7 or greater for aspects of wellbeing in May, June, and July**
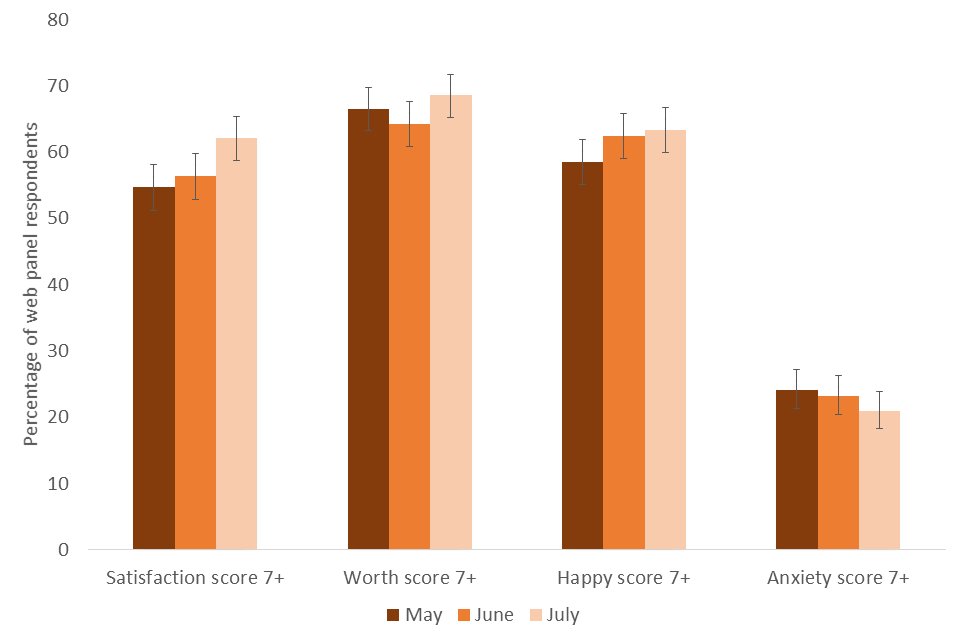
Proportion of web panel respondents with scores of 7 or greater for aspects of wellbeing in May, June, and July
Two questions were used where respondents were asked about overall wellbeing, and these questions measure responses on a scale from 0 (not at all) to 10 (completely).
- Overall, how satisfied are you with your life nowadays?
- Overall, to what extent do you feel that the things you do in your life are worthwhile?
The percentage of respondents reporting a satisfaction score 7 or greater increased from 55% in May to 62% in July.
Self-worth remained stable from May to July. In July, 69% of respondents reported a worth score of 7 or greater.
Two questions were used which ask about how a respondent felt yesterday, and these questions also measured responses on a scale from 0 (not at all) to 10 (completely).
- Overall, how happy did you feel yesterday?
- On a scale where 0 is “not at all anxious” and 10 is “completely anxious”, overall, how anxious did you feel yesterday?
In July, 63% of respondents reported a happiness score of 7 or greater, and 21% reported an anxiety score of 7 or greater. Both these wellbeing aspects remained stable from May to July.
8.2 Loneliness
From May to July, no significant changes were seen in the percentage of web panel respondents who reported feeling lonely often/always, which was 7% in July.
In May, more respondents reported feeling isolated from others often/always (12%) than reported feeling left out often/always (7%) or lonely often/always (6%). This difference was not present in data collected in July.
9. Comfortable visiting events or places
Data were collected around whether a respondent thought they would feel comfortable visiting events or places if restrictions were to be relaxed in 30 days’ time. In July, the wording was updated to say ‘if restrictions were further relaxed’ since some restriction easing had taken place already at the time of fieldwork.
The proportion of web panel respondents who said they would not feel comfortable visiting any of the places listed dropped from those asked in May to those asked in June, from 27% to 20%. From June to July, no significant change was observed.
Web panel respondents reported increasing levels of comfort for some specific activities.
** Figure 8.7 Proportion of respondents who would feel comfortable returning to an activity if restrictions were relaxed in 30 days times in May, June, and July**
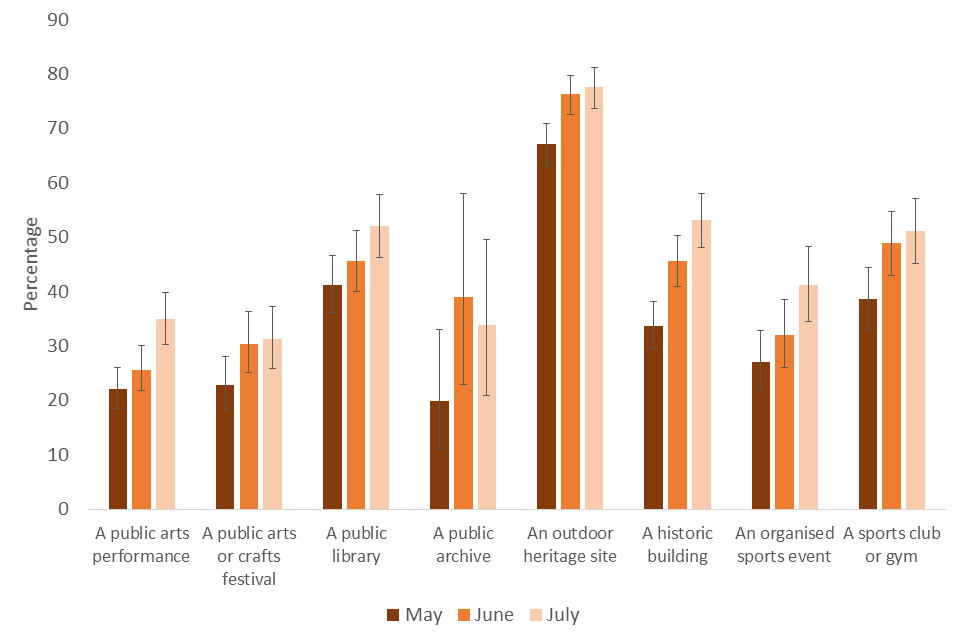
Proportion of respondents, who had done the relevant activity within the previous 12 months, who would feel comfortable returning to the activity if restrictions were relaxed in 30 days times in May, June, and July
Moving from May to June, visiting of an outdoor heritage site (67% to 76%), or a historic building (34% to 46%), by those who had reported doing so in the previous 12 months, showed increased levels of comfort.
Moving from May to July, visiting of a public arts performance (22% to 35%), an organised sports event (27% to 41%) or a sports club or gym (39% to 51%), by those who had reported doing so in the previous 12 months, showed increased levels of comfort.