Statistics on changes in migrants’ visa and leave status: 2015
Published 15 February 2017

© Crown copyright 2017
This publication is licensed under the terms of the Open Government Licence v3.0 except where otherwise stated. To view this licence, visit nationalarchives.gov.uk/doc/open-government-licence/version/3 or write to the Information Policy Team, The National Archives, Kew, London TW9 4DU, or email: psi@nationalarchives.gov.uk.
Where we have identified any third party copyright information you will need to obtain permission from the copyright holders concerned.
This publication is available at https://www.gov.uk/government/statistics/statistics-on-changes-in-migrants-visa-and-leave-status-2015/statistics-on-changes-in-migrants-visa-and-leave-status-2015
Formerly known as the ‘Migrant Journey’, this release is the seventh in a series of releases that explore changes in migrants’ visa and leave status within the UK’s immigration system.
Introduction
Understanding the processes that migrants go through when they decide to stay in the UK or switch their immigration status helps to inform Parliament and the public on the impact of changes to the Immigration Rules.
The findings presented here are based on combining data collected from UK Visas and Immigration (UKVI) databases. These databases hold records of individuals granted entry clearance visas, and any subsequent grants of extensions of stay in the UK.
This report updates analysis from ‘Migrant journey: sixth report’ published in February 2016. It presents the data in two different but complementary ways, providing information on a forward-view and backward-view of the extent to which different types of non-European Economic Area (EEA) migrants change their immigration status or achieve settlement in the UK. The forward-view analysis examines the immigration status in 2015 of migrants issued visas to the UK in 2004 and in subsequent years. The backward-view analysis looks at those whose entry to the UK ultimately resulted in them being granted settlement, permission to stay permanently in the UK, and which visas they used on arrival to the UK. The latest findings include the forward-view analysis of the cohort of those issued a visa in 2010.
The data presented in this report relate to all cases (both main applicants and dependants) and the supplementary tables separately identify all cases, by main applicants and by dependants.
Key facts
Of those issued a skilled work visa (which has a potential path to settlement) in the 2010 cohort, 30% (21,507) had been granted settlement 5 years after their initial visa had been granted; a further 14% (10,255) still had valid leave to remain in the UK. Of those in this analysis who are no longer recorded as having valid leave to remain in the UK, a number may have overstayed their leave but it is not possible from these data to determine whether a person is resident or not in the UK.
Indian nationals were issued the largest proportion (40% of the total) of skilled work visas in the 2010 cohort and, of these skilled Indian nationals, 32% had received settlement after 5 years, while a further 12% still had valid leave to remain in the UK.
Of the top 5 nationalities issued a skilled work visa in the 2010 cohort, American and Australian nationals were less likely to have settled after 5 years (10% and 14% respectively), whereas Pakistani nationals were more likely to have settled (57% of Pakistani skilled workers had reached settlement by 2015).
Around 4 out of 5 people (80%; 32,377) issued a family visa in the 2010 cohort had been granted settlement 5 years later, with a further 5% recorded as still having valid leave to remain in the UK. The proportion of family visa holders remaining legally in the UK 5 years after arrival has risen in each successive cohort between 2004 and 2010, with the exception of the 2009 figure which remained the same as that for the 2008 arrivals (84%).
Of the top 5 nationalities issued a family visa in the 2010 cohort, Americans (63%) and Somalis (76%) were the least likely to have obtained settlement within 5 years; Bangladeshi (91%), Pakistani (87%) and Indian nationals (86%) were the most likely.
Migrants granted a student or a work visa (not leading to settlement) in 2010, both largely temporary migration routes, were much less likely to have achieved settlement or have valid leave to remain in the UK after 5 years (19% and 12% respectively). Of these, only a small proportion had achieved settlement (both 1%) within the 5-year timeframe. The reasons for this include:
- the rules for these visa categories prohibiting a direct route to settlement
- the propensity for people in these categories to switch into other immigration categories that have a route to settlement
- the time that would then need to elapse before a settlement application can be made
Of those granted settlement in the 2015 cohort, around two-fifths (41%) had originally been issued a visa that could potentially directly lead to settlement (family or skilled work) and a further 8% were granted settlement on arrival. A slightly larger proportion (50%) originally entered on a temporary route and later switched into a route that led to permanent settlement, over half of whom had originally entered the UK as students (29% of the total granted settlement in 2015, more than double the proportion in 2009 when this series began).
Proportion of migrants issued an entry clearance visa in each year 2004 to 2010 who still held valid leave to remain in the UK or had been granted settlement after 5 years, by visa type1
| Cohort | Family(1) | Skilled work (with a potential path to settlement) including dependants (2) | Temporary work (not leading to settlement) including dependants | Study including dependants | Dependants joining or accompanying(3) |
|---|---|---|---|---|---|
| 2004 | 75% | 50% | 17% | 31% | 51% |
| 2005 | 76% | 46% | 13% | 25% | 53% |
| 2006 | 80% | 44% | 12% | 24% | 55% |
| 2007 | 82% | 36% | 11% | 22% | 60% |
| 2008 | 84% | 34% | 9% | 22% | 57% |
| 2009 | 84% | 41% | 11% | 21% | 56% |
| 2010 | 85% | 44% | 12% | 19% | 53% |
Table notes
Source: Home Office, Statistics on changes in migrants’ visa and leave status: 2015: tables MJ 01–MJ 05.
(1) The family route covers visas where an individual is applying for a visa on the basis of their relationship to a person settled in the UK or a British citizen. ‘Family route: child’ includes adult offspring of the settled person or British citizen. ‘Family route: other’ encompasses dependants who are not offspring or partners, such as elderly relatives.
This category also includes:
- following changes to the rules from July 2012, ’post-flight’ family members and adult dependent relatives joining those who have been granted refugee status or humanitarian protection
- family members of those granted refugee status and who had gained settlement, or who had yet to gain settlement status if the individual coming to the country applied for a visa prior to the second quarter of 2011.
(2) From April 2010, changes to the rules meant that the Tier 2 (Intra-company Transfer) category no longer had a direct route to settlement. These are still included within this category to aid comparability.
(3) Dependants joining/accompanying are dependants applying for a visa on the basis of their relationship with another migrant, who is not a settled person or a British citizen.
The Points Based System (PBS) was phased in from 2008 onwards. Tier 1 (which provides a route for highly-skilled migrants) was phased in between February and June 2008, followed by Tier 2 (which provides a route for skilled workers with a job offer) and Tier 5 (which is for temporary workers and youth mobility, providing a route for those coming to the UK for primarily non-economic reasons) which were implemented in November 2008. These changes to the rules may have influenced the characteristics of those arriving for work after 2008.
Immigration status after 5 years of those issued a visa in 2010, by visa type
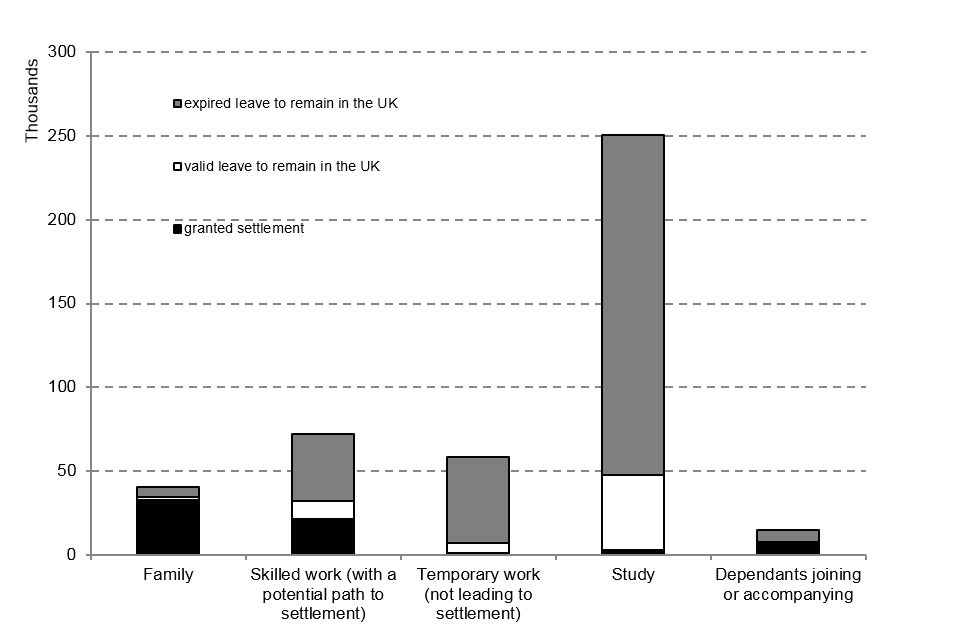
The chart shows the immigration status after 5 years of those issued a visa in 2010, by type of visa issued.
Chart notes
Source: Home Office, Statistics on changes in migrants’ visa and leave status: 2015, tables MJ 01–MJ 05.
Change in methodology
The methodology for this analysis has been enhanced to reflect changes in the matching procedures adopted in linking together immigration histories. However, the numbers and messages in the data are broadly consistent, with family and skilled work visas most likely to lead to settlement after 5 years, and study and temporary work routes less likely.
Previously, matching was based on the internal links generated within the in-country casework system that is used to process application for leave from migrants already in the UK. Visa applications were matched to the in-country casework system. The linkage system has now been enhanced to also link together visas for a migrant, whether or not they have made an application for further leave while resident. In addition, biometric information collected from 2008 onwards has been used to link visas and in-country leave, which will further enhance the accuracy of the data matching.
An effect of the enhancing linking is that whenever a migrant applies for a visit visa and subsequently applies for a non-visit visa (e.g. to study), a link is made. Following the old methodology, this would mark a ‘journey’ as commencing with a visit visa (which could be a short holiday or preparatory visit) and not with the non-visit visa that actually granted residence. Given that visit visas do not confer residency rights (and their period of validity do not generally reflect periods of stay in the UK), they have been removed from the analysis in order to provide a better indication of the original purpose for entering the UK that might subsequently lead to residence.
The effect of the change in methodology is also to link up more periods of leave into ‘journeys’, particularly including linking periods of leave where a migrant has repeatedly applied for visas out of country rather than having requested any extensions of visas in country. This has had a particular effect of boosting the percentages with valid leave after 5 years for those who originally arrived on work visas, which is not too surprising as one might expect a pattern of some visas being issued out of country for a specific spell of employment without subsequent extensions of leave in-country being granted. For the 2009 cohort, the proportion still holding valid leave after 5 years under the old methodology was 81%, 17%, 52%, 35% and 7% for family, study, dependants (accompanying/joining), skilled work, and temporary work, but under the new methodology is 84%, 21%, 56%, 41% and 11%. The new methodology generally indicates the same patterns but provides a better indication of the migrant status over time as it is based on better systems of data matching.
Although this new process now excludes visitor arrivals, results from earlier sweeps of this study indicate that the percentage of those arriving on visit visas who were found to have valid leave 5 years later was very low (3%) in the 2009 cohort of the ‘Migrant journey: sixth report’, and that the majority had leave on account of visit visas (71% for the 2009 cohort). This partly reflects the fact that some visit visas can give long validity (though only 6 months leave is granted per visit).
Forward-view analysis
The forward-view analysis examines the changes in immigration status of migrants issued visas to the UK in 2010. In addition, potential changes in migrant behaviour over time are explored by comparing results for the 2010 cohort with the cohorts of those issued visas in each year from 2004 to 2009.
The forward-view analysis explores 5 of the main routes of entry to the UK (excluding visitors) for migrants from outside the EEA:
- family
- skilled work (with a potential path to settlement)
- temporary work (not leading to settlement)
- study
- dependants joining or accompanying
The analysis tracks migrants who were initially issued a visa in the family, work or study routes, or as a dependant joining or accompanying someone who is not a settled person or British citizen through the immigration system in each subsequent year, in order to identify their immigration status at the end of the fifth year after their initial arrival. Analysis of the immigration status at the end of the eighth year after entry is examined in this report for the earlier cohorts. The forward-view analysis of migrants issued visas in 2004 to 2010 identifies the points at which an individual’s entry clearance visa or extension of stay changed category or expired.
The expiration of an individual’s entry clearance visa or extension of stay does not necessarily confirm that the migrant has left the UK and returned to their home country. In fact, there are 4 possible outcomes for such migrants:
- the migrant has left the UK
- the migrant has made an application for a further extension of stay that has not been identified/recorded
- the migrant is still in the UK (as an overstayer)
- the migrant never travelled to the UK (the visa was not used)
The figures presented here do not contain estimates of the proportion of those whose entry clearance visa or extension of stay has expired who have left the UK. In due course, we expect the new border systems to facilitate this sort of analysis. Exit checks were introduced from April 2015 and ‘A report on the statistics being collected under the exit checks programme’ was published on 25 August 2016.
2010 cohort by immigration status at the end of each year
Those issued a family visa in 2010 were most likely to have achieved settlement or still have valid leave to remain in the UK 5 years after their arrival (85%; 34,444). The chart below shows, for each of the visa types analysed, the proportion still holding a valid visa or who had gained settlement in each year after their initial arrival. The patterns reflect the different rules that apply to each visa type. The decline over time is unsurprisingly most rapid for those initially granted temporary work visas (which do not lead to settlement) and is least for the family visas where the majority are ultimately granted settlement.
Migrants in the 2010 cohort still holding valid leave to remain in the UK or granted settlement at the end of each year, by visa type
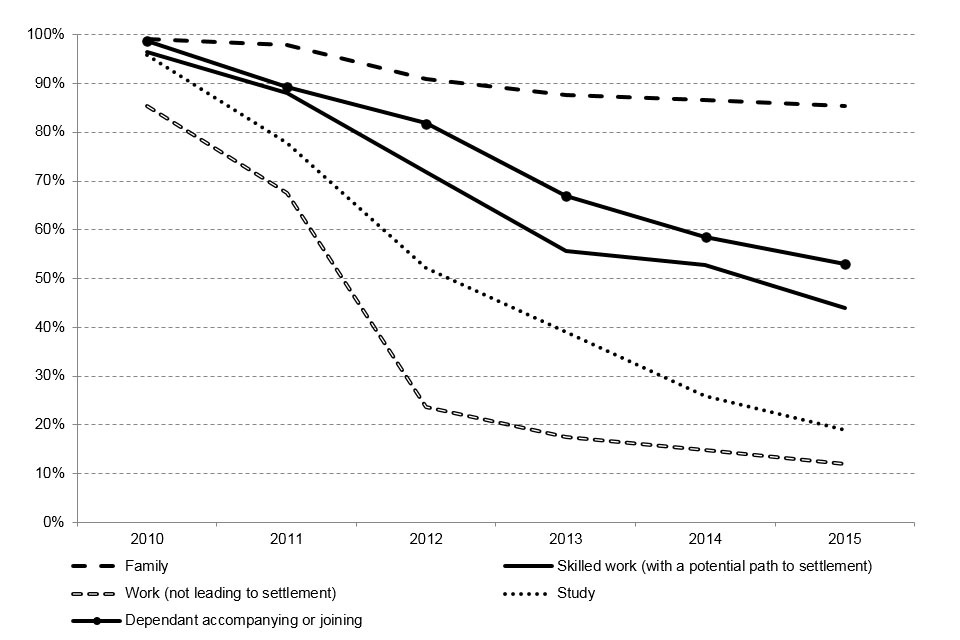
The chart shows the number of migrants in the 2010 cohort granted valid leave to remain or settlement at the end of each year, by visa type.
Chart notes
Source: Home Office, Statistics on changes in migrants’ visa and leave status: 2015, tables MJ 01–MJ 05.
Family
For people issued a family visa in 2004, over two-thirds (68%) had gained settlement (permission to stay permanently in the UK) 5 years later. This proportion increased for those in later cohorts, with four-fifths (80%) of those issued a family visa in 2008 and 2010 granted settlement 5 years later. This can be accounted for by migrants on the family route taking up settlement when they become eligible after 2 years, rather than extending their leave to remain in the UK.
People coming under the family route will normally be part of or seeking to establish a long-term relationship. Of the people issued a family visa in 2010, a third (33%) had gained settlement after 2 years.
Comparison of migrants issued a visa in the family route in each year cohort 2004 to 2010, by their immigration status 5 years later

The chart shows the 2004 to 2010 cohorts issued a family visa by immigration status 5 years later.
Chart notes
Source: Home Office, Statistics on changes in migrants’ visa and leave status: 2015, table MJ 01.
In the 2010 cohort, the top 5 nationalities accounted for around two-fifths (38%) of the visas issued through the family route. These nationalities were Pakistani, Indian, American, Somali and Bangladeshi, of whom the largest number were Pakistani nationals, as shown in the table below.
The proportion who had settled within 5 years also differs by nationality. For example, a lower proportion of American (63%) and Somali (76%) nationals were settled after 5 years, compared with nationals from Bangladesh (91%), Pakistan (87%) and India (86%). The reasons why different nationalities seek to settle at different rates will vary.
Top 5 nationalities in the 2010 cohort issued a family visa
| Nationality | Migrants in 2010 cohort | Immigration status 5 years later % with expired leave to remain in the UK | Immigration status 5 years later % with valid leave to remain in the UK | Immigration status 5 years later % granted settlement |
|---|---|---|---|---|
| All nationalities | 40,807 | 15% | 5% | 80% |
| Of which: | ||||
| Pakistani | 6,335 | 8% | 5% | 87% |
| Indian | 3,743 | 10% | 4% | 86% |
| American | 2,222 | 32% | 6% | 63% |
| Somali | 1,668 | 20% | 4% | 76% |
| Bangladeshi | 1,634 | 5% | 4% | 91% |
Table notes
Source: Home Office, Statistics on changes in migrants’ visa and leave status: 2015, table MJ 01.
Skilled work (with a potential path to settlement)
Around a third (32%) of people issued a visa for skilled work in 2004 had gained settlement 5 years later, and a further 18% still had valid leave to remain in the UK.
Comparison of the 2004 cohort with the 6 subsequent cohorts indicates that from 2004 to 2008 there was an overall rise in the proportion of people whose leave to remain in the UK had expired after 5 years, from 50% of those issued a skilled work visa in 2004 to 66% in 2008, followed by a decrease in subsequent cohorts to 59% in 2009 and 56% in 2010.
Comparison of migrants issued a visa in the skilled work route (with a potential path to settlement) in each year 2004 to 2010, by their immigration status 5 years later
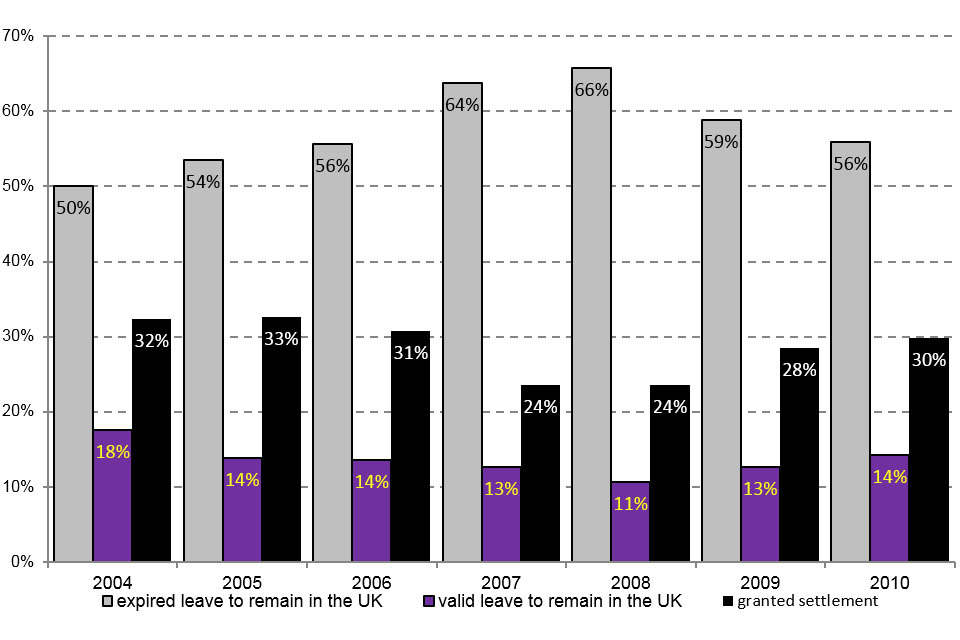
The chart shows the 2004 to 2010 cohorts issued a visa through the work route (with a potential path to settlement) by immigration status 5 years later.
Chart notes
Source: Home Office, Statistics on changes in migrants’ visa and leave status: 2015, table MJ 02.
(1) From April 2010 changes to the rules meant that the Tier 2 (Intra-company Transfer) category no longer had a direct route to settlement. These are still included within this category to aid comparability.
In the 2010 cohort, just 5 nationalities accounted for over two-thirds (67%) of the skilled work route. These 5 nationalities were Indian, American, Pakistani, Australian and Chinese (see table below). Indian nationals comprised by far the largest number of non-EEA skilled workers, at 40% of the total (which is consistent with the proportion of certificates of sponsorship issued for Indian national skilled workers over recent years).
Of the top 5 nationalities for skilled workers granted a visa in 2010, Pakistani nationals were most likely to have obtained settlement after 5 years (57%) and also had the highest proportion of dependants (74%) compared with other nationalities. In contrast, a lower proportion of Americans and Australians had sought and been granted settlement after 5 years (10% and 14% respectively). This may be an indication of the varying propensities of different groups of skilled workers towards permanent or circular migration, with those originating in wealthier countries being less likely to seek to move permanently to the UK.
Under half (48%) of all those issued a skilled work visa in the 2010 cohort were main applicants, and 52% were their dependants. The number of dependants in this cohort is higher than for other routes and differs by nationality, as shown in the table below.
Top 5 nationalities in the 2010 cohort issued skilled work visas (with a potential path to settlement)
| Nationality | Migrants in 2010 cohort | Proportion who were dependants | Immigration status 5 years later % with expired leave to remain in the UK | Immigration status 5 years later % with valid leave to remain in the UK | Immigration status 5 years later % granted settlement |
|---|---|---|---|---|---|
| All nationalities | 72,214 | 52% | 56% | 14% | 30% |
| Of which: | |||||
| Indian | 28,942 | 61% | 56% | 12% | 32% |
| American | 9,028 | 45% | 76% | 14% | 10% |
| Pakistani | 4,452 | 74% | 26% | 17% | 57% |
| Australian | 3,924 | 17% | 72% | 14% | 14% |
| Chinese | 2,346 | 52% | 40% | 12% | 48% |
Table notes
Source: Home Office, Statistics on changes in migrants’ visa and leave status: 2015, table MJ 02.
Temporary work (not leading to settlement)
As expected, migrants issued a temporary work visa are least likely to have valid leave to remain in the UK after 5 years, compared with all other visa types. Of those issued temporary work visas in the 2004 to 2010 cohorts, only 7 to 14% still had valid leave to stay in the UK after 5 years. Those obtaining further leave to remain in the UK will have done so through switching into alternative visa routes. Just 1% of those issued temporary work visas in 2010 had gained settlement within 5 years of arriving.
Of the temporary work route (not leading to settlement) cohort who arrived in 2010, 68% (39,239) still had valid leave to remain in the UK or had been granted settlement in 2011, but this dropped considerably the following year to 24% (13,813). This reduction is expected, as those who applied under a temporary worker scheme (the work route that does not lead to settlement) are likely to have only intended to stay in the UK for a relatively short period of time. Temporary work visas will include very short-term temporary workers, as well as young people who come under the Youth Mobility Scheme and are allowed to live and work for up to 2 years.
The majority of migrants who entered the UK in this route unsurprisingly stayed in the UK for a relatively short period of time. After 2 years, 76% of the people issued a temporary work visa in 2010 had expired leave to remain in the UK. By the fifth year after their arrival, 12% had valid leave to remain in the UK or a grant of settlement.
Comparison of migrants issued a visa in the temporary work route (not leading to settlement) in each year 2004 to 2010, by their immigration status 5 years later
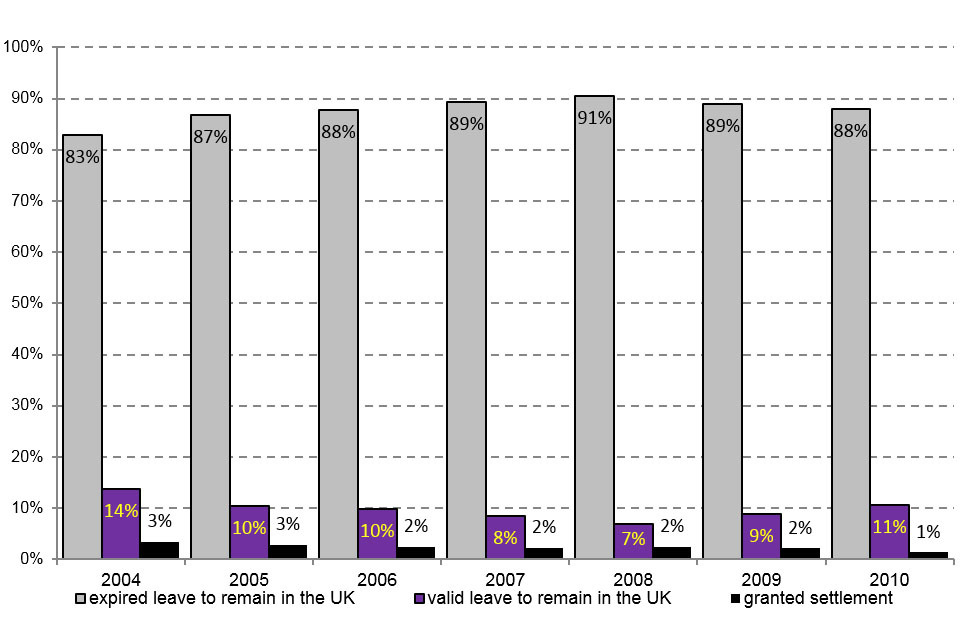
The chart shows the 2004 to 2010 cohorts issued a visa through the work route (not leading to settlement) by immigration status 5 years later.
Chart notes
Source: Home Office, Statistics on changes in migrants’ visa and leave status: 2015, table MJ 03.
The majority of those granted a temporary work visa in 2010 were main applicants (93%), reflecting the fact that these visas will not normally bring rights for accompanying family members.
In the 2010 cohort, the top 5 nationalities accounted for over two-thirds (68%) of the temporary work route. The largest number was Indian nationals who are often granted a visa as a temporary Intra-company Transfer.
Top 5 nationalities in the 2010 cohort issued a temporary work visa
| Nationality | Migrants in 2010 cohort | Immigration status 5 years later % with expired leave to remain in the UK | Immigration status 5 years later % with valid leave to remain in the UK | Immigration status 5 years later % granted settlement |
|---|---|---|---|---|
| All nationalities | 58,133 | 88% | 11% | 1% |
| Of which: | ||||
| Indian | 14,760 | 85% | 14% | 1% |
| Australian | 13,001 | 93% | 6% | 1% |
| American | 4,208 | 90% | 9% | 1% |
| New Zealander | 3,838 | 91% | 8% | 2% |
| Canadian | 3,693 | 89% | 9% | 2% |
Table notes
Source: Home Office, Statistics on changes in migrants’ visa and leave status: 2015’ table MJ 03.
This route does not lead to settlement and some categories do not allow migrants to bring their dependants. Those migrants in this route who have achieved settlement will in most cases have married settled persons or British citizens or switched into other routes. Analysis of the previous category of individuals granted an extension in 2011 and 2012 is given in the article ‘Extensions of stay by previous category’. Updates for 2015 of the more detailed tables provided in the article are included in the Extensions tables in the Immigration Statistics release.
Study
The majority (69%) of migrants who were issued a study visa in 2004 no longer had valid leave to remain in the UK 5 years later. This proportion has increased in each cohort arriving from 2005, to 81% for those issued a study visa in 2010.
Conversely, the proportion of migrants who gained settlement 5 years after entering on a study visa declined over the same period. For people issued a study visa in 2004, only 4% had gained settlement 5 years later, and a further 27% still had valid leave to stay in the UK, either as students or in another route. For those arriving in 2010, only 1% had gained settlement 5 years later, and a further 18% still had valid leave to stay in the UK.
These changes are consistent with the tightening of the Immigration Rules for students since September 2007 (for details please see ‘Policy and legislative changes affecting migration to the UK’. They may also be partly related to the economic conditions following the recession in 2008 to 2009, which for a while may have reduced the incentive for students to remain and seek work in the UK. However, students have comprised increasing proportions of the numbers eventually granted settlement over the past 6 years (see the backward-view analysis below).
The study group reported on here excludes student visitor visas that cannot be extended and normally have validity of 6 months or in some cases up to 11 months.
Comparison of migrants issued a visa to study in each year 2004 to 2010, by their immigration status 5 years later
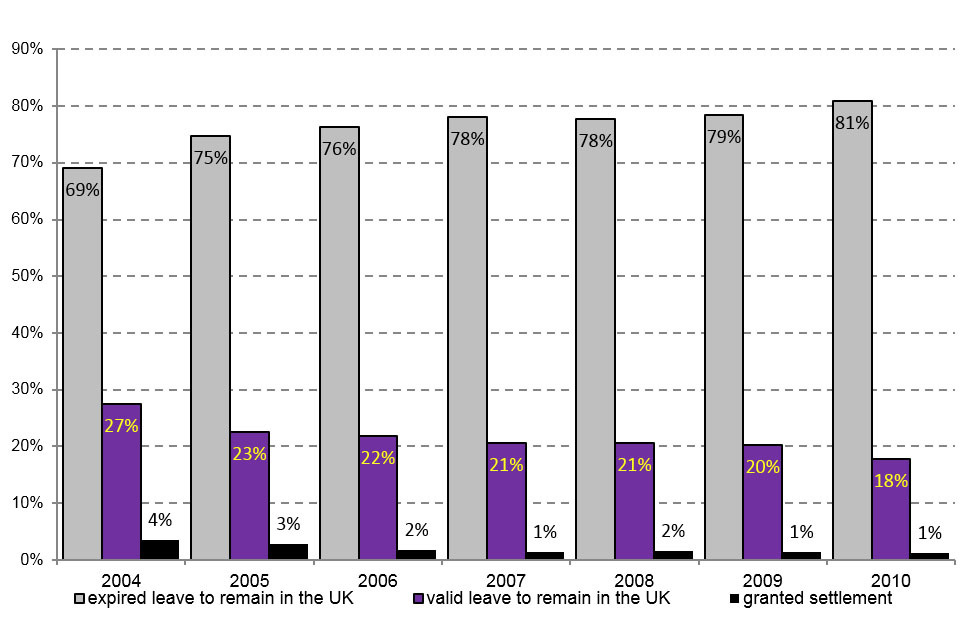
The chart shows the 2004 to 2010 cohorts issued a study visa by immigration status 5 years later.
Chart notes
Source: Home Office, Statistics on changes in migrants’ visa and leave status: 2015, table MJ 04.
Of the people issued a study visa in 2010, 48% had expired leave to remain in the UK after just 2 years, reflecting the fact that many people on student visas will come to study short courses, including both postgraduate studies or further education courses. The majority (60%) of non-EU students who started at a UK university in 2010 to 2011 were studying a postgraduate course, rather than an undergraduate degree.
In the 2010 cohort, just 5 nationalities accounted for over half (55%) of the people who entered the UK via the study route. These nationalities were Indian, Chinese, Pakistani, American and Nigerian (see the table below).
Most (89%) of those granted a study route visa in 2010 were main applicants (the student); the remaining 11% were those travelling as a dependent family member. Of the top 5 nationalities, Indian and Nigerian students had the highest proportion of dependants (14% and 11%) and Chinese the lowest (1%).
Around a third (33%) of Nigerian students had valid leave to remain in the UK or had obtained settlement after 5 years, the highest proportion among the top 5 and around three-fifths higher than the proportion for non-EU students as a whole (19%).
Top 5 nationalities in the 2010 cohort issued a study visa
| Nationality | Migrants in 2010 cohort | Proportion who were dependants | Immigration status 5 years later % with expired leave to remain in the UK | Immigration status 5 years later % with valid leave to remain in the UK | Immigration status 5 years later % granted settlement |
|---|---|---|---|---|---|
| All nationalities | 251,049 | 11% | 81% | 18% | 1% |
| Of which: | |||||
| Indian | 49,254 | 14% | 83% | 16% | 1% |
| Chinese | 37,699 | 1% | 84% | 15% | 0% |
| Pakistani | 25,890 | 7% | 77% | 20% | 3% |
| American | 14,657 | 4% | 90% | 9% | 1% |
| Nigerian | 11,696 | 11% | 67% | 30% | 3% |
Table notes
Source: Home Office, Statistics on changes in migrants’ visa and leave status: 2015, table MJ 04.
Dependants joining or accompanying
The ‘dependants joining or accompanying’ category applies to people who have been issued a visa on the basis of their relationship with another migrant, who is not a settled person or British citizen and may have been issued a visa for any reason (for example, work, study, family). Dependants are allocated an entry clearance category according to the circumstances of their application. Please see the User Guide to the Home Office Statistics on changes in migrants’ visa and leave status: 2015 for further information on the entry clearance rules for dependants.
For people issued a dependants joining or accompanying visa in 2010, almost half (46%) had gained settlement (permission to stay permanently in the UK) 5 years later, and a further 7% still had valid leave to remain in the UK.
Comparison of migrant cohorts issued a visa through the dependants joining and accompanying route in each year 2004 to 2010, by immigration status 5 years later
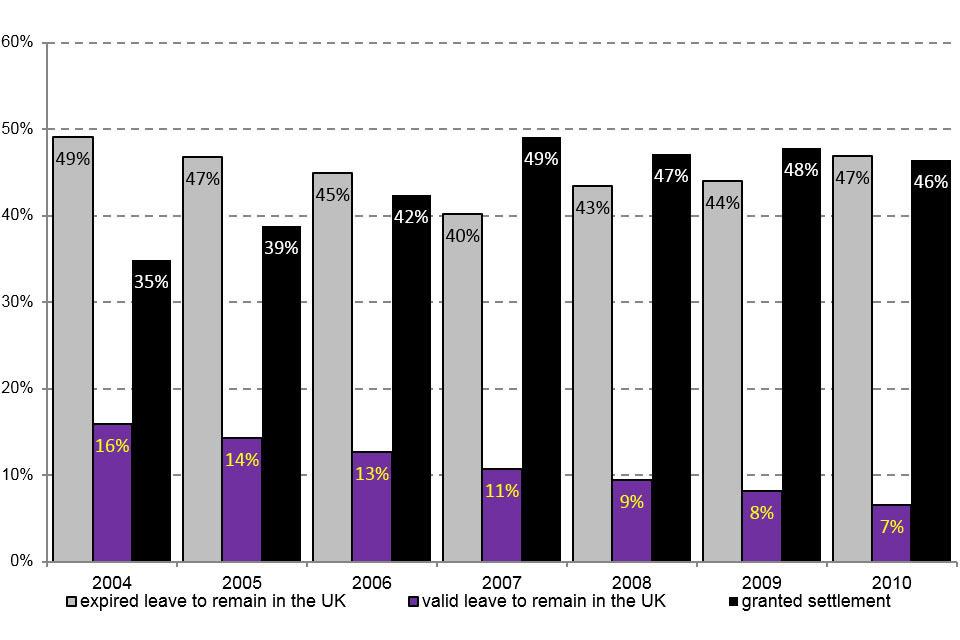
The chart shows the 2004 to 2010 cohorts issued a dependant joining or accompanying visa by immigration status 5 years later.
Chart notes
Source: Home Office, Statistics on changes in migrants’ visa and leave status: 2015, table MJ 05.
In the 2010 cohort, the top 5 nationalities accounted for just under half (48%) of the visas issued through the dependants joining or accompanying route.
The top 5 nationalities for dependants joining or accompanying differ in the proportion with leave to remain in the UK still valid after 5 years, as shown in the table below. Nationals of Afghanistan were most likely to have been granted settlement after 5 years (83%), as were the majority of Filipino, Indian and Pakistani nationals arriving as dependants, compared with a very low proportion of Americans (4%) who were by far the largest number of any nationality in this category, accounting for almost one-quarter of the total in the 2010 cohort.
Top 5 nationalities in the 2010 cohort issued a dependants joining or accompanying visa
| Nationality | Migrants in 2010 cohort | Immigration status 5 years later % with expired leave to remain in the UK | Immigration status 5 years later % with valid leave to remain in the UK | Immigration status 5 years later % granted settlement |
|---|---|---|---|---|
| All nationalities | 14,693 | 47% | 7% | 46% |
| Of which: | ||||
| American | 3,425 | 88% | 8% | 4% |
| Indian | 1,113 | 23% | 5% | 73% |
| Pakistani | 985 | 24% | 4% | 72% |
| Afghan | 830 | 14% | 3% | 83% |
| Filipino | 740 | 21% | 5% | 74% |
Table notes
Source: Home Office, Statistics on changes in migrants’ visa and leave status: 2015, table MJ 05.
Migrants in each cohort still holding valid leave to remain in the UK or granted settlement after 8 years
- a higher proportion of family migrants issued a visa in 2007 still had valid leave to remain in the UK or had settled after 8 years, compared with the 3 preceding years
- the proportion of migrants who still had valid leave to remain in the UK or had been granted settlement after 8 years was lower for those issued a work visa in 2007 than for those issued a work visa in 2004, 2005 and 2006, possibly reflecting the prevailing economic conditions over the subsequent period as well as changes to the Immigration Rules
- almost 1 in 7 (14%) of those arriving on a student visa in 2007 still had valid leave to remain in the UK or had settled 8 years after entry, as did 8% of those who had initially arrived for short-term or temporary work
Migrants in each cohort still holding valid leave to remain in the UK or granted settlement after 8 years, by visa type 1
| Cohort(1) | Family | Skilled work (with a potential path to settlement) | Temporary work (not leading to settlement) | Study | Dependants joining or accompanying |
|---|---|---|---|---|---|
| 2004 | 75% | 46% | 13% | 22% | 47% |
| 2005 | 75% | 42% | 10% | 18% | 50% |
| 2006 | 79% | 41% | 9% | 16% | 52% |
| 2007 | 82% | 33% | 8% | 14% | 58% |
Table notes
Source: Home Office, [Statistics on changes in migrants’ visa and leave status: 2015, tables MJ 01–MJ 05.
(1) Data for 2008, 2009 and 2010 cohorts are not available.
Backward-view analysis
The ‘Statistics on changes in migrants’ visa and leave status: 2015’ analysis also considers those whose entry to the UK ultimately results in them applying for settlement (permission to stay permanently in the UK) and which visas they used initially to come to the UK. The final part of this report looks at the immigration case histories of migrants who were granted settlement in each year from 2009 to 2015.
Limitations of data matching, available data and the rules for settlement mean that it was not always possible to trace every case back to the first visa record. In addition, some original entry records will pre-date the electronic databases used for this analysis, meaning that the migrants could not be linked to an initial visa record.
Numbers of cases granted settlement can also reflect casework management decisions as well as policy changes. The higher volume of cases granted settlement in 2010 reflects more grants given on a discretionary basis. This resulted from a review of the backlog of cases involving unsuccessful asylum applications announced in July 2006 by the then Home Secretary.
The most common pathways to settlement are the family and skilled work routes – the direct routes to settlement allowed under the Immigration Rules. Both of these allow a grant of settlement without the migrant switching to another immigration category. Of those migrants granted settlement in 2015, around two-fifths (41%) had originally entered the UK on either a skilled work or a family visa, but this proportion has fluctuated across cohorts, as shown in the chart below.
Over a quarter (29%) of those granted settlement in 2015 originally arrived to study, or had accompanied a student. This proportion has increased from 14% of those granted settlement in 2009. As this is a temporary route, these student migrants will, in most cases, have subsequently switched into another route to permanent settlement or used the long-term residency rule.
A further 8% of migrants in the 2015 cohort had settlement as their first record. This means that they had either been granted settlement on arrival, indefinite leave to enter the UK (ILE), or had a grant of indefinite leave to remain in the UK (ILR) as their earliest record.
Common immigration routes of those granted settlement in 2009 to 2015
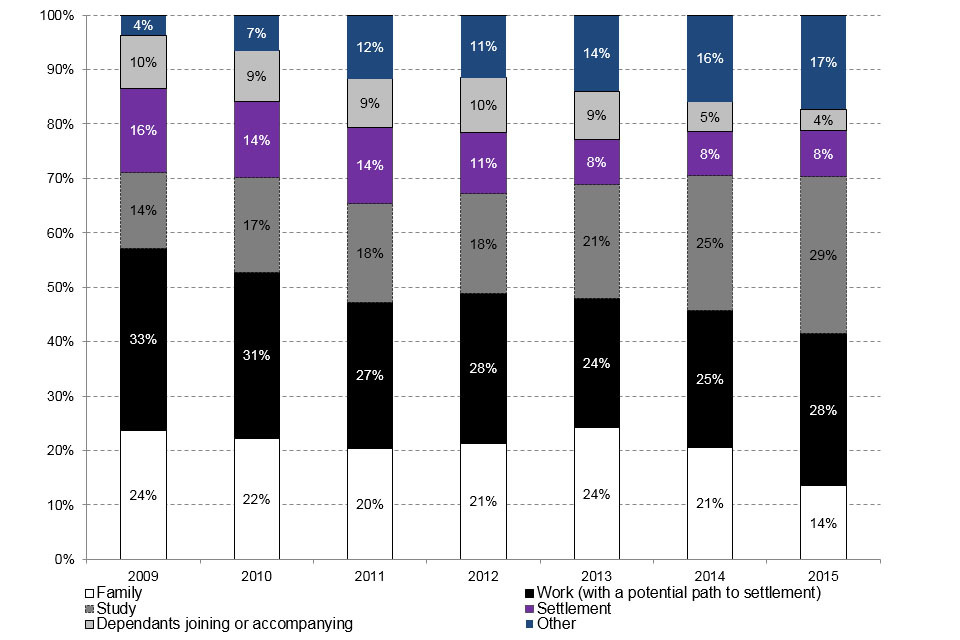
The chart shows the common immigration routes for those settling in 2009 to 2015.
Chart notes
Source: Home Office, Statistics on changes in migrants’ visa and leave status: 2015, table MJ 06. The chart displays the most common immigration routes.
The number of dependants granted settlement in 2015 differed according to the initial route of entry, as shown in the table below. Over two-thirds (68%) of the total number of settlement grants in 2015 were issued to main applicants and 32% were issued to their dependants. Of the dependants granted settlement in 2015, around two-fifths (43%) initially entered the UK with a main applicant on a work (with a potential path to settlement) dependants visa, that is accompanying a skilled worker.
Common immigration routes of those granted settlement in 2015
| Initial route of entry | Total | Main applicant | Dependants |
|---|---|---|---|
| Total | 93,062 | 63,576 | 29,486 |
| Of which: | |||
| Dependants joining or accompanying | 3,654 | 1,329 | 2,325 |
| Family | 12,578 | 9,416 | 3,162 |
| Skilled work (with a potential path to settlement) | 26,000 | 13,399 | 12,601 |
| Study | 26,799 | 23,950 | 2,849 |
| Settlement | 7,883 | 3,284 | 4,599 |
Table notes
Source: Home Office, Statistics on changes in migrants’ visa and leave status: 2015, table MJ 06. The table displays the most common immigration routes and excludes other categories, which include EEA family permits and temporary work visas.
In the 2015 cohort, the top 5 nationalities (Indian, Pakistani, Zimbabwean, Nigerian and Chinese) accounted for 46% of the total number of settlement grants in that year, with Indian migrants making up the largest proportion (20% of the total). The numbers of migrants from particular nationalities will reflect the make-up of migrants on a path to settlement (entering some years earlier) and may not reflect the pattern among those migrants arriving now.
Different nationalities have very different profiles in terms of their routes to reaching settlement.
Of the Indian migrants granted settlement in 2015, 57% (10,845) initially entered the UK on a skilled work visa, and 29% (5,549) initially came to the UK to study.
Of the Pakistani migrants granted settlement in 2015, 40% (4,210) came to the UK to study. A further 25% (2,625) were originally issued family route visas and 20% (2,159) came on a skilled work visa.
The third largest group in 2015 were Zimbabweans; 27% (1,319) who were granted settlement in the 2015 cohort initially entered the UK on a study visa and 16% (816) on a family visa.
Just over half of Nigerian migrants granted settlement had come to the UK as students (51%; 2,279). A further 24% (1,050) arrived on a skilled work visa.
Of the Chinese migrants, 43% (1,617) were originally issued study visas, and 29% (1,078) arrived on a skilled work visa.
Top 5 nationalities granted settlement in 2015, by initial route of entry to the UK
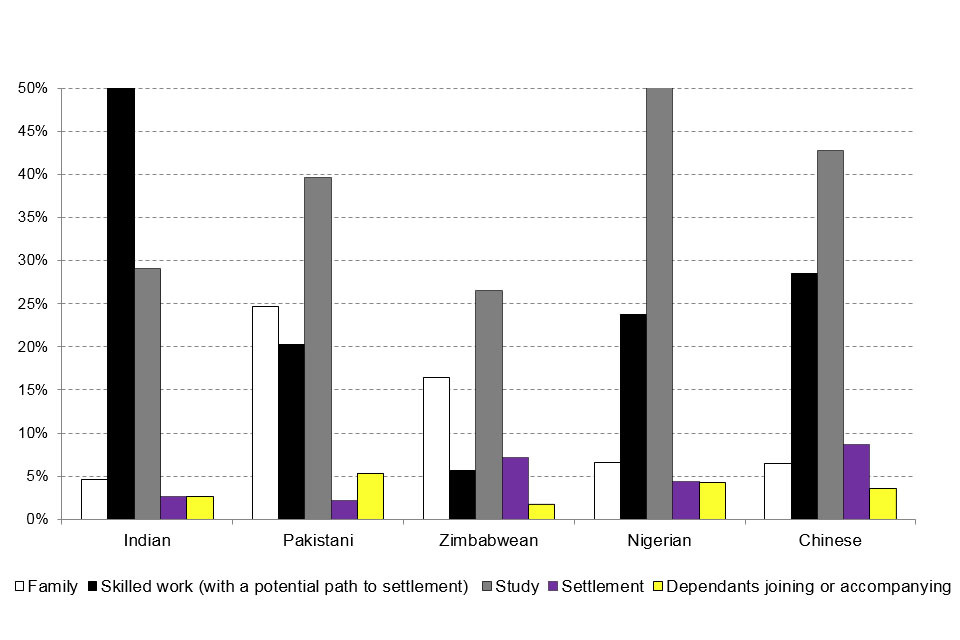
The chart shows the top 5 nationalities granted settlement in 2015 by initial route of entry to the UK.
Chart notes
Source: Home Office, Statistics on changes in migrants’ visa and leave status: 2015, table MJ 06. The chart displays the most common immigration routes and excludes other categories, which include EEA family permits and temporary work visas.
Data tables
Further data on ‘Statistics on changes in migrants’ visa and leave status: 2015’ are available in Tables MJ 01 to MJ 06.
About the figures
This is the seventh in a series of research reports based on the ‘Statistics on changes in migrants’ visa and leave status: 2015’ (formerly known as ‘Migrant journey’) cohort data; it is published annually by the Home Office and complements data on the number of visas already published as part of the regular ‘National Statistics release of migration statistics’. If as a user you have any comments on this plan please email MigrationStatsEnquiries@homeoffice.gov.uk.
The findings presented here are based on data collected from Home Office administrative databases. These databases hold records of individuals granted entry clearance visas and any subsequent grants of extensions of stay in the UK. As these are sourced from operational systems, numbers may change and may not precisely reflect other published statistics, if those are produced and published at a different time. While EEA nationals do not require visas, records suggest that some apply and are granted visas and therefore small numbers may be included in this analysis. Nationals from countries that became part of the EEA over the time period of this analysis are also likely to be included in earlier cohorts.
The ‘User guide to statistics on changes in migrants’ visa and leave status: 2015’ provides further details on this topic including definitions used, how figures are compiled, data quality and issues arising from figures based on data sourced from an administrative database.
Tier 1 (which provides a route for highly-skilled migrants) of the PBS was phased in between February and June 2008. Tier 2 (which provides a route for skilled workers with a job offer) and Tier 5 (which is for temporary workers and youth mobility, providing a route for those coming to the UK for primarily non-economic reasons) were implemented in November 2008, and new rules for business visitors were introduced at the same time.
Skilled work (with a potential path to settlement) relates to work categories that were eligible to apply for settlement after a specified time period. These were mainly routes equivalent to the PBS Tiers 1 and 2, and some unskilled routes, for example, domestic workers. More information can be found in the user guide.
The numbers of applications and decisions made reflect changes in the levels of immigration over time, as well as policy and legislative changes, including changes to immigration legislation. Details of these policy changes, together with information on changes to immigration legislation affecting the statistics, can be found in the ‘Policy and legislative changes timeline’ published alongside this report.
Other related data
In September 2010, the Home Office published ‘The Migrant Journey’, which presented data on the cohort of migrants who came to the UK in 2004. The findings reported the immigration status of these migrants over the subsequent 5 years, where migrants changed their category of leave to remain in the UK, and how migrants in temporary and permanent immigration routes achieved settlement in the UK.
In August 2011, a second report extended the September 2010 analysis by reporting on specific migrant nationalities that were issued visas in 2004.
In February 2013, a third report extended the August 2011 analysis by providing updates for two later cohorts of migrants, namely 2005 and 2006 for the forward-view analysis and 2010 and 2011 for the backward-view analysis.
In February 2014, a fourth report extended the February 2013 analysis by providing updates for the 2007 cohort of migrants for the forward-view analysis and 2012 for the backward-view analysis.
In February 2015, a fifth report extended the February 2014 analysis by providing updates for the 2008 cohort of migrants for the forward-view analysis and 2013 for the backward-view analysis. For the first time, this report provided an extended analysis of the immigration status of migrants at the end of the seventh year after their visa was issued.
In February 2016, a sixth report extended the February 2015 analysis by providing updates for the 2010 cohort of migrants for forward-view analysis and 2015 for the backward-view analysis.
A short statistical article on ‘Extensions of stay by previous category’ was published alongside the Immigration Statistics April to June 2013 release to provide further detailed information. Updates for 2015 of the more detailed tables provided in the article are included in the Extensions tables in the Immigration Statistics quarterly release.
The regular quarterly releases of Home Office migration statistics can be found at Immigration statistics quarterly release.