Impact assessment (accessible version)
Published 10 September 2020

© Crown copyright 2020
This publication is licensed under the terms of the Open Government Licence v3.0 except where otherwise stated. To view this licence, visit nationalarchives.gov.uk/doc/open-government-licence/version/3 or write to the Information Policy Team, The National Archives, Kew, London TW9 4DU, or email: psi@nationalarchives.gov.uk.
Where we have identified any third party copyright information you will need to obtain permission from the copyright holders concerned.
This publication is available at https://www.gov.uk/government/publications/statement-of-changes-to-the-immigration-rules-hc-707-10-september-2020/impact-assessment-accessible-version
Impact Assessment, the Home Office
| Title: | Impact Assessment for changes to the Immigration Rules for Students |
| IA No: | HO0370 |
| RPC Reference No: | RPC-HO-5001(1) |
| Other departments or agencies: | |
| Date: | 10 September 2020 |
| Stage: | Final |
| Intervention: | Domestic |
| Measure: | Secondary legislation |
| Enquiries: | StudentMigrationPolicyTeam@homeoffice.gov.uk |
| RPC Opinion: | Green |
| Business Impact Target: | Qualifying provision |
| Cost of Preferred (or more likely) Option (in 2020 prices) | |
|---|---|
| Net Present Social Value | -1,200 |
| Business Net Present Value | -2,700 |
| Net cost to business per year EANDCB (£m) | 6.7 |
What is the problem under consideration? Why is government intervention necessary?
Following the end of free movement, the current Immigration Rules relating to students require updating and simplification in support of the Government’s Future Border and Immigration System (FBIS). The Government has publicly committed to delivering FBIS by the time the EU transitional period ends on 31 December. EU nationals must be able to apply under the FBIS Student Immigration Rules before free movement ends, so that they can still come to the UK to study from 1 January 2021.
What are the policy objectives and the intended effects?
This set of Immigration Rules changes will primarily streamline and simplify the student and child student Immigration Rules which govern how international students come to the UK to study, in support of FBIS. It will be open to EEA nationals, who, unless they qualify under EUSS, will need to apply for leave to enter or remain under the single global system from 1 January 2021 when the transitional period has ended.
What policy options have been considered, including any alternatives to regulation? Please justify preferred option (further details in Evidence Base)
The options considered are:
- Option 0 - Do Nothing. This does not meet the Government’s objectives.
- Option 1 - Lay changes to the Immigration Rules so both EEA and non-EEA students will be subject to the same immigration controls under the FBIS. This will link to the Immigration Bill which will end freedom of movement and introduce a global points-based system for all migrants coming to the UK.
Main assumptions/sensitivities and economic/analytical risks
| Discount rate (%) | 3.5% |
Behavioural impacts are highly uncertain, therefore estimates should be treated as indicative and ranges have been applied to capture the uncertainty. A further uncertainty is the impact of changes to tuition fees and student financing, as it is outside of the scope of Home Office policy but could have a significant impact on migrant behaviour. Central assumptions do not include estimated behavioural response from universities, who may seek to target non-EEA students to replace any reduction in EEA applications.
Will the policy be reviewed?
It will be reviewed.
If applicable, set review date:
10/2025
I have read the Impact Assessment and I am satisfied that, given the available evidence, it represents a reasonable view of the likely costs, benefits and impact of the leading options.
Signed by the responsible Minister: [signature]
Date: 9/9/2020
Summary: Analysis & Evidence
Policy Option 1
Description: Full economic assessment
| Year(s): | |
| Price Base | 2020/21 |
| PV Base | 2020/21 |
| Appraisal | 10 |
| Transition | 1 |
| Estimate of Net Present Social Value NPSV £m | |
| Low: | -1,000 |
| High: | -1,500 |
| Best: | -1,200 |
| Estimate of BNPV £m | |
| Best BNPV | -2, 700 |
Costs, £m
| Transition Constant Price | Ongoing Present Value | Total Present Value | Average/year Constant Price | To Business Present Value | |
|---|---|---|---|---|---|
| Low | 0 | 3,900 | 3,900 | 500 | 2,200 |
| High | 0 | 5,700 | 5,700 | 700 | 3,200 |
| Best Estimate | 0 | 4,800 | 4,800 | 600 | 2,700 |
Description and scale of key monetised costs by ‘main affected groups’
- Home Office: Increased processing EU student costs of around £90 million.
- Education institutions: Loss in tuition fee income of £2.7 billion (fewer EU students), and increased workload costs of £65 million.
- Exchequer costs: Potential loss in revenue of around £2 billion (fewer EU students).
Other key non-monetised costs by ‘main affected groups’
- Further Education Colleges/Independent Schools: In addition to the costs that universities may face as a result of EU students coming through the immigration system, FE colleges and independent schools may also face an increase in workload costs, but due to limited evidence this has not been quantified.
Benefits, £m
| Transition Constant Price | Ongoing Present Value | Total Present Value | Average/year Constant Price | To Business Present Value | |
| Low | 0 | 2,900 | 2,900 | 400 | 0 |
| High | 0 | 4,200 | 4,200 | 500 | 0 |
| Best Estimate | 0 | 3,600 | 3,600 | 400 | 0 |
Description and scale of key monetised benefits by ‘main affected groups’
-
Home Office: The increase in international students coming through the immigration system is estimated to lead to an increase in visa fee and IHS revenue by around £720 million. IHS revenue will be transferred to the Department of Health and Social Care.
-
Exchequer: Cost savings from fewer EU students estimated to be around £2.9 billion.
Other key non-monetised benefits by ‘main affected groups’
There may be increased tuition fee income if universities offer more places to UK/non-EU students to offset the reduction in EU students - this could offset the loss of income from EU students. Any increase in international student inflows to the UK under FBIS may have wider economic impacts (such as broader student expenditure), but this is difficult to quantify.
Business assessment (Option 1)
Direct impact on business (equivalent annual) £m:
| Cost, £m | 6.7 |
| Benefit, £m | 0.0 |
| Net, £m | 6.7 |
| Score for business impact target (qualifying provisions only) £m: | 67.0 |
Does implementation go beyond minimum EU requirements? N/A
Is this measure likely to impact on trade and investment? N
Are any of these organisations in scope?
| Micro | N |
| Small | Y |
| Medium | Y |
| Large | Y |
What is the C02 equivalent change in greenhouse gas emissions? (Million tonnes C02 equivalent)
| Traded | N/A |
| Non-traded | N/A |
People and specific impacts assessment (Option 2)
Are all relevant Specific Impacts included? Y
Are there any impacts on particular groups? Y
Evidence Base (for summary sheets}
A. Strategic Overview
A.1 Background
1. Tier 4 is the current route for non-EEA nationals who wish to study in the UK. Within Tier 4 there are two separate sub-routes. The Tier 4 (Child) route is for students aged under 18 years of age studying at an independent school and the Tier 4 (General) route is for students aged 16 years and above studying at A level or above. Under Tier 4, students are sponsored by an education provider who holds a Tier 4 sponsor licence. Some students (generally defined by the level at which they are studying) are permitted limited work rights and may sponsor dependant family members to join them in the UK. A Child student may be accompanied by one parent while the child is between the age of 4 and 11 years.
2. In their report on the Impact of International Students, published in September 2018, the Migration Advisory Committee found that international students generally bring an economic benefit to the UK[footnote 1]. They also contribute to our soft power; as such the Government has never sought to limit their numbers. The International Education Strategy[footnote 2], published in March 2019, stated an ambition to increase the number of international Higher Education (HE) students in the UK to 600,000 by 2030 (the number is currently around 485,000). Continuing to attract international students will ensure that the UK’s education sector remains competitive in the rapidly expanding global market of overseas education.
A.2 Groups Affected
3. The main groups that would be affected by the policy are:
- International students, and in particular those from EU countries.
- Licenced student sponsors.
- Prospective sponsors who have not yet applied for a licence but will need one in future.
- UKVI.
- State funded schools, which will no longer be able to recruit EU students who are primarily coming to the UK to study.
A.3 Consultation
Within Government
4. The Government set out its intent in a policy statement, ‘The UK’s points-based immigration system’[footnote 3], in February 2020 and a further policy statement, ‘The UK’s points-based immigration system: further details’ on 13 July 2020.
5. The Student Migration policy team has engaged with business units across the Home Office to ensure that affected teams are aware of the changes and are satisfied that the plan is deliverable.
Public Consultation
6. The Home Office has engaged extensively with the education sector through the Education Advisory Group. This group consists of representatives of the Government, the Devolved Administrations and representative bodies of the education sector. It meets regularly and the Home Office has used this group as a forum to request feedback on the policy and engage with the sector about policy development. The independent Migration Advisory Committee ran public consultations on overseas students and EEA migration in 2018 and reported its findings in its reports ‘International students in the UK’[footnote 4] and ‘EEA migration in the UK: final report’[footnote 5] in September 2018. The Home Office took careful account of the MAC’s findings and its recommendations regarding the student route, accepting those recommendations in full and going further in deciding to introduce a Graduate route from 2021. The Home Office’s student policy was informed by wider public consultation undertaken by the MAC and the Home Office did not seek to duplicate this consultation.
B. Rationale for intervention.
7. The Government is committed to ending free movement for EU citizens. The Government has publicly committed to delivering FBIS by the time the EU transitional period ends on 31 December. EU nationals must be able to apply under the FBIS Student Immigration Rules before free movement ends, so that they can still come to the UK to study from 1 January 2021.
8. This set of Immigration Rules changes will primarily streamline and simplify the student and child student Immigration Rules which govern how international students come to the UK to study, in support of FBIS. It will be open to EEA nationals, who, unless they qualify under EUSS, will need to apply for leave to enter or remain under the single global system from 1 January 2021 when the transitional period has ended, as well as citizens from the rest of the world.
C. Policy objective
9. The broad objectives of the changes are to:
- Deliver the commitment to end freedom of movement for EEA citizens
- Ensure EU nationals are able to apply for leave to enter or remain under the single global system from 1 January 2021 when the transitional period has ended.
- Support the Government’s manifesto commitment to help our universities attract talented students and allow students to stay on and apply for work after they graduate.
- Improve, streamline and simplify the student immigration system for both students and sponsoring institutions without compromising the compliant nature of the route.
- Ensure it becomes increasingly attractive to international students.
10. The main measures of success are that:
- EU nationals are subject to immigration control and are able to apply for a study visa under FBIS before free movement ends.
- Total numbers of international students increase over time following the introduction of FBIS (noting that Covid-19 is likely to have an impact on recruitment in the short term at least).
- Applicants and sponsors are able to understand the rules and guidance more easily, leading to a decline in the number of enquiries about interpretation of the rules.
- Students and their sponsors continue to be a compliant cohort.
D. Options considered and implementation.
11. The options considered for this final stage Impact Assessment (IA) were a ‘do nothing’ option, where the changes to the Immigration Rules for the student route are not made and the current arrangements continue, and a preferred option where changes to Immigration Rules are made as a part of the future global points-based immigration system.
Current arrangements
12. The UK’s current immigration arrangements, whereby EEA citizens and their family members are free to live in other EEA countries to work and study, are retained in UK domestic law by the EU (Withdrawal) Act 2018. This means, under the current system, EEA students and their family members enjoy a right to enter and reside in the UK without the need to obtain permission under the Immigration Act 1971. Current arrangements enable EEA students to generally access UK public funds on the same terms as British citizens and the UK to pay certain benefits to, or in respect of, people living in EEA countries.
13. Non-EEA students are covered by Immigration Rules, which means they are subject to certain requirements to enter the UK, and there are restrictions placed on the type of activity they can undertake in in the UK. The eligibility requirements for current Tier 4 (General) applicants include English language proficiency, an unconditional offer from a licensed Tier 4 sponsor and sufficient funds to support themselves and pay for their course.
Option O: Do nothing
14. Under the ‘do nothing’ option, changes to the Immigration Rules for students would not be made. This IA therefore assumes that the current arrangements would remain in place. As such, this option is equivalent to the current arrangements. This means EEA citizens and their family members would be able to continue to live, work and study in the UK in accordance with free movement rights.
15. Under this option, the Government would not be able to fulfil its aim to have full control over who comes to the UK and how the immigration system operates and ensuring the brightest and best talents from around the world come to study in the UK. The Government would not be able to deliver the global points-based immigration system for the study route as set out in the policy statement in February 2020[footnote 6]. The ‘do nothing’ option is therefore not considered to be a viable option.
Option 1: Preferred option
16. The Government has committed to delivering a firmer and fairer points-based system and ensuring that the brightest and best students from around the world are able to study in the UK. This new system proposes that all international students who come to study in the UK will be treated equally and will be subject to the same requirements of the future study route. The FBIS also proposes that education institutions who wish to offer places to international students must have a sponsorship licence under FBIS.
17. This will require changes to the Immigration Rules. These changes will allow the ‘study’ component of the future points-based immigration system to operate fully, and it will ensure the Government’s objectives are met.
Preferred option and implementation plan
18. The Immigration Rules set out how immigration applications to study in the UK will be considered and therefore the rules must be changed to give effect to the preferred option.
19. The preferred option will therefore be implemented by means of a change to the Immigration Rules to introduce the new Student and Child Student routes. It is planned to lay the changes on 1O September, and they will come into effect on 5 October. The rules will need to be re-laid in October alongside the full FBIS rules so that they fit correctly into the new structure of the fully updated and simplified rules, but the substantive content of the student Immigration Rules will not require a further update.
20. In addition, the current Tier 4 policy guidance documents and GOV.UK content will be updated, rebranded and republished alongside the new Immigration Rules. Affected IT systems will also be updated. There will be a full package of internal and external communications and engagement with stakeholders.
21. The FBIS project team will oversee and manage the full set of changes that are required to give effect to the preferred option.
22. Option 1 allows the Government to achieve its policy objectives and this is the Government’s preferred option.
E. Appraisal
23. The Future Border and Immigration System (FBIS) proposes a single, global system which will be points-based and builds on the current system for non-EEA citizens. It will be open to all international students, including EEA students studying on courses lasting longer than six months, such as those in independent schools, further education colleges or HE institutions. Applicants will need to have been offered a place on a course at a registered institution, meet the relevant English language requirements and have sufficient funds to support themselves. This IA looks at the impact of the new rules on international student enrolments in HE and does not measure the impact on post study work behaviour, which will be set out in an IA to accompany the rules on the graduate route. The policy appraisal period is from 2020/21 to 2030/31, a period of 10 years.
E1. General assumptions and data
E1.1 Background
24. The volume of international students coming to study in the UK has been increasing in recent years. The Higher Education Statistics Agency (HESA) provides data on students at HE level. It found that the total number of international students in HE in the UK has increased by around 1O per cent between 2014/15 and 2018/19[footnote 7], with the latest data suggesting around 140,000 EU domiciled[footnote 8] and 340,000 non-EU domiciled students were enrolled in higher education institutions (HEIs) in the UK. Of these, there were around[footnote 9]:
- 130,000 full-time EU and 320,000 full-time non-EU students.
- 15,000 part-time EU and 25,000 part-time non-EU students.
- 100,000 EU undergraduate students and 170,000 non-EU undergraduate students.
- 40,000 EU postgraduate students and 170,000 non-EU postgraduate students.
25. The decision to come and study in the UK is determined by many factors, such as cultural links, quality of education, employment, cost of education, language, or further study opportunities associated with chosen education course or institution and other reasons.
26. Hobson’s International Survey 2017[footnote 10] found that the most important factors for choosing a country to pursue further study were, the quality of teaching (26.7 per cent), the openness to international students (23.3 per cent), the ability to obtain a visa (21 per cent) and the cost of living (20 per cent)[footnote 11].
E1.2 Assumptions
27. The analysis focuses on the impact of policy changes on EU domiciled students currently studying at HEIs, and it particularly focuses on those will come to study in the UK in 2021 onwards as those who come before are assumed to be registered on the EU Settlement Scheme (EUSS). EU students are analysed across all levels of study within HE but those in further education (FE) or those studying at Alternative Providers are not included. There is currently limited data on the volume of EU students in further education in the UK as colleges are not currently required to collect this data[footnote 12], and therefore it is difficult to estimate how many will be affected by FBIS. However, the business impacts for independent schools and further education colleges have been quantified where possible.
28. This analysis also assumes that EU students would only use the Immigration System in Academic Year 2021/22, as any EU student who wishes to start a course before that (that is, academic year 2020/21) are assumed to be registered on the EUSS and will therefore not require a study visa. This is an uncertain working assumption but given the uncertainty of this and of COVID-19 impacts (see below), any impacts from this year’s intake are expected to be small.
29. The analysis also does not account for the wider behavioural response of universities to FBIS, such as whether they will adjust their recruitment practises to mitigate the potential reduction in EU student enrolments. However, sensitivity analysis has been conducted on this assumption in section G. The analysis also does not provide granularity on modes of study, gender or specific nationalities as there is no available evidence on how these subsets of international students in HE specifically, would respond to the policies in FBIS. The analysis only estimates the impact of FBIS on the HE sector as a whole, and it does not account for impacts on individual institutions.
30. There are other factors which have not been accounted for in this analysis, such as the impact of restrictions on employment rights and proof of funds, which may have a deterrent impact but there are limited data on what this impact could be. It also does not assess the impact of potential Home Office policy, such as the graduate route as it has not been laid in Parliament, although it could have a positive impact on international student enrolments. The Department for Education recently announced changes to tuition fees and access to student loans for EU students. However, as this has not been laid in Parliament yet, the analysis also does not account for any changes to tuition fees or student loans, as they are outside the scope of Home Office policy and they are the responsibility of the relevant Education Departments in England, Scotland, Wales and Northern Ireland. Therefore, this analysis assumes that current tuition fees for EU students will remain the same under FBIS, based on 2017/18 HESA tuition fee income data[footnote 13]. The analysis also assumes that EU students continue to gain access to student loans under the FBIS, as based on the current arrangements.
31. The analysis produces a net present social value (NPSV) to the associated costs and benefits of the proposed changes and the discount rate is 3.5 per cent, as recommended by the Green Book (HM Treasury 2018). The appraisal period is assumed to be over the first ten years of the policy.
32. Due to wide range of estimates outlined in this analysis, a standardised approach to rounding numbers has been implemented. If estimates in this analysis are less than £1 million, it is rounded to the nearest £0.1 million. If it less than £10 million, it is rounded to the nearest £1 million. If it is between £10 million to £100 million, it is round to the nearest £5 million. If it is between £100 million and £1 billion, it is round to the nearest £10 million and if it’s above £1 billion, it is rounded to the nearest £0.1bn. Exemptions to this assumption will be set out where necessary.
E2. Volumes
33. To measure the impact of the policy on international students in HE, a baseline in the absence of any policy intervention has been modelled. The change in the volume of international students as a result of the policies is then measured against the baseline to assess the potential impacts on the tuition fee income of universities, the public administration burden on the Home Office and the Exchequer impacts.
34. The baseline projections for first-year EU student enrolments is based on historical trend data from Higher Education Statistics Agency (HESA) data between academic years 2000/01 and 2017/18. HESA collects data from universities, higher education colleges and other specialist providers of higher education in England, Wales, Scotland and Northern Ireland.
35. More information on the methodology of the analysis and the calculations can be found in section K.
E2.1 Impact on EU student volumes in HE
36. Changes to the Immigration Rules for students will subject EEA students to the same requirements as non-EEA students under FBIS. These will include the requirement to pay visa fees and the Immigration Health Surcharge (IHS), a finite post-study work period and restrictions on the right to bring dependants, provide proof of funds and rules relating to work when studying in the UK. Each of these changes will have a deterrent impact on the number of EEA students coming to study in the UK. The impacts of these changes have been quantified where possible and considered below. More information on the methodology of how these impacts were quantified can be found in section K.
37. Applying visa fees and the IHS to EU students may have a deterrent impact on EU students. To estimate the impact of these policies, estimates for the responsiveness of students to a change in the cost of HE were used as a proxies to measure the impact of visa fees and the IHS on EU students[footnote 14]. The deterrence impact is estimated to be around five per cent, depending on the level of study. This is broadly intuitive as the cost of a study visa and the IHS is relatively small when compared to the overall cost of the education. and this would suggest that the deterrence impact would be small.
38. Compared to freedom of movement, the current post-study work arrangements impose a restriction on the length of time EU students can work in the UK post-graduation - with unrestricted work being limited to between seven days and four months. The impact of this restriction, compared to freedom of movement, is expected to reduce EU student enrolments, as students might be deterred from coming to the UK to study.
39. Longitudinal Education Outcomes (LEO) data, which provides information on student destinations after graduation, has been used to estimate the impact of these post-study work restrictions on EU students. LEO data shows there is a significant difference between the proportion of EU and non-EU students in work post-graduation - with EU students, who currently face no restrictions, being up to 20 percentage points more likely to be working in the UK one year after graduation than non-EU students (who are restricted to between seven days and four months to search for a job before they have to transfer into immigration work routes[footnote 15], depending on the level, institution, and length of study[footnote 16]).
40. In order to make a broad estimate of the potential impact of restricting the post-study work rights of EU migrants, the difference in work outcomes has been used as a proxy for the change in student inflows which might result from the change. When the average proportion of non-EU inflows in work after one year is applied to baseline EU inflows, there is an implied reduction of up to 20 per cent in EU student inflows, depending on the level of study. For modelling purposes, it is therefore assumed EU student inflows will be up to 20 per cent lower as a result of the imposition of the current post-study work restrictions[footnote 17]. This estimate should be treated as indicative and is highly uncertain - the difference observed in the LEO data may not directly stem from the difference in the post-graduate work ‘offer’ and there are other factors (such as geographical) which could influence whether a student might come to the UK. The proportion of non-EU students in work one year after graduation is used as a proxy to estimate the proportion of students switching to work within the post-study work period. Whilst this approach may not accurately reflect the volume of EU and non-EU students switching to work directly after graduation, it is the best approach to take in the absence of other data sources. The ending of freedom of movement is likely to be the primary deterrent for EU students, rather than the post-study leave period on a student visa specifically.
41. The restrictions on the rights to bring dependants, which will apply to EU students under FBIS, may also have an impact on inflows under FBIS, as only those who are studying a full-time course which is at least nine months long at a postgraduate level of study are allowed to bring family members to the UK. Whilst data on the volume of EU students with dependants is generally limited, the Survey of Graduating International Students (SOGIS) 2017 estimates that on average, only around three per cent of EU students have children, whilst a further four per cent are married or are registered in a civil partnership[footnote 18]. The HESA data for 2018/19 estimates around 25 per cent of all full-time EU students were on postgraduate level courses, however, this may be an overestimate as it includes students who are on courses for less than nine months[footnote 19]. The deterrence impact is estimated to be up to five per cent[footnote 20], and this is based on bespoke SOGIS 2017 data which provides an indication of how many EU students have children[footnote 21].
42. Other measures such as proof of funds and employment rights might have an additional deterrent impact - but there is little evidence on which to base an estimate.
43. When applying these potential deterrents, the reduction in EU student inflows are estimated to be 15,000 to 20,000 per year[footnote 22] under Option 1 in the first ten years of the policy[footnote 23].
44. In order to estimate the longer-term impact of reduced inflows on the stock of EU student migrants in HE, expected length of study data for academic year 2017/18 from HESA is applied to the change in inflows, leading to an estimate of between 35,000 and 50,000 fewer EU HE students per year on average in the UK by academic year 2030/31 relative to the baseline[footnote 24]. However, universities may adjust their recruitment practises to target more non-EU students to offset the reduction in EU students, so the overall impact on international student numbers is unclear.
45. These estimates however do not account for the impact of other potential government policy, such as the introduction of the graduate route which could have a positive impact on non-EU student volumes. This will be set out in an IA to accompany the Immigration Rules for the Graduate route.
E2.2 Impact on non HE EU students
Further Education
46. Information on international students in further education is limited[footnote 25]. However, the Association of Colleges (AoC) suggests around two per cent of total students in further education in England were EU citizens in 2017/18[footnote 26]. The AoC survey found there were around 384 EU students on average in English colleges in 2017/18. This number increased by nine per cent from 353 EU students in 2016/17. However, these results do not necessarily specify how many were already domiciled in the UK or have EU Settlement Scheme (EUSS) status.
47. The administrative burden and the cost of applying for a student visa may deter some EEA students from coming to study further education in the UK but this impact is difficult to quantify as evidence is generally limited. Where survey data is available, the sample sizes are often small so they may not represent the total volume of EU students in further education in the UK. For those EU students who are required to pay tuition fees, any reduction in student volumes will lead to a fall in tuition fee income for further education colleges. However, colleges charge different fees and therefore It is difficult to accurately quantify the impact of FBIS on the change in fee income for colleges.
Independent Schools
48. EEA child students will require a student (child) visa to come and study in the UK under FBIS, unless they acquire a right to study having come as a dependant of an adult migrant, such as a skilled worker.
49. Around half of UK independent schools are members of the Independent Schools Council (ISC)[footnote 27], which accounts for around 80 per cent of all independent school children. Home Office visa data is not available tor EEA child students, but ISC data provides a valuable insight into the volumes of international students studying at independent schools. There were around 58,650 international child students at independent schools in the UK in 2020 according to the ISC, and around 30 per cent of these were EEA students (around 19,000 in absolute terms)[footnote 28]. As above, these estimates do not specify how many were already domiciled in the UK or have EUSS status.
50. Some EEA child students may be deterred by the administrative burden of the student (child) route, and this may lead to a reduction in EEA child inflows. However, this is difficult to quantify accurately. An illustrative scenario has been provided below to better understand the impact of FBIS, and in particular the restrictions on EU students, on the tuition fee income of independent schools.
E3. COSTS
51. The following section sets out the economic costs of the proposed changes to the study route under FBIS. It estimates the economic impact of the proposed changes on the tuition fee income of universities, the Home Office’s income and costs and the Exchequer impact. The quantified impacts can be found below. The methodology for the calculations below can be found in section K.
Set up costs
E3.1 Familiarisation costs
Universities
52. There will be familiarisation costs for universities as they better understand the new Immigration Rules. This is based on the assumption that the new Immigration Rules are estimated to be around 15,000 words, and readingsoft.com estimates are used to calculate the speed it takes to read the guidance[footnote 29]. The central estimate for reading speed assumes that staff who work at universities are good readers and are therefore able to read 400 words per minute. An upper and lower bound is also used to account for any changes to the final length of the Rules. This can be seen in the table below.
Table 1 - Estimated reading time for Immigration Rules
| Reading Speeds | Number of words | Speed (words per minute) | Total time (mins) |
|---|---|---|---|
| High | 20,000 | 240 | 118 |
| Central | 15,000 | 400 | 46 |
| Low | 10,000 | 1000 | 10 |
53. This is then multiplied by the following:
- Value of time - There is a degree of uncertainty regarding the types of occupations that university staff who review Immigration Rules are working in. It is assumed an average hourly salary across three different occupations[footnote 30], based on hourly ASHE data[footnote 31]. A Eurostat uplift of 18 per cent is applied to account for non-wage costs[footnote 32]. The average gross wage used is £27 per hour[footnote 33].
- Volumes - There are around 170 universities in the UK who will be required to review the new Immigration Rules under FBIS[footnote 34]. As there is limited information on how many staff members will be reviewing the new Immigration Rules in each university, this IA has assumed a range of between 5 to 15 staff members per university, with the central figure estimated to be 10 staff members per university.
54. The total familiarisation costs for universities are estimated to lie in the range of £0.0 and £0.1 million, with the central estimate of around £0.0 million (2020/21 prices) in year 1 only[footnote 35]. The central estimate assumes that it will take 46 minutes to read the guidance per staff member, and there are 10 members of staff per university.
Further education colleges, independent schools and private providers
55. There ls currently limited data on the number of EU students at these institutions. However, the registered list of Tier 4 sponsors indicates that there are around 930 non-HE institutions who currently have a Tier 4 licence and will be required to familiarise themselves with the new guidance[footnote 36].
56. The approach outlined above for universities is largely replicated for non-HE institutions, although the primary difference is that fewer members of staff per non-HE institution are assumed as they generally tend to be smaller. This analysis assumes between one to three members of staff per institution, with two staff members being used as the central estimate.
57. The total familiarisation costs for non-HE institutions is estimated to be between £0.0 and £0.1 million. with the central estimate of around £0.0 million (2020/21 prices) in year 1 only.
Total familiarisation costs
58. The total familiarisation costs across all education institution types lie in a range of £0.0 and £0.3 million. with the central estimate of £0.1 million (2020/21 prices) in year 1 only.
Ongoing costs
Direct ongoing costs
E3.2 Home Office - processing costs of EU students
59. EU students who come to study in the UK will be required to apply for a student visa, which means that the Home Office’s processing costs will increase, both for visa applications and Confirmation of Acceptance of Studies (CAS) applications per student[footnote 37]. This cost is calculated using visa fees transparency data. and this is multiplied by the number of students under FBIS[footnote 38].The visa fee transparency data indicates that the unit cost for each Tier 4 application is between £153 and £252, depending on whether the application is out-of-country or in-country respectively. Fees and unit costs are assumed to the remain the same as current levels.
60. It is also assumed that there will be no additional up-front costs for the Home Office to accommodate EEA students who will require a visa under FBIS, as the total increase in international students using the study route under the FBIS should fall within the current capacity constraints.
61. The additional cost of processing visas is estimated to lie in a range of £65 to £95 million with a central estimate of £80 million (10-year PV, 2020/21 prices). The additional estimated cost of processing CAS applications lie in a range of £10 to £15 million with a central estimate of around £10 million[footnote 39].
62. The total additional processing costs are estimated to lie in a range of £75 to £110 million with a central estimate of about £90 million (10-year PV, 2020/21 prices).
E3.3 University - processing costs for student applications (EU students)
63. As EU students will require a study visa to come and study in the UK under the FBIS, there will be increased workload for universities as they will have to process these additional student applications. Research by Ernst and Young on Russell Group universities found that the average staffing cost per Tier 4 application was around £135[footnote 40]. Assuming these costs are the same under FBIS and are applicable for non-Russell group universities, the total additional staffing costs as a result of EU students through the future immigration system is estimated to lie in a range of £50 to £75 million with a central estimate of about £65 million (10-year PV, 2020/21 prices).
64. The workload costs for independent schools and FE colleges are uncertain due to the lack of information on the processing costs for these institutions and the wider uncertainty of inflows at these institutions under FBIS. The same estimates for HEIs cannot be applied to other institutions as the costs may vary. Data on the volume of students at these levels coming to study in the UK under FBIS is limited and therefore it is difficult to quantify workload costs for these institutions.
Indirect ongoing costs
E3.4 Loss in tuition fee income
65. A reduction in EU students coming to study in the UK could lead to a fall in projected tuition fee income for universities. The estimated reduction in the stock of EU students is estimated to be annually between 35,000 - 50,000 students per year in higher education. The change in the proportion of the stock is applied to the outturn HESA data of tuition fee income. This is estimated to lead to a reduction in projected tuition fee income of between £2.2 and £3.1 billion with a central estimate of £2.7 billion (10-year PV, 2020/21 prices) over the ten-year appraisal period. The average annual reduction in tuition fee income under FBIS would reflect around 2% of total tuition fee income, assuming it was to stay broadly the same as 2018/19 levels[footnote 41].These estimates are based on the assumption that there is a reduction in EU student enrolments, and that universities do not adjust their recruitment practises to mitigate this reduction. However, sensitivity analysis has been conducted in section G to show scenarios where universities may adjust their recruitment practises to target more non-EU students to offset the fall in EU students; given the relative size of EU versus non-EU tuition fees, a small increase in non-EU students could offset the reduction in EU tuition fee income. Universities may also offer more places to international students as whole, and therefore the overall impact on student migration is uncertain.
66. Evidence on the impact of FBIS on the tuition fee income of FE colleges is difficult to quantify due to the lack of available evidence on the volume of EU students and tuition fee income of colleges. Where there is data available, sample sizes are generally small and therefore are not representative of the sector. It also does not specify the split between short-term and long-term students, as only the latter group of EU students are likely to be deterred by immigration restrictions.
67. The Independent School Council (ISC) census provides the average tuition fee per term in their 2020 census[footnote 42], and this was estimated to be between around £15,000 and £35,000 per annum, depending on whether it was based on day fees or boarding school fees[footnote 43]. The census also indicates that there were around 19,000 EU students in independent schools in 2020, and an illustrative scenario has been provided to show the potential impact of FBIS on the fee income of independent schools, based on these student estimates.
68. Assuming a five per cent reduction in EU students in independent schools under FBIS based on the deterrence impact of visa fees and the IHS for students in HE (which is outlined in section E2.1), this would lead to a fall in tuition fee income for independent schools to be between £120 and £280 million (10-year PV, 2020/21 prices) over the ten-year appraisal period, depending on whether the fees are day fees or boarding school fees, assuming the level of fees and volumes were to remain the same under the FBIS. However, this could be an over-estimate as it assumes that these schools do not have a waiting list. which may not be the case. If independent schools offer more places to other students on the waiting list, the impact on tuition fee income could be zero. Furthermore, EEA child students may be registered under the EUSS which could also indicate the impact may be minimal. As these are illustrative estimates, they have been excluded from the central NPSV.
69. A limitation of this scenario is that the ISC only represent around half of all independent schools, so the impacts outlined above may not necessarily reflect the total scale of the impact on volumes and projected fee income for independent schools. The estimate for fees outlined in this scenario is for all students, not specifically EU students.
E3.5 Loss in Exchequer income
70. EU students who do come to study in the UK will also contribute to the UK’s public finances, largely through indirect tax contributions. As the analysis estimates a reduction in EU students, this suggests that there will be loss in Exchequer income from fewer EU students coming to study in the UK. This is estimated to lead to a cost saving of between £1.6 and £2.4 billion with a central estimate of £2 billion (10-year PV, 2020/21 prices) over the 10-year period under the central scenario. Further information on the methodology of calculating the fiscal impacts of EU students can be found in the annex.
Total costs
71. The total costs are estimated to be between £3.9 and £5.7 billion over the 10-year appraisal period, with a central estimate of £4.8 billion (10-year PV, 2020/2 prices). Of the total cost, around £0.1 million are familiarisation costs whilst the remaining £4.5 billion are ongoing costs.
E4. Benefits
E4.1 Direct Benefits
Home Office - increase visa fee revenue
72. Those EU students who continue to come to study in the UK under FBIS will also generate income for the Home Office, through payment of visa fees and the IHS, and this is estimated to increase Home Office income.
73. As outlined in paragraph 59, visa fee transparency data is used to estimate the cost of the Tier 4 data, and this is applied to the EU students corning to the UK under FBIS. The Tier 4 (General) visa costs between £348 and £475, depending on whether the application is out-of-country or in-country. This is estimated to increase visa fee revenue to the Home Office by between £140 and £210 million with a central estimate of around £180 million (10-year PV, 2020/21 prices).
Department of Health and Social Care (DHSC) - increase in IHS income
74. The IHS also costs students £470 per year. It is collected by the Home Office on behalf of DHSC and all IHS income (less an amount to offset the collection costs) is transferred to DHSC and the Devolved Administrations for health spending. As EU students will also be required to pay for the IHS to study in the UK, IHS revenue is also estimated to increase between £460 and £630 million with a central estimate of around £540 million (10-year PV, 2020/21 prices) from EU students over the ten-year appraisal period under the central scenario.
75. The total IHS and fee revenue is estimated to increase between £600 and £840 million, with a central estimate of around £720 million (10-year PV, 2020/21 prices).
E4.2 Indirect benefits
76. EU students who do come to study in the UK will also incur public service provision costs, such as healthcare and education. As the analysis estimates a reduction in EU students, this suggests that there will be a saving in public provision costs from fewer EU students coming to study in the UK. This is estimated to lead to a cost saving of between £2.4 and £3.4 billion with a central estimate of £2.9 billion (10-year PV, 2020/21 prices).
Total benefits
77. The total benefits are estimated to be between £2.9 and £4.2 billion, with a central estimate of around £3.6 billion (10-year PV, 2020/21 prices). All of the total benefits are estimated to be ongoing benefits.
E5. Other impacts
78. The impacts outlined below are payments between UK businesses (such as education institutions) and the UK government, and therefore have been excluded from the summary of results and the final NPSV due to a variety of reasons which have been explained below.
E5.1 Cost of obtaining a sponsorship licence
79. Under FBIS, institutions which are not a registered Tier 4 sponsor will require a licence if they want to continue to offer places EU students. The current cost of obtaining a licence is £536 per institution[footnote 44]. This is split by education type below:
-
Universities: Universities which are not a registered Tier 4 institution will require a licence if they want to continue to offer places to EU students. There are currently 1,200 educational institutions licensed to sponsor students under the current non-EEA Tier 4 points-based system[footnote 45]. Internal Home Office analysis found that only one per cent of universities that currently offer places to EU students do not have a Tier 4 sponsorship licence[footnote 46]. This indicates that any transition costs for universities are estimated to be negligible, given the cost of acquiring a licence.
-
Further Education colleges: The registered list of sponsors data indicates that there were around 120 publicly funded colleges currently hold a Tier 4 sponsorship licence[footnote 47], whilst the Association of Colleges indicate that there were around 290 colleges in total in the UK in 2018/19[footnote 48]. This indicates that less than half currently hold a Tier 4 licence. With data on the volume of EU students at FE colleges limited, assuming the remaining colleges applied for a sponsorship licence under FBIS, this would cost the further education sector less than £1 million. However, this is likely to be an upper estimate as it is unlikely that all further education colleges currently enrol EU students, and therefore will not need to acquire a licence.
-
Independent schools: There are currently around 660 independent schools which currently have a Tier 4 sponsorship licence[footnote 49], and the ISC indicated that 1,364 schools are members of the ISC[footnote 50], representing around half of all independent schools[footnote 51]. Assuming all of the independent schools which currently have a licence responded to the survey, this would indicate 600 to 1,800 independent schools currently do not have a licence[footnote 52]. Given the cost of obtaining a licence, it would cost these remaining schools between £0.4 and £1 million, with a central estimate of around £0.8 million assuming they met the relevant requirements. Again, this is likely to be an upper estimate as it is unlikely that all independent schools currently offer places to EU students, which means they will not need a licence.
80. The analysis above estimates that the total cost of acquiring a sponsorship licence for education institutions will be less than £1 million under FBIS. As this is a resource cost to the Home Office which is recovered through a licence fee to education institutions, it has been excluded from the NPSV.
E5.2 Cost of assigning a CAS for international students under FBIS
81. All education institutions will be required to obtain a CAS for EU students under FBIS, and this has been quantified where possible.
-
Universities: Based on the volume of EU students who are estimated to and study at UK universities under FBIS, this may generate between £8 and £10 million, with a central estimate of around £10 million (10-year PV, 2020/21 prices) for EU students. However, as this cost to the Home Office is being reimbursed through a fee mechanism (to universities) it has been excluded from the NPSV estimate.
-
Further Education colleges and independent schools: Data on the volume of EU students in further education colleges are limited, and therefore quantifying the additional cost of CAS under FBIS is difficult to do. However, as outlined in paragraph 49, the ISC census indicates that there were around 19,000 EU students in independent schools in 2020[footnote 53]. If independent schools assigned a CAS for all of these students, it would cost less than £1 million for that given year[footnote 54]. However, the ISC estimate reflects the number of students in the UK, rather than inflows into the country, and it therefore may be an over-estimate and therefore it is difficult to accurately quantify the CAS costs for independent schools over the appraisal period. Those students who are already in the UK may have EUSS status and independent schools will not be required to assign a CAS to them.
E5.3 IHS third party payment income
82. The IHS is collected via a third-party private company who charge a percentage of the value of surcharge income handled. As IHS income will be increasing due to EU students also being required to pay the IHS under FBIS, this is likely to lead to a small increase in the collection fee income for the third party, which is a direct cost to the UK government. This is estimated to be between £10 and £15 million with a central estimate of around £15 million (10-year PV, 2020/21 prices) for EU students. However, as this is revenue that only arises because of the regulation, it is excluded from the NPSV.
E6. Summary of results
E6.1 Net Present Social Value (NPSV)
83. Under the central assumptions, the estimated total quantified benefits and costs are £3.6 billion and £4.8 billion respectively, which provides an NPSV of around -£1.2 billion over the 10-year appraisal period.
84. As there is inherent uncertainty with economic modelling, analysis has been conducted to estimate an upper and lower bound for baseline and policy volume projections, based on the historical volatility of international student enrolments in HE. More information on the volume scenarios can be found in the section K. Table 2 shows the impact of the different volume scenarios on the NPSV. The scenarios outlined here do not show the full extent of the range of impacts as further sensitivity analysis has been conducted in section G to provide a range of fiscal impacts, and potential impacts as a result of the behavioural responses universities to the future education system.
Table 2: Costs and benefits of Option 1 under low, central and high volume assumptions (PV, 2020/21 prices),£ million, 2020/21 to 2030/31
Benefit
| Discounted values - nominal prices FY | Low | Central | High |
|---|---|---|---|
| Additional visa fee revenue (EU) | 140 | 180 | 210 |
| Additional IHS income (EU) | 460 | 540 | 630 |
| Savings to UK due to lower public service provisions due to fewer EU students | 2,400 | 2,900 | 3,400 |
| Total benefits | 2,900 | 3,600 | 4,200 |
Costs
| Discounted values - nominal prices FY | Low | Central | High |
|---|---|---|---|
| Increasing processing costs for Home Office (EU students) | 65 | 80 | 95 |
| Increase CAS processing costs (EU students) | 10 | 10 | 15 |
| Loss in tuition fee income from fewer EU students | 2,200 | 2,700 | 3,100 |
| Familiarisation costs to education institutions | <1 | <1 | <1 |
| Loss in exchequer income from fewer EU students | 1,600 | 2,000 | 2,400 |
| Increase Tier 4 processing costs for universities (EU students) | 50 | 65 | 75 |
| Total costs | 3,900 | 4,800 | 5,700 |
| Net Present Social Value (NPSV) | -1,000 | -1,200 | -1,500 |
Source: Internal Home Office Analysis. Figures may not sum due to rounding.
85. Changes to the volume scenarios also impact the overall NPSV. If the low volume scenario is used, then the estimated quantified total costs and benefits are £3.9 billion and £2.9 billion respectively, thus resulting in an estimated NPSV of-£1.0 billion (10-year PV, 2020/21 prices)[footnote 55]. Similarly, under the high-volume scenario, the estimated total costs and benefits are £5.7 billion and £4.2 billion respectively, leading to an estimated NPSV of-£1.5 billon (10-year PV, 2020/21 prices)[footnote 56].
86. The overall impact of the policies on the net migration of international students coming to study in the UK under FBIS is uncertain. This analysis does not account for other potential wider government policy which may have a positive impact on international student enrolments, such as the introduction of the Graduate route. If universities adjust their recruitment practises to target more non-EU students to offset the reduction in EU students, then this could have a positive impact on projected tuition fee income and an impact on public finances. Further sensitivity analysis on the behavioural response of universities to FBIS can be found in section G.
E6.2 Business Net Present Value
87. Including EEA migrants in the migration system will mean some education institutions may, for the first time, face familiarisation costs if they wish to continue to offer places to them under FBIS. Detailed guidance for sponsors of students is available on GOV.UK[footnote 57]. For education institutions who already use the system, familiarisation costs are likely to be lower than those who have never used it previously, as many duties falling on the sponsors will be the ones they already undertake. Sponsored education institutions will also incur the cost of applying for a CAS for each additional international student under FBIS.
88. The Business Net Present Value is estimated to be between -£2.2 and -£3.2 billion, with a central estimate of around -£2.7 billion (10-year PV, 2020/21 prices) over the appraisal period.
89. Table 3 below highlights the main direct and indirect impacts on universities as a result of changes to the Immigration Rules for students. The impacts on Further Education institutions and Independent schools are uncertain but have been quantified below where possible.
Table 3: Overview of impacts to business
| Impact Category | Type of impact | Cost or benefit | Magnitude of impact |
|---|---|---|---|
| Familiarisation cost | Direct | Cost £m: <1 | All education institutions will be .required to familiarise themselves with the new guidance related to the changes to the Immigration Rules for students. As outlined in paragraph 58, this is estimated to be between £0.0m and £0.3 million for universities, independent schools and FE colleges over the appraisal period. |
| Cost of acquiring licence | Direct (excluded) | Cost £m: <1 | Analysis estimates that the cost of acquiring a licence for the education sector will be between £0.4 million and £1 million, assuming all universities, further education and independent school acquire a licence, as outlined in paragraph 79. As this is a cost to the Home Office which is being reimbursed through a fee mechanism (to education institutions), it has been excluded from the NPSV. |
| University processing costs - Tier 4 applications (EU students) | Direct | Cost £m 50-75 | As EU students will require a study visa to come and study in the UK, this will increase the cost of processing Tier 4 applications for universities. As outlined in paragraph 63, this is estimated to be between £50 million - £75 million. |
| CAS costs | Indirect (excluded) | Cost £m: 8-10 | Universities will be required to apply for a CAS to each EU student under FBIS. This is estimated to cost universities between £8 million to £10 million, as outlined in paragraph 81. The cost to independent schools is difficult to quantify due to a lack of information on flows to the UK. However, based on the ISC latest census figures on all EU students in independent schools in 2019, this would have cost the sector less than £1 million for that year. As this is a cost to the Home Office which is being reimbursed through a fee mechanism (to education institutions), it has been excluded from the NPSV. |
| Tuition fee income | Indirect | Cost £ bn: 2.2 to 3.1 | The reduction in EU students in HE is estimated to lead to a fall in projected tuition fee income, and this is estimated to be between £2.2 billion and £3.1 billion (10-year PV, 2020/21 prices) over the appraisal period. Estimates do not account for any behavioural response of universities, although sensitivity analysis has been conducted on this in section G. The illustrative scenario for independent schools suggest that tuition fee income from EU students is estimated to fall by between £120 million and £280 million over the appraisal period depending on the level of fees, as outlined in paragraph 68. However, if independent schools have long waiting lists, they could offer places to those on the waiting list to offset the potential reduction in EU students, thus minimising the overall impact on fee income. Impacts on Further Education institutions are uncertain. |
Source: Home Office, internal analysis, 2020.
90. Table 3 quantifies the impacts to all education institutions where possible. However, the BNPV and does not account for the impact of FBIS on the fee income of FE colleges, and the workload costs to both further education colleges and independent schools, which may impact the BNPV somewhat, but evidence is limited.
E6.3 Equivalent Annual Net Direct Cost to Business (EANDCB)
91. The EANDCB lies between the range of £5.4 and £8.1 million with a central estimate of £6.7 million, based on the direct costs outlined in Table 3. This is based on the following direct cost components:
-
Familiarisation costs: Outlined in paragraph 58. This approach uses readingsoft.com to estimate the length of time it takes to read the Immigration Rules (around 46 minutes), and ASHE data is used to estimate the hourly cost (which is £27) of reading the Immigration Rules which is applied to the total number of sponsors (and the relevant number of staff members at each sponsor institution).
-
University processing costs: As outlined in paragraph 63. There will be additional student applications from EU students under the future system, and research from Ernst and Young is used to estimate the total cost of processing a Tier 4 application (which is £135 per application). This is then multiplied by the EU student volume projections to estimate the total processing costs for Universities over the ten-year appraisal period.
E6.4 Small and Micro Business Assessment (SaMBA)
92. In the Higher Education sector, provider size is traditionally based on its student population, as it is considered more relevant for most policy questions than the number of total employees. However, for the purposes of the SaMBA assessment, we assess provider size based on the number of employees. Micro businesses generally have fewer than 10 employees, whilst small businesses are defined as those employing between 10 and 49 full-time equivalent (FTE) employees[footnote 58].
93. There are unlikely to be direct impacts of the policy changes on small and micro businesses (SMBs) as the proposed changes primarily impact universities, the Home Office and the Government’s wider fiscal balances. Data for 2018/19 from HESA suggests that there were around 439,955 staff members across 170 different universities, with an average of around 2,500 staff members per HEI[footnote 59]. In absolute terms, the smallest university (in terms of total employees) had 95 members of staff and this could suggest that universities fall outside of the scope of the SaMBA assessment.
94. Evidence on the number of employees in Further Education colleges is limited, and therefore it is more difficult to produce a SaMBA assessment for these institutions. Where evidence is available, the Further Education workforce data for England shows that on average, the number of FTE staff per college is 383 for England[footnote 60]. The total number of employees in each region differs, with the analysis suggesting that the region with the fewest FTE staff per college is Greater London, with 279 per college. This can be seen in table 4 below. Whilst this could show that Further Education colleges are also outside of the scope of SaMBA assessment, this analysis only reflects around 35% of total colleges in England. No additional information has been identified to enable further assessment of the remaining group. There may be other smaller, specialist colleges which fall within the scope of the SaMBA assessment which have not been included in the analysis. However, they may not necessarily offer places to international students, and therefore will not be impacted by the policy change. Evidence on these colleges are limited and it is therefore difficult quantitatively estimate the impact.
95. Table 4 - Total FTE staff in colleges across England in 2012/13 by region
| Region | FTE staff per college |
|---|---|
| East of England | 363 |
| East Midlands | 440 |
| Greater London | 279 |
| North East | 308 |
| North West | 408 |
| South East | 333 |
| South West | 450 |
| West Midlands | 332 |
| Yorkshire and Humber | 406 |
| England | 383 |
Source: Further Education workforce data for England (Frontier Economics)
96. Information on small or micro education institutions with a Tier 4 license is not currently available. However, if a current Tier 4 sponsor was a small or micro education institution, they are likely to face a reduction in tuition fee income due to fewer EU students coming to study in the UK as they will be subject to immigration controls. They may adjust their recruitment practises to offer more places to non-EU students to offset the loss in tuition fee income. Of those EU students who do come to study in the UK, the administrative costs for small or micro education institutions will increase as they will also be required to obtain a CAS for each student, which costs £21. For those small or micro education institutions who do not have a Tier 4 license, they will also be required to obtain a Tier 4 license to ensure they can continue offering places to EU students - the current cost of obtaining a licence is £536 per institution.
97. English Language schools are outside of the scope of this Impact Assessment as the Immigration Rules are only changing for those who come on a long-term study visa, and therefore English Language schools are also outside of the scope of SaMBA.
98. Some small and micro-businesses may be impacted if they are reliant on EEA students who undertake part-time work under the current system, as they will be restricted to work only 20 hours per week under FBIS. However, evidence on this is limited and therefore has not been quantified for the purpose of this IA.
F. Proportionality
99. The analysis set out in this IA is based on changes to secondary legislation, and builds on the Immigration Social Security Coordination (EU Withdrawal) Bill IA.
100. The approach taken in this IA is considered proportionate to the proposed changes to the study route, as it quantifies the impacts of proposed changes to the study routes, and the consequential impacts on volumes (in HE), university tuition fee income, Home Office costs and revenues and the Exchequer.
101. It also shows where evidence is limited, or where assumptions have been made to conduct certain components of the analysis. Further detail on the rationale and methodology for this analysis can be found in section K.
G. Risks and sensitivities
102. The following risks have been identified with the analysis presented in this IA:
-
Any analysis of the impacts of changes in migration are highly uncertain. All estimates should be seen as indicative. Projecting migration flows is challenging due to the wide range of drivers which themselves can be inherently uncertain. Analysis should be considered in the context of the wider economy and continually adapting to an evolving environment. For example, the baseline projections for EU students in HE are based on historical trends, and they are not always an indicator of future outturns. To mitigate this risk, a range of estimates have been used to better capture uncertainty. However, it may not capture the full range of uncertainty as the impacts are largely based on the behavioural assumptions of EU students to the relevant policies, which are only indicative as estimates based on empirical evidence.
-
The impacts above do not attempt to quantify adjustment by universities in response to the policies. For example, it does not estimate whether universities adjust their recruitment practises to mitigate the potential reduction in EU students, as there is currently a lack of available evidence on this issue. Sensitivity analysis has been conducted on this issue in section G, and it indicates in most scenarios where universities offer more places to non-EU students to offset the reduction in EU students, it is likely to have a positive impact on the NPSV.
-
The analysis outlined in this IA only quantifies some of the impacts of the Tier 4 route on EU students in HE, as some of the policies (such as proof of funds) are difficult to quantify. This IA generally focuses on those in HE, as data on those in other levels of study are limited, and it is difficult to estimate the potential impact of the proposed policies on these cohorts. However, Home Office immigration data indicates that the majority of Tier 4 applications (around 85% in 2018) are conducted by those applying to study at HEIs[footnote 61].
-
The modelling outlined in this IA also does not account for any changes to tuition fees, as they fall outside of the scope of Home Office policy. Changes to fees or access to student loans could also have an impact on student volumes as they represent a larger proportion of the overall cost of education.
G.1. COVID-19 impacts
103. The estimates outlined in section E do not currently account for the impact of COVID-19, which . could have a sizeable impact on volumes, at least in the short-term, but it is difficult to quantify the impact on the international students coming to the UK as there are several factors that could affect this. These factors can include but not limited to (a) the number of cases in a particular country (b) the easing of lockdown restrictions globally (c) whether UK universities choose to teach some of their courses virtually, or even delay the academic year and (d) the perception of international students studying in the UK amidst the COVID-19 uncertainty.
104. The factors outlined above will consequently impact the projected tuition fee income of universities, and the Home Office’s finances. Survey findings from Quacquarelli Symonds (QS) found that 53 per cent of respondents who are prospective international students stated that coronavirus has impacted their plans to study abroad, and 46 per cent of those intended to defer or delay their entry until next year, indicating that students may be more inclined to defer rather than be deterred from coming to study in the UK (assuming universities accept their deferral requests)[footnote 62]. This suggests that COVID-19 could significantly impact the results set out above, both in terms of costs and income for universities and the Home Office.
G.2. Behavioural response of universities to FBIS
105. The introduction of FBIS will likely lead to a reduction in EU student enrolments as they will be subject to immigration restrictions, and this is estimated to lead to a reduction in projected tuition fee income from EU students of between £2.2 billion and £3.1 billion over the ten-year appraisal period under the central scenario.
106. The analysis outlined above does not account for the behavioural response of universities, such as whether they adjust their recruitment strategies to offset the potential fall in EU students and the potential loss of tuition fee income. To illustrate the impact of any behavioural response of universities to FBIS on tuition fee income, illustrative scenarios are shown below. The potential impact on tuition fee income if universities offer more places to non-EU students of 10, 25 and 50 per cent to mitigate any reduction in EU students in HE. It demonstrates that in most scenarios, offering more places to non-EU students to offset the reduction in EU students would have a positive impact on both tuition fee income of universities and the NPSV.
G.2.1 - Universities target recruitment to attract more non-EU students (to offset 10% of the reduction in EU students).
107. The analysis currently estimates that the introduction of FBIS is likely to lead to a reduction in first-year EU student enrolments by around 15,000 to 20,000[footnote 63]. This assumes universities do not replace all of the fall in EU students with non-EU students. If universities chose to offer 1O per cent of these places to non-EU students instead, this would be estimated to generate additional projected tuition fee for universities of around £0.4 to £0.6 billion over the appraisal period (10-year PV, 2020/21 prices). This is unlikely to offset all of the illustrative reduction in tuition fee income from the fall in EU students (based on a scenario).
108. Of the estimated total reduction in EU students, assuming universities chose to offer 1O per cent of these places to non-EU students, the NPSV would increase from between -£1.0 billion -to £1.5 billion to between -£0.5 to -£0.8 billion (10-year PV, 2020/21 prices).
G2.2 - Universities target recruitment to attract more non-EU students (to offset 25% of the reduction in EU students).
109. Universities could alternatively offer more places to non-EU students to offset the reduction in EU students. Of the estimated total reduction in EU student enrolments, assuming universities offered 25 per cent of these places to non-EU students, projected tuition fee income of between £1.1 to £1.6 billion (10-year PV, 2020/21 prices) over the 10-year appraisal period. This could increase the illustrative NPSV further to between £0.2 to £0.3 billion (10-year PV, 2020/21 prices) over the appraisal period (based on a scenario).
G2.3 - Universities target recruitment to attract more non-EU students (to offset 50% of the reduction in EU students).
110. The final scenario illustrates the potential impacts if universities offered half of the places from the reduction in EU student enrolments to non-EU students. This is estimated to generate addition projected tuition fee income for universities of around £2.2 to £3.2 billion over the appraisal period and this would more than offset the loss in fee income from fewer EU students. This is also estimated to increase NPSV to between £1.3 to £2.0 billion (10-year PV, 2020/21 prices) over the appraisal period (based on a scenario).
G.3. Fiscal sensitivity
111. The central methodology used in the fiscal analysis of this IA represents a ‘marginal’ approach to measuring the impact of migration and therefore makes a distinction between spend and revenue that is unlikely to vary according to the number of individuals moving to the UK.
112. Under the marginal approach, newly arrived migrants are assumed to have little or no impact on spending on services such as pure public goods, debt interest and EU transactions and revenue streams such as capital gains tax, inheritance tax and gross operating surplus. However, they are assumed to have an impact on congestible public goods and taxes paid by businesses such as corporation tax and business rates. Two sensitivity scenarios are included in order to test the impact of assumptions on which element of revenue and spend are apportioned to migrants.
Sensitivity 1 - includes all spend and revenue components
-
Public goods (such as R&D, Defence) are allocated on a per capita basis.
-
Other indirect taxes such as capital gains tax, inheritance tax, the climate change levy and environmental levies are allocated to individuals based on estimated consumption patterns and income. This assumes the same relationship between earnings and tax contribution as indirect tax.
-
Other receipts such as gross operating surplus, interest and dividends and other income streams are allocated on a per capita basis.
Sensitivity 2 - excludes all public goods and only includes taxes income tax. NIC, council tax and indirect taxes.
-
Under this scenario all public goods (both pure and congestible) are excluded.
-
Under this scenario business rates and corporation tax are excluded. This means only income tax, NIC, council tax and indirect taxes are Included.
113. The sensitivities outlined above are conducted for EU students under the policy scenario. Table 5 shows that under sensitivity 1, the net fiscal contribution of EU students increases by around 25 per cent to £1.1 billion relative to the marginal approach; and under sensitivity 2, it falls by around 15 per cent to £0.7 billion relative to the baseline[footnote 64].
Table 5 - EU students fiscal results relative to baseline FY 2020/21 - 2030/31 (£bn)
| Marginal approach (central estimate) | Sensitivity 1 | Sensitivity 2 | |
|---|---|---|---|
| Reduction in spend | 2.9 | 4.0 | 2.2 |
| Reduction in revenue | 2.0 | 2.9 | 1.4 |
| Net fiscal contribution | 0.9 | 1.1 | 0.7 |
Source: Home Office, own estimates, 2020. Figures may not sum due to rounding.
H. Wider impacts
114. Migration, and changes in migration flows, can have impacts on communities. Community impacts include access to local housing, congestion, access to public services, environmental impacts and crime.
115. As part of its report on the Impact of international students in the UK[footnote 65], the MAC considered the impact of overseas students on the wider community, including health services, transport and housing. The report noted whilst students may have some impact on the communities in which they live, hard evidence is difficult to find. The paper found that it is often difficult to separate the impacts of domestic and international students. There is no evidence to suggest that student neighbourhoods lead to a lower quality of life for other residents.
116. Whilst it is difficult to quantify the impact of students on local transport systems, the UCAS Student Lifestyle Survey found that generally[footnote 66], around 32 per cent of students walked to and around university, whilst a further 47 per cent use some form of public transport such as a bus, train or tube, and only a very small proportion of students drove to university. It is important to caveat that the survey covers all types of students, and therefore the results may differ for international students specifically. Assuming the behaviour of international students is the same as students as a whole, this could suggest that they may have a limited impact on congestion.
117. Data from HESA in 2017/18 shows that around a quarter of international students tend to live in university accommodation, with a further 50 per cent of them living in private sector halls or rented accommodation. This differs from the behaviour of UK students, with around half of all UK-domiciled students either living in their parental/guardian home or living in their own residence. The impact of international student on housing depends on a range of factors, such as the number of international students choosing to rent privately and the supply of housing in the particular area. The MAC report also noted that it is difficult to separate the impacts on housing made by domestic students and international students[footnote 67].
118. As there is limited evidence on the impact of international students on crime, it has assumed to be out of scope of the Justice Impact Test (JIT). There is also limited evidence on the impact of international students on the environment, and therefore it has assumed to be out of scope for the Environment Impact Test.
I. Trade Impact.
119. The policy changes outlined in this IA are estimated to have an impact on international student migration flows to the UK, but there is limited evidence to suggest whether student migration specifically impacts trade. However, there is literature on the impacts of immigrants more generally on trade flows.
120. External literature finds a positive relationship between the stock of immigrants and trade. Gene et al. (2011)[footnote 68] provides a meta-analysis of 48 studies and finds, on average, a 10 per cent increase in immigration stock may increase the volume of trade in goods by about 1.5 per cent. This could be for a range of reasons, with Gould (1994)[footnote 69] arguing that immigrants have individual-specific knowledge of home-country markets which could enhance trading opportunities. For example, immigrants may have a greater a knowledge of foreign languages which helps improve communication in trading relationships; and immigrants may have a greater understanding of legal arrangements which may help lower the fixed costs of trade.
121. Given the temporary nature of student migration, it is unlikely that student migration specifically will directly impact trade flows during their time studying in the UK. However, international students may have an impact on trade if they choose to stay in the UK and work after graduation. The extent of this impact is likely to vary depending on how policy changes affect those switching from study to work, and the consequential changes to the stock of immigrants in the UK, which will impact trade.
J. Monitoring and evaluation (PIR if necessary), enforcement principles
122. The Government’s preferred option is to make changes to the Immigration Rules relating to students under Option 1.
123. The Home Office anticipates that data on the study route will be collected and published as part of regular statistics[footnote 70] to provide transparency and accountability for the department’s work, meeting the needs of Parliament. the media, academia, and the wider public, in line with the Code of Practice for Statistics. The Home Office will work to ensure the information needed for these purposes is collected. The Home Office is also developing plans to evaluate policies introduced under the future-skills based immigration system. This is planned to be an integrated analytical evaluation with multiple components of secondary data analysis and primary research that will report cumulatively over a period of 5 years post-implementation.
K. Annex A
K.1 Introduction
124. This annex provides more information on the methodology and data sources behind modelling used within the Impact Assessment for changes to the Immigration Rules for the student route. The analysis described here is designed to give an indication of the potential scale of the economic impacts of the changes to the policies for international students under FBIS.
125. It begins by setting out the methodology behind the ‘baseline’ projections of international student enrolments (independent of any policy changes), before presenting the methodology and assumptions behind the estimated policy impacts on the flows. It then explains the rationale for estimating the impact of the policy changes on the tuition fee income of universities and Home Office revenues. The final section of this annex sets out the overarching approach to estimating the fiscal impact of policy changes in each area.
126. There is considerable uncertainty within this modelling and there are several ways in which the uncertainty manifests itself:
-
Data sources - imperfect data (such as the use of survey data) often mean that confidence intervals can be large;
-
Assumptions - any modelling requires the use of evidence-based assumptions and expert judgement and migration is no exception; and
-
Behavioural response and change - predicting response or changes to behaviour can be highly uncertain.
127. The potential impacts should be considered in the context of this uncertainty and treated as orders of magnitude rather than precise estimates.
K.2. International student baseline modelling
128. The baseline projections for first-year EU student enrolments is based on historical trend data from Higher Education Statistics Agency (HESA) data between academic year 2000/01 and 2017/18[footnote 71] HESA collects data from universities, higher education colleges and other specialist providers of higher education in England, Wales, Scotland and Northern Ireland.
129. The historical period set out in the baseline projections was chosen to ensure the forecast trends were not distorted by recent years. The baseline projection of EU student inflows can be seen in Figure 1 below. EU first-year student enrolments have increased by more than 50 per cent between 2000/01 and 2017/18, and the baseline projections estimate that this will continue to gradually increase in the absence of any policy intervention. The analysis assumes a steady state beyond 2026/27 due to the uncertainty of projecting migration inflows.
Figure 1 - Projection of EU student inflows between Academic Year 2011/12 to 2029/30[footnote 72]
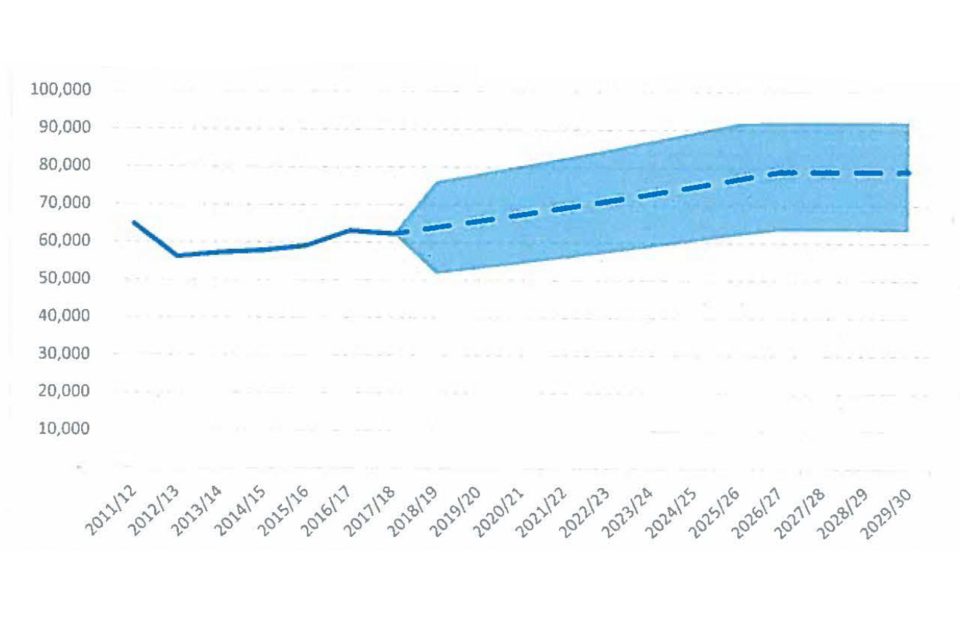
Chart showing actual and projected EU student inflows from 2011/12 to 2029/30. After falling from around 64,000 to 56,000 between 2011/12 and 2012/13, inflows gradually increase to around 62,000 by 2017/18. The central projection then rises to approximately 78,000 by 2026/27 and remains broadly stable, while the uncertainty range widens over the projection period.
130. As with any form of economic modelling, uncertainty is present as there are a range of possible factors which can drive migration (both economic and political), and this has been outlined in more detail in paragraph 126. The baseline projections for EU student enrolments should be treated as indicative, as historical trends are not always representative of future outturns.
131. Coefficient of variation[footnote 73] (CV) analysis is used in order to better capture this uncertainty. Total CV between 2000 and 2017 is conducted to estimate the historical volatility in EU student volumes, disaggregated by level of study. This is estimated to vary depending on the level of study but can be up to ±25% for EU students.
K3. Student Characteristics
K.3.1 Level of Study
132. HESA data for 2017/18 showed that generally the proportion of international students in postgraduate (research) courses were around 5 per cent EU students[footnote 74]. There were generally a greater proportion of EU students in undergraduate courses (55%), whilst the remaining proportion were in postgraduate (taught) level courses[footnote 75]. The analysis assumes that these proportions have remained the same over the forecast period.
K.3.2 Age
133. HESA data for 2017/18 on the ages of international students indicate that there are around a quarter of EU students who are between the ages of 15 and 19 years, whilst around half of EU students being between the ages of 20 and 24 years[footnote 76]. The data broadly shows that around 90 per cent of EU students were under the age of 30 years.
K.3.3 Dependants
134. Under current Immigration Rules, non-EEA students are only allowed to bring dependants (defined as a spouse, civil partner, unmarried or same-sex partner or child {if under 18 years of age}) if they are on a postgraduate level course (RQF 7 and above) sponsored by a HEI which lasts at least nine months. Dependants of Tier 4 visas are allowed to undertake work, including self-employment. EEA students currently benefit from freedom of movement and therefore no restrictions are placed on bringing dependants. Under FBIS, EEA students will be subject to the same restrictions as non-EEA students.
135. As there is currently limited data on the volume of dependants that EEA students have, the analysis uses Survey of Graduating International Students (SOGIS) 2017 data on dependants of EU students to estimate this[footnote 77]. The data highlights that around 97 per cent of EU students who responded to the survey did not have children, whilst the remaining students had between one and three children. SOGIS (2017) data also provides information on the marital status of final year students, which is used as a proxy for the marital status of student inflows. The analysis assumes that all students who are married or in a civil partnership will bring a dependant with them. The EEA skilled workers analysis assumes that all those who are coming to the UK to accompany EEA migrants are dependants of workers, and therefore the number of dependants of EEA students may be double counted.
136. The SOGIS data only gives an indication of how many children EU students have, not necessarily how many they bring to the UK. Some EU students who live in relatively close proximity to their home country may choose to leave some children at home if they can visit them during holidays. As a result, this approach may overestimate the number of dependants. As this proportion is extremely small (around 3%), it is unlikely to have a material impact.
137. As there is limited evidence on the activity of adult dependants to EEA student migrants in HE, the analysis estimates the total number of working dependants using APS 2016-18 data on the stock of EEA nationals who say their main reason for migrating was to ‘accompany or join someone’ and arrived in 2012 or later - this implies that 57 per cent of adult EEA dependants are active in the labour market.
138. This analysis also assumes that adult working dependants of student migrants have the same salaries as dependants of international workers. For working dependants of international students, the analysis assumes that they will earn less than main applicants. An income differential is applied which reflects the difference in weekly median earnings between working dependants and workers, based on the Labour Force Survey data[footnote 78]. This figure is then applied to the Annual Survey of Hours and Earnings (ASHE) 2019 data, which calculates the earning distribution for working dependants.
139. Due to limited data, the analysis also assumes the age of adult dependants are the same as students. The age distribution of EEA child dependants are based upon Annual Population data (APS) data between 2016-18, for those aged 18 years and under who came to the UK to ‘accompany or join’. This is assumed to be the same under the baseline and policy scenarios.
K.4. International students baseline outflows modelling
140. To estimate the total stock of international student migrants in HE, expected length of study estimates from HESA in 2017/18 are applied to the inflows of international students to HE. The expected length of study is defined as from the commencement of study (the first learning or teaching week) to the completion of the course, which normally includes time for examinations[footnote 79].
141. The analysis disaggregates this data by study level. Around 35 per cent of EU students come to study on courses in the UK which last less than a year, whilst around half of EU students come to study on courses which last between two and four years[footnote 80].
142. The analysis does not include non-continuation rates (that is, those who drop out of their courses), which may have an impact on outflows. However, the size of this impact is uncertain as there is no available data on non-continuation rates.
143. The expected length of stay is estimated to be the same under both the baseline and policy scenario.
K.5 International student policy modelling
144. To estimate the impact of FBIS on international student inflows, the analysis considers the impact of introducing the graduate visa[footnote 81] and restricting the rights to bring dependants. As outlined above, there are other restrictions that may also have an impact on student enrolments, but these have not been included in this analysis.
K.5.1 Introducing a visa fee and IHS regime
145. There is limited evidence to quantify the impact of introducing visa fees and the IHS on EU students coming to study in the UK. In the absence of that, the price elasticity of demand for the cost of HE is used as a proxy measure to show how the responsiveness of EU students to the cost of education once visa fees and the IHS has been included under the future immigration system.
146. Elasticity estimates from London Economics found that a 1 per cent increase in UK undergraduate fees would result in an aggregate reduction in enrolment by approximately 0.55 per cent, and a 0.21 per cent reduction in postgraduate enrolments[footnote 82]. When these elasticities are applied to the cost of tuition fees[footnote 83], visa fees and the (HS under FBIS relative to just the cost of tuition fees under the current arrangements[footnote 84] the deterrent impact is estimated to be around 5 per cent, depending on the level of study.
147. This is broadly intuitive as the associated costs of a Tier 4 visa are relatively small compared to the wider cost of HE (such as tuition fees), and therefore the deterrent impact would be expected to be small.
K.5.2 Restricting rights to bring dependants
148. Bespoke SOGIS 2017 data found around 2.5% of EU undergraduates had one or more child dependants, whilst 6.3 per cent of EU postgraduates had two or more child dependants. The analysis assumes that half of these would be deterred from coming to the UK, as undergraduates would not be allowed to bring dependants under the existing rules of the Tier 4 visa and postgraduates would be less likely to bring more than one dependant as Tier 4 postgraduate dependant visas are subject to monthly maintenance requirements[footnote 85]. The rationale for assuming only half would be deterred is because some EU students may choose to come and study in the UK regardless of the restriction, and they may leave their children with their families in their country of origin. As a result, the deterrence impact is estimated to be up to 5 per cent for EU students, depending on level of study[footnote 86].
K.5.3 Impact of post-study work restrictions
149. The impact of imposing restrictions on the post-study period in the UK on EU student enrolments is extremely difficult to estimate, as EU students currently benefit from freedom of movement and therefore are subject to no restrictions upon graduation. Longitudinal Education Outcomes (LEO) data provides a breakdown of student destinations after graduation and this has been used to estimate the impact of the post-study work restriction on EU students[footnote 87]. It shows that there is a significant difference between EU and non-EU students in employment one year after graduation (depending on the level of study).
Figure 2 - EU and non-EU students in employment one year after graduation, 2013/14 cohort[footnote 88]
| Level of Study | EU(%) | Non-EU(%) | Difference |
|---|---|---|---|
| Undergraduate | 30 | 10 | 20 |
| Postgraduate (taught) | 25 | 10 | 20 |
| Postgraduate (research) | 40 | 25 | 15 |
Note: Difference 1s expressed as percentage points. Figures may not sum due to rounding.
150. To estimate the potential impact of restricting the post-study work rights of EU students, the difference in work outcomes set out in Figure 2 has been used a proxy to estimate the change in student inflows that might result from the change.
151. This estimate should be treated as indicative and is highly uncertain, as it assumes that EU student employment outcomes will be the same as non-EU student employment outcomes under FBIS, which may not necessarily be the case. Furthermore, the difference may not directly equate to the reduction in EU inflows coming to study in the UK, as there are other factors which could influence a student’s decision to come to study in the UK and this can often change after graduation. The proportion of non-EU students in work one year after graduation is used as a proxy to estimate the proportion of students switching to work within the post-study work period. Whilst this approach may not accurately reflect the volume of EU and non-EU students switching to work directly after graduation, it is the best approach to take in the absence of other data sources.
K.6. University impacts
K.6.1. Tuition fee income - methodology
152. The modelling uses HESA tuition fee income data for 2017/18, disaggregated by level of study to estimate the total income[footnote 89]. This section of the analysis is disaggregated by level of study as different levels of tuition fees are charged at each level. The growth rate of the stock of international students over the forecast period is used and applied to the outturn of tuition fee income of 2017/18 to estimate the projected fee income until 2035.
153. Projected net tuition fee income is estimated to fall under FBIS, and this is primarily because of the reduction in EU student enrolments. It is expected to fall by between by around £2.2 to £3.1 billion over the first ten years of the policy. The average annual reduction in tuition fee income under FBIS would reflect around 2% of total tuition fee income, assuming it was to stay broadly the same as 2018/19 levels[footnote 90].
Figure 3 - Projected tuition fee income of universities from EU students under FBIS[footnote 91]
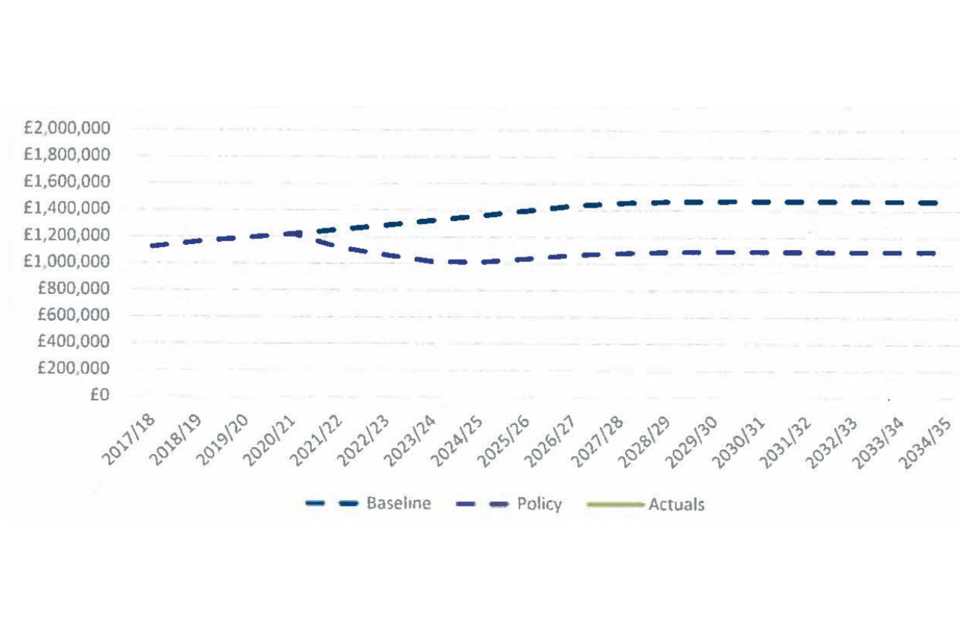
Chart comparing baseline and policy projections between 2017/18 and 2034/35. Both projections increase to around £1.2 million by 2020/21. After this point, the baseline continues to rise to around £1.45 million before stabilising, while the policy projection falls to around £1.0 million and then remains relatively stable. The difference between the two projections increases over the period.
154. This estimate does not account for any changes in tuition fees under FBIS, which may also have an effect on both EU student inflows and the projected tuition fee income of universities.
K.6.2 Workload costs - methodology
155. The analysis in this IA estimates that there will be increased use of the student immigration route under FBIS, as EU students will have to apply for a visa to come and study in the UK.
156. Universities will therefore be subject to higher workload costs as all international students will be applying for a Tier 4 visa, and this could mean that universities may be required to invest additional resource to process the additional applications. Ernst and Young (commissioned by Russel Group universities) conducted research into Russel Group (RG) universities to identify the key challenges facing them under FBIS, and to quantify the current costs of immigration sponsorship for these universities. both for staff and students.
157. Sixteen universities provided details on the staffing costs associated with running an immigration programme for students, and the information that was provided includes: a) full employer costs (with mid-point of salary bands) for each staff member involved with immigration programmes b) the full-time equivalent (FTE) of staff (with mid-point of salary bands) involved in governance activities (such as liaising with UKVI) and c) time in minutes spent performing various activities associated with each Tier 4 sponsorship application.
158. It found that that the average staffing cost associated with governance activities per Tier 4 applicant was around £55, and around £95 for activities associated with Tier 4 applications, taking the total average staffing cost to around £150 per Tier 4 applicant[footnote 92]. As CAS costs have been accounted for already this analysis, it was deducted from the total staffing cost estimate. To quantify the 1increased workload costs for universities, the total average staffing cost per Tier 4 applicant (excluding the CAS cost) is multiplied by the total number of EU students who will be expecting to come to study at a UK university under FBIS.
159. A caveat of this approach is that the average staffing unit cost (which has been calculated based on RG universities) has been applied to all EU students coming to study in the UK, regardless of which university they are attending, and this may not be accurate as non-RG universities may face different costs. However, in the absence of any other data this is the best approach to take. This section of Ernst and Young’s research only received responses from around 2/3 of all RG universities, and therefore do not fully reflect the cost of all RG universities. Finally, the costs outlined in the report are based on the current system, and therefore do not reflect how costs may change under FBIS as sponsorship requirements may be simplified, thus potentially leading to lower costs for universities.
K.7. Public administration impacts
K.7.1 Overview
160. This section sets out the impact of changes to the study route on Home Office income and expenditure. Sources of revenue come from visa fees, the IHS and the CAS. Source of Home Office expenditure are processing costs and enforcement activity; however, the latter is not quantified in this analysis. A more detailed description of these components can be found in Figure 5.
K.7.2 Fee assumptions
161. Visa fees, IHS fees and sponsor certificates are based on current published fees[footnote 93], with fees varying depending on whether the application was made in-country or out-of-country and the length of stay of the visa. HESA data 2017/18 is used to estimate the length of stay of EU domiciled students, and this is applied to the IHS fee and volume projections to generate total IHS fee income.
162. A limitation of this analysis is that estimates are based on enrolments, rather than total visa applications. However, as the grant rate for the Tier 4 (general) route is extremely high, this is likely to make a minimal difference and will be captured within the uncertainty range.
Figure 4: Public administration revenue and spend components
| Revenue | Revenue | Spend | Spend |
|---|---|---|---|
| Visa fees | Out-of-Country: £348 In-Country: £475 |
Processing costs (visa fees) | Out-of-country: £153 In-Country: £252 |
| Confirmation of Acceptance of Studies (CAS) | £21 per student | Processing costs (CAS) | £26 per student |
| Immigration Health Surcharge | £470 per year | Enforcement activity | Not quantified |
K.7.3 In-Country/Out-of-Country split
163. As the study volumes outlined in this analysis are based on total EU-domiciled enrolments, this is separated out further to better understand the number of EU students who switch between levels of study within HE, and consequently the impact on the Home Office’s income and costs.
164. The split of in-country and out-of-country study volumes are difficult to estimate for EU students due to limited data. However, LEO data has been used to infer the proportions of students who will move into ‘further study,’ and have assumed this as an ‘in-country’ estimate. This suggests around 75 per cent of EU students in postgraduate (taught) are out-of-country, whilst the remainder are in-country. For postgraduate (research), around 90 per cent are out-of-country and the remaining 10 per cent are in-country.
K.8. Fiscal impacts
K.8.1. Overview
165. A static analysis of the 2018/19 fiscal year is used to estimate tax revenue and government spending attributable to migrants of a given age, economic status and earned income. This analysis is applied to changes in future net student migration flows (by wage, age and economic activity) to estimate the order of magnitude of the impact on the public finances.
166. This analysis is not a projection of the future state of the economy; it is based on the latest data on fiscal expenditure and tax rates which captures the UK economy in its current state, adjusting for productivity growth and inflation, allowing specific impacts of changes to migration to be explored, holding all other factors constant.
167. In the literature there are a number of different approaches to calculating the effect of policy changes on fiscal balances. The central methodology used here represents a ‘marginal’ approach to measuring the impact of migration and therefore makes a distinction between spend and revenue that is unlikely to vary according to the number of individuals moving to the UK.
168. The modelling framework considers initial impacts of specific policy changes. It does not consider dynamic responses of the economy and behavioural responses of individuals and education institutions. As such, fiscal impacts from a change in migration are presented over the short-term, defined as the first ten years of the policy (2020/21 to 2030/31). The approach considers the cumulative change in student migrant volumes over this period.
169. No assumption is made for how migrants age over this period. However, as the appraisal period is over a ten-year period, and fiscal spend unit costs are estimated in five-year age groups, this is expected to have a relatively small impact.
K.8.2 Fiscal spend analysis
170. The analysis uses a top down approach to apportion total expenditure on public services at the individual level. This results in estimated unit costs for different types of public expenditure, by migrant age group and economic activity. These unit costs are then multiplied by the change in international students {and their dependants) coming to study in UK universities under FBIS.
Data
171. Data on expenditure on public services is obtained from Public Expenditure Statistical Analysis (PESA) published by HM Treasury, which provides data on public sector expenditure broken down by functions. The analysis is based on data for 2018/19[footnote 94] it has been adjusted for productivity growth and inflation and is reported in real 2020/21 prices[footnote 95].
172. Public sector expenditure in PESA is broken down into the following functions:
- General public services.
- Defence.
- Public order and safety.
- Economic affairs.
- Environment protection.
- Housing and community amenities.
- Health.
- Recreation, culture and religion.
- Education.
- Social protection.
- EU transactions.
173. Data on migrant population characteristics is obtained from the APS produced by the ONS. APS data for 2018/19 is used to derive population characteristics such as volumes of existing residents by nationality and age distribution. When using estimates of total UK population, the analysis uses ONS 2018 data[footnote 96], which is considered more accurate than the APS.
Methodology
174. There are a number of different approaches to calculating fiscal impacts. The methodology attempts to represent a ‘marginal’ approach to measuring the impact of migration and therefore makes a distinction between costs that do not vary with additional individuals moving to the UK or extending their stay, and costs that do vary when one additional individual decides to move to the UK.
Treatment of public goods
175. Goods and services that do not vary with an additional individual are known as pure public goods and are defined as ‘non-rival’ and ‘non-excludable’. This IA makes a further distinction between pure and congestible public goods or services. The classification of public goods and services as pure and congestible is uncertain and open to debate.
176. Pure public goods are non-rival and non-excludable, and the additional cost of providing such a good or service to an individual is considered to be zero. Non-rival means that the consumption of the good or service by one individual does not exhaust the opportunity for another person to consume the good or service. Non-excludable means that once the good or service is provided, it is impossible to prevent individuals from consuming it. An example of this being national defence.
177. Congestible public goods are to some extent rival in consumption, but the additional cost of providing such goods and services is unknown and expected to be smaller than average costs. This category includes for example expenditure on transport and waste management. The definition and classification used in this IA is based on Dustman & Frattini 2014[footnote 97]. This category includes for example expenditure on basic research, or on defence.
Treatment of all other public services
178. For those categories of expenditure where costs would change when one additional individual arrives or stays in the country, with costs shared equally across the population, public expenditure is apportioned to the total UK population to derive a unit cost estimate using ONS 2018 population estimates.
Treatment of public services: Health, Education and Social Services
179. In some cases, the consumption of public services is likely to vary by age, gender, family composition and other factors such as income and ethnicity. Migrants and the native population may therefore have different characteristics in relation to the consumption of public services.
180. Unit costs are calculated by apportioning PESA 2018/19 spend on education, health and social services by the proportion of each age group made up by non-EEA nationals. This uses APS 2018/19 data to identify the migrant population by migrant status such as worker, student or dependant.
181. For health estimates, unit costs are calculated based on OBR data[footnote 98] on the proportion of total health spend by age group, and this is weighted by the proportion of EU students in each age group. This is then applied to the PESA 2018/19 data. Unit costs for and pre-primary and primary education, and social services are calculated by apportioning the 2018/19 spend to EEA and non-EEA nationals in each age category. A unit cost is estimated by migrant status, which seeks to reflect the characteristics of the different segments of the population. The modelling assumes that international students and their dependants are ineligible for welfare payments whilst in the UK.
182. For tertiary spend, this is based on the average loan paid per EU full-time student based on Student Loans Company data[footnote 99]. The Resource and Accounting Budget (RAB) charge is also applied to estimate the cost to the government of borrowing to support the student finance system[footnote 100]. The student loan take-up rate is then applied to estimate the number of students who take up the loan[footnote 101]. Each EU student is also assumed to be provided with a teaching grant[footnote 102].
K.8.3 Fiscal revenue analysis
183. The analysis uses a bottom-up approach to calculate the expected contribution to direct and indirect taxes from migrants, based on individuals’ characteristics, and data on their earnings and spending patterns. The results are then applied to the volume of EU students who are expected to come and study In the UK under FBIS.
Data
184. The analysis considers information on indirect taxes as a proportion of disposable income by nationality in the Living Cost and Food survey (data between 2015/16 and 2017/18[footnote 103]) and information on council tax in ONS data on the effects of taxes and benefits on household income[footnote 104] 2018/19. Some revenue streams (Corporation tax, business rates and other taxes) are based upon the OBR’s Economic and Fiscal Outlook[footnote 105] and then apportioned based upon modelled migrant contributions to indirect taxes. Direct taxation contributions are based upon current tax rates being applied to the income distribution of working dependents of international students; students are assumed not to pay any income tax.
185. The Student Income and Expenditure Survey[footnote 106] is used to estimate the total disposable income of part-time and full-time students, and this is weighted by HESA 2018-19 domicile data[footnote 107] to provide a unitary estimate of student expenditure data by domicile, which the indirect tax percentages are applied to.
Methodology
186. The analysis considers the fiscal contribution of a migrant through direct and indirect taxation. For direct taxation, the analysis applies income tax and National Insurance Contribution rates from 2020/21 to the estimated taxable income of the working dependants of international students.
187. Council tax is allocated depending on earning deciles, based on the ONS estimates of council tax paid per household in each income decile. However, full-time students are not required to pay council tax[footnote 108], but if they share accommodation with an employed individual (such as a dependant) or a part-time student, the household is liable to only pay 75 per cent of the council tax bill. Therefore a 25 per cent discount to council tax is applied to working dependants in this analysis.
188. Indirect taxes include VAT, duties on specific products such as alcohol and tobacco, licences such as television and intermediate taxes. Indirect tax contributions will depend upon tastes, preferences and characteristics. The lack of robust data on the expenditure of migrants results in uncertainty about their spending patterns. Therefore, for indirect tax contributions the analysis applies a similar approach as taken for council tax. Indirect tax contribution estimates from the LCF survey are used to calculate the proportion of income spent on indirect tax for each earning decile, and these are applied to EU students to estimate total indirect tax revenue.
189. Profits and the capital stock change with the size of the workforce. In a marginal approach the assumption is made that any changes in migration will have an impact of company taxes and business rates. This assumes that contributions to company tax and business rates are ultimately driven by consumption in the same way as indirect taxes, and the per capita allocation is based on an individual’s contribution to indirect taxes.
190. The estimates of the fiscal contribution of migrants only include the direct and indirect tax contributions from student migrants and their dependants themselves, and this analysis does not account for any impact that migrants have on the fiscal contribution of the resident population.
Impact Assessment Checklist
| Mandatory specific impact test - Statutory Equalities Duties | Complete |
|---|---|
| Statutory Equalities Duties The public sector equality duty requires public bodies to have due regard to the need to eliminate discrimination, advance equality of opportunity, and foster good relations in the course of developing policies and delivering services. [Equality Duty Toolkit) A Policy Equality Statement (PES) was completed on 16 January 2020 which set out the consideration given to the PSED regarding policy formulation of the future Student immigration route from January 2021 and detailed in the package of submissions sent up to Ministers by Student Migration Policy on 16 January 2020. |
Yes |
The impact assessment checklist provides a comprehensive list of specific impact tests and policy considerations (as of February 2019). Where an element of the checklist is relevant to the policy, the appropriate advice or guidance should be followed. Where an element of the checklist is not applied, consider whether the reasons for this decision should be recorded as part of the Impact Assessment and reference the relevant page number or annex in the checklist below. Any test not applied can be deleted except the Equality Statement, where the policy lead must provide a paragraph of summary information on this.
The checklist should be used in addition to HM Treasury’s Green Book guidance on appraisal and evaluation in central government (Green Book, 2018).
The Home Office requires the Specific Impact Test on the Equality Statement to have a summary paragraph, stating the main points. You cannot delete this and it MUST be completed.
Economic Impact Tests
| Does your policy option/proposal consider…? | Yes/No (page) |
|---|---|
| Business Impact Target The Small Business, Enterprise and Employment Act 2015 (s. 21-23) creates a requirement to assess the economic impacts of qualifying regulatory provisions on the activities of business and civil society organisations. [Better Regulation Framework Manual] or [Check with the Home Office Better Regulation Unit] | Yes |
| Small and Micro-business Assessment (SaMBA) The SaMBA is a Better Regulation requirement intended to ensure that all new regulatory proposals are designed and implemented so as to mitigate disproportionate burdens. The SaMBA must be applied to all domestic measures that regulate business and civil society organisations, unless they qualify for the fast track. [Better Regulation Framework Manual] or [Check with the Home Office Better Regulation Unit] | Yes |
Social Impact Tests
| Does your policy option/proposal consider…? | Yes/No (page) |
|---|---|
| Justice Impact Test The justice impact test is a mandatory specific impact test, as part of the impact assessment process that considers the impact of government policy and legislative proposals on the justice system. [Justice Impact Test Guidance] | No |
Environmental Impact Tests
| Does your policy option/proposal consider…? | Yes/No (page) |
|---|---|
| Environmental Impacts The purpose of the environmental impact guidance is to provide guidance and supporting material to enable departments to understand and quantify, where possible in monetary terms, the wider environmental consequences of their proposals. [Environmental Impact Assessment Guidance] | No |
-
https://assets.publishing.service.gov.uk/government/uploads/system/uploads/attachment_data/file/739089/impact_intl_students_report_published_v1.1.pdf. ↩
-
International Education Strategy: global potential, global growth - GOV.UK. ↩
-
The UK’s points-based immigration system: policy statement (accessible version) - GOV.UK. ↩
-
Migration Advisory Committee (MAC) report: international students - GOV.UK. ↩
-
Migration Advisory Committee (MAC) report: EEA migration - GOV.UK. ↩
-
The UK’s points-based immigration system: policy statement (accessible version) - GOV.UK. ↩
-
This is rounded to the nearest 5 per cent. ↩
-
EU domiciled students include Irish students. However, they will not be subjected to immigration restrictions under FBIS. Of the individual domicile data that is available on HESA, it indicates that Irish students only account for a small proportion of EU students (around 5%) so it is unlikely to significantly impact the overall results. ↩
-
Higher Education Statistics Agency (HESA) 2018/19 ‘Where students come from and go to study” Figure 8. Figures may not sum to rounding and are rounded to the nearest 10,000. Higher Education Student Statistics: UK, 2018/19 - Where students come from and go to study. ↩
-
This survey is based on the responsiveness of 28,000 prospective international students, and the percentages are based on the limes each item was ranked the most important when ranking the five most important factors. ↩
-
Page 9, https://www.aoc.co.uk/sites/default/files/AoC%20international%20Survey%20Report%202018_1.pdf. ↩
-
Total tuition fee income from EU students in 2017/18 was £1.1bn, and there were 134,835 EU-domiciled students in the same year, thus yielding an average tuition fee income estimate of around £8,000 for EU students. For non-EU students, total tuition fee income in 2017/18 was £5.2bn, with 307,540 non-EU domiciled students studying in Higher Education. This provides an average tuition fee income estimate of £16,000 for non-EU students. ↩
-
The-determinants-of-international-demand-for-UK-HE-FULL-REPORT.pdf. ↩
-
Home Office “Tier 4 of the Points-Based System - Policy Guidance” Page 65, ↩
-
This is based on the latest cohort, which is 2012/2013 and the largest impact has been rounded to the nearest 5 per cent. ↩
-
This is rounded to the nearest 5 per cent. ↩
-
Survey of Graduating International Students (SoGIS) by Economic and Social Research Council Centre for Population Change, Office for National Statistics and Universities UK. ↩
-
Higher Education Statistics Agency (HESA) 2018/19 Where do HE students come from?. ↩
-
This is rounded to the nearest 5 per cent. ↩
-
Survey of Graduating International Students (SoGIS) by Economic and Social Research Council Centre for Population Change, Office for National Statistics and Universities UK. ↩
-
This is rounded to the nearest 5,000. ↩
-
EU and non-EU students volumes are based on domicile. ↩
-
This is rounded to the nearest 5,000. ↩
-
Migration Advisory Committee September 2018 “Impact of international students in the UK” pg 25, https://assets.publishing.service.gov.uk/government/uploads/system/uploadslattachment_data/file/739089/impact_intl_students_report_published_v1.1.pdf. ↩
-
This estimate is only based on nationals from EU27 countries. Association of Colleges 2018 “International Activity in Colleges· pg. 11 https://www.aoc.co.uk/sites/default/files/AoC%20international%20Survey%20Report%202018_1.pdf. ↩
-
Independent Schools Council 2019 “ISC census and annual report 2019” pg. 2 isc_census_2019_report.pdf. ↩
-
These volumes do not include those in state-funded schools as the data regarding international child students and state-funded schools is limited. State funded schools are not allowed to acquire a Tier 4 licence as they are funded by the public. However, EEA child students will be allowed to access state education without breaching the terms of their visa if they come to the UK as a dependant of someone who comes through the visa route. isc_census_2020_final.pdf. ↩
-
Free Speed Reading Test: How fast do you read?. This analysis assumes that staff working at universities are good readers and are therefore able to read 400 words per minute. ↩
-
These occupations are ‘2319 Teaching and Other Educational Professionals’, ‘2419 Legal professionals’ and ‘4138 Human Resources Administrative Occupations’. ↩
-
Earnings and hours worked, occupation by four-digit SOC: ASHE Table 14 - Office for National Statistics. ↩
-
https://appsso.eurostat.ec.europa.eu/nui/submitViewTableAction.do. ↩
-
The ASHE data is inflated to 2020 prices. ↩
-
This is based on the HESA data which provides information on the number of universities with EU and non-EU domiciled students. ↩
-
Estimates below £10,000 are rounded to the nearest £1,000, whilst figures above £10,000 are rounded to the nearest £5,000. ↩
-
https://assets.publishing.service.gov.uk/government/uploads/system/uploads/attachment_data/file/890921/2020-06-09 Tier_4_Register_of_Sponsors.pdf. ↩
-
This does not apply to Irish citizens or EU citizens with EUSS status. ↩
-
This has been rounded to the nearest £5m. ↩
-
Table 5, https://russellgroup.ac.uk/media/5750/challenges-and-costs-of-the-uk-immigration-system-for-russell-group-universities.pdf. This includes the removal of the cost of the CAS as it has been included separately in the ‘Other impacts· section. It is inflated to 2020 prices. ↩
-
Total tuition fees and education contracts income in 2018/19 were just under £20 billion. What is the income of HE providers?. ↩
-
Page 17, isc_census_2020_final.pdf. ↩
-
This is based on day fees assuming there are three academic terms. The cost of boarding school fees per term range from between £4,980 for day fees and £11,763 for boarding school fees. This analysis assumes there are 3 academic terms. isc_census_2020_final.pdf. ↩
-
Home Office June 2020 “Register of Licenced Sponsors: Students· https://assets.publishing.service.gov.uk/government/uploads/system/uploads/attachment_data/file/865870/2020-02-14 Tier_4_Register_of_Sponsors.pdf. ↩
-
This was based on matching exercise between HESA data and the Tier 4 registered list of sponsors. ↩
-
9th June iteration was used. Rounded to the nearest 10, https://assets.publishing.service.gov.uk/government/uploads/system/uploads/attachment_data/file/865870/2020-02-14 Tier_4_Register_of_Sponsors.pdf. ↩
-
https://www.aoc.co.uk/about-colleges/research-and-stats/key-further-education-statistics. ↩
-
Rounded to the nearest 10. ↩
-
Page 25, According to the ISC census in 2019- isc_census_2019_report.pdf. ↩
-
The lower bound assumption is based on the difference between the number of schools that responded to the census and those that have a Tier 4 licence, whilst the upper bound is double the volume of independent schools that responded to the survey minus those that currently hold a licence. ↩
-
This assumes the cost of the CAS is £21 per student. ↩
-
This applies the cost of the CAS to the number of EU students outlined in the ISC census. ↩
-
Rounded to the nearest £0.1bn. ↩
-
Rounded to the nearest £0.1bn. ↩
-
Sponsorship: guidance for employers and educators - GOV.UK. ↩
-
Page 2, https://assets.publishing.service.gov.uk/government/uploads/system/uploads/attachment_data/file/827900/RPC_case_histories_-_Small_and_Micro_Business_Assessment_SaMBA_August_2019.pdf. ↩
-
Table 1 - HE staff by HE provider and activity standard occupational classification. Who’s working in HE?. ↩
-
Page 28, The Further Education Workforce Data for England (2014) https://www.et-foundation co.uk/wp-content/uploads/2014/09/SIR-Report.pdf. ↩
-
Tab ‘CAS_3’, https://assets.publishing.service.gov.uk/government/uploads/system/uploads/attachment_data/file/868068/sponsorship-summary-dec-2019-tables.xlsxl. ↩
-
https://www.gs.com/how-intemational-students-are-responding-to-covid-19/. ↩
-
Rounded to the nearest 5,000. ↩
-
These are rounded to the nearest 5 per cent. ↩
-
Migration Advisory Committee, Impact of International Students in the UK. September 2018. Migration Advisory Committee (MAC) report: international students - GOV.UK. ↩
-
Page 9, Student Marketing Services: UCAS. ↩
-
Page 74, https://assets.publishing.service.gov.uk/government/uploads/system/uploads/attachment_data/file/739089/impact_intl_students_report_published_v1.1.pdf. ↩
-
Gene et al., (2011). ‘The Impact of Immigration on International Trade: A Meta-Analysis’. ↩
-
Gould, (1994) ‘Immigrant Links to the Home Country: Empirical Implications for U.S. Bilateral Trade Flows’. ↩
-
EU students include Irish students, but they will not be subjected to immigration restrictions under the future immigration system. Of the individual domicile data that is available on HESA, it indicates that Irish students only account for a small proportion of EU students (around 5%). ↩
-
Home Office analysis of Higher Education Statistics Agency (HESA) data. ↩
-
The coefficient of variation is measured as the ratio of the standard deviation to the mean and is used to calculate the dispersion of a distribution. ↩
-
These are PhD level courses and are rounded to the nearest 5 per cent. ↩
-
These are masters level courses and are rounded to the nearest 5 per cent. ↩
-
This is rounded to the nearest 5%. ↩
-
Survey of Graduating International Students (SoGIS) by Economic and Social Research Council Centre for Population Change, Office for National Statistics and Universities UK. ↩
-
For non-EEA worker dependants, the difference in income for dependants and main workers uses the Labour Force Survey (LFS) for 2019. For EEA worker dependants, it uses LFS April - June 2018. ↩
-
Estimates here are rounded to the nearest 5 per cent. ↩
-
This increases the post-study work period for non-EU students but is a restriction on post-study work for EU students. ↩
-
https://www.hepi.ac.uk/wp-content/uploads/2017/01/The-determinants-of-international-demand-for-UK-HE-FULL-REP0RT.pdf. ↩
-
Based on 2017/18 levels. ↩
-
Based on 2020 prices. ↩
-
Survey of Graduating International Students (SoGIS) by Economic and Social Research Council Centre for Population Change, Office for National Statistics and Universities UK. This is rounded to the nearest 5 per cent. ↩
-
Graduate Outcomes (LEO): international outcomes 2006 to 2016 - GOV.UK. ↩
-
Based on Longitudinal Educational Outcomes data, 2013/14 graduating cohort. Figures are rounded to the nearest 5 per cent. This is also based on the matched percentage. ↩
-
This IA assumes that there are no changes to tuition fees for EU students, either through policy decisions or inflation. ↩
-
Total tuition fees and education contracts income in 2018/19 were just under £20 billion. What is the income of HE providers?. ↩
-
Bespoke analysis of Higher Education Statistics Agency (HESA) data. ↩
-
Table 5, https://russellgroup.ac.uk/media/5750/challenges-and-costs-of-the-uk-immigration-system-for-russell-group-universities.pdf. ↩
-
GDP deflators at market prices, and money GDP March 2020 (Budget) - GOV.UK. ↩
-
Population and migration - Office for National Statistics. ↩
-
http://budgetresponsibility.org.uk/fsr/fiscal-sustainability-analytical-papers-july-2016/. ↩
-
Table 3B(i). Student Loans Company. ↩
-
https://assets.publishing.service.gov.uk/government/uploads/system/uploads/attachment_data/file/811997/Student_loan_forecasts_2018-19 - text.pdf. ↩
-
Table 3B(ii)., Student Loans Company. ↩
-
Household expenditure and disposable income by disposable income decile group, by origin of household reference person, UK, financial year ending 2016 to financial year ending 2018 - Office for National Statistics. ↩
-
The effects of taxes and benefits on household income, disposable income estimate - Office for National Statistics. ↩
-
Economic and fiscal outlook - March 2020 - Office for Budget Responsibility. ↩
-
Student income and expenditure survey 2014 to 2015 - GOV.UK. ↩
-
How Council Tax works: Discounts for full-time students - GOV.UK. ↩