Autumn 2025 Immigration Rules: impact assessment (accessible version)
Updated 11 November 2025

© Crown copyright 2025
This publication is licensed under the terms of the Open Government Licence v3.0 except where otherwise stated. To view this licence, visit nationalarchives.gov.uk/doc/open-government-licence/version/3 or write to the Information Policy Team, The National Archives, Kew, London TW9 4DU, or email: psi@nationalarchives.gov.uk.
Where we have identified any third party copyright information you will need to obtain permission from the copyright holders concerned.
This publication is available at https://www.gov.uk/government/publications/statement-of-changes-to-the-immigration-rules-hc-1333-14-october-2025/autumn-2025-immigration-rules-impact-assessment-accessible-version
Title: Autumn 2025 Immigration Rules Impact Assessment (Graduate, Global Talent, High Potential Individual, English Language Requirements and Immigration Skills Charge) – October 2025
Type of measure: Secondary legislation
Department or agency: Home Office
IA number: HO IA 1018
Type of Impact Assessment: Final
RPC reference number: N/A
Contact for enquiries: Migration and Citizenship Policy, Home Office
Date: 14/10/2025
1. Summary of proposal
1. Changes are being made to implement some of the reforms set out in the white paper, “Restoring control over the immigration system”, published on 12 May 2025[footnote 1].
2. These changes will:
- Graduate route: Reduce the Graduate route duration from 2 years to 18 months (while retaining 3 years for PhD graduates) for new entrants to the route from January 2027.
- Immigration Skills Charge (ISC): Increase ISC by 32 per cent in line with inflation since its introduction in 2017.
- English Language Requirement (ELR): Increase language requirements for Skilled Workers and workers where a language requirement already applies from B1 to B2, in accordance with the Common European Framework for Reference for Languages (CEFR).
- High Potential Individual (HPI) Route: expand the HPI route by doubling the list of eligible institutions, subject to any exclusions the Secretary of state for the Home Department (Home Secretary) considers appropriate (for example where inclusion of an institution would undermine UK national security or foreign policy) and placing a cap on the route of 8,000 applications per yea
- Global Talent route: target a doubling of the number on the Global Talent route, starting with several policy measures. Initial measures include expanding the number of prestigious prizes that allow applicants to automatically qualify for the visa and expanding the National Academies fellowship fast-track pathway, which allows access to a more efficient application process, to include those with a qualifying institutional fellowship. Growth of the Global Talent route will be further supported by wider government efforts to promote and market the route, for example through the establishment of the UK Government’s Global Talent Taskforce (GTT), which has a mandate to promote the variety of targeted immigration routes for the highly skilled and establish a strong pipeline of highly talented individuals who are considering continuing their careers in the UK. Further, steps will be taken working with endorsing bodies to simplify the visa process.
- Innovator Founder route: make changes that allow entrepreneurial talent currently studying at UK universities to move into the visa, so that they can build their business and career in the UK. As the changes to the Innovator Founder route are expected to be small, no further analysis is undertaken in this IA.
2. Strategic case for proposed regulation
3. Levels of net migration were approximately 200,000 per year throughout most of the 2010s and have risen from 224,000 in the year to June 2019 to a record high of 906,000 in the year ending June 2023 - a four-fold increase in the space of under four years. While levels of net migration have come down to 431,000 in the latest year ending December 2024, it remains significantly above historic levels of net migration.
Figure 1: Long-term international migration, 1964 to YE December 2024
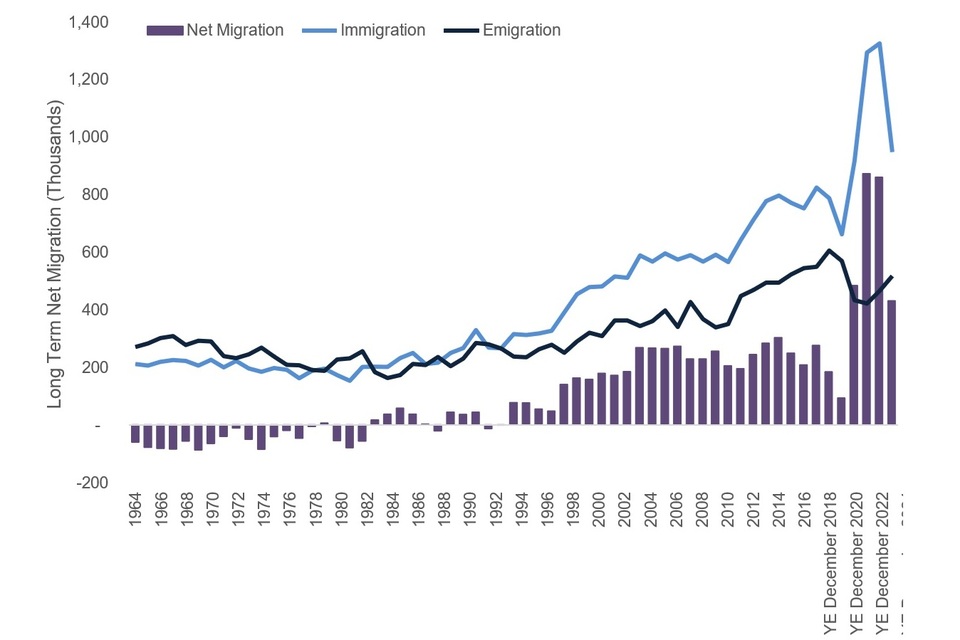
Line chart showing long-term UK immigration, emigration and net migration from 1964 to 2024. Immigration and net migration rise substantially after the late 1990s, reaching record highs in the early 2020s. Net migration peaks at around 900,000 in the year ending June 2023 before falling to around 431,000 in the year ending December 2024.
Source: ONS Long-term international migration, provisional: year ending December 2024
4. This increase in net migration has been driven in part by a big increase in overseas recruitment, particularly in lower skilled occupations. In 2022 on the Skilled Worker (excluding Health and Care) route, only 16,200 visas were issued to people taking up lower skilled jobs. By 2023, this had increased to 27,900 following increases in people coming to work in food preparation and hospitality occupations.[footnote 2]
5. However, this increase has also been driven by a rapid increase in sponsored study visas at lower-ranked education institutions, driven by a rapid increase in international students applying for master’s degrees in the UK. Internal Home Office data suggests that UK visas for universities globally ranked between 601 and 1,200 increased by 49 per cent between 2021 and 2023; whilst visas for top 100 universities fell by 7 per cent over the same period.
6. At the same time the stay rate of migrants – that is the proportion who choose to, and have legally been able to, remain in the UK over the long-term – has also increased. In particular, following the opening of the Graduate route in 2020, more graduate students have been staying in the UK longer-term. Overall, 62 per cent of students who arrived in year ending December 2019 emigrated in the four years after arrival, compared with 47 per cent of those who arrived in 2020.[footnote 3]
7. Of the increasing proportion of students that remain in the UK on the Graduate route under a third (30 per cent) are working in occupations that can confidently be assessed to be Regulated Qualifications Framework Level 6 (RQF 6) and above.[footnote 4] The economic and fiscal contribution to the UK made by those in graduate level jobs is substantially higher than the number in low paid work.
8. Against this context, the strategic objectives for the measures in this Impact Assessment are to:
- Ensure net migration comes down so the system is properly managed and controlled. This will be achieved by making clear and informed choices about who comes to the UK and how long they are allowed to stay for.
- Promote growth. Ensuring more efficient access to the UK for individuals who promote growth. Including as entrepreneurs, through the Innovator Founder route, and leaders and future leaders in key fields, through routes including Global Talent and the HPI.
- Better link the immigration system to skills and training requirements in the UK so that no industry is allowed to rely solely on immigration to fill its skills shortages
- Ensure that those who wish to build their lives in the UK are able to speak and understand English so they can integrate into life in this country.
9. The changes to the Graduate route are being made to both ensure the level of net migration comes down and ensure that those who stay in the UK long-term are more likely to be contributing to economic growth by being on a sponsored work route at RQF 6+ sooner.
10. The changes to the Global Talent and HPI routes are being made to promote growth by targeting those working in highly skilled jobs, or with the potential to do so, and generate wider productivity spillovers. These changes attract more of, and make it simpler for, these sought after individuals to come to the UK.
11. Because the ISC has not kept pace with inflation, its effect has decreased in real terms over time. With the focus on linking skills, migration and labour market policies together, set out in the Immigration White Paper[footnote 5], the ISC plays an important role. The change is being made to support skills funding for priority sectors and reduce reliance on migration over the medium term.
12. 1. Finally, the changes to ELR are being made to ensure those coming to the UK are able communicate. This is essential to perform civic duties, and for all social connections including, crucially, with the communities in which they live and with state and other agencies such as local authorities and non-government services. Office for National Statistics’ Longitudinal Study, which looks across generations of migrants to the UK, shows that people with better English language skills were more likely to have worked at any time, be economically active or in full-time employment.[footnote 6]
13. Whilst the analysis in this IA presents a negative NPSV – associated with relatively uncertain quantifiable behavioural effects – this must be read in the context of the potentially significant unquantifiable benefits, including the second order effects which drive the rationale for changes. These are set out in more detail in the Evidence Base section.
14. Further detail on the assessed impact of these changes in meeting these strategic objectives are set out in the Evidence Base section.
3. SMART objectives for intervention
15. As set out above, the strategic objectives set out in the white paper for these changes are to:
- Ensure net migration comes down so the system is properly managed and controlled. This will be achieved by making clear and informed choices about who comes to the UK and how long they are allowed to stay for.
- Promote growth. Ensuring more efficient access to the UK for individuals who promote growth. Including as entrepreneurs, through the Innovator Founder route, and leaders and future leaders in key fields, through routes including Global Talent and the HPI.
- Better link the immigration system to skills and training requirements here in the UK so that no industry is allowed to rely solely on immigration to fill its skills shortages
- Ensure that those who wish to build their lives in the UK are able to speak and understand English so they can integrate into life in this country.
16. The first objective will be measurable using the bi-annual ONS publication on Long Term International Migration, the latest of which is currently available for the year ending December 2024.[footnote 7]
17. No specific target has been set for this reduction, however this set of policies will need to be considered alongside the wider package of measures in the white paper, some of which have already been implemented and many of which will contribute to this objective of reducing net migration.
18. It is more difficult to measure the success of this package of measures against the remaining objectives given the longer time horizon necessary for these benefits to be realised, and the breadth of these objectives across the economy.
19. However, ongoing monitoring and evaluation by the Home Office as set out in Section 8 below will include an assessment on the extent to which these changes are meeting these objectives. While not easy to isolate the impact of this specific set of policies, this will be supplemented by wider data gathered by the government and external stakeholders, including on the state of the economy and on the level of skills investment.
4. Description of proposed intervention options and explanation of the logical change process whereby this achieves SMART objectives
20. As set out in Section 1: the proposed policy interventions are to:
- Graduate Route: Reduce the Graduate route duration from 2 years to 18 months (while retaining 3 years for PhD graduates) for new entrants to the route from January 2027;
- ISC: Increase ISC by 32 per cent in line with inflation since its introduction in 2017;
- ELR: increase language requirements for new applicants in the Skilled Worker, HPI and Scale Up routes from B1 to B2 level.
- HPI Route: expand the HPI route by doubling the list of eligible institutions, subject to any exclusions the Secretary of State considers appropriate (for example where inclusion of an institution would undermine UK national security or foreign policy) and placing a cap on the route of 8,000 applications per year.
- Global Talent Route: Target a doubling of the number on the Global Talent route, starting with several policy measures. Initial measures towards this ambition include expanding the number of prestigious prizes that allow applicants to automatically qualify for the visa, and expanding the National Academies fellowship fast-track pathway, which allows access to a more streamlined application process, to include those with a qualifying institutional fellowship.
- Innovator Founder: make changes that allow entrepreneurial talent currently studying at UK universities to move into the visa, so that they can build their business and career in the UK.
21. The logical change process whereby these interventions will achieve the SMART objectives above are set out in Section 2 on the strategic case for intervention in paragraphs 9 to 12.
5. Summary of long-list and alternatives
22. The government published the Immigration White Paper “Restoring Control over the Immigration System” in May 2025.[footnote 8] This paper set out the direction of travel for the government and was explicit that the measures set out in this IA would be delivered.
23. While significant analysis was undertaken to support the development of the white paper, including consideration of other options, there was no formal long-list appraisal process undertaken as part of this IA following the publication of the white paper.
6. Description of shortlisted policy options carried forward
24. Two options have been considered
Option 0 – ‘Do nothing’
25. In the ‘do nothing’ option, the current rules would remain in place.
Option 1 - Implement the policies announced in the Immigration White Paper
26. Under Option 1, the policy changes set out in Section 4 would be enacted. Option 1 is the government’s preferred option as it best meets the government’s objectives to:
- Ensure net migration comes down
- Promote growth.
- Better link the immigration system to skills and training requirements
- Ensure that those who wish to build their lives in the UK are able to speak and understand English
7. Regulatory scorecard for preferred option
Part A: Overall and stakeholder impacts
(1) Overall impacts on total welfare
Description of overall expected impact
Note more detailed discussion of quantified impacts and the methods, data and assumptions underpinning them is included in the Evidence Base section.
The monetised impacts quantified in the appraisal below include the public sector and fiscal impacts associated with the modelled reduction in migration flows. Overall, this represents a NPSV of -£1.2 billion in the central scenario over the appraisal period.
However, the wider rationale for these changes, alongside the reduction in net migration is to promote growth. The ambition is to encourage growth by:
- Directly increasing the volume of highly skilled migrants who are most likely to generate additional productivity spillovers.
- Incentivising the upskilling of the domestic workforce by reducing the volume of lower skilled migrants remaining on the Graduate route.
- Promote integration by ensuring those working in the UK speak a higher standard of English.
If these changes together have an impact on overall productivity this effect is very important and likely to outweigh many or most other impacts.
Within this context, whilst the quantified elements in this IA reflect a negative NPSV, it is plausible that this is outweighed by productivity gains in the longer term due to broader incentives created by these measures.
Directional rating
Uncertain
Based on all impacts (incl. non-monetised)
Monetised impacts
As set out above, the monetised impacts represent a NPSV of -£1.2 billion over the appraisal period.
This impact broadly comprises one direct and two indirect impacts resulting from the reduction in inflows because of these changes. Specifically:
- The indirect reduction in tuition fee revenue attributable to Higher Education Institutions
- The direct changes in public sector revenue (Fees, Immigration Health Surcharge (IHS), ISC)
- The indirect changes in estimated income tax and public service pressures
In the central scenario, the net impact is primarily driven by reductions in tuition fee revenue, equivalent to -£1.1 billion over the appraisal period. The overall estimated impact on income tax and public service pressures net out to be marginally positive.
Impact assessments are intended to measure the impact on public welfare and are not an official government macroeconomic/fiscal forecast. The fiscal analysis in this IA also does not reflect the methodology used by the OBR, the government’s official economic and fiscal forecaster, to assess the impact of migration on the overall fiscal position of the UK.
Directional rating
Negative
Based on likely £NPSV
Non-monetised impacts
Significant non-monetised impacts are considered in detail in the Evidence Base section.
Many of these non-monetised impacts might be expected to occur during or beyond the appraisal period, including:
- The likelihood of displacement effects and incentives for training and investment resulting in UK nationals filling vacancies.
- The benefits of any productivity spillovers or integration factors and their contribution to GDP and GDP per capita.
- The dynamic fiscal consequences of changes in migrant stock in the long term.
It is uncertain the extent to which these will offset the overall negative quantified NPSV, though it is more likely that any benefits will accrue beyond the appraisal period, while any negative quantified behavioural impacts may reduce over time as people and businesses adapt to the changes.
Directional rating
Positive
Any significant or adverse distributional impacts?
These changes are not expected to have a disproportionate impact on small to medium businesses, specific households or on specific nations and regions of the UK.
Directional rating
Neutral
(2) Expected impacts on businesses
Description of overall business impact
These changes are likely to result in both a direct and indirect cost to business which is unlikely to be offset by any significant non-monetised impacts.
The increase to the ISC will represent an additional direct cost to business for those that choose to continue to sponsor migrants on the work route. For those businesses that choose not to continue to sponsor migrants, there will be additional non-monetised costs of adjustment set out in the non-monetised impacts section.
The behavioural response to the Graduate route changes is likely to represent an indirect cost to Higher Education Institutions as any students who are deterred from coming to the UK will represent a reduction in tuition fee revenue. This impact is particularly uncertain, and it is uncertain how business will be able to adapt their recruitment practices to attract students to replace any forgone students.
The changes to the Global Talent and HPI routes are also designed to increase the inflow of high-skilled migrants who have a positive, and larger, impact on productivity than lower skilled migrants. These changes are therefore likely to have a positive non-monetised impact on business.
Directional rating
Negative
Monetised impacts
The Business NPV from the impacts set out above is estimated at -£1.8 billion over the appraisal period.
The direct costs translate to a net annual financial cost to business (EANDCB) of -£0.14 billion.
Directional rating
Negative
Based on likely business £NPV
Non-monetised impacts
The labour market is dynamic and, as with any change in environment, markets are expected to adjust and reallocate resources to their most productive use – at least in sectors where output and wages are primarily influenced by market forces. How employers choose to adjust, the relative ease and length of time taken to do so will depend on the specific characteristics of an occupation and firms. These adjustments could include:
- Altering the ratio of labour to capital within the firm’s production, such as automating the production line where possible, and substituting capital for labour,
- Freezing recruitment or substituting for domestic inflows into the workforce.
- Changing production levels.
- Changing location of production or outsourcing parts of the production process.
Each of these adjustments may come with a cost to the firm, either in the form of higher wages, higher up-front investment costs or, in some cases, lower output.
While it is not possible to quantify these as the ability of an employer to respond through each of these avenues is highly firm-specific, it is likely this policy represents, at least in the short-term, an overall negative impact on business.
Directional rating
Negative
Any significant or adverse distributional impacts?
None identified
While the ability of micro, small and medium sized firms to make the type of adjustments set out above may be more limited, they are on average less reliant on the migrant workforce. Similarly, the impacts on Higher Education Institutions will affect institutions of all sizes.
It is therefore not clear that there will be significant distributional impacts between firm sizes.
Directional rating
Neutral
(3) Expected impacts on households
Description of overall household impact
In line with previous Home Office analysis and following recommendations made by the Migration Advisory Committee (MAC), this IA considers the impact of the proposals on the welfare of the UK resident population; considered to be UK nationals and migrants at the point of application for naturalisation as British Citizens.
There are no negative impacts on households identified, either monetised or non-monetised.
If these changes have an indirect impact on the labour market, through increases in training opportunities, investment and substitution of migrant labour with domestic labour, this may have a positive impact on the resident labour force. Further, any Social and Community Impacts arising from reductions in migrant inflows may have an impact on domestic households.
As such, even though the magnitude of these unquantified benefits is uncertain and likely small, the lack of any identified costs is likely to result in a positive overall impact on households.
Directional rating
Positive
Monetised impacts
No monetised household impacts have been identified.
Directional rating
Neutral
Based on likely household £NPV
Non-monetised impacts
Labour Market Displacement and Wage Impacts
As set out in the Evidence Base section, and throughout, the wider rationale for these changes is to incentivise upskilling of the domestic workforce to support growth.
While there has not been sufficient time to develop a significant body of evidence, there is some literature that further explores the link between high net migration and training. This evidence suggests employers might choose hiring overseas workers as a cost-minimising strategy, particularly where ready trained migrant workers exist, avoiding the need to hire and train the local workforce. In particular, as set out in the Evidence Base section, Manning et al explore the relationship between high levels of net migration and domestic upskilling (see paragraph 118).
If this set of policies have a positive impact on investment, particularly in training, which results in greater opportunities for the domestic workforce, particularly in the context of the rising level of youth unemployment, to find jobs this will have a positive impact on households.
Social and Community Impacts
Recent Ipsos polling (April 2025) found that 67 per cent of British people surveyed believe immigration levels are too high, with 43 per cent reporting they are ‘much too high’.[footnote 9] Respondents were also more likely to perceive that immigrants have a negative rather than a positive impact on their local community. However, Skilled Workers were viewed more positively than other migrant groups in relation to their impact on local communities, though the specific nature of these impacts was not defined. This distinction is supported by research from the Migration Observatory which found that the British public tends to differentiate between migrant types, with high skilled migrants receiving greater support, although there were some differences in views across the cohort of low skilled migrants, with more positive views towards care workers for older people for example.[footnote 10]
The MAC also reviewed evidence on social and community impacts and suggested “there is no evidence that migration has affected crime. There is no evidence that migration has reduced subjective well-being though some suggestion that this varies with attitudes to migration. Overall, there is no evidence that people are less satisfied with their neighbourhoods than in the past.” but also that “the impacts of migration on communities is hard to measure due to their subjective nature which means there is a risk they are ignored“.
It is therefore uncertain whether there will be material impacts on social and community cohesion.
Directional rating
Positive
Any significant or adverse distributional impacts?
None identified.
Directional rating
Neutral
Part B: Impacts on wider government priorities
Business environment
Does the measure impact on the ease of doing business in the UK?
There is likely to be a cost to business over this appraisal period due to the adjustment costs set out above.
It is uncertain the extent to which Higher Education Institutions are able to replace dissuaded students. However, if these policy proposals result in an increased pool of skilled labour and an increase in overall productivity, this could represent an overall net benefit to business in the long-run.
Directional rating
Uncertain
International Considerations
Does the measure support international trade and investment?
There are a number of channels through which immigration may affect trade and, in general, the external literature finds a positive relationship between the stock of migrants and trade.
However, the expected reduction in migrants in any appraisal year as a result of the preferred option is small compared to the total stock of migrants resident in the UK. Therefore, any trade impacts are be expected to be small.
Directional rating
Neutral
Natural capital and Decarbonisation
Does the measure support commitments to improve the environment and decarbonise?
No meaningful impacts have been identified.
Directional rating
Neutral
8. Monitoring and evaluation of preferred option
27. The Home Office will monitor the impact, with support as appropriate from other government departments.
28. Initial evaluations of the Skilled Worker, Graduate and HPI routes were published in May 2025, while the most recent evaluation of the Global Talent route was published in March 2024. These studies provided insights into the motivations, experiences, and activities of visa holders (and sponsors, where relevant), which was used to inform proposals for the Immigration White Paper.[footnote 11] Further evaluations of these routes are planned to assess the impact of policy changes and identify the extent of any post-implementation behavioural shifts.
29. The Home Office also publishes migration statistics quarterly by visa type, and by occupation for sponsored visas. This will help provide evidence on the impact of these changes on inflows.
30. The Home Office will also maintain open lines of communication with applicants via email and may also receive feedback as part of its normal visa issuing processes, through its public enquiry lines, and through formal correspondence with interested parties.
9. Minimising administrative and compliance costs for preferred option
31. Administrative and compliance costs as a result of these changes are expected to be negligible. While there may be some small familiarisation costs being placed on immigration advisors and lawyers, there are no identified additional compliance burdens for UK businesses or citizens as any costs associated with complying with the Immigration Rules remain unchanged beyond reducing the scope of those eligible for the routes.
10. Main assumptions / sensitivities and economic / analytical risks
32. Further detail on the analysis presented in this IA is set out in the Evidence Base section below. This sets out the methods used to estimate potential impacts of the policy option, outlines the assumptions used and the sources of assumptions, explains the limitation of analysis and where well evidenced quantification of impacts has not proved possible has discussed impacts qualitatively.
Declaration
Department:
Home Office
Contact details for enquiries:
Migration and Citizenship Policy, Home Office
Minister responsible:
Minister Tapp
I have read the Impact Assessment and I am satisfied that, given the available evidence, it represents a reasonable view of the likely costs, benefits and impact of the leading options.
Signed:
[Signature]
Date:
[Date]
Summary: Analysis and evidence
Price base year: 2025/26
PV base year: 2025/26
Costs (£m)
| 0. Business as usual (baseline) | 1. Preferred way forward (change in comparison to baseline) | |
|---|---|---|
| Low | NA – no change in relation to baseline | -£1.5 billion |
| High | NA – no change in relation to baseline | -£8.7 billion |
| Best | NA – no change in relation to baseline | -£4.5 billion |
Businesses are likely to incur additional non-quantified costs in adjusting to the reduction in migrant labour. How employers choose to adjust, the relative ease, and length of time taken to do so will depend on the specific characteristics of an occupation and firms. The quantified costs may also be reduced if Higher Education Institutions in particular are able to replace any dissuaded students with those who remain willing to come with a shorter Graduate Route.
Benefits (£m)
| 0. Business as usual (baseline) | 1. Preferred way forward (change in comparison to baseline) | |
|---|---|---|
| Low | NA – no change in relation to baseline | £2.1 billion |
| High | NA – no change in relation to baseline | £4.3 billion |
| Best | NA – no change in relation to baseline | £3.3 billion |
Second order impacts encompass how an economy reacts and adjusts to changes more widely. The wider rationale for these changes is increase the inflow of the most highly-skilled workers, to incentivise upskilling of the domestic workforce and improve integration through improved English Language to support growth.
If these changes have an impact on domestic employment or productivity this effect is very important and could outweigh quantified impacts.
Net present social value (£m)
| 0. Business as usual (baseline) | 1. Preferred way forward (change in comparison to baseline) | |
|---|---|---|
| Low | NA – no change in relation to baseline | +£0.6 billion |
| High | NA – no change in relation to baseline | -£4.4 billion |
| Best | NA – no change in relation to baseline | -£1.2 billion |
Public sector financial costs
| 0. Business as usual (baseline) | 1. Preferred way forward (change in comparison to baseline) | |
|---|---|---|
| Public sector financial costs | NA – no change in relation to baseline | Public sector financial costs are included in the NPSV as changes to visa fee, Immigration Health Surcharge (IHS) and ISC revenue. These are set out in detail in the Evidence Base section. |
Significant un-quantified benefits and costs
| 0. Business as usual (baseline) | 1. Preferred way forward (change in comparison to baseline) | |
|---|---|---|
| Significant un-quantified benefits and costs | NA – no change in relation to baseline | Significant non-monetised impacts are considered in detail in the Evidence Base section. |
Many of these non-monetised impacts might be expected to occur during or beyond the appraisal period, including:
- The likelihood of displacement effects and incentives for training and investment resulting in UK nationals filling vacancies.
- The benefits of any productivity spillovers or integration factors and their contribution to GDP and GDP per capita.
- The dynamic fiscal consequences of changes in migrant stock in the long term.
It is uncertain the extent to which these will offset the overall negative quantified NPSV, though it is more likely that any benefits will accrue beyond the appraisal period, while any negative quantified behavioural impacts may reduce over time as people and businesses adapt to the changes.
Key risks
| 0. Business as usual (baseline) | 1. Preferred way forward (change in comparison to baseline) | |
|---|---|---|
| Key risks | NA – no change in relation to baseline | Analysis presented in this IA has set out the methods used to estimate potential impacts of the policy option, outlined assumptions used and the sources of assumptions, explained limitation of analysis and where well evidenced quantification of impacts has not proved possible has discussed impacts qualitatively. |
However, there remains meaningful risk and uncertainty over the direction and magnitude of impact, particularly beyond the appraisal period.
If the changes achieve their strategic objective in promoting growth through productivity spillovers, training and upskilling and integration it is likely these outweigh the quantified costs set out in this IA.
It is also uncertain the extent to which Higher Education Institutions are able to replace international students and the extent they are able to do so will mitigate a significant amount of economic cost to business in the form of foregone tuition fee revenue.
Results of sensitivity analysis
| 0. Business as usual (baseline) | 1. Preferred way forward (change in comparison to baseline) | |
|---|---|---|
| Results of sensitivity analysis | NA – no change in relation to baseline | As many of the risks and uncertainties relate to unquantifiable, longer term, benefits it has not been possible to undertake sensitivity analysis on these. |
However, some sensitivity analysis has been undertaken particularly on the impact of varying assumptions on fiscal revenue and public service pressure and the impact if institutions are able to replace the deterred students. These are set out in the Evidence Base section.
Evidence base
Analytical Framework
1. The framework for quantifying first order effects starts by constructing a baseline which estimates potential future migrant flows in the absence of any policy intervention, against which the policy options can be assessed.
2. Policy proposals are then modelled on this baseline to estimate how migrant flows may change as a result. These results are used to assess the population impact, which forms the basis for estimating the wider economic impacts. These principles apply both to where impacts can, and cannot, be quantified. Analysis assumes compliance from both migrants and employers. As such all discussion of flows and impacts do not consider illegal or irregular activity.
3. In line with previous Home Office analysis, and following recommendations made by the MAC,[footnote 12] this IA considers the impact of the options on the welfare of the UK resident population. As the MAC acknowledges, the resident population is not simple to define. In this IA, the resident population is considered to be UK nationals, and migrants at the point of application for naturalisation as British citizens. For the purpose of this IA, applicants for entry clearance, leave to remain (LTR) or indefinite leave to remain (ILR) products are not considered as part of the resident population.
4. Given the inherent uncertainty over future immigration levels in the absence of any changes, the policy package is appraised for five years, covering the period between Q4 2025 and Q3 2030. Impacts from each component of Option 1 are assessed for the defined appraisal period, although implementation dates may differ between policies (other than those associated the Innovator Founder policy change, for which the impacts are anticipated to be relatively small due to the size of the route). For example, shortening the Graduate route to 18 months comes into force for new applicants to the route from January 2027, whereas other changes will come into force in late 2025 and early 2026.
5. The estimates presented in this IA assume that no further policy changes are implemented on impacted routes throughout the appraisal period. This should not be interpreted as an indication of future immigration policy.
6. The Net Present Social Value (NPSV) calculation includes both direct and indirect effects associated with modelled changes in migration flows and additional revenue generated through the change in the ISC. These impacts are quantified in the appraisal under the following categories:
- a. Tax income and public services pressure - these arise from changes in volumes, and the characteristics of the cohort estimated. Changes in volumes result in a change in the number of people residing in the UK, affecting tax income and public services pressure. This indirect impact falls to the public sector.
- b. Fee and Charge revenue and processing cost impacts – these arise from changes in volumes and ISC level, and the resulting change in visa applications / grants which affect the revenue and processing costs in these areas. This direct impact falls to the public sector and on domestic business for ISC charges.
- c. Tuition fee revenue – these arise from behavioural changes in student volumes and the associated change in tuition fee revenue collected by Higher Education Institutions. This indirect impact falls to domestic business.
7. Non-quantified impacts are also discussed in the Cost Benefit Analysis section but not included in the NPSV. This includes a discussion on other impacts associated with the change in flows that have not been quantified in the appraisal, including impacts on GDP, productivity, GDP per capita and on the social and cultural impacts of migration.
8. Throughout the following section, a range of assumptions are created based on the inherent uncertainty in this analysis. To reflect the relative uncertainty, these uncertainties are assumed to compound such that the “low” scenario considers, where appropriate, low assumptions on baseline volumes, low assumptions on behavioural responses and low assumptions on fiscal contributions and pressure. In turn the “high” scenario considers the high equivalent of each of the elements set out above. This deliberately generates a considerable range of both volumes and economic impacts, but it still remains plausible that the impact falls outside of this range.
Impact on Volumes
Baseline Volumes
9. This section outlines the volume of visas issued under each of the affected routes in the absence of the policy changes. Discussion of estimated volumes within policy scenarios are compared to these counterfactual baselines.
10. Unless otherwise specified, baseline volumes are based on the latest year of data available for year ending June 2025 and held constant across the appraisal period. Excluding the changes made to the Skilled Worker and Health and Care routes in July 2025 for which a different baseline is used, this represents the most recent full year of data that has not been affected by policy changes. The analysis for the ISC policy change uses a different baseline accounting for wider Immigration White Paper proposals. This is to avoid double counting and to give an improved estimate of likely impacts. More details regarding this are detailed in the relevant ISC section.
11. It is inherently uncertain the extent to which volumes would have remained at this level in future. For some changes, this uncertainty does not affect subsequent analysis. For changes to Global Talent the analysis assumes a doubling of current volumes while for HPI the newly eligible cohort is not affected by the baseline number of students. In these cases, uncertainty is captured solely in the policy scenarios chosen.
12. It is plausible that for other routes, in the absence of any policy change that baseline volumes would have been higher, or lower, than estimated here. This change in baseline volumes would have two impacts:
- (a) In the absence of any policy change, the impact of higher (lower) volumes of inflows would have been to contribute additional (lower) tax and tuition fee revenue, while consuming more (less) public services.
- (b) The impact of the policy change captured in this IA of higher (lower) volumes would have been greater, resulting in a larger (smaller) impact on these factors.
13. The Impact Assessment should be considered against the current economic context. In all cases, as the policy impact represents a proportion of the baseline, the net benefit of any increase in baseline volumes that would not be captured in this IA would outweigh the additional cost that would be captured in this IA. As a result, for the Student and Graduate changes, volumes are not varied in the main scenarios. However, to capture the additional impact in isolation if baseline volumes were 25% higher, an additional sensitivity has been constructed, set out in the sensitivity section. No lower sensitivity has been constructed as there is no behavioural response in this scenario.
14. For all routes, grant rates are subsequently applied which are set out in detail below.
Student and Graduate Route
15. The baseline volumes for main applicant students are disaggregated by course level using published Home Office data for the year ending March 2025 and are assumed to remain constant for the remainder of the appraisal period.[footnote 13] The volumes for March-June 2025 are assumed to breakdown by course in the same ratio as March-June 2024.
16. In the central case, this results in 371,000 sponsored students per year affected by the policy changes, of which 114,000 are assumed to be undergraduate, 257,000 masters and 10,000 doctoral.[footnote 14]
17. Internal Home Office analysis has been used to estimate the proportion of each cohort who would have switched onto the Graduate route in the absence of any policy changes. 41 per cent of all Students in 2024 switched onto the Graduate route. Using length of Study visa as a proxy, 12 per cent of all students switching onto the Graduate route were assumed to have been on an undergraduate course, 85 per cent on a masters course and 3 per cent on a doctoral course.
18. The analysis assumes that the dependency ratio (defined as the proportion of visas granted to dependants to main applicants) on the student route remains unchanged at year ending June 2025 levels across the appraisal period at around 5 dependants for every 100 student visas issued.
HPI Route
19. Baseline inflow volumes for the HPI route are based on the latest year of data available for year ending June 2025. This results in baseline volumes of 1,795 main applicant and 217 dependant visas issued.
20. The analysis models impacts on entry clearance visas only. No in-country switching is modelled. Eligible individuals need to have graduated from an eligible institution outside of the UK in the past five years; however, it is possible there could be an increase in switching if eligible individuals are already present in the UK on another visa product. There is no data available to inform the size of this cohort and should therefore be noted as a limitation to the analysis set out below.
Global Talent Route
21. Baseline inflows from the Global Talent route are based on the latest year of data available for year ending June 2025. This results in a baseline of 3,832 main applicant and 2,734 dependant visas issued.
22. The analysis models the impact on entry clearance visas only, as the government’s ambition is to increase the number of people arriving on high talent routes.
23. The impact of an increase in applications for the Global Talent route in country is not modelled here. There is likely to be some displacement effect as those already in the UK move onto the Global Talent route. The majority of individuals who switch into Global Talent in country, switch from sponsored work routes. As a result, they will have a limited additional impact as they are likely to remain in employment on the Global Talent route.
English Language Requirements
24. The baseline volumes for the Skilled Worker and Health and Care routes are based on internal Home Office analysis and have been adjusted to consider the changes that were applied to these routes in July 2025. This results in Skilled Worker baseline volumes of 27,000 for main applicants and 30,000 for dependants. For the Health and Care route, it results in the baseline volumes of 12,000 for main applicants and 24,000 for dependants.
25. The baseline volumes for the HPI route have been calculated following the policy change to this route outlined below in this IA, after adjusting to account for the different start dates of the two policies. This results in baseline volumes of 5,000 for main applicants and 500 dependants.
26. The Scale-up route is also eligible for the increased ELR however due to low volumes on this route the impact is assumed to be negligible and has not been modelled here. In the year ending June 2025 there were 116 Scale-up visas issued.
Routes liable to pay the Immigration Skills Charge
27. Employers sponsoring migrant workers under Skilled Worker, Global Business Mobility and Health and Care visa products are subject to pay the ISC for every employee who is assigned a Certificate of Sponsorship when applying to work in the UK for six months or more.[footnote 15] ISC is applicable to overseas hires (out-of-country applicants), visa extensions and visa switches (in-country applicants).
28. As significant changes have taken place on the Skilled Worker and Health and Care routes in July 2025 it is not reasonable to assume that volumes for the year ending June 2025 will continue into the future. Instead, baseline inflow volumes are based on internal future application estimates, accounting for these changes.
29. As the charge is not applicable to dependants, they are not considered in the baseline volumes when it comes to ISC revenue and processing costs. However, as any changes to main applicant volumes will no longer be able to bring their dependants with them, they are considered when assessing wider impacts.
30. As some occupations, and students switching onto work routes are exempt from paying the ISC, internal certificate of sponsorship data is used to estimate that 11 per cent of granted sponsors fall within the exemptions. This percentage is then applied to granted volumes to estimate the volumes that are expected to be ISC liable.
Grant rates
31. The rates of visas granted under each route impacted by Option 1 are calculated using internal Home Office data and are summarised in Table 1 below.
Table 1: Visa grant rates on impacted routes
| Location | Visa type | Grant rate main applicant | Grant rate dependant |
|---|---|---|---|
| Out of country | Global Business Mobility | 100% | 100% |
| Out of country | Global Talent | 99% | 98% |
| Out of country | Health and Care | 86% | 84% |
| Out of country | High Potential Individual | 98% | 97% |
| Out of country | Skilled worker | 81% | 91% |
| Out of country | Student | 97% | 91% |
| In country | Global Business Mobility | 100% | 100% |
| In country | Global Talent | 100% | 100% |
| In country | Graduate route | 100% | 99% |
| In country | Health and Care | 99% | 98% |
| In country | High Potential Individual | 100% | 100% |
| In country | Skilled Worker | 100% | 99% |
Source: Home Office analysis. Grant rates at 100% may be a result of rounding.
32. Combining the application demand estimates with the grant rates above, Table 2 sets out the baseline annual visas issued by route.
Table 2. Baseline visas issued, by location (In and Out of Country) and financial year. Central scenario. Main applicants and dependants.
| Location | Cohort | Main Applicant / Dependant | 2025/26** | 2026/27 | 2027/28 | 2028/29 Onwards |
|---|---|---|---|---|---|---|
| Out of Country | High Potential Individual | Main | 700 | 1,800 | 1,800 | 1,800 |
| Out of Country | High Potential Individual | Dependant | <100 | 200 | 200 | 200 |
| Out of Country | Skilled worker | Main | 7,000 | 27,000 | 27,000 | 26,000 |
| Out of Country | Skilled worker | Dependant | 7,000 | 30,000 | 30,000 | 30,000 |
| Out of Country | Health & care | Main | 3,000 | 12,000 | 13,000 | 12,000 |
| Out of Country | Health & care | Dependant | 6,000 | 24,000 | 25,000 | 24,000 |
| Out of Country | Global Business Mobility* | Main | 3,000 | 12,000 | 12,000 | 11,000 |
| Out of Country | Global Business Mobility* | Dependant | 2,000 | 6,000 | 6,000 | 6,000 |
| Out of Country | Global Talent | Main | 2,000 | 4,000 | 4,000 | 10,000 |
| Out of Country | Global Talent | Dependant | 1,000 | 3,000 | 3,000 | 7,000 |
| Out of Country | Sponsored Study*** | Main | 371,000 | 371,000 | 371,000 | 371,000 |
| Out of Country | Sponsored Study*** | Dependant | 18,000 | 18,000 | 18,000 | 18,000 |
| In Country | Skilled worker | Main | 8,000 | 30,000 | 30,000 | 30,000 |
| In Country | Skilled worker | Dependant | 6,000 | 26,000 | 26,000 | 26,000 |
| In Country | Health & care | Main | 7,000 | 30,000 | 30,000 | 12,000 |
| In Country | Health & care | Dependant | 2,000 | 8,000 | 7,000 | 7,000 |
| In Country | Global Business Mobility* | Main | 2,000 | 8,000 | 9,000 | 9,000 |
| In Country | Global Business Mobility* | Dependant | 2,000 | 7,000 | 8,000 | 8,000 |
Source: Home Office analysis and Immigration system statistics quarterly release, year ending June 2025.[footnote 16]
*Only ISC eligible volumes.
**Reflects a part year of baseline volume from assumed implementation date.
*** Only sponsored study visas affected by the policy change (for example, excluding pre-sessional English)
33. Note that for the purposes of Table 2 above, for all routes except for Global Business Mobility, volumes are subsequently adjusted when estimating ISC revenue to account for volumes that are exempt from paying the ISC as set out in paragraph 29. As none of the other policy changes affect the Global Business Mobility route, for clarity the volumes have already been adjusted to only show those that are liable to pay the ISC.
Policy Impact on Volumes
Graduate route proposal
34. The impact of shortening the Graduate route to 18 months (from 2 years) is derived by estimating an initial fall in student demand arising from individuals being dissuaded from coming to study in the UK by the policy change, as set out in paragraph 39. The analysis accounts for the course level of this fall in visas to account for foregone switching behaviour onto the Graduate route (assumed at three years for undergraduates and one year for postgraduates).
35. An additional impact is estimated from the proportion of those Graduate visa holders who may have switched onto the Skilled Worker or Health and Care routes, had they have not been dissuaded from coming to study in the UK in first place.
36. The analysis also accounts for a potential behavioural response of universities and business as a result of these changes by assuming that there is a replacement effect for students from Year 2 onwards, as set out in paragraph 41.
37. Regional analysis has not been conducted, as the annual decline in student numbers is estimated to be less than 10,000. There are over 400 higher education providers in the UK, and in 2023/24 around 250 of them hosted at least 5 international students.[footnote 17] Based on the assumption that there are at least 250 higher education institutions with a Home Office sponsor license, the annual reduction in students when distributed evenly amounts to fewer than 50 students per institution. Given the relatively small scale of change at the institutional level, a regional analysis breakdown would be disproportionate and unlikely to yield meaningful insights.
Impact on the Student route
38. Findings from the second wave of the Home Office’s Student route evaluation suggest that 14 per cent of surveyed student visa holders would have been potentially dissuaded from applying for a student visa if the Graduate route did not exist.[footnote 18] This estimate is likely to overstate any deterrence effect, given the policy proposal reflects a change in the length of stay granted on the route, rather than removing the Graduate route in its entirety.
39. In effect, Option 1 proposes to shorten the Graduate route by one quarter of the length of stay of the current offer. Therefore, a central estimate for the behaviour response of prospective students is generated as one quarter of the 14 per cent of students who indicated that they would be dissuaded from coming to study in the UK if the Graduate route did not exist. In a central scenario, Option 1 may result in a 3.5 per cent fall in student visa demand.
40. A low and a high scenario are generated around the central estimate to reflect the uncertainty in the behaviour of future students. A low scenario assumes that shortening the Graduate route to 18 months does not impact the number of people wishing to study in the UK (0 per cent response). Under a high behavioural response scenario, the Graduate route has a higher impact on future student demand, amounting to double that of the central scenario (7 per cent response).
41. The analysis accounts for a replacement effect of 20 per cent for students in Year 2, increasing to 30 per cent from Year 3 onwards in all scenarios. This reflects observed sector behaviour, where restrictions on certain cohorts prompt higher education institutions to adapt by targeting alternative markets to recruit students. For example, when student volumes were restricted in 2023, sponsored students’ application volumes for main applicants declined by 17 per cent between the first two quarters 2023 and 2024. However, this was followed by a 22 per cent recovery in the first two quarters 2025,[footnote 19] indicating sector resilience. Based on this, it is assumed that the recovery will continue to strengthen over time, justifying the higher replacement rate from Year 3.
42. Table 3 outlines the estimated fall in visa applications on the student route for main applicants and their dependants across the central response scenario. In all cases the ratio of main applicants to dependants for those eligible to bring dependants is assumed to remain constant at 1:0.5 and any dissuaded students are no longer assumed to bring their dependants.
Table 3: Estimated fall in out of country student applications (main applicants and dependants), 2025/26 to 2030/31, Central scenario
| Visa type | Baseline applications | 2025/26* | 2026/27 | 2027/28 | 2028/29 | 2029/30 | 2030/31* |
|---|---|---|---|---|---|---|---|
| Study Main Applicant | 371,000 | -3,000 | -10,000 | 9,000 | -9,000 | 9,000 | -7,000 |
| Study Dependant | 18,000 | -100 | -400 | -400 | -400 | -400 | -300 |
Source: Home Office Immigration Statistics, year ending June 2025 and internal Home Office analysis. *Part-year impact reflecting the implementation date of the policy covering five full years.
43. Table 4 displays the corresponding decrease in visas issued on the student route across the central scenario once the grant rate has been accounted for in the central scenario.
Table 4: Estimated fall in out of country student visas granted (main applicants and dependants), 2025/26 to 2030/31, Central scenario
| Visa type | Baseline grants | 2025/26* | 2026/27 | 2027/28 | 2028/29 | 2029/30 | 2030/31* |
|---|---|---|---|---|---|---|---|
| Study Main Applicant | 360,000 | -3,000 | -10,000 | -9,000 | -9,000 | -9,000 | -7,000 |
| Study Dependant | 16,000 | -100 | -400 | -300 | -300 | -300 | -200 |
Source: Home Office analysis. *Part-year impact reflecting the implementation date of the policy covering five full years.
Impact on the Graduate route
44. The estimated fall in visas granted on the student route is staggered over time to account for the average length of an undergraduate (3 years) or postgraduate (1 year) course prior to switching onto the Graduate route. Table 5 outlines the estimated subsequent fall in applications for the Graduate route and table 6 shows the corresponding impact on issued visas once the grant rate has been applied.
Table 5: Estimated fall in Graduate route applications (main applicants and dependants), 2025/26 to 2030/31, Central scenario
| Visa type | 2025/26 | 2026/27 | 2027/28 | 2028/29 | 2029/30 | 2030/31* |
|---|---|---|---|---|---|---|
| Graduate Main Applicant | 0 | -2,000 | -7,000 | -7,000 | -9,000 | -7,000 |
| Graduate Dependant | 0 | -100 | -400 | -300 | -300 | -200 |
Source: Home Office analysis. *Part-year impact reflecting the implementation date of the policy covering five full years.
Table 6: Estimated fall in Graduate route visas granted (main applicants and dependants), 2025/26 to 2030/31, Central scenario
| Visa type | 2025/26 | 2026/27 | 2027/28 | 2028/29 | 2029/30 | 2030/31* |
|---|---|---|---|---|---|---|
| Graduate Main Applicant | 0 | -2,000 | -7,000 | -7,000 | -9,000 | -7,000 |
| Graduate Dependant | 0 | -100 | -400 | -300 | -300 | -200 |
Source: Home Office analysis. *Part-year impact reflecting the implementation date of the policy covering five full years.
Impact on sponsored work routes
45. Following completion of the Graduate route, some of the dissuaded international students may have switched onto either the Skilled Worker or the Health and Care routes. Based on internal Home Office data for individuals whose Graduate route visas expired in 2024, 32 per cent of main applicants switched to Skilled Worker visas; and additional 10 per cent switched to the Health and Care route.
46. As this IA considers a five year appraisal period, the volume of dissuaded students who would have otherwise switched onto these routes is expected to be small. As all students affected by this policy change would have been on the Graduate route, impacts would not be felt until, at the earliest, the fourth year of the appraisal period. Further, the volumes affected are estimated to be relatively small at under 1,000 applicants per year by the end of the appraisal period.
47. It is also plausible that many of those affected are broadly the same cohort of people switching from the Student and Graduate into the type of lower skilled work that was restricted as part of the changes to the Immigration Rules in July 2025.
48. As a result, no further economic analysis is done on the subsequent impact of this cohort after they would have been on the Graduate route. This effect is only considered when estimating the impact on net migration, reflecting those who may otherwise have remained longer in the UK and so not counted as an outflow for the purpose of the net migration calculation.
HPI Route
49. To estimate the impact of an HPI expansion on flows, the analysis estimates annual graduates from the top 100 list of institutions, split by domestic and international students. Data is drawn from individual institution websites to inform estimates. It is worth noting data on annual graduates is not always available and proxies are made using comparable institutions, adding to uncertainty in estimates. This step provides the total potential eligible pool of graduates in a year.
50. The analysis then splits the potential pool of eligible graduates in a year by nationality. The nationality of domestic students will be the country the institution is in. For international students, assumptions are developed to split the pool of international students graduating from an institution by nationality.[footnote 20]
51. Further assumptions are then developed on the propensity to migrate to the UK for each country of origin. To capture uncertainty, three scenarios are developed:
-
Low scenario: The low scenario looks at the emigration rate, using UN Migrant Stock data for 2024, and estimates the share of a nations’ population living outside that nation as ‘general’ migration rate for that nationality.[footnote 21]
-
Central scenario: The central scenario develops assumptions for the propensity to migrate to the UK based on analysis of current inflows to the UK on a HPI visa.[footnote 22] This approach looks at the share of HPI main applicants from each nationality in the total estimated pool of eligible graduates of that nationality, based on the latest top 50.[footnote 23]
-
High scenario: World Bank research is used to account for potential higher emigration rates for people with higher levels of education and an uplift is therefore applied to the propensity to migrate assumptions developed in the high scenario.[footnote 24]
52. The methodology described above provides estimates of individuals graduating from an eligible institution in a year that might migrate to the UK. However, the pool of those qualifying for a HPI visa is likely to be wider given a graduate will be eligible for the route if they have been awarded a qualification from an eligible university in the past five years. Whilst this is the case, the propensity to migrate to the UK on a HPI visa could be relatively lower for those graduating further in the past when compared to those more recently; if, for example individuals have already migrated to other countries or are settled into a job and are less willing to move to the UK.
53. To account for the five-year backwards eligibility, the analysis assumes those awarded a qualification less recently see an annual decline in the propensity to come to the UK of 20 per cent per year. Applicants are assumed to apply in their first year of eligibility.
54. To estimate the number of dependants, the analysis develops an assumption on the average number of dependants each HPI main applicant brought in year ending June 2025, estimated at 0.12. This assumption is based on the current cohort of top 50 HPI visa holders, and there is a lack of evidence on whether those graduating from top 51 to 100 institutions are more – or less – likely to bring dependents than those main applications graduating from top 50 institutions.
55. Finally, a total cap of 8,000 applications will be in operation, applying to main applicants on the route. Given the expansion will be implemented in November 2025, inflow estimates are adjusted to include five months’ worth of volumes in financial year 2025/26. Inflow estimates are therefore highest in 2026/27 given they represent a full years’ worth of volumes and include some of the cohort affected by the backwards eligibility.
56. Based on this methodology, the analysis estimates an increase in inflows of between 3,000 and 5,000 main applicants in 2026/27 (central estimate of 5,000), and between 1,000 and 4,000 main applicants from 2028/29 onwards (central estimate of 3,000). The increase in visas issued to dependants is relatively lower – estimated at less than 600 annual visas issued in the central scenario – given current dependant ratios on the route.
57. Given the close to 100 per cent grant rate, the impact on applications and granted visas is estimated to be the same. However, it is plausible that the grant rate for the newly added institutions could be lower, reducing the additional granted visas.
Table 7: Estimated increase in applications and HPI visas issued (main applicants and dependants), 2025/26 to 2030/31, Central scenario
| Visa type | 2025/26 | 2026/27 | 2027/28 | 2028/29 | 2029/30 | 2030/31* |
|---|---|---|---|---|---|---|
| HPI Main Applicant | 2,000 | 5,000 | 3,000 | 3,000 | 3,000 | 2,000 |
| HPI Dependant | 300 | 600 | 300 | 300 | 300 | 200 |
Source: Home Office analysis. *Part-year impact reflecting the implementation date of the policy covering 5 full years.
Global Talent Route
58. The analysis estimates an illustrative scenario assuming entry clearance volumes on the route double compared to the latest year available. This is in the context of the government’s ambition to double the number of high talent individuals on the Global Talent route, starting with several policy measures in this set of Immigration Rules.
59. Initial measures include the changes that expand the number of prestigious prizes that allow applicants to automatically qualify for the visa, and expanding the National Academies fellowship fast-track pathway, which allows access to a more efficient application process, to include those with a qualifying institutional fellowship. Expansion of the Global Talent route will be further supported by wider government efforts to promote and market the route, for example through the establishment of the Global Talent Taskforce, which has a mandate to promote the route and establish a strong pipeline of highly talented individuals who are considering continuing their careers in the UK.
60. The exact impact of these policies is difficult to quantify. However, this analysis seeks to capture the impact of the government’s long-term ambition to promote growth by ensuring that the very high skilled have opportunities to come to the UK and that with subsequent monitoring on the impact of these changes, further changes could be made to achieve this impact.
61. All visas issued are assumed to be on the three-year route to settlement. The Global Talent route includes both three-year and five-year routes to settlement, however the majority are three years.
Table 8: Illustrative increase in Global Talent visas issued (main applicants and dependants), 2025/26 to 2030/31, Central scenario
| Visa type | 2025/26 | 2026/27 | 2027/28 | 2028/29 | 2029/30 | 2030/31* |
|---|---|---|---|---|---|---|
| Global Talent Main Applicant | 2,000 | 4,000 | 4,000 | 4,000 | 4,000 | 2,000 |
| Global Talent Dependant | 1,000 | 3,000 | 3,000 | 3,000 | 3,000 | 2,000 |
Source: Home Office analysis. *Part-year impact reflecting the implementation date of the policy covering five full years.
Impact of the increase in English Language Requirements
62. The current ELR are set at a CEFR B1 level for main applicants on the Skilled Worker, Health and Care, HPI and Scale Up routes which corresponds to independent users of the language. This means those who have the necessary fluency to communicate without effort with native speakers. The proposal would reflect an increase to B2, which would require visa holders to have the fluency and ability to handle everyday situations.[footnote 25]
63. There is a high degree of uncertainty associated with the proportion of workers that might be affected by an increase in English Language proficiency requirements. Insights from the Skilled Worker Evaluation[footnote 26] are used to gauge proficiency levels, however they do not correspond to specific Common European Framework of Reference for Languages (CEFR) levels. As such, the analysis assumes the following:
-
Low scenario: only those with a basic ability are assumed to be affected.
-
High scenario: in addition to those with basic ability, half of those who speak English ‘fairly well’ are also assumed to be affected.
-
Central scenario: is the average of the low and high scenarios.
64. This allows the following scenarios to be constructed:
Table 9: Illustrative impact on main applicant inflows on relevant routes, by scenario
| Low | Central | High | |
|---|---|---|---|
| Health and Care | -2.7% | -4.3% | -5.9% |
| Skilled Worker | -2.6% | -4.1% | -5.7% |
| HPI | -2.3% | -3.2% | -4.1% |
Source: Home Office analysis
65. To model the reduction in out of country visas, these proportions have then been applied to baseline estimates for the Skilled Worker and Health and Care, adjusted for the changes to the routes made in July 2025 and the total HPI visa demand, including the estimated increase set out in Table 7. For in-country visas these higher language requirements only apply to switchers onto these routes and as this cohort of migrants is small, impacts are assumed to be negligible.
66. Estimates derived using the methodology set out above are likely to be overestimates of the reduction in inflows associated with the new ELR. It is likely that at least some of the affected visa holders learn the required standard of English to maintain their eligibility on these visa routes. Within this context, it is likely that this policy change will incentivise affected visa holders to learn the required standard of English and a relatively high behavioural response is modelled. Therefore, in the absence of any additional evidence, the analysis assumes that 50 per cent of those impacted by the change would improve their proficiency to meet raised requirements.
67. Dependants are not directly affected by this policy however any dependants associated with main applicants that no longer meet the requirements will also be affected by these changes. To account for this, the ratio of main applicants to dependants has been estimated for each of the routes and then applied to the reduction in main applicants.
68. Based on this methodology, the analysis estimates a decrease in visas issued of between 400 and 1,500 main applicants in 2026/27 (central estimate of 900). The decrease in visas issued to dependants in 2026/27 is between 500 and 2,000 (central estimate of 1,200), given current dependant ratios on each route.
Table 10: Estimated fall in visas issued due to increased English Language Requirements (main applicants and dependants), 2025/26 to 2030/31, Central scenario
| Visa type | 2025/26 | 2026/27 | 2027/28 | 2028/29 | 2029/30 | 2030/31* |
|---|---|---|---|---|---|---|
| HPI Main Applicant | ~ | -100 | ~ | ~ | ~ | ~ |
| HPI Dependant | ~ | ~ | ~ | ~ | ~ | ~ |
| Skilled Worker Main Applicant | -100 | -500 | -600 | -500 | -500 | -400 |
| Skilled Worker Dependant | -200 | -600 | -600 | -600 | -600 | -400 |
| Health & Care Main Applicant | -100 | -300 | -300 | -300 | -300 | -200 |
| Health & Care Dependant | -100 | -500 | -500 | -500 | -500 | -400 |
Source: Home Office analysis. *Part-year impact reflecting the implementation date of the policy covering five full years. ~ denotes less than 100
Impact of increasing the Immigration Skills Charge
69. To estimate the policy impact of increased ISC fees on visa applications, the analysis draws upon estimates of wage elasticity of labour demand. Sponsors face an overall cost when hiring a foreign worker (salaries, certificate of sponsorship and ISC fees), and so an increase in ISC is an increase to the overall cost of hiring a foreign worker.
70. The analysis approximates domestic businesses’ willingness to sponsor foreign workers under different fee levels (the wage elasticity of labour demand) from academic literature developed in a similar context. Further detail can be found in the Home Office’s ‘A review of evidence relating to the elasticity of demand for visas in the UK’ published in March 2020.[footnote 27]
Table 11: Elasticity used to analyse the impact of changing Immigration Skills Charge fees
| Elasticity type | Justification | Low | Central | High |
|---|---|---|---|---|
| Wage elasticity of labour demand | Businesses demand Home Office products to bring migrants to the UK to fill employment vacancies. The wage elasticity of labour demand is therefore used to estimate the impact on volumes of the proposed fee changes for ISC. | 0 | -0.6 | -1.2 |
Source: A review of evidence relating to the elasticity of demand for visas in the UK, March 2020
71. The elasticity is subsequently applied to the percentage increase in the total cost of sponsoring a foreign worker for the duration of their sponsorship. The total cost of sponsoring a foreign worker is calculated by using the latest data on ISC liable sponsored workers and multiplying their median annual salaries (£42,000) by the average length of the sponsorship (2.8 years). The current certificate of sponsorship fee (£525) is then added as well as the relevant weighted ISC fee (see Table 12).
Table 12: Estimated weighted Immigration Skills Charge fee, before and after the 32 per cent increase
| Small or medium sponsors | Large sponsors | Weighted ISC fee | |
|---|---|---|---|
| % share of sponsored workers | 35% | 65% | |
| Current ISC Fee | £364 | £1,000 | |
| Current Weighted ISC Fee | £776 | ||
| Increased ISC Fee | £480 | £1,320 | |
| Increased Weighted ISC Fee | £1,024 |
Source: Internal Home Office analysis
72. Applying the elasticity set out in Table 11 onto the percentage change in the cost of sponsoring a foreign worker provides the expected percentage change in volumes. This is subsequently applied to the forecasted baseline volumes in Table 2 (adjusted to account for those eligible to pay the ISC) to give the overall volume change. This is summarised in Table 13 below and is combined for all eligible routes given the relatively small volume of affected applicants.
Table 13: Estimated change in visas issued volumes following an increase to the ISC, 2025/26 to 2030/31, out of country and in-country for Skilled Worker, Health and Care and Global Business Mobility, Central scenario
| 2025/26 | 2026/27 | 2027/28 | 2028/29 | 2029/30 | 2030/31* | |
|---|---|---|---|---|---|---|
| Main Applicants | -200 | -900 | -800 | -700 | -700 | -500 |
| Dependants | -300 | -900 | -600 | -500 | -400 | -300 |
Source: Home Office analysis. *Part-year impact reflecting the implementation date of the policy covering five full years.
Overall combined impact on volumes
73. Tables 14 and 15 sets out a summary of the impact on volumes across modelled visa routes, in the central estimate. Table 14 sets out the increase in volumes while Table 15 sets out the decrease in volumes. The impact on volumes remains highly uncertain, and any estimates should therefore be treated as illustrative.
74. For policy proposals that are estimated to increase inflows, measures considered this IA model an increase of 7,000 main applicants and 3,000 dependants in 2029/30, the final full appraisal period considered in the IA.
75. For policy proposals that are estimated to decrease inflows, measures considered this IA model a decrease of 11,000 main applicants and 2,000 dependants in 2029/30, the final full appraisal period considered in the IA.
Table 14: Combined impact on volumes following HPI and Global Talent expansion across modelled routes (main applicants and dependants), 2025/26 to 2030/31. Central estimate only.
| Visa type | 2025/26 | 2026/27 | 2027/28 | 2028/29 | 2029/30 | 2030/31* |
|---|---|---|---|---|---|---|
| HPI Main Applicant | 2,000 | 5,000 | 3,000 | 3,000 | 3,000 | 2,000 |
| HPI Dependant | 300 | 600 | 300 | 300 | 300 | 200 |
| Global Talent Main Applicant | 2,000 | 4,000 | 4,000 | 4,000 | 4,000 | 2,000 |
| Global Talent Dependant | 1,000 | 3,000 | 3,000 | 3,000 | 3,000 | 2,000 |
| Total Main Applicant | 4,000 | 9,000 | 7,000 | 7,000 | 7,000 | 4,000 |
| Total Dependant | 1,000 | 4,000 | 3,000 | 3,000 | 3,000 | 2,000 |
Source: Home Office analysis. *Part-year impact reflecting the implementation date of the policy covering five full years.
Table 15: Combined impact on volumes following Graduate, English Language Requirements and Immigration Skills Charge changes across modelled routes (main applicants and dependants), 2025/26 to 2030/31. Central estimate only.
| Visa type | 2025/26 | 2026/27 | 2027/28 | 2028/29 | 2029/30 | 2030/31* |
|---|---|---|---|---|---|---|
| Work Routes (English Language) Main Applicant | -200 | -900 | -900 | -800 | -800 | -600 |
| Work Routes (English Language) Dependant | -300 | -1,000 | -1,000 | -1,000 | -1,000 | -800 |
| Work Routes (ISC Increase) Main Applicant | -200 | -900 | -800 | -700 | -700 | -500 |
| Work Routes (ISC Increase) Dependant | -300 | -900 | -600 | -500 | -400 | -300 |
| Student Main Applicant | -3,000 | -10,000 | -9,000 | -9,000 | -9,000 | -7,000 |
| Student Dependent | -100 | -400 | -300 | -300 | -300 | -200 |
| Total Main Applicant | -3,000 | -12,000 | -11,000 | -11,000 | -11,000 | -8,000 |
| Total Dependant | -700 | -2,000 | -2,000 | -2,000 | -2,000 | -1,000 |
Source: Home Office analysis. *Part-year impact reflecting the implementation date of the policy covering five full years. No flow estimates are set out for the Graduate route as these are a continuation of the impact of student volumes. They are instead considered as part of the stock estimates below.
Outflow modelling
76. Further analysis is undertaken to translate the estimated change in visa demand into changes to the cumulative number of people (migrant stock) in the UK as well as the wider impact on net migration using assumptions on the ‘outflow profile’ of individuals impacted by policy proposals. These assumptions are based on:
-
Student visa holders: Internal Home Office analysis has produced outflow profiles for those Students who would have come and joined the Graduate route but are instead deterred. This analysis is based on a series of assumptions including switching data for Students at expiry of visa, switching data for Graduate route visa holders at end of visa and historic leaving profiles for those on the Skilled Work and Family routes, all derived from internal migrant journey underlying data.
-
HPI visa holders: Two scenarios are developed, including an upper net migration scenario (relatively lower emigration) which is based on insights from the HPI evaluation and a lower net migration scenario (relatively higher emigration) with insights based on Migrant Journey analysis of visa holders on work routes, excluding Skilled Worker and Health and Care visa holders.[footnote 28] The central scenario which is used in leave rates set out in Table 16 is an average of stay rates in the upper and lower scenarios.
-
Global Talent: Internal Home Office analysis has developed an outflow profile for those who arrive on the Global Talent visa. The Global Talent visa has traditionally been relatively low volume, and outflows from the route have been low. As the route expands in future there may be an increase in outflows.
-
Skilled Worker, inc. Health and Care: Internal analysis of Home Office Migrant Journey data is used to estimate the outflow profile of those who have come on the Skilled Worker (Tier 2 General) route based on 2014 to 2019 arrivals. As the Health and Care route has been open for fewer than five years, the outflow profile of Skilled Workers is used for all routes in this IA. This is a limitation and may over or underestimate the rate at which those on the Health and Care route may choose to remain in the UK longer term.
-
Global Business Mobility Internal analysis of Home Office Migrant Journey data is used to estimate the outflow profile of those who have come on the Global Business Mobility (Intra-Company Transfer) route based on 2014 to 2019 arrivals
77. Table 16 outlines the outflow profile assumed in the analysis across various routes affected by proposals set out in the IA.
Table 16: Outflow profile across all modelled routes
| <1 year | 1 to 2 years | 2 to 3 years | 3 to 4 years | 4 to 5 years | Overall assumed leave rate | |
|---|---|---|---|---|---|---|
| Global Talent | 0% | 1% | 1% | 2% | 1% | 24% |
| HPI | 10% | 15% | 10% | 4% | 8% | 53% |
| Students who use the Graduate route | 0% | 0% | 32% | 0% | 16% | 59% |
| Skilled workers (inc. Health and Care) | 0% | 6% | 9% | 3% | 7% | 27% |
| Global Business Mobility | 18% | 11% | 10% | 11% | 6% | 78% |
Source: Home Office analysis of Migrant Journey. Overall leave rate includes those who would have left after the five year appraisal period.
Change in Stock and Net Migration
78. Estimates of the change in the stock of migrants are estimated as an input into fiscal analysis and across all modelled routes. These are developed using the leave profiles set out in the table above, and the estimates change in volumes, as set out in Table 17.
Table 17: Estimated change in the stock (main applicants and dependants). Central estimate only.
| Visa type | 2025/26 | 2026/27 | 2027/28 | 2028/29 | 2029/30 | 2030/31 |
|---|---|---|---|---|---|---|
| Estimated increase in the stock of migrants following HPI and Global Talent expansion | ||||||
| HPI Main Applicant | 2,000 | 6,000 | 7,000 | 9,000 | 10,000 | 11,000 |
| HPI Dependant | 300 | 700 | 900 | 1,000 | 1,000 | 1,000 |
| Global Talent Main Applicant | 2,000 | 5,000 | 9,000 | 12,000 | 12,000 | 12,000 |
| Global Talent Dependant | 1,000 | 4,000 | 7,000 | 8,000 | 8,000 | 8,000 |
| Estimated decrease in the stock of migrants following Graduate route shortening, ISC increase and raised ELR | ||||||
| Work Routes (English Language) Main Applicant | -200 | -1,000 | -2,000 | -3,000 | -3,000 | -4,000 |
| Work Routes (English Language) Dependant | -300 | -1,000 | -3,000 | -4,000 | -5,000 | -5,000 |
| Work Routes (ISC Increase) Main Applicant | -200 | -1,000 | -2,000 | -2,000 | -3,000 | -3,000 |
| Work Routes (ISC Increase) Dependant | -300 | -1,000 | -2,000 | -2,000 | -2,000 | -2,000 |
| Student Main Applicant | -3,000 | -11,000 | -13,000 | -15,000 | -14,000 | -12,000 |
| Student Dependent | -100 | -400 | -300 | -300 | -300 | -200 |
| Graduate Main Applicant | 0 | -2,000 | -9,000 | -14,000 | -16,000 | -16,000 |
| Graduate Dependent | 0 | -100 | -500 | -700 | -600 | -600 |
Source: Home Office analysis
79. Table 18 below reflects the net flow of people into and out of the UK. Unlike Table 17, only the change in inflows in that year are considered, and any people who would otherwise have left from any previous year are removed. For example, in year one, this impact is also equivalent to the flow of people who are restricted from coming. However, by year five this represents only the flow of people in year five restricted from coming but removing any people from previous years who choose to leave in year five (for example those restricted from coming in year three but would otherwise have left two years later). This is used to estimate the net migration impact.
80. For simplicity, as this is not used in any subsequent modelling, these effects are grouped by policy change and are not split out by specific route, nor by main applicants and dependants. The final year of the appraisal period, which is not a full year, is also not included.
81. For the Global Talent route migrants are assumed to get settlement at three years, as a result initial cohorts will reach settlement within the appraisal period. The Global Talent route includes both three-year and five-year routes to settlement, however the majority are three years.
Table 18: Estimated change in net migration per policy (main applicants and dependants). Central estimate only.
| Visa type | 2025/26 | 2026/27 | 2027/28 | 2028/29 | 2029/30 |
|---|---|---|---|---|---|
| Global Talent | 1,000 | 7,000 | 7,000 | 6,000 | 6,000 |
| HPI | 2,000 | 4,000 | 1,000 | 1,000 | 1,000 |
| English Language | -500 | -2,000 | -2,000 | -2,000 | -2,000 |
| ISC | -500 | -2,000 | -1,000 | -900 | -800 |
| Graduate Route Changes | -3,000 | -10,000 | -9,000 | -8,000 | -6,000 |
| Total | -1,000 | -3,000 | -4,000 | -4,000 | -2,000 |
Source: Home Office analysis
Economic Impact Assumptions
Home Office visa fees and charges
82. The chargeable visa fee levels and unit costs (the cost the Home Office incurs from processing a visa application) under each route impacted by Option 1 are summarised in Table 19 below. This IA uses the visa fee levels at the time of analysis (September 2025). Visa fees and unit costs are assumed to remain unchanged across the appraisal period.
83. The visa fees outlined in Table 19 reflect the standard service price where applications are reviewed and decided at regular processing times. Applicants can pay an additional charge to receive a decision on their visa in five working days for £500 (premium service) or in one working day for £1,000 (super premium service). These rates are assumed to remain unchanged across the appraisal period.
84. Domestic businesses wishing to sponsor foreign workers are subject to pay a Certificate of Sponsorship (CoS) fee, currently levied at £525 per individual migrant on skilled work routes, and £50 on temporary work routes. Sponsorship fees are only applicable to main applicants (that is, the sponsored individual), not their dependants.
85. Domestic education providers wishing to sponsor international students are subject to pay a Confirmation of Acceptance for Studies (CAS) fee, currently levied at £50 per individual student. CAS fees are only applicable to main applicants.
Table 19: Visa fees and unit costs (£)
| Location | Visa type | Visa fee | Unit cost |
|---|---|---|---|
| Out of country | Skilled Worker – up to 3 years | 769 | 172 |
| Out of country | Skilled Worker – over 3 years | 1,519 | 172 |
| Out of country | Health and Care – up to 3 years | 304 | 172 |
| Out of country | Health and Care – over 3 years | 590 | 172 |
| Out of country | Global business mobility (senior and specialist worker) – up to 3 years | 769 | 124 |
| Out of country | Global business mobility (senior and specialist worker) – over 3 years | 1,519 | 124 |
| Out of country | Global Talent – main applicant | 766 | 488 |
| Out of country | Global Talent - dependant | 766 | 499 |
| Out of country | Student visa | 524 | 266 |
| Out of country | High Potential Individual | 880 | 231 |
| In country | Skilled Worker – up to 3 years | 885 | 228 |
| In country | Skilled Worker – over 3 years | 1,751 | 228 |
| In country | Health and Care – up to 3 years | 304 | 228 |
| In country | Health and Care – over 3 years | 590 | 228 |
| In country | Global business mobility (senior and specialist worker) – up to 3 years | 885 | 198 |
| In country | Global business mobility (senior and specialist worker) – over 3 years | 1,751 | 198 |
| In country | Global Talent – main applicant | 766 | 283 |
| In country | Global Talent - dependant | 766 | 499 |
| In country | Graduate route | 880 | 103 |
| In country | High Potential Individual | 880 | 231 |
Source: Home Office visa transparency data. Note the High Potential Individual visa incurs an additional charge of between £213 and £252 to check the qualification is valid. As this is relatively small in magnitude and does not accrue as a public sector benefit, it is not included in further analysis
86. The Immigration (Health Charge) Order 2015 requires temporary migrants who make an immigration application to come to the UK for more than six months, or who apply to extend their stay in the UK, to make a direct contribution to the NHS via payment of an IHS. The total amount surcharge payers are liable for is dependent on the duration of their visa. The full amount is payable upfront and in line with other fees as part of the visa application, although unsuccessful applicants receive a refund.[footnote 29]
87. The IHS is currently levied at a rate of £1,035 per person per year, with a concessionary rate of £776 for students and their dependants, children under the age of 18 years, and Youth Mobility Scheme applicants. The rate is assumed to remain unchanged across the appraisal period.
Tuition fees for international students
88. The average tuition fees for international students are calculated using 2022/23 HESA data for Higher Education Institutions’ international fee income divided by the number of international students.[footnote 30] The estimates are derived using information on English-domiciled institutions and students, and therefore may not be fully representative of the UK. Accounting for level of study and converting to the latest price year (2025/26), the analysis assumes that an international student on an undergraduate course pays £19,852 per year, whereas postgraduate fees amount to £17,378 per year.
Fiscal Methodology and Assumptions
89. The fiscal impact of immigration represents a balance between the tax income changes of migrants and the public services pressure they carry through their use of services like healthcare. This balance tends to vary across different migrant cohorts, influenced by factors such as employment rate, income level, age, and their propensity to use different types of public services.
Tax income changes
90. Tax income changes refer to the tax income that governments receive, including both direct and indirect taxes. In the context of migration, tax income changes capture the financial contributions made by migrants through their economic activity in the UK. A reduction in the volumes of visa holders residing in the UK is considered to result in lower contributions through decreased direct and indirect tax revenues. Accordingly, tax income changes are modelled based on estimated changes in volumes of those in employment in the UK and the associated tax revenue from their earnings. For non-working dependants, indirect tax contributions are assumed to be derived from the earnings of the main applicants and are therefore not estimated separately.
91. Sensitivity analysis is performed in economic appraisal and modelling to explore the sensitivity of expected outcomes to potential variations in key input variables. This approach has been adopted to try and present the uncertainty around the fiscal impact of migrants. The potential fiscal impact of migrants has a range of plausible values and the inclusion (or exclusion) of certain revenue and spend components is one aspect that can help demonstrate this uncertainty. In the low scenario, the components considered for tax income changes are Income Tax, National Insurance, Indirect Tax, Council Tax, and Corporation Tax. The central scenario additionally considers Businesses rates for revenue. The High scenario further considers Gross Operating surplus and other taxes for revenue, and Pure public goods for pressure.
92. To estimate these components for main applicants on the Sponsored Work routes, this IA uses projected earnings distributions for migrants (still eligible following the July 2025 Immigration Rules changes[footnote 31]) and assumes that all main applicants are employed. In 2025/26 prices, the median earnings of the affected skilled worker cohort (based on Certificate of Sponsorship data at the point of sponsorship being granted) are:
-
Skilled Worker: £56,500
-
Health and Care: £37,200
93. For adult dependants, data from the Skilled Worker evaluation[footnote 32] indicate that the average employment rate is approximately 71 per cent, with average earnings estimated at around £26,000.
94. Home Office internal management information provides estimates on the age distribution of dependant applicants for 2025 across key visa routes. On the Skilled Worker route, approximately 55 per cent of dependant applicants were aged 18 years or over. For the Health and Care route, the proportion of adult dependants was estimated at 44 per cent.
95. For those on the Graduate route the median salary of main applicants in employment for the whole year is estimated at £26,000 based on published Home Office analysis of migrants’ use of the Graduate route.[footnote 33] The published Home Office evaluation of the Graduate Route suggests 76 per cent of applicants are in employment. While only a small minority (2%) of those on the graduate route have dependants, the majority of these (93%) have a partner, of which 84 per cent are assumed to be in work.[footnote 34]
96. To estimate these components for main applicants on the Global Talent route this IA uses earnings from the published Home Office evaluations on the Global Talent route.[footnote 35] More than half of visa holders surveyed (56%) had an annual salary of between £31,200 and £51,999. The median salary of Global Talent visa holders is estimated at £39,000. Given the very high employment rate of Global Talent visa main applicants, 98 per cent, all main applicants are assumed to be in employment.
97. Given the similarities between the routes. Global Talent dependants are assumed to have the same employment rate and salary as Skilled Worker dependant as set out in paragraph 91
98. Home Office internal management information provides estimates on the age distribution of dependant applicants for 2025 across key visa routes, including HPI and Global Talent. For the Global Talent route, the proportion of adult dependants was estimated at 57 per cent. For HPI the proportion was estimated at 66 per cent.
99. For main applicants and dependants on the HPI route, salaries and employment rates are based on published Home Office evaluations.[footnote 36] The employment rate is estimated at 78 per cent for main applicants and 67 per cent for dependants. Main applicants are assumed to have a salary of £45,000 and dependants are assumed to have a median salary of £26,000.
Public Services Pressure
100. Public services pressure refers to the public spending required to provide services to migrants. To ensure that the high scenario captures the maximum net benefit, while it includes the most components of tax income, it includes the fewest components of public services pressure. This is a departure from previous Home Office IAs where the high scenario considered the largest number of components of both revenue and pressure.
101. In the high scenario, the spending components considered for public services pressure are Health, Education, Personal Social Services, Wider Public services, and Core congestible public goods. The central scenario additionally considers non-Core congestible public goods for pressure, and the Low scenario further considers Pure public goods.
102. Changes in the volume and characteristics of migrants can also influence expenditure on services such as health and education. Demographic variations, such as age distributions, across nationality groups can lead to differences in the cost of delivering public services. For instance, younger populations may increase demand for education, while older or more vulnerable groups may require more healthcare or social assistance. The cost of healthcare is assumed to remain constant across individuals of the same age (group).
103. The scenarios outlined above do not account for welfare expenditure on migrants, as the vast majority of those on visas covered in this IA have ‘No Recourse to Public Funds’ (NRPF) attached to their LTR. The conditions effectively restrict their access to direct welfare payments.
104. Whilst most migrants are subject to NRPF during their visa period, they gain full access to welfare benefits upon applying for ILR after at least five years in the UK on an eligible route. This IA covers a 5-year appraisal period and so assumes zero welfare expenditure throughout their stay, excluding welfare payments.
Fiscal Position
105. Under the central scenario, based on the assumptions around tax income changes and public services pressure, the following net balance between the two is estimated for an average individual in the first year of the appraisal period across each cohort affected by this set of policy measures. A positive value indicates a net financial gain for the exchequer from an individual’s presence in the country, while a negative value indicates a net cost.
Table 20: Illustrative Home Office per person tax income and public services pressure estimates by affected cohort, 2025/26 prices (£).
| Cohort | Main Applicant / Dependant | Tax income | Public Services Pressure | Tax income less public services pressure |
|---|---|---|---|---|
| Global Talent | Main Applicant | 26,000 | 6,000 | 20,000 |
| Global Talent | Dependant | 5,000 | 8,000 | -3,000 |
| HPI | Main Applicant | 18,000 | 6,000 | 12,000 |
| HPI | Dependant | 6,000 | 8,000 | -2,000 |
| Skilled Worker | Main applicant | 37,000 | 6,000 | 31,000 |
| Skilled Worker | Dependant | 5,000 | 8,000 | -4,000 |
| Health and Care | Main applicant | 18,000 | 6,000 | 12,000 |
| Health and Care | Dependant | 4,000 | 9,000 | -5,000 |
| Graduate | Main applicant | 18,000 | 6,000 | 12,000 |
| Graduate | Dependant | 8,000 | 7,000 | 400 |
| Student | Main applicant | 8,000 | 6,000 | 2,000 |
| Student | Dependant | 6,000 | 8,000 | -2,000 |
Source: Home Office internal analysis Note: Figures may not sum due to rounding
106. As such, it can be assumed that policy changes that restrict the volumes of dependants could have a net positive fiscal impact over the appraisal period, while policies that restrict main applicants could have a net negative fiscal impact. The opposite is assumed to be true for policies which increase volumes.
Lifetime Fiscal Position
107. The analysis in this IA considers the static contribution of migrants over the 5-year appraisal period. However, according to the 2024 Migrant Journey report,[footnote 37] 55 per cent of people in the “Worker” category in 2019 still had valid LTR in the UK after five years and 28 per cent had been granted ILR. While lower on the Student route, 25 per cent still have valid LTR in the UK after five years over the same period, predating the existence of the Graduate route.
108. This means many migrants coming to the UK over the appraisal period are likely to remain in the UK into the long term. As they grow older, people stop earning, draw on the state pension and ‘consume’ a large amount of health and social care, so the value of tax income less use of public services from this cohort turns negative.
109. In September 2024, the Office for Budget Responsibility (OBR) estimated the cumulative fiscal impact of a representative migrant coming to the UK at the age of 25.[footnote 38] This analysis was undertaken for an “average-wage” migrant earning the same as the UK average (assumed to be £38,200 using ASHE 2024 data[footnote 39]), a “high-wage” migrant earning 30 per cent more (£49,700) and a “low-wage” earning 50 per cent less (£19,100).
110. Given the median salaries set out above, the majority of those on work routes (Skilled Worker, HPI, Global Talent) affected by this policy change are likely to be best approximated by either the “average wage” or “high-wage” migrant, while many employed adult dependants are best approximated by the “low-wage” migrant category, or below in the case of adults not in employment. For Students the contribution is likely to vary between categories during their time in the UK. The OBR also assess that the fiscal impact of a child dependant is likely to be similar to that of the representative UK person, depending on their age at arrival to the UK.
Figure 2: OBR cumulative fiscal impact of representative migrants
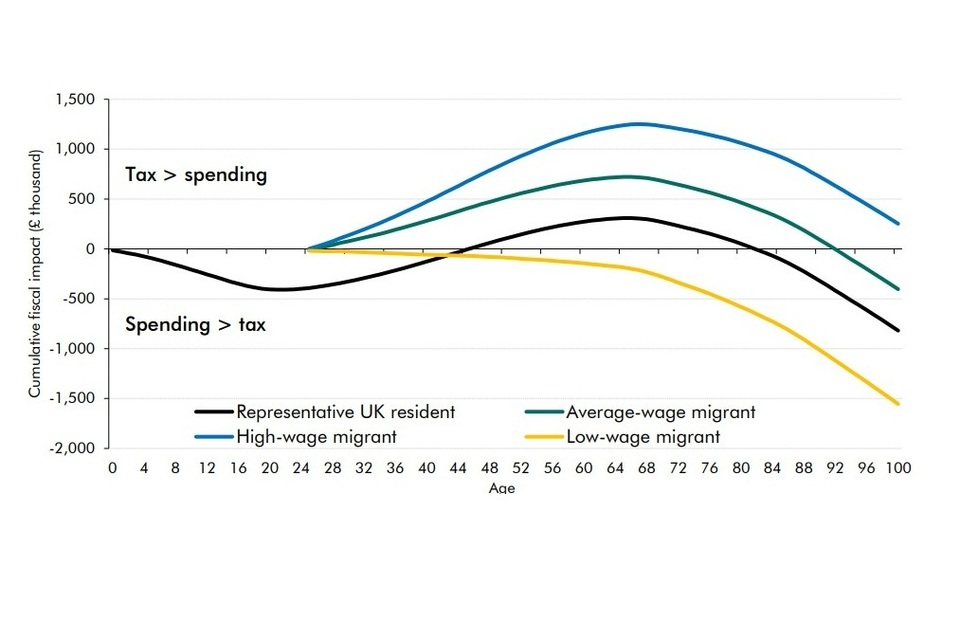
Line chart showing the cumulative fiscal impact of four groups over their lifetime: a representative UK resident, a high-wage migrant, an average-wage migrant and a low-wage migrant. The high-wage migrant has the highest positive cumulative fiscal contribution throughout most of working life. The average-wage migrant also makes a positive net contribution for much of their lifetime. The representative UK resident and low-wage migrant make smaller or negative cumulative fiscal contributions, particularly in later life.
Source: Fiscal risks and sustainability – September 2024 - Office for Budget Responsibility
111. In practice, this means that while this IA will capture a net fiscal loss for the cohorts restricted by changes, this negative impact is likely to fall in the longer term for those that remain in the UK beyond retirement age. In turn, for the cohorts that are increased in volume as a result of these changes on the HPI and Global Talent routes, these are likely to remain as net fiscal contributors through their time in the UK.
GDP and GDP per Capita
112. The modelled change in migrant flows is likely associated with a change in GDP, due to the change in workers and students present in the UK economy. In a central estimate, the OBR estimate an annual 200,000 change in net migration changes overall GDP by between 1 per cent and 2.5 per cent in 2028/29 but this varies based on their characteristics.
113. The changes set out in this IA include both an increase in more highly skilled, higher paid migrant flows through the Global Talent and HPI routes alongside a reduction in some Skilled Worker and Student inflows that subsequently would have moved onto the Graduate route. As a result, on the basis of labour income alone, while this package of changes is expected to reduce overall levels of net migration, the first-order direction and magnitude of impact on GDP is uncertain.
114. The impact on economic growth is wider than changes to labour income, and factors such as productivity spillovers and capital investment can also have a positive impact GDP. Whilst the MAC acknowledge the significant degree of uncertainty associated with the impact of immigration on productivity, they found some evidence to suggest that high-skilled migrants have a positive, and larger, impact on productivity than lower skilled migrants.[footnote 40] For this reason the changes to facilitate additional volumes on the Global Talent and HPI routes could generate additional contributions to GDP.
115. Conversely, for Student volumes, London Economics in their report for Higher Education Policy Institute (HEPI) estimate that the net economic impact was estimated to be £96,000 per non-EU domiciled student in the 2021/2022 cohort. [footnote 41] In other words, every 11 international students generate £1 million worth of net economic impact for the UK economy over the duration of their studies. While this research has limitations, it indicates that the value to the economy is larger than just the impacts from contributions to the labour market. As a result of the limitations of this analysis, particularly the use of significant multiplier effects that according to the Green Book[footnote 42] “cannot provide useful information for choosing between options within a scheme and are therefore not part of the Green Book appraisal process” these impacts should be treated with caution though they are likely to represent an additional loss to GDP.
116. However, the impact of net migration on GDP per capita better reflect impacts on living standards of the resident population. The OBR estimate additional net migration of 200,000 could change GDP per capita by between -0.4 per cent and +0.8 per cent. Given the comparatively small changes in overall net migration as a result of these policy changes and the differing characteristics of those affected, it is unlikely that together there will be a significant impact on GDP per capita in either direction unless there were significant productivity spillovers resulting from the additional highly skilled migrant cohort.
Wider non-monetised benefits
Graduate route and work-related changes
117. As shown in Figure 3 over 30 per cent of surveyed Graduate visa holders were employed in professional occupations, the significant majority of which are RQF 6 and above. Whilst this was the case, 31 per cent were employed in occupational groups where the significant majority are RQF level 3 and below, including administrative and secretarial occupations. The remaining cohort were either unable or unwilling to report their occupation or were employed in Associate Professional Occupations, which predominantly include RQF 3 to 5 occupations, with some RQF 6 occupations.
Figure 3: Occupational profile of Graduate route visa holders
| Occupation | Percentage |
|---|---|
| Professional occupations | 30 |
| Associate professional occupations | 18 |
| Don’t know / Prefer not to say | 15 |
| Caring, leisure and other service occupations | 8 |
| Administrative and secretarial occupations | 8 |
| Elementary occupations | 6 |
| Sales and customer service occupations | 6 |
| Managers, directors and senior officials | 5 |
| Process, plant and machine operatives | 2 |
| Skilled trades occupations | 1 |
Source: Graduate Route Evaluation[footnote 43]
118. The changes to the Graduate route are designed to minimise the impact on RQF6+ workers who can switch into the Skilled Worker route while providing less time for those undertaking no or lower skilled work to remain in the UK.
119. As set out above, high-skilled migrants who do work at RQF6+ have a positive, and larger, impact on productivity than lower skilled migrants. Evidence by Manning et al,[footnote 44] also suggests high levels of net migration could lead to a reduction in training participation amongst workers, with the effect more pronounced at lower skill levels. This evidence suggests employers might choose hiring overseas workers as a cost-minimisation strategy, particularly where ready-trained migrant workers exist. Restricting lower skilled migration could provide incentives for employers to invest in the upskilling of the domestic population, with a body of academic literature showing the positive association between investment in training and growth.
120. Beyond the impacts that are monetised below, there are also therefore likely to be second order effects on productivity, training and investment which drive the rationale for changes.
Integration benefits of English Language Requirements
121. According to the 2021 census, 90 per cent of migrants living in England or Wales self-reported speaking English without difficulty with 52 per cent reporting speaking English as their main language. However, for more recent arrivals who moved to the UK within the previous two years, who might be expected to have a lower quality of English, only 83 per cent of migrants self-reported speaking English without difficulty.
122. The ability to communicate is essential for all social connections including, crucially, with host communities and with state and other agencies such as local government and non-government services as well as being able to perform civic duties. Without adequate language skills, there is a risk of isolation as well as poor integration. Between 2014 and 2016, more than a quarter (28%) of foreign-born adults who only have friends of the same ethnicity risk social isolation from British society.
123. People who could not speak English are less likely to be employed. In the 2021 Census, just under 70 per cent of migrants who were proficient in English were either employed or self-employed, compared to 50 per cent of those who could not speak English well or at all. In addition to having higher employment rates, migrants with good English language skills tend to work in jobs requiring a higher level of skills. For example, 9 per cent of migrants who spoke English as a main language worked in low-skill roles in 2021, compared to 40 per cent of migrants who could not speak English well or at all.
Figure 4: Skill level of migrant workers’ job by English language proficiency
| English proficiency group | High-skill | Medium-high | Medium-low | Low skill |
|---|---|---|---|---|
| English | 37 | 23 | 30 | 9 |
| Other main – can speak English very well or well | 24 | 22 | 35 | 20 |
| Other main – cannot speak English well or not at all | 4 | 24 | 31 | 40 |
Source: Migration Observatory analysis of ONS Census.
Source: Migration Observatory analysis of ONS Census
124. By raising the standard of ELR, there are therefore likely to be wider integration and spillover impacts not captured in the monetised impacts below which underpin the rationale for the changes. This could include an increased likelihood to progress within an occupation to a more highly skilled role as well as making a wider contribution by integrating into the labour market and into a fuller participation in their local community.
Monetised impacts
Costs
Set-up costs
125. There are no set-up costs identified in association to Option 1. Transitional impacts are assumed to be negligible. No capital investment is required to implement the changes.
126. Home Office IAs have in the past, including in the 2024 Immigration Rules changes,[footnote 45] quantified private sector familiarisation costs. In this example where the changes to Rules represented a 16 per cent change in the total volume of words in the sponsored work guidance documents, the overall cost was estimated at around £1.5 million (2024/25 prices) in the central case.
127. While this package of measures affects a greater number of routes, familiarisation costs are assumed to be negligible in the context of the other costs and benefits identified.
Ongoing costs
Indirect costs relating to the policy changes that reduce inflow volumes (Graduate, English Language Requirement, Immigration Skills Charge)
Loss of tuition fee revenue
128. A fall in the number of international students no longer coming to the UK due to the shortening of the Graduate route would lead to a fall in revenue for domestic education institutions collected from tuition fees. This impact is quantified by considering the average tuition fee for international students.
129. The cost to the education sector is estimated to amount to up to -£2.3 billion, with a central estimate of -£1.1 billion (PV, 2025/26 prices) over the appraisal period.
Loss of tax revenue to the Exchequer
130. Any decrease in the number of migrants may result in a loss to the Exchequer in the form of reduced fiscal contributions, due to a reduction in direct and indirect tax payments made by fewer individuals in the UK. Reforms to the Graduate route alongside the ISC increase and changes to ELR are likely to decrease the number of migrants. The Exchequer loss is calculated as the change in granted volumes on affected routes multiplied by the average fiscal revenue contributions for each visa route.
131. This is derived using a bottom-up approach to estimate the expected contribution to direct and indirect taxes from migrants based on individual characteristics and data on their earnings and spending patterns set out in the previous section.
132. The decrease in volumes across the Student, Graduate, and Work routes as a result of the relevant policy changes results in a loss to the Exchequer estimated at up to -£5.3 billion, with a central estimate of -£2.3 billion and a low of -£0.4 billion (PV, 2025/26 prices) over the appraisal period.
Loss of visa application revenue to the Home Office
133. A reduction in visa applications (as a consequence of the assumed behavioural responses of applicants) is assumed to result in foregone Home Office revenue. This loss in revenue is quantified by multiplying the estimated reduction in the volume of applications granted on the Student, Graduate, and Work routes by the associated fee.
134. Changes in revenue collected through sponsorship and ISC fees are not captured, as such revenue is a transfer between the private and public sectors; these impacts are discussed in the transfers section below.
135. The Graduate, ELR and ISC policy changes lead to a net decrease in volumes which could result in loss of Home Office revenue of up to -£0.14 billion, with a central estimate of -£0.06 billion (PV, 2025/26 prices) over the appraisal period.
Loss of Premium Service revenue
136. It is assumed that the policy would not impact the overall composition of migrants applying for Priority or Super Priority services. As a result of the reduction in standard application volumes, there is estimated to be a corresponding proportion of visa applicants using the Priority and Super Priority service who are assumed to no longer use the service and will lead to a reduction in Home Office revenue.
137. The Graduate, ELR and ISC policy changes lead to a net decrease in volumes which could result in loss of Home Office premium service revenue of up to -£0.02 billion, with a central estimate of -£0.01 billion (PV, 2025/26 prices) over the appraisal period.
Loss of Immigration Health Surcharge revenue
138. A fall in visa grants is assumed to result in lost IHS revenue, which is collected by the Home Office and attributed to the Department for Health and Social Care. The loss of IHS revenue is calculated as the product of the change visas on the Student, Graduate, and Work routes, the current IHS level, and internal Home Office data on average length of visas granted per individual route.
139. The cost to the government from the reduction in IHS revenue due to the reduction in visa volumes is estimated to amount to up to £0.4 billion, with a central estimate of £0.2 billion (PV, 2025/26 prices) over the appraisal period.
Indirect costs relating to the policy changes that increase inflow volumes (High Potential Individual, Global Talent)
Increase in public service pressure
140. Any increase in the number of migrants may result in a loss to the Exchequer in the form of increased fiscal pressure, due to an increase in demand for public services. Reforms to the HPI route alongside the Global Talent increase are likely to increase the number of migrants. The Exchequer loss is calculated as the change in granted volumes on affected routes multiplied by the average fiscal pressure for each visa route.
141. This is derived using a bottom-up approach to estimate the expected cost of migrants based on individual characteristics and data on their age distribution.
142. The increase in volumes across HPI and Global Talent routes as a result of the relevant policy changes results in a loss to the Exchequer estimated between -£1.1 billion and -£0.6 billion, with a central estimate of -£0.8 billion (PV, 2025/26 prices) over the appraisal period.
Increased cost of processing visa and priority service applications
143. A higher number of visa applications from policy changes in Global Talent and HPI routes would lead to a rise in processing costs incurred by the Home Office. This impact is quantified by multiplying the published unit cost for each visa product by the change in applicants following the behavioural response.
144. The administrative cost to the Home Office is estimated to be up to £0.02 billion, with a central estimate of £0.02 billion (PV, 2025/26 prices) over the appraisal period.
Increase in Home Office Immigration Health Surcharge processing costs
145. A final set of administrative costs to the Home Office results from a rise in processing costs for applications on routes in scope of the IHS. This impact calculated by multiplying internal Home Office estimates of IHS processing cost by the increase in applicants on liable routes, accounting for the average length of visas issued on each route. The payment of IHS applications is processed by a third party.
146. The Home Office is estimated to incur additional ISC and IHS processing costs of less than £0.01 billion (PV, 2025/26 prices) over the appraisal period.
Total Costs
147. Total costs are the sum of all direct and indirect costs, not including transfers. Total costs are estimated to range between £1.5 billion and £8.7 billion, with a central estimate of £4.5 billion (PV, 2025/26 prices) over the appraisal period.
Benefits
Set-up benefits
148. There are no set-up or transitional benefits identified to arise from the proposed policy changes.
Ongoing benefits
Indirect benefits relating to the policy changes that reduce inflow volumes (Graduate, English Language Requirement, Immigration Skills Charge)
Reduction in public service pressure
149. Any decrease in the number of migrants may result in a gain to the Exchequer in the form of decreased demand for public services. Reforms to the graduate route alongside the ISC increase and changes to ELR are likely to decrease the number of migrants. The Exchequer gain is calculated as the change in granted volumes on affected routes multiplied by the average demand for public services for each visa route.
150. This is derived using a bottom-up approach to estimate the expected cost of migrants based on individual characteristics and data on their age distribution.
151. The decrease in volumes across the Student, Graduate, and Work routes as a result of the relevant policy changes results in a saving to the Exchequer estimated at up to £1.2 billion, with a central estimate of £1.0 billion and a low of £0.2 billion (PV, 2025/26 prices) over the appraisal period.
Reduction in Home Office visa processing costs
152. A lower number of visa applications from policy changes in student, graduate, ISC and ELR affected routes would lead to a fall in processing costs incurred by the Home Office. This impact is quantified by multiplying the published unit cost for each visa product by the change in applicants following the behavioural response.
153. The administrative saving to the Home Office is estimated to be up £0.04 billion, with a central estimate of £0.02 billion (PV, 2025/26 prices) over the appraisal period. (PV, 2025/26 prices) over the appraisal period.
Reduction in Home Office Certificate of Sponsorship and Confirmation of Acceptance for Studies processing costs
154. As well as processing fewer applications by individuals, the Home Office incurs a cost of processing CoS applications per eligible worker and CAS application per international student. As with visa processing costs, this impact is calculated by multiplying the CoS and CAS unit costs by the lower volumes of sponsored skilled workers and international students, respectively, and the change in applications by individuals under this route.
155. The administrative benefit to the Home Office is estimated at less than £0.01 billion (PV, 2025/26 prices) over the appraisal period
Reduction in Home Office Immigration Skills Charge and Immigration Health Surcharge processing costs
156. A final set of administrative benefits to the Home Office results from a fall in processing costs for applications on routes in scope of the ISC and the IHS. The impact on the fall in ISC processing costs is calculated by multiplying internal Home Office estimates of ISC by the reduction in applicants on work routes. The impact on the fall in IHS processing costs is estimated in a similar manner but accounting for the average length of visas issued on each route. The payment of ISC and IHS applications is processed by a third party.
157. The Home Office is estimated to benefit from reduced ISC and IHS processing costs less than £0.01 billion (PV, 2025/26 prices) over the appraisal period.
Indirect benefits relating to the policy changes that increase inflow volumes (High Potential Individual, Global Talent)
Gain in tax revenue to the Exchequer
158. Any increase in the number of migrants may result in a gain to the Exchequer in the form of increased fiscal contributions, due to an increase in direct and indirect tax payments made by more individuals in the UK. Reforms to the HPI route alongside the ambition to double volumes on the Global Talent route are very likely to increase the number of migrants in the UK. The Exchequer gain is calculated as the change in granted volumes on affected routes multiplied by the average fiscal revenue contributions for each visa route.
159. This is derived using a bottom-up approach to estimate the expected contribution to direct and indirect taxes from migrants based on individual characteristics and data on their earnings and spending patterns set out in the previous section.
160. If visa volumes across the HPI and Global Talent routes increased because of the relevant policy changes, the resulting gain to the Exchequer is estimated to be up to £2.8 billion, with a central estimate of £2.1 billion and a low of £1.7 billion (PV, 2025/26 prices) over the appraisal period.
Increase in visa application revenue to the Home Office
161. An increase in visa applications (as a consequence of the assumed behavioural responses of applicants) is assumed to result in an increase in Home Office revenue. This gain in revenue is quantified by multiplying the estimated increase in the volume of applications granted on the HPI and Global Talent routes by the associated current fee.
162. Changes in revenue collected through sponsorship and ISC fees are not captured, as such revenue is a transfer between the private and public sectors; these impacts are discussed in the transfers section below.
163. The HPI and Global Talent policy changes causes a net increase in volumes which could result in a gain of Home Office revenue of up to £0.04 billion, with a central estimate of £0.04 billion (PV, 2025/26 prices) over the appraisal period.
Increase in Premium Service revenue
164. It is assumed that the policy would not impact the overall composition of migrants applying for Priority or Super Priority services. As a result of the increase in standard application volumes, there is estimated to be a corresponding proportion of visa applicants using the Priority and Super Priority service who are assumed to no longer use the service and will lead to a rise in Home Office revenue.
165. The HPI and Global Talent policy changes causes a net increase in volumes which could result in a rise of Home Office premium service revenue of up less than £0.01 billion (PV, 2025/26 prices) over the appraisal period.
Gain in Immigration Health Surcharge revenue
166. A rise in visa grants is assumed to result in a gain in IHS revenue, which is collected by the Home Office and attributed to the Department for Health and Social Care. The gain in IHS revenue is calculated as the product of the change visas on HPI and global talent routes, the current IHS level, and internal Home Office data on average length of visas granted per individual route.
167. The benefit to the government from the increase in IHS revenue due to the change in visa volumes is estimated to amount to up to £0.14 billion, with a central estimate of £0.13 billion (PV, 2025/26 prices) over the appraisal period.
Total benefits
168. Total benefits are the sum of all direct and indirect benefits, not including transfers. Total benefits are estimated to be between £2.1 billion and £4.3 billion, with a central estimate of £3.3 billion (PV, 2025/26 prices) over the appraisal period.
Transfers
169. Some of the impacts from the policy proposal represent a transfer between domestic parties where a cost incurred on one side is fully absorbed as a benefit received by another. Transfer payments may change distributions of income or wealth of the resident population, but do not give rise to direct economic costs and benefits; such impacts are not counted in the NPSV of the option considered. Such transfer impacts are outlined below.
Change in CAS and CoS liability from behavioural response
170. Domestic businesses sponsoring workers and education institutions sponsoring international students could incur lower costs from the estimated decrease in applications across sponsored work routes and the study route. This is quantified as the product of the CoS or CAS fee and the change in granted visas. The benefit to organisations represents a reduction in the transfer of revenue from the public sector, at a magnitude of less than £0.01 billion (PV, 2025/2026 prices) over the appraisal period.
Change in Immigration Skills Charge liability
171. Domestic businesses sponsoring workers under ISC-liable routes could face a reduction in costs (a benefit) from a future fall in visas resulting from shortening the Graduate route (this cohort are not ISC liable), ELR (affecting skilled workers and global business mobility) and the behavioural response from an increase in the ISC. This is calculated by multiplying the old weighted average ISC fee by the estimated reduction in eligible visas granted. The reduction in ISC liability represents a direct transfer of revenue from the public sector to business at scale of up to £0.03 billion, with a central estimate of £0.02 billion (PV, 2025/26 prices) over the appraisal period.
172. The volume changes in HPI and global talent do not affect ISC costs and revenues as these routes are not subject to the ISC.
173. The remaining domestic businesses who are expected to continue sponsoring a worker would face an increase in costs from a higher ISC. This is calculated by multiplying the new weighted average ISC fee by the estimated remaining stock after behavioural responses in eligible visas granted. The increase in ISC liability represents a direct transfer of revenue from the businesses to the public sector at scale of up to £0.85 billion with a central estimate of £0.68 billion (PV, 2025/26 prices) over the appraisal period.
174. The net impact of these two effects is an increase in the direct transfer of revenue from the businesses to the public sector at scale of up to £0.81 billion with a central estimate of £0.67 billion (PV, 2025/26 prices) over the appraisal period.
NPSV, BNPV, EANDCB
175. The Net Present Social Value (NPSV) captures the expected net economic benefit to society over the appraisal period and are the present value of the future costs and benefits to UK society discounted over the 5-year appraisal period by the appropriate Green Book social time preference rate of 3.5 per cent.[footnote 46]
176. The central estimate for the NPSV of policy changes is estimated at -£1.2 billion (2025/26 prices) over the 5-year appraisal period, and between -£4.4 billion and +£0.6 billion in the low and high scenarios as set out in Table 21.
Table 21. Costs, benefits and NSPV of changes, in low, central and high scenarios (summed across appraisal period, discounted, 2025/26 prices, £ billion)
| Low | Central | High | |
|---|---|---|---|
| Costs | |||
| Relating to the policy changes that reduce inflow volumes (Graduate, EL, ISC) | |||
| Loss of tuition fee revenue | 0.00 | -1.13 | -2.26 |
| Reduction in tax income | -0.44 | -2.30 | -5.26 |
| Reduction in visa fee and IHS revenue | -0.01 | -0.23 | -0.52 |
| Relating to the policy changes that increase inflow volumes (HPI, Global Talent) | |||
| Increase in public services pressure | -1.06 | -0.84 | -0.61 |
| Increase in visa fee and IHS processing costs | -0.02 | -0.02 | -0.02 |
| Total | -1.53 | -4.52 | -8.67 |
| Benefits | |||
| Relating to the policy changes that reduce inflow volumes (Graduate, EL, ISC) | |||
| Reduction in public services pressure | 0.23 | 1.03 | 1.24 |
| Reduction in visa fee and IHS processing costs | 0.00 | 0.02 | 0.05 |
| Relating to the policy changes that increase inflow volumes (HPI, Global Talent) | |||
| Increase in tax income | 1.74 | 2.12 | 2.82 |
| Increase in visa fee and IHS revenue | 0.15 | 0.17 | 0.18 |
| Total | 2.12 | 3.34 | 4.29 |
| NPSV | |||
| Total | 0.59 | -1.18 | -4.38 |
Source: Home Office internal analysis
Table 22. Annual costs, benefits and NSPV of changes, central scenarios, discounted, 2025/26 prices, £ billion)
| 2025/26 | 2026/27 | 2027/28 | 2028/29 | 2029/30 | 2030/31 | |
|---|---|---|---|---|---|---|
| Costs | ||||||
| Relating to the policy changes that reduce inflow volumes (Graduate, ELR, ISC) | ||||||
| Loss of tuition fee revenue | -0.05 | -0.19 | -0.22 | -0.25 | -0.23 | -0.19 |
| Reduction in tax income | -0.04 | -0.22 | -0.41 | -0.53 | -0.58 | -0.53 |
| Reduction in visa fee and IHS revenue | -0.01 | -0.04 | -0.05 | -0.05 | -0.06 | -0.03 |
| Relating to the policy changes that increase inflow volumes (HPI, Global Talent) | ||||||
| Increase in public services pressure | -0.04 | -0.11 | -0.16 | -0.19 | -0.19 | -0.16 |
| Increase in visa fee and IHS processing costs | 0.00 | 0.00 | 0.00 | 0.00 | 0.00 | 0.00 |
| Total | -0.14 | -0.56 | -0.84 | -1.02 | -1.06 | -0.91 |
| Benefits | ||||||
| Relating to the policy changes that reduce inflow volumes (Graduate, ELR, ISC) | ||||||
| Reduction in public services pressure | 0.03 | 0.12 | 0.19 | 0.23 | 0.25 | 0.21 |
| Reduction in visa fee and IHS processing costs | 0.00 | 0.01 | 0.00 | 0.00 | 0.00 | 0.00 |
| Relating to the policy changes that increase inflow volumes (HPI, Global Talent) | ||||||
| Increase in tax income | 0.09 | 0.27 | 0.40 | 0.47 | 0.48 | 0.41 |
| Increase in visa fee and IHS revenue | 0.02 | 0.04 | 0.03 | 0.03 | 0.03 | 0.01 |
| Total | 0.14 | 0.43 | 0.62 | 0.74 | 0.77 | 0.63 |
| NPSV | ||||||
| Total | 0.00 | -0.12 | -0.21 | -0.27 | -0.30 | -0.27 |
Source: Home Office internal analysis
177. The Business Net Present Value (BNPV) accounts for estimated quantified impacts that affect businesses. Aside from impacts on business identified in the NPSV above, the BNPV also reflects changes in the incidence of transfers where that has a net impact on business. As such an additional business benefit resulting in an estimated reduction in transferred CoS and ISC fee revenue from business to the public sector, as set out in the “Transfers” section is included in the BNPV, but not the NPSV. However, the main driver relates to additional indirect costs to higher education institutions from a reduction in tuition fee revenue.
178. The central estimate for the BNPV of the policy changes is estimated at -£1.8 billion (PV 2025/26 prices) over the 5-year appraisal period.
179. The only identified direct cost to business is the additional increase in ISC revenue transferred from business to the public sector relating to the direct increase in the fee. The net direct cost to business per year (EANDCB) is therefore estimated at £0.14 billion (undiscounted, 2025/26 prices)
Impact on micro, small and medium-sized businesses
180. Micro-sized institutions have fewer than 10 employees, small organisations are defined as those employing between 10 and 49 full-time equivalent (FTE) employees, whereas medium businesses hire between 50 and 249 people on a full-time basis
Graduate route changes
181. In the Higher Education (HE) sector, organisation size is traditionally based on student population, as it is considered more relevant for most policy questions than the number of total employees. However, based on the definition above on the number of employees, data from the Higher Education Statistics Agency show that an average HE institution which sponsors international students hired 1,375 staff on a full-time basis in academic year 2023/2024.[footnote 47]
182. The majority of HE sponsors in academic year 2023/2024 (74 per cent) hired 250 or more full-time employees. Of the remaining sponsors, 4 per cent were micro, 9 per cent were small, and 12 per cent were medium-sized.
183. It is highly uncertain whether the organisation size composition of those organisations that sponsor the students assumed to be affected by this policy change follow the distribution of the HE sector. Ultimately, any fall in demand for student visas in response to shortening the Graduate Route to 18 months will depend on the distribution of impacted students across education institutions which may be course-specific or sector-specific, but initial data suggests only the minority of businesses affected will be micro, small or medium in size.
Changes affecting sponsored work routes
184. While not specific to those affected by these policy changes, for the period October 2024 to March 2025, around 80 per cent of those joining the Skilled Worker route (and still eligible following the July 2025 Immigration Rules changes) were estimated to be sponsored by a medium, small or micro business, as were around 60 per cent of workers sponsored on the Health and Care route.
185. It would not be possible to apply differential requirements based on the size of business without complicating the system and undermining its policy objectives. It could also create perverse incentives, for example for larger organisations to structure their sponsor licensing as several smaller organisations, to benefit from preferential policies.
186. The Home Office does, however, provide support to smaller sponsors where possible – including through lower licence application fees and a reduced ISC. The evidence required from sponsors, and the systems which they must have in place to manage their sponsor duties, are also designed to be flexible – these can be appropriate to the size of the organisation, rather than “one size fits all”.
Sensitivity analysis
187. The NPSV estimates of Option 1 are constructed varying combinations of low, central, and high assumptions on baseline application volumes, individuals’ behavioural response to each policy component, fiscal revenue and public service pressure.
188. This subsection incorporates a set of sensitivity measures against the central scenarios of any remaining assumptions.
All Changes
Public service provision
189. The level of average cost of public service provision to migrants is uncertain, so sensitivity analysis tests how various estimates of the value of average public service consumption by migrants affects the NPSV. The difference between the low and high scenario is the inclusion of pure public goods and welfare costs in the estimate; the central case does not include pure public goods and includes half of the estimated welfare cost, as not all migrants may be eligible to receive welfare payments.
190. Assuming public spending at the low scenario, the NPSV in the central scenario of the policy increases by £0.2 billion, from -£1.2 billion to -£1.0 billion (PV, 2025/26 prices). This result implies that the government saves more as a result of migrants being deterred from coming to the UK.
191. Assuming public spending at the high scenario, the NPSV of the policy in the central scenario decreases by £0.02 billion. This result implies that the government saves less as a result of migrants being deterred from coming to the UK.
Fiscal revenue
192. The level of the average fiscal revenue collected from migrants is also uncertain, so sensitivity analysis has been carried out to generate a range around the estimated impact on the Exchequer. All scenarios include estimated contributions of foreign nationals to income tax, national insurance, indirect tax (such as VAT), council tax, and corporation tax. The central scenario incorporates business rates, and the high scenario adds gross operating surplus and other taxes.
193. Assuming fiscal revenue collection at the low scenario, the NPSV in the central scenario of the policy increases by £0.1 billion, from -£1.2 billion to -£1.1 billion (PV, 2025/26 prices). This result implies that the government loses less tax revenue as a result of migrants being deterred from entering or remaining in the UK.
194. Assuming fiscal revenue collection at the high scenario, the NPSV in the central scenario of the policy decreases by -£0.2 billion, from -£1.2 billion to -£1.4 billion (PV, 2025/26 prices). This result implies that the government foregoes more tax revenue as a result of migrants being deterred from entering or remaining in the UK by the higher visa fees
Graduate route
Fall in immediate term student visa demand
195. As the Graduate route policy change would impact applicants from January 2027, the NPSV accounts for the fall in student visa demand from January 2026. However, there may be an additional impact in the immediate term from applicants who wish to pursue an undergraduate degree in 2025.
196. To account for this possibility, additional analysis has been carried out on the estimated cohort of undergraduate students applying for a visa between July and December 2025. Due to the likelihood that this cohort will have already applied to a course at a domestic higher education institution, it is not anticipated that a potential impact of being dissuaded from coming to study in the UK would be significant. However, some may have made alternative decisions on publication of the white paper.
197. In the absence of detailed evidence, the analysis assumes that this additional fall in demand could be half of that of the central scenario (1.75 per cent). This translates to approximately 1,600 fewer undergraduate students in 2025 only. As this represents a relatively small additional impact over the appraisal period, this impact has not been quantified further.
No student replacement effect
198. Across each scenario, this IA assumes a replacement effect of 20 per cent for students in Year 2, increasing to 30 per cent from Year 3 onwards. This sensitivity sets out the impact of not directly accounting for any potential behavioural response of universities and business as a result of the Graduate route changes, such as whether they adjust their recruitment practises to mitigate the potential reduction in students.
199. If the impact of the Graduate route changes on student demand had a 0 per cent replacement effect in the central case the NPSV would decrease by -£0.7 billion to -£1.9 billion (PV, 2025/26 prices) over the appraisal period.
Baseline volumes increase
200. For the student and graduate changes, the baseline volumes are not varied across the main scenarios. This sensitivity sets out the impact if baseline volumes were 25 per cent higher in the high scenario alongside a 0 per cent student replacement effect.
201. If baseline volumes were 25 per cent higher in the high scenario the NPSV would decrease by -£3.7 billion (PV, 2025/26 prices) over the appraisal period.
Global Talent
202. In isolation, the changes the to the Global Talent route set out in this IA, excluding the implementation of the Global Talent Taskforce, are unlikely to double volumes. While the central scenario in the IA remains the most appropriate scenario to reflect the wider changes the government intends to make, it is useful to include a sensitivity to reflect the impact of the changes in the Immigration Rules in isolation.
203. As such, a sensitivity has been constructed where the increase to Global Talent volumes is only 25 per cent of current volumes, equivalent to around 1,000 main applicants and 700 dependants per year.
204. In this scenario, the NPSV decreases by -£0.7 billion, from -£1.2 billion to -£1.9 billion (PV, 2025/26 prices).
Risks and assumptions
205. All estimates presented are indicative. The analysis serves to provide a sense of scale and estimated impacts should be read in that context; estimated future behaviour and outcomes are particularly uncertain. The main identified risks of the analysis are outlined below.
Volumes and behavioural responses
206. The visa demand volume estimates used as a baseline for the appraisal and the subsequent analysis on the behavioural response to the changes are subject to significant uncertainty. This has been highlighted throughout the IA and the scenarios have been chosen to produce a wider range of the potential impact of the policy. However, all results, including calculated changes in the volumes of granted visas and NPSV estimates, should be treated with caution.
Fiscal impact
207. The fiscal impact related to changes in volumes is particularly uncertain. This IA uses a marginal approach of measuring the impact of migration policy on the UK Exchequer and excludes fiscal spend and revenue components that are unlikely to vary according to the number of individuals moving to the UK. Under the marginal approach, newly arrived migrants are assumed to have little or no impact on spending on services such as pure public goods and debt interest, or on revenue streams such as capital gains tax, inheritance tax and gross operating surplus. They are assumed to have an impact on congestible public goods and taxes paid by businesses such as corporation tax and business rates. These assumptions are uncertain and the true fiscal impact of such a migrant may differ, either positively or negatively.
208. Impact assessments are intended to measure the impact on public welfare and are not an official government macroeconomic/fiscal forecast. The fiscal analysis in this IA also does not reflect the methodology used by the OBR, the government’s official economic and fiscal forecaster, to assess the impact of migration on the overall fiscal position of the UK.
Wider assumptions
209. Some assumptions, for example length of stay and visa grant rates, are based on evidence from recent years. The behaviour of current and prospective visa holders may not mirror those in the past. Varying fiscal, baseline and behaviour assumptions may help account for some of the wider uncertainties from data.
Trade implications
210. There are a number of channels through which immigration may affect trade and, in general, the external literature finds a positive relationship between the stock of immigrants and trade. At a macro-level high immigration to the UK increases the UK population and consequently aggregate demand and the demand for imports. UK exports may also increase if immigration can enhance the international competitiveness of the UK. For example, Gould (1994)[footnote 48] argues that immigrants have individual-specific knowledge of home-country markets which could enhance trading opportunities. For example, immigrants may have a greater a knowledge of foreign languages which helps improve communication in trading relationships, and immigrants may have a greater understanding of legal arrangements which may help lower the fixed costs of trade.
211. Other mechanisms through which immigrants may affect trade include a preference for home-country goods, which could increase the demand for UK imports through an increase in consumption.
212. As outlined above, while not negligible, the expected change in the stock of migrants in any appraisal year as a result of the preferred option is small compared to the total stock of migrants resident in the UK. Therefore, any trade impacts are be expected to be small.
Environment: Natural capital impact and decarbonisation
213. The estimated change in visas granted following the implementation of all policies in Option 1 could be interpreted as a change in the demand for travel to the UK, resulting in a change in carbon dioxide equivalent (CO2e) emissions. As this impact is relatively small, no further quantification has been undertaken as part of this IA.
Annex A
Mandatory specific impact test - Statutory Equalities Duties
Statutory Equalities Duties
An initial Equalities Impact Assessment has been carried out in respect of increasing the ISC by 32 per cent. This identified no direct discrimination, but potential indirect impacts, as the increase may encourage employers to increase international recruitment from the Student visa route, where an ISC exemption applies. The assessment identified the proportion of Student visa holders who share certain protected characteristics in relation to age, disability, race and sex, who may benefit from the increase. Any such indirect impacts were considered justified for the legitimate policy objective of encouraging employers to consider training and skills for domestic workers and to support wider skills programmes.
An initial Equalities Impact Assessment has been carried out in respect of changes to expand the HPI Route. This identified direct discrimination as the policy restricts access to the route to individuals aged 18 or above at the time of application. However, Schedule 3 of the Equality Act 2010 permits direct discrimination on the basis of age in relation to the exercise of functions by ministers or other authorised persons under the Immigration Acts. Such discrimination is considered justified for the legitimate policy objective of requiring applicants to have attained a higher-education qualification. Potential indirect impacts on the basis of age were noted, as the HPI route focuses on those at an earlier stage of their career. Therefore, older applicants who would generally be more advanced in their careers may be indirectly discriminated against. Also noted were potential indirect impacts on the basis of disability and race, as the HPI route requires applicants to have an elite level qualification from a top educational institution.
An initial Equalities Impact Assessment has been carried out in respect of changes to ELR. This noted potential impacts in relation to those with disabilities which either affect a persons’ ability to acquire the required competencies, or to comply with requirements to attend testing centres in order to evidence them. These issues will continue to be considered as the detail of arrangements to implement the planned changes (and those in respect of dependants of workers and students in particular) are developed.
An initial equalities impact assessment has been carried out in respect of shortening the Graduate route to 18 months and reviewing the course provider accreditation arrangements on the Short-term Student (STS) route. This identified no direct discrimination, but potential indirect impacts on the basis of race were noted as use of both Graduate and STS routes is particularly prevalent by particular nationalities (Indian nationals for Graduate, Kuwait and Pakistan for STS). These nationalities are therefore statistically more likely to be affected by these changes. Any such impacts were considered justified for the legitimate policy aim of reducing net migration, tackling exploitation and abuse and ensuring graduates are contributing to the economy.
An initial Equalities Impact Assessment has been carried out in respect of expanding the list of qualifying fellowships on the Global Talent fellowship fast-track pathway to include institutional fellowships. This identified no new direct discrimination, it also noted potential indirect impacts on the basis of age, as to qualify under this fast-track pathway, individuals are required to have completed a PhD and have been awarded a qualifying fellowships within the last 5 years.
The SRO has agreed these summary findings.
Complete
Yes
Annex B
Table B1: Estimated change in the stock (main applicants and dependants). Low estimate only.
| Visa type | 2025/26 | 2026/27 | 2027/28 | 2028/29 | 2029/30 | 2030/31 |
|---|---|---|---|---|---|---|
| Estimated increase in the stock of migrants following HPI and Global Talent expansion | ||||||
| HPI Main Applicant | 1,000 | 4,000 | 4,000 | 5,000 | 5,000 | 5,000 |
| HPI Dependant | 200 | 500 | 500 | 600 | 600 | 600 |
| Global Talent Main Applicant | 2,000 | 5,000 | 9,000 | 12,000 | 12,000 | 12,000 |
| Global Talent Dependant | 1,000 | 4,000 | 7,000 | 8,000 | 8,000 | 8,000 |
| Estimated decrease in the stock of migrants following Graduate route shortening, ISC increase and raised ELR | ||||||
| Work Routes (English Language) Main Applicant | -100 | -500 | -1,000 | -1,000 | -2,000 | -2,000 |
| Work Routes (English Language) Dependant | -100 | -700 | -1,000 | -2,000 | -2,000 | -2,000 |
| Work Routes (ISC Increase) Main Applicant | - | - | - | - | - | - |
| Work Routes (ISC Increase) Dependant | - | - | - | - | - | - |
| Student Main Applicant | - | - | - | - | - | - |
| Student Dependent | - | - | - | - | - | - |
| Graduate Main Applicant | - | - | - | - | - | - |
| Graduate Dependant | - | - | - | - | - | - |
Source: Home Office analysis
Table B2: Estimated change in net migration per policy (main applicants and dependants). Low estimate only.
| Visa type | 2025/26 | 2026/27 | 2027/28 | 2028/29 | 2029/30 |
|---|---|---|---|---|---|
| Global Talent | 1,000 | 7,000 | 7,000 | 6,000 | 6,000 |
| HPI | 1,000 | 2,000 | 500 | 300 | 200 |
| English Language | -200 | -1,000 | -1,000 | -1,000 | -1,000 |
| ISC | - | - | - | - | - |
| Graduate Route Changes | - | - | - | - | - |
| Total | 2,000 | 8,000 | 7,000 | 5,000 | 5,000 |
Source: Home Office analysis
Table B3: Estimated change in the stock (main applicants and dependants). High estimate only.
| Visa type | 2025/26 | 2026/27 | 2027/28 | 2028/29 | 2029/30 | 2030/31 |
|---|---|---|---|---|---|---|
| Estimated increase in the stock of migrants following HPI and Global Talent expansion | ||||||
| HPI Main Applicant | 2,000 | 7,000 | 9,000 | 12,000 | 15,000 | 17,000 |
| HPI Dependant | 300 | 800 | 1000 | 1000 | 2000 | 2000 |
| Global Talent Main Applicant | 2,000 | 5,000 | 9,000 | 12,000 | 12,000 | 12,000 |
| Global Talent Dependant | 1,000 | 4,000 | 7,000 | 8,000 | 8,000 | 8,000 |
| Estimated decrease in the stock of migrants following Graduate route shortening, ISC increase and raised ELR | ||||||
| Work Routes (English Language) Main Applicant | -400 | -2,000 | -3,000 | -5,000 | -6,000 | -7,000 |
| Work Routes (English Language) Dependant | -500 | -2,000 | -4,000 | -6,000 | -8,000 | -9,000 |
| Work Routes (ISC Increase) Main Applicant | -600 | -3,000 | -5,000 | -6,000 | -7,000 | -8,000 |
| Work Routes (ISC Increase) Dependant | -600 | -3,000 | -4,000 | -5,000 | -6,000 | -6,000 |
| Student Main Applicant | -6,000 | -21,000 | -25,000 | -29,000 | -28,000 | -24,000 |
| Student Dependent | -200 | -700 | -700 | -700 | -700 | -500 |
| Graduate Main Applicant | - | -4,000 | -18,000 | -27,000 | -32,000 | -32,000 |
| Graduate Dependant | - | -200 | -1,000 | -1,000 | -1,000 | -1,000 |
Source: Home Office analysis
Table B4: Estimated change in net migration per policy (main applicants and dependants). High estimate only.
| Visa type | 2025/26 | 2026/27 | 2027/28 | 2028/29 | 2029/30 |
|---|---|---|---|---|---|
| Global Talent | 1,000 | 7,000 | 7,000 | 6,000 | 6,000 |
| HPI | 2,000 | 4,000 | 3,000 | 3,000 | 3,000 |
| English Language | -900 | -4,000 | -3,000 | -3,000 | -3,000 |
| ISC | -1,200 | -5,000 | -3,000 | -2,400 | -2,000 |
| Graduate Route Changes | -6,000 | -21,000 | -18,000 | -16,000 | -11,000 |
| Total | -5,000 | -19,000 | -14,000 | -12,000 | -7,000 |
Source: Home Office analysis
-
Restoring control over the immigration system White Paper. ↩
-
Sponsored work entry clearance visas by occupation and industry (SOC 2020), year ending June 2025). ↩
-
Reason for international migration, international students update, Office for National Statistics. ↩
-
Graduate Route Research – Insights into Graduate route users’ experiences. ↩
-
Long-term international migration, provisional - Office for National Statistics. ↩
-
Two thirds of Britons say the total number of people entering the UK is too high. ↩
-
UK Public Opinion toward Immigration: Overall Attitudes and Level of Concern - Migration Observatory - The Migration Observatory. ↩
-
Migration Advisory Committee, Analysis of the Impact of Migration (January 2012) ↩
-
Sponsored study visas by course level Immigration system statistics data tables - GOV.UK. “Unknown” assumed to be apportioned proportionately to the remaining categories. ↩
-
Sponsored study visas by course level Immigration system statistics data tables - GOV.UK. “Unknown” assumed to be apportioned proportionately to the remaining categories, excludes other categories. ↩
-
Some exemptions may apply. Exemptions are set out in UK visa sponsorship for employers: Immigration skills charge - GOV.UK. ↩
-
Immigration system statistics, year ending June 2025 - GOV.UK. ↩
-
Student route evaluation (wave 2) 73 per cent of the 66 per cent who aware of the Graduate route reported it influenced their decision by at least some extent (48%). As 29 per cent said they would not have come to the UK if the route was unavailable, this is equal to 14 per cent of surveyed student visa holders. ↩
-
Entry Clearance Visas - Applications and Outcomes, year ending June 2025. ↩
-
For institutions in OECD countries, assumptions are developed on the nationality distribution of international students in the OECD country. For institutions in China, Hong Kong and Singapore, data is drawn from other sources including UNESCO or proxy assumptions for other countries are made where no data is available. See here: OECD Data Explorer. ↩
-
Data taken from UN estimates on the international migrant stock in 2024. ↩
-
Inflows taken from published GOV.UK statistics on out of country visas (VIS_D02). ↩
-
Estimates taken from OECD data on the enrolment of international students by their country of origin. ↩
-
Sourced from Tables 5.3 (P170) and Annex 5.A (P188) in World Bank Document. ↩
-
A review of evidence relating to the elasticity of demand for visas in the UK – GOV.UK. ↩
-
In the upper net migration scenario, the analysis assumes a 76 per cent stay rate, based on findings from the HPI evaluation which look at the proportion of surveyed HPI visa holders intending to stay for longer than the duration of the current visa, or indefinitely. The 76 per cent stay rate is adjusted to remove any responses from individuals in the HPI evaluation, who stated that they were “not sure“ with regards to their intention to stay in UK longer than the duration of the current visa, or indefinitely. This could overstate the overall stay rate, given those switching onto other visa products may not necessarily stay indefinitely, and intentions might not reflect actual behaviour. In the lower net migration scenario, analysis is based on Migrant Journey data of visa holders on work routes (excluding Skilled Work and Health and Care visa holders). Given other work routes include visa holders on global business mobility routes – where visa holders might be less likely to remain long-term in the UK given the temporary nature of work undertaken on the route – this could understate the overall stay rate. ↩
-
“Pay for UK healthcare as part of your immigration application”, GOV.UK. ↩
-
Statement of changes to the Immigration Rules: HC 997, 1 July 2025 - GOV.UK. ↩
-
2025 Skilled Worker route evaluation 71 per cent represents an average of the Skilled Worker and Health and Care routes. ↩
-
High Potential Individual (HPI) route evaluation: Exploring experiences of the HPI visa - GOV.UK. ↩
-
Fiscal risks and sustainability – September 2024 - Office for Budget Responsibility. ↩
-
Earnings and hours worked, UK region by age group - Office for National Statistics. ↩
-
Migration Advisory Authority, EEA migration in the UK: Final report.PDF. ↩
-
International students boost UK economy by £41.9 billion - HEPI. ↩
-
Immigration and vocational training: Evidence from England. ↩
-
Table 1 - HE staff by HE provider and activity standard occupational classification 2014/15 to 2023/24. ↩
-
Gould (1994) ‘Immigrant Links to the Home Country: Empirical Implications for U.S. Bilateral Trade Flows’. ↩