Social mobility indicators
Updated 25 March 2015

© Crown copyright 2015
This publication is licensed under the terms of the Open Government Licence v3.0 except where otherwise stated. To view this licence, visit nationalarchives.gov.uk/doc/open-government-licence/version/3 or write to the Information Policy Team, The National Archives, Kew, London TW9 4DU, or email: psi@nationalarchives.gov.uk.
Where we have identified any third party copyright information you will need to obtain permission from the copyright holders concerned.
This publication is available at https://www.gov.uk/government/publications/social-mobility-indicators/social-mobility-indicators
1. Low birth weight
1.1 Indicator definition
Proportion of live births under 2,500 grams, by social background (defined most recently using parents’ occupational group based on the Office for National Statistics (ONS) NS-SEC (National Statistics Socio-economic Classification) framework, and previously by only mother’s occupational group).
1.2 Why is this indicator important to social mobility?
Evidence suggests that children with low birth weight (less than 2,500 grams) tend to have poorer developmental outcomes than those weighing more than 2,500g at birth. There is a strong link between social background and low birth weight.
1.3 How are we performing?
| 2005 | 2006 | 2007 | 2008 | 2009 | 2010 | 2011 | 2012 | 2013 | |
|---|---|---|---|---|---|---|---|---|---|
| More advantaged groups (NS-SEC 1-4) | 6.4% | 6.6% | 6.4% | 6.5% | 6.5% | 6.2% | 6.6% | 6.2% | 6.4% |
| Less advantaged groups (NS-SEC 5-8) | 8.7% | 8.2% | 7.7% | 7.9% | 7.3% | 7.3% | 7.1% | 7.5% | 7.7% |
| Gap (percentage points) | 2.3pp | 1.6pp | 1.3pp | 1.3pp | 0.8pp | 1.1pp | 0.5pp | 1.3pp | 1.3pp |
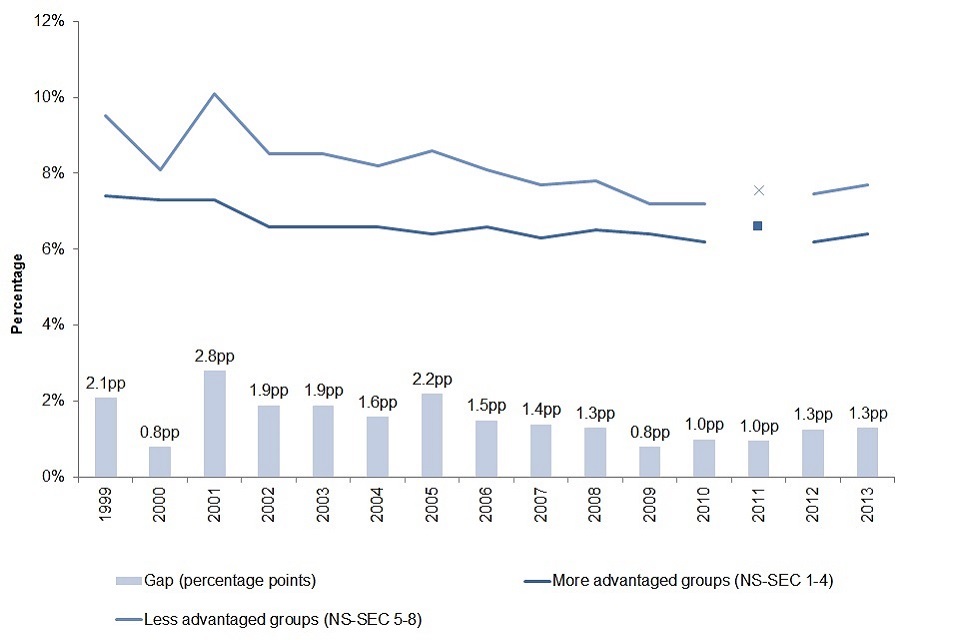
1. Chart showing differences in birth weights between more advantaged and less advantaged social groups
Notes on the data:
- In 2011, NS-SEC was rebased on the new Standard Occupational Classification (SOC2010). Compared with the SOC2000 NS-SEC a number of changes have resulted (Rose and Pevalin, 2010). A report providing more detail on the impact of rebasing NS-SC to SOC2010 for infant mortality statistics is available on the ONS website.
- From the 2012 data year ONS has used the combined method for reporting NS-SEC for birth statistics (using the most advantaged NS-SEC of either parent and creating a household level classification rather than just using the father’s classification). Data for 2012 is therefore not directly comparable to data for 2005 to 2011.
1.4 What will influence this indicator?
Key drivers of low birth weight related to social background include:
- maternal health and lifestyle (eg smoking, poor diet, depression)
- lack of access to and low uptake of antenatal care
1.5 How will we ensure progress is made?
Key policies include:
- ensuring early access to maternal care in the first 12 weeks of pregnancy
- improving access to antenatal care for women at risk – the Health and Social Care Act 2012 includes new health inequalities duties on access and outcomes in the NHS
- reducing the rate of smoking through pregnancy - the Tobacco Control Plan aims to reduce this to 11% of less by the end of 2015 and we are implementing NICE guidance for midwives on helping pregnant women to quit smoking
Further information
Data is published annually by the Office of National Statistics in the parental characteristics series:
- Further Parental Characteristics 2013 – Office of National Statistics (March 2015)
2. Early child development, by social background
2.1 Indicator definition
This is not yet available. A new metric, based on the forthcoming public health outcome measure of child development at age 2-2½, is being developed.
2.2 How are we performing?
Work has focused on developing a national public health outcome measure of child development at age 2-2½, which is marked as a placeholder in the Public Health Outcomes Framework and expected to report fully for the first time in February 2016, via the Children and Young People’s Health Services (CYPHS) dataset.
The outcome measure will report the percentage of children identified as showing development that is on schedule across 5 domains of child development (communication, gross motor skills, fine motor skills, problem solving and personal-social) at age 2-2½.
The next phase of work will consider how we can use the Data collected for the public health outcome measure of child development at age 2-2½ to report on children’s development at age 2 by social background.
The information collected for the CYPHS dataset will make it possible to:
- consider children’s development at age 2 by demographic and socio-economic background
- compare children’s development at age 2 across the population as a whole with specific groups
This will help to provide a better national picture of how social circumstances affect child development.
2.3 What will influence this indicator?
Key drivers include:
- maternal physical and mental health and lifestyle (eg smoking, poor diet, depression)
- parenting and the home learning environment (eg parent-child relationships, sensitive and responsive care giving and age appropriate development stimulation)
- material deprivation and poverty
2.4 How will we ensure progress is made?
Once the CYPHS data set is established, it will be possible to track trends in children’s development at age 2-2½ over time.
Key policies to help improve outcomes for children include:
- increased investment in the universal health visitor service, eg increasing the number of health visitors by 4,200 (50%) and the number of places on the Family Nurse Partnership programme to 16,000 by 2015
- the Two Year Old early education offer - up to 40% of disadvantaged 2-year-olds will be entitled to 15 hours a week of free, high-quality early education by 2014
- the Healthy Child Programme – a programme of screening, immunisation, health and development reviews provided to children
- introducing the Integrated Review at 2-2½ years by 2015 – bringing together health and early education reviews at age 2 to give a rounded view of a child’s development and needs
- the transfer of responsibility for public health commissioning for 0 to 5-year-olds to local authorities from October 2015, with the mandation of elements of the Healthy Child Programme (including the 2 year review) for a period of 18 months
Further information
Further information about our plans for developing this indicator can be found in the Public Health Outcomes Framework February 2015 update and in the Department of Health factsheet:
- Developing a public health outcome measure for children aged 2-2½ using ASQ-3™
- Public Health Outcomes Framework: February 2015 data update
- Children and Young People’s Health Services Data set published by the Health and Social Care Information Centre
3. School readiness
3.1 Indicator definition
Proportion of children achieving a ‘good level of development’ (GLD) in the Early Years Foundation Stage (EYFS), by free school meal (FSM) eligibility. Children are assessed as having reached a good level of development if they are assessed as reaching at least the expected level in the prime areas of learning (personal, social and emotional development; physical development; and communication and language) and in the specific areas of mathematics and literacy. The GLD changed when the revised EYFS was introduced in 2012.
3.2 Why is this indicator important to social mobility?
The level of school readiness is closely related to future educational attainment. There are significant gaps by social background in the level of school readiness.
3.3 How are we performing?
| 2006-07 | 2007-08 | 2008-09 | 2009-10 | 2010-11 | 2011-12 | 2012-13 | 2013-14 | |
|---|---|---|---|---|---|---|---|---|
| Pupils eligible for Free School Meals | 27.9% | 31.5% | 34.5% | 39.5% | 43.7% | 48.2% | 36.2% | 44.8% |
| All other pupils | 49.1% | 52.1% | 54.8% | 59.0% | 62.1% | 67.0% | 55.2% | 63.7% |
| Gap (percentage points) | 21.1pp | 20.6pp | 20.3pp | 19.5pp | 18.4pp | 18.8pp | 19.0pp | 18.9pp |
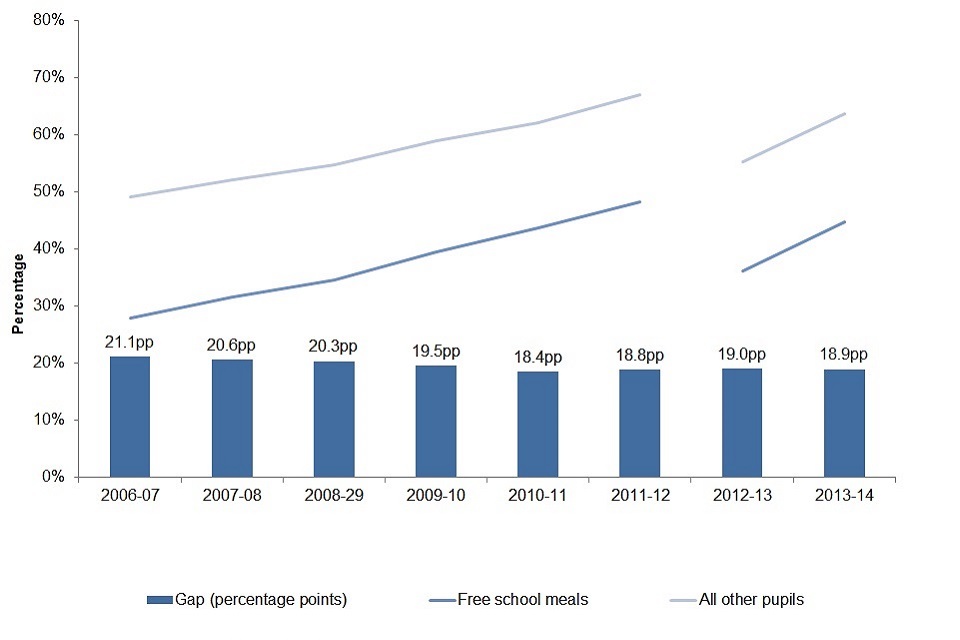
3. Chart comparing children achieving a “good level of development”
Note on the data: the Early Years Foundation Stage was revised and the new EYFS Profile was introduced in September 2012. The new profile has different content and assessment criteria, and is better aligned to key stage 1. For this reason, the data on numbers of children achieving a good level of development is not directly comparable with data for the years 2006 to 2012.
3.4 What will influence this indicator?
Key drivers include:
- family factors, eg parental education, maternal age, material deprivation, maternal and child health
- parental engagement and early home learning environment
- quality of early years settings
3.5 How will we ensure progress is made?
Key policies set out in ‘Families in the Foundation Years’ include:
- entitlement to 15 hours/week free childcare for disadvantaged 2-year-olds and all 3 and 4-year-olds
- reform of the Early Years Foundation Stage with a stronger focus on areas of learning and development crucial in preparing for primary school
- new ‘core purpose’ of Sure Start Children’s Centres to target the families with greatest needs more effectively
Further information
Data is published annually by the Department for Education in Early Years Foundation Stage Profile (EYFSP) by pupil characteristics in England:
- EYFSP attainment by pupil characteristics: 2013 to 2014 – Department for Education (November 2014)
4. School readiness - phonics screening check
4.1 Indicator definition
Proportion of Year 1 children meeting the expected standard in the phonics screening check, by free school meal eligibility.
4.2 Why is this indicator important to social mobility?
Children need to learn the basics of reading early in their education so they can access the whole curriculum and succeed in school. The pilot of the phonics screening check indicates that there are significant gaps in the phonic decoding ability of pupils eligible for free school meals compared to their peers at the end of Year 1.
4.3 How are we performing?
| 2011-12 | 2012-13 | 2013-14 | |
|---|---|---|---|
| Free school meals | 44% | 56% | 61% |
| All other pupils | 61% | 72% | 77% |
| Gap (percentage points) | 17pp | 16pp | 16pp |
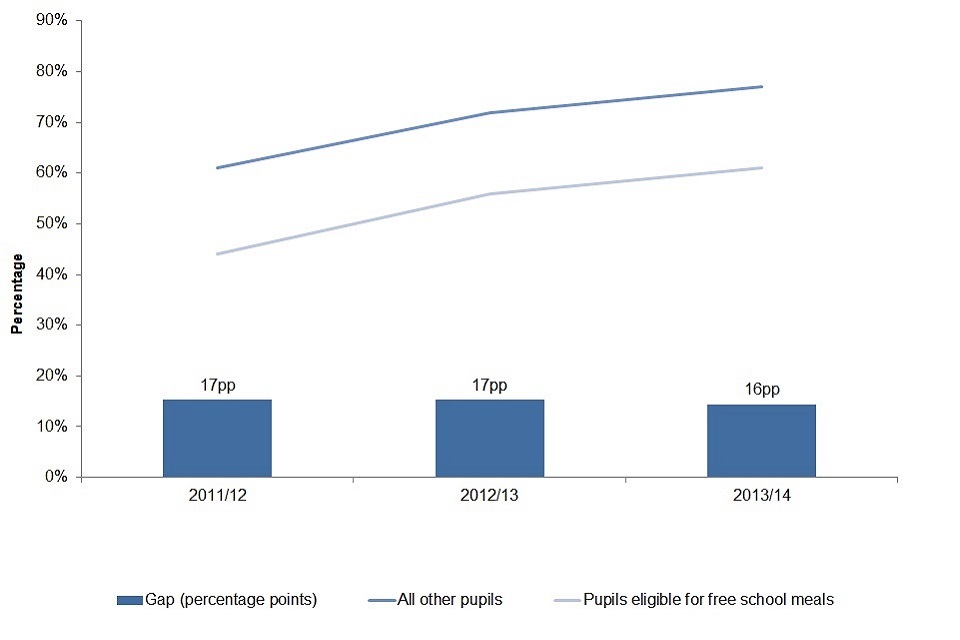
4. Chart comparing proportion of Year 1 children meeting the expected standard in the phonics screening check
4.4 What will influence this indicator?
Key drivers include:
- quality of phonics teaching in Reception and Year 1
- level of support for reading and phonics provided to children by their parents or carers
4.5 How will we ensure progress is made?
Key policies include:
- match-funding of up to £3,000 for schools to buy phonics products and training
- embedding the teaching of systematic synthetic phonics into the initial teacher training framework
- increasing the focus of Ofsted on the teaching of early reading in their inspection visits
Further information
Data is published annually by the Department for Education on the phonics screening check and the national curriculum assessments at key stage 1 in England:
- Phonics screening check and key stage 1 assessments: England 2014 – Department for Education (December 2014)
5. Attainment at age 11 by free school meal eligibility
5.1 Indicator definition
Proportion of children achieving level 4 in both English and maths (from 2011, reading, writing and maths) at the end of key stage 2, by free school meal eligibility.
5.2 Why is this indicator important to social mobility?
Attainment at age 11 is closely related to GCSE attainment. For example, less than a fifth of children who do not achieve level 4 in maths go on to achieve a C grade or better in maths GCSE. There are significant gaps in attainment by social background.
5.3 How are we performing?
| 2005-06 | 2006-07 | 2007-08 | 2008-09 | 2009-10 | 2010-11 | 2011-12 | 2012-13 | 2013-14 | |
|---|---|---|---|---|---|---|---|---|---|
| Pupils eligible for free school meals | 48.7% | 51.0% | 54.1% | 53.6% | 55.9% | 57.9% | 58.8% | 60.1% | 63.6% |
| All other pupils | 73.7% | 74.7% | 76.3% | 75.6% | 77.1% | 77.9% | 77.9% | 78.8% | 81.6% |
| Gap (percentage points) | 25.0pp | 23.7pp | 22.2pp | 22.0pp | 21.2pp | 20.0pp | 19.1pp | 18.7pp | 18.1pp |
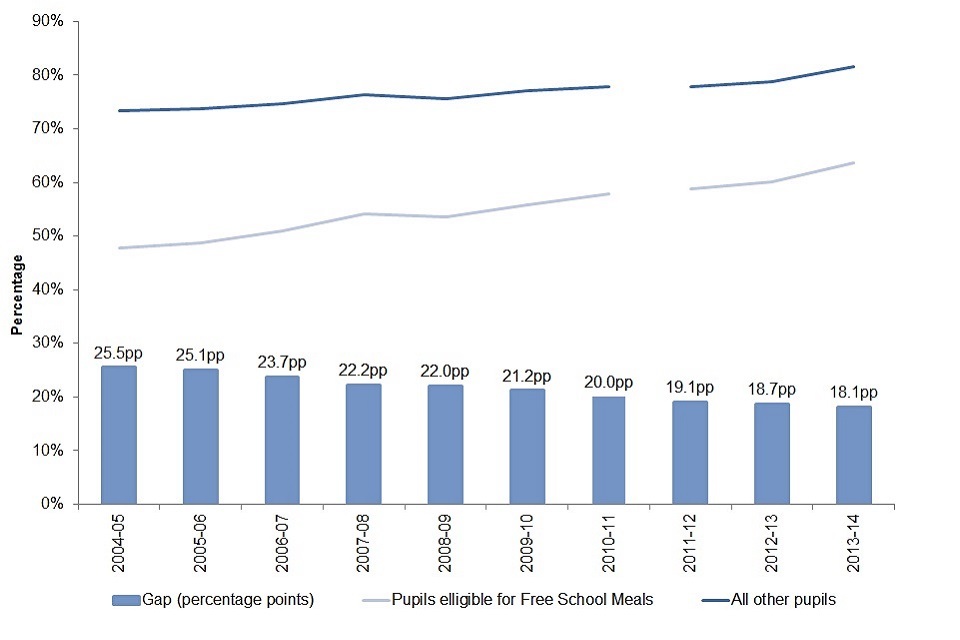
5. Chart comparing proportion of children achieving level 4 in both English and maths at the end of key stage 2
Note on data: in 2013, the Department for Education stopped combining reading national curriculum test and writing teacher assessment results to produce an overall English level. Instead, we now report separately on reading and writing results, with a reading, writing and maths score replacing English and maths in floor standards. While reading assessment is comparable to previous years, writing is substantially different because it is based on teacher assessment for 2012 and 2013. Therefore the 2013 ‘Reading, writing and mathematics’ figure is not comparable with the ‘English and mathematics’ measure previously published for 2012 as the definition changed significantly between the 2 years with English being replaced by reading and writing.
5.4 What will influence this indicator?
Key drivers include:
- prior attainment in the foundation years and at age 7
- quality of primary schools – 768 primary schools are below the floor target (fewer than 65% of students achieve level 4 in reading, writing and maths and fewer pupils than average make expected levels of progress between key stages 1 and 2)
- parental engagement and the home learning environment
5.5 How will we ensure progress is made?
Key policies include:
- a range of strategies focused on improving literacy and numeracy (eg Every Child Counts, synthetic phonics, improving initial teacher training)
- the new strengthened Ofsted inspection regime
- additional funding for disadvantaged pupils through the Pupil Premium
- academy solutions found for underperforming schools
Further information
Data is published annually by the Department for Education:
- National curriculum assessments at key stage 2, 2014 (revised) – Department for Education (December 2014)
6. Attainment at age 11: Disadvantaged Pupils Attainment Gap Index
6.1 Indicator definition
The Disadvantaged Pupils Attainment Gap Index is a new measure which compares the relative attainment of pupils by the end of primary school.
It is calculated by ordering all pupils’ point scores and deriving a mean rank for all disadvantaged pupils and all other pupils. The difference between the 2 mean ranks provides the mathematical basis for the Disadvantaged Pupils Attainment Gap Index. Disadvantaged pupils are defined as those who are eligible for pupil premium funding; those eligible for free school meals at any point in the last 6 years and children looked after by the local authority for at least 12 months. At key stage 2 the working methodology uses average point scores in reading, writing and mathematics based on pupils’ fine grade levels in national curriculum assessments to order pupils by attainment.
This indicator was created to provide a consistent measure of relative performance between the two groups which can be used to measure change over time effectively throughout a period of changes to assessments and accountability, and is still subject to development. More information can be found in Measuring disadvantaged pupils’ attainment gaps over time from the Department for Education.
This indicator is being introduced in spring 2015 in addition to the existing indicator at age 11 to give a broader view. It should be noted that the scope of the indicator differs from the existing indicator (disadvantaged pupils rather than free school meal eligible).
6.2 Why is this indicator important to social mobility?
Attainment at age 11 is closely related to GCSE attainment: eg less than a fifth of children who do not achieve level 4 in maths go on to achieve a C grade or better in maths GCSE. There are significant gaps in attainment by social background.
6.3 How are we performing?
| 2011-12 | 2012-13 | 2013-14 | |
|---|---|---|---|
| Disadvantaged Pupils Attainment Gap Index | 3.23 | 3.16 | 3.16 |
| Percentage change since previous year | n/a | -2.30% | -0.10% |
| Gap Indexed to 2014 National Curriculum levels | 0.43 | 0.42 | 0.42 |
| Gap Indexed to months progress | 10.3 | 10.1 | 10.1 |
The index is a unitless measure, so an indication is given of the equivalent in terms of higher additional national curriculum levels non-disadvantaged pupils obtain; and the number of months’ of teaching time additional progress they make.
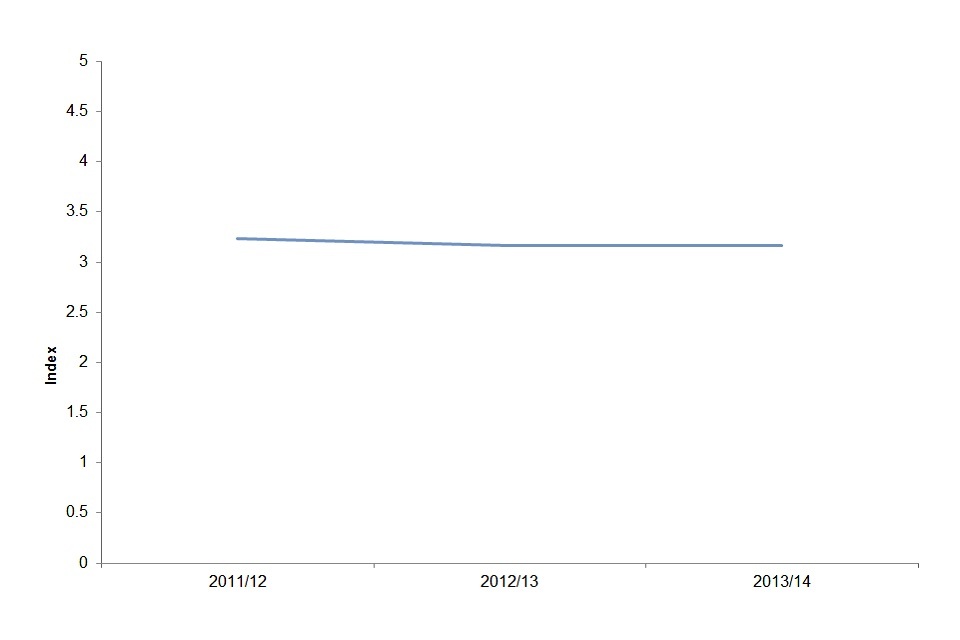
6. Chart showing the evolution of the Disadvantaged Pupils Attainment Index for Key Stage 2 over time
6.4 What will influence this indicator?
Key drivers include:
- prior attainment in the foundation years and at age 7
- quality of primary schools – 768 primary schools are below the floor target (fewer than 65% of students achieve level 4 in reading, writing and maths and fewer pupils than average make expected levels of progress between key stages 1 and 2)
- parental engagement and the home learning environment
6.5 How will we ensure progress is made?
Key policies include:
- a range of strategies focused on improving literacy and numeracy (eg Every Child Counts, synthetic phonics, improving Initial Teacher Training)
- the new strengthened Ofsted inspection regime
- additional funding for disadvantaged pupils through the Pupil Premium
Further information
Data for 2011-2012 to 2013-2014 has been published by DfE as a statistical working paper:
- Measuring disadvantaged pupils’ attainment gaps over time (last updated January 2015) - plans for future publication are under consultation
7. Attainment at age 16 by free school meal eligibility
7.1 Indicator definition
Proportion of children achieving A* to C in English and maths at GCSE, by free school meal eligibility.
7.2 Why is this indicator important to social mobility?
Good performance at GCSE is required if children are to be successful in post-16 education and the labour market. Children eligible for free school meals are only just over half as likely to achieve the ‘basics’ at GCSE.
7.3 How are we performing?
| 2007-08 | 2008-09 | 2009-10 | 2010-11 | 2011-12 | 2012-13 | 2013-14 | |
|---|---|---|---|---|---|---|---|
| Pupils eligible for free school meals | 24.4% | 27.1% | 31.8% | 35.1% | 36.8% | 38.7% | 36.3% |
| All other pupils | 52.4% | 54.8% | 59.3% | 62.5% | 63.0% | 65.3% | 62.7% |
| Gap (percentage points) | 28.0pp | 27.6pp | 27.6pp | 27.4pp | 26.2pp | 26.5pp | 26.4pp |
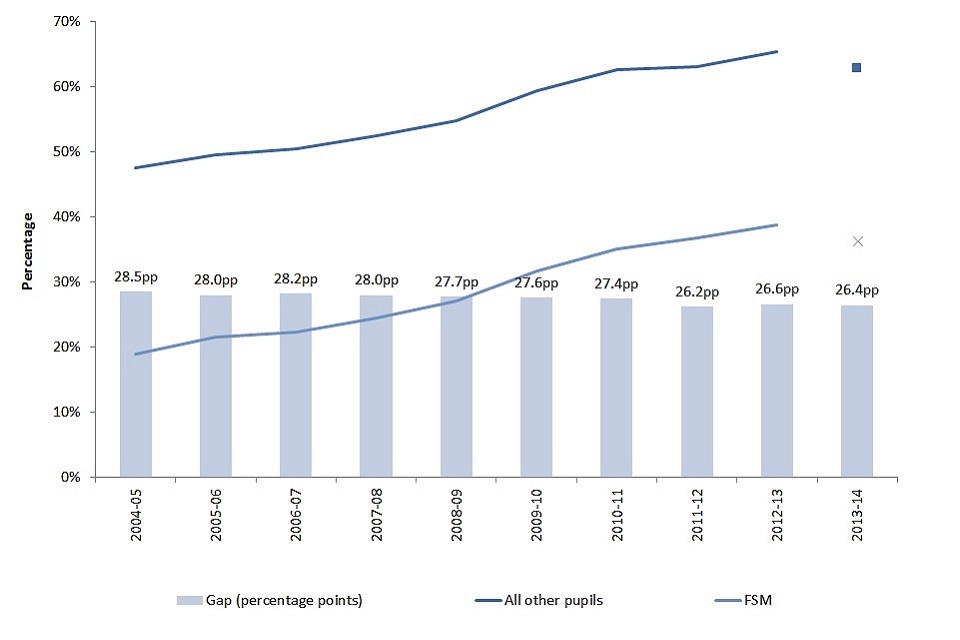
7. Chart comparing proportion of children achieving A*-C in English and maths at GCSE by free school meal eligibility
Note on the data: the data for financial year 2013 to 2014 is not directly comparable with previous years, as 2 major reforms have been implemented which affect the calculation of key stage 4 (KS4) performance measures data:
- restriction on the qualifications counted
- a stipulation that only first attempts at an exam count
7.4 What will influence this indicator?
Key drivers include:
- prior attainment at age 11 (eg only a fifth of children who do not achieve level 4 in maths go on to achieve a C in maths GCSE)
- quality of secondary schools
7.5 How will we ensure progress is made?
Key policies include:
- improving teacher quality (eg initial teacher training, TeachFirst)
- additional funding for disadvantaged pupils through the Pupil Premium
- reforms to performance tables to improve transparency and accountability
- curriculum reform and improving the rigour of qualifications (eg implementing the Wolf report, English Baccalaureate)
Further information
Data is published annually by the Department for Education:
- GCSE and equivalent results in England – Department for Education (February 2015)
8. Attainment at age 16: Disadvantaged Pupils Attainment Gap Index
8.1 Indicator definition
The Disadvantaged Pupils Attainment Gap Index is is a new measure which compares the relative attainment of pupils by the end of key stage 4.
It is calculated by ordering all pupils’ point scores and deriving a mean rank for all disadvantaged pupils and all other pupils. The difference between the 2 mean ranks provides the mathematical basis for the Disadvantaged Pupils Attainment Gap Index. Disadvantaged pupils are defined as those who are eligible for pupil premium funding: who are eligible for free school meals at any point in the last 6 years and children looked after by the local authority for at least 12 months, At key stage 4 the working methodology uses a point score which is an average of each pupil’s English and mathematics GCSE grades calculated using a 1 to 8 scale (G=1, A*=8; zero points are awarded for a U or non-entry in a relevant qualification).
This indicator was created to provide a consistent measure of relative performance between the 2 groups, which can be used to measure change over time effectively throughout a period of changes to assessments and accountability, and is still subject to development. View Measuring disadvantaged pupils’ attainment gaps over time from the Department for Education.
This indicator is being introduced in spring 2015 in addition to the existing indicator at age 11 to give a broader view. It should be noted that the scope of the indicator differs from the existing indicator (disadvantaged pupils rather than eligibility for free school meals).
8.2 Why is this indicator important to social mobility?
Good performance at GCSE is required if children are to be successful in post-16 education and the labour market. Children eligible for pupil premium funding are less likely to achieve good grades in maths and English at GCSE, with less than 40% achieving the ‘basics’ at GCSE.
8.3 How are we performing?
Attainment Gap Index at key stage 4 for 2012 to 2014
| 2011-12 | 2012-13 | 2013-14 | |
|---|---|---|---|
| Disadvantaged Pupils Attainment Gap Index | 3.89 | 3.81 | 3.74 |
| Percentage change since previous year | n/a | -2.1% | -1.8% |
| Gap Indexed to 2014 GCSE Grades | 1.2 | 1.2 | 1.1 |
The index is a unitless measure, so an indication is given of the equivalent in terms of higher number of GCSE grades that non-disadvantaged pupils obtain.
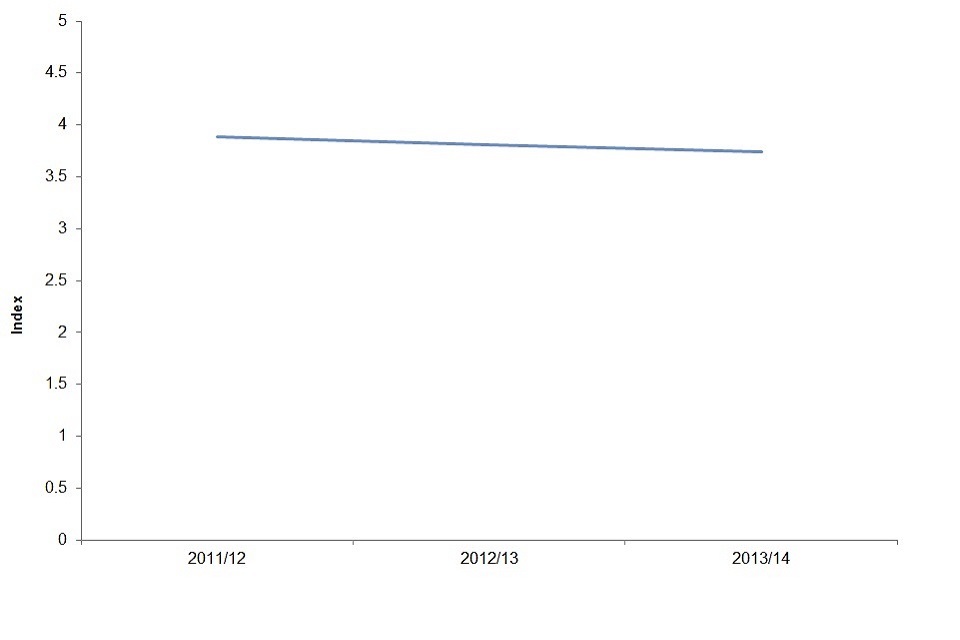
8. Chart showing the evolution of the Disadvantaged Pupils Attainment Index for key stage 2 from 2012 to 2014
8.4 What will influence this indicator?
Key drivers include:
- prior attainment at age 11 (eg only a fifth of children who do not achieve level 4 in maths go on to achieve a C in maths GCSE)
- quality of secondary schools
8.5 How will we ensure progress is made?
Key policies include:
- improving teacher quality (eg initial teacher training, TeachFirst)
- additional funding for disadvantaged pupils through the Pupil Premium
- reforms to performance tables to improve transparency and accountability
- curriculum reform and improving the rigour of qualifications
Further information
Data is published annually by the Department for Education:
- Measuring disadvantaged pupils’ attainment gaps over time (updated January 2015)
9. Attainment at age 16 by deprivation level of school
9.1 Indicator definition
Proportion of children achieving A* to C in English and maths at GCSE, by school deprivation level (gap between the 10% most disadvantaged and 10% most advantaged schools, defined by the proportion of pupils eligible for free school meals or are looked after children).
9.2 Why is this indicator important to social mobility?
Ensuring that there is fair access to high quality schools for all children regardless of their background or where they live is an essential part of social mobility. Children attending the most deprived schools are less likely to achieve the ‘basics’ at GCSE.
9.3 How are we performing?
| 2009-10 | 2010-11 | 2011-12 | 2012-13 | 2013-14 | |
|---|---|---|---|---|---|
| Pupils from most deprived 10% of schools | 36.9% | 42.9% | 44.2% | 45.6% | 42.9% |
| Pupils from least deprived 10% of schools | 80.0% | 83.3% | 81.5% | 82.5% | 80.8% |
| Gap (percentage points) | 43.1pp | 40.3pp | 37.3pp | 36.9pp | 37.9pp |
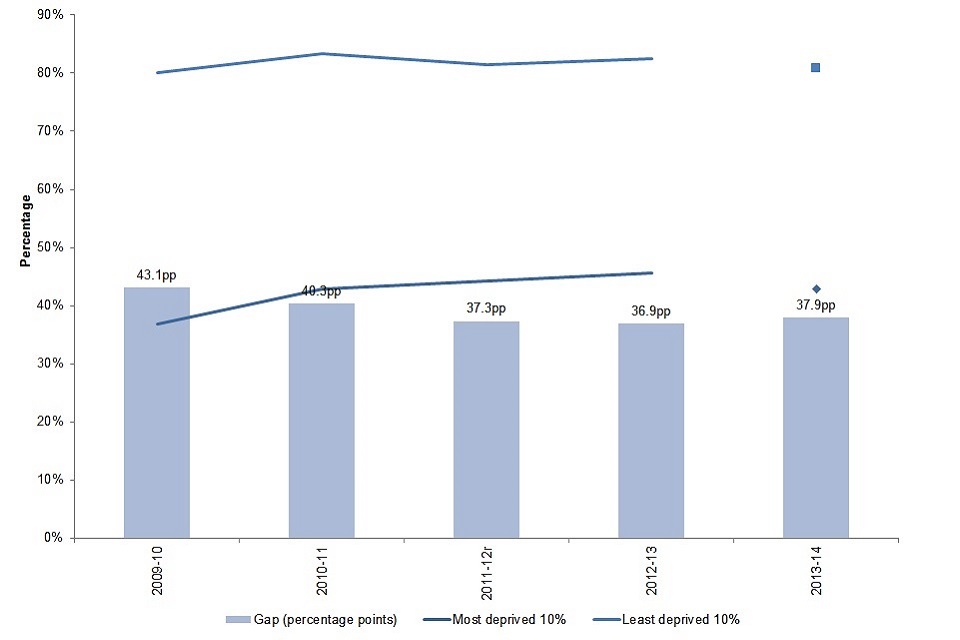
9. Chart comparing proportion of children achieving A*-C in English and maths at GCSE by school deprivation level
Note on the data: the data for 2013 to 2014 is not directly comparable with previous years, as 2 major reforms have been implemented which affect the calculation of key stage 4 (KS4) performance measures data:
- restriction on the qualifications counted
- a stipulation that only first attempts at an exam counts
View GCSE and equivalent attainment by pupil characteristics: 2014 for more information.
9.4 What will influence this indicator?
Key drivers include:
- prior attainment at age 11
- parental engagement and the home learning environment
9.5 How will we ensure progress is made?
Key policies include:
- improving teacher quality (eg initial teacher training, TeachFirst)
- introducing challenging floor standards for secondary schools
- a new strengthened Ofsted inspection regime that looks at ‘gap narrowing’ during school inspections
- allowing more schools to benefit from Academy status
- additional funding for schools serving disadvantaged pupils through the Pupil Premium
Further information
Data is published annually by the Department for Education:
- GCSE and Equivalent Results in England - Department for Education (February 2015)
10. Attainment by age 19 by free school meal eligibility
10.1 Indicator definition
Proportion of children in maintained schools at age 15 who achieve level 3 qualifications (at least 2 A levels or equivalent) by age 19, by free school meal eligibility at age 15.
10.2 Why is this indicator important to social mobility?
Achieving an A level leads to significant returns in the labour market and allows students to progress to higher education. For example, those with 2 or more A levels earn on average 14% more than those without.
10.3 How are we performing?
| Year in which cohort reached age 19 | 2005 | 2006 | 2007 | 2008 | 2009 | 2010 | 2011 | 2012 | 2013 |
|---|---|---|---|---|---|---|---|---|---|
| Those who were eligible for FSM at age 15 | 14.3% | 14.4% | 14.0% | 13.7% | 14.4% | 14.7% | 15.2% | 15.6% | 15.9% |
| Those who were not eligible for FSM at age 15 | 37.0% | 36.3% | 35.8% | 34.9% | 35.3% | 35.5% | 36.9% | 37.5% | 37.9% |
| Gap (percentage points) | 22.7pp | 21.9pp | 21.8pp | 21.3pp | 20.9pp | 20.8pp | 21.7pp | 21.9pp | 21.9pp |
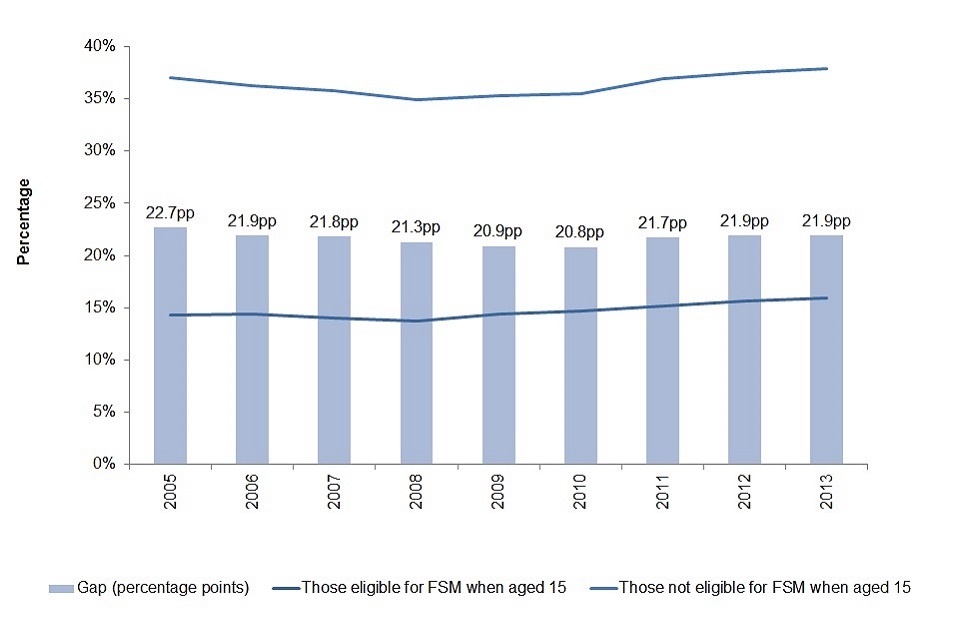
10. Chart comparing proportion of children in maintained schools at age 15 who achieve level 3 qualifications (at least 2 A-Levels or equivalent) by age 19, by free school meal eligibility at age 15
Note on the data: previous editions of this indicator incorrectly reported statistics for achievement of any Level 3 qualification, rather than the achievement of 2 A levels or equivalent.
10.4 What will influence this indicator?
Key drivers include:
- attainment at GCSE: eg over 80% of those achieving 5 A*-Cs including English and maths (whatever their background) go on to achieve a level 3 qualification by age 19, compared to only 20% of those without 5 good GCSEs or equivalent
10.5 How will we ensure progress is made?
Key policies include:
- the new duty on schools to secure independent and impartial careers guidance for children in years 9 to 11
- the English Baccalaureate to encourage study of a combination of subjects at GCSE which increases the likelihood of staying on post-16 and restricting the number of non-GCSE qualifications which count as equivalent subjects to those with clear links to future success in education or employment
Further information
Data is published annually in Level 2 and Level 3 attainment by young people in England measured using matched administrative data:
- Level 2 and 3 attainment by young people aged 19 in 2013 (Table 14a) – Department for Education (March 2014)
11. High A level attainment by age 19 by school or college type
11.1 Indicator definition
Proportion of 16 to 18-year-olds studying towards A level qualifications achieving at least AAB at A level in ‘facilitating subjects’, by type of school or college attended.
The measure includes students aged between 16 and 18 at the start of the academic year, ie 31 August.
Facilitating subjects are defined as mathematics, further mathematics, English literature, physics, biology, chemistry, geography, history and languages (classical and modern).
11.2 Why is this indicator important to social mobility?
High achievement at A level is necessary to allow children to progress to the most selective universities which provide the highest labour market returns.
The facilitating subjects have been identified by the Russell Group as those subjects most likely to be required or preferred for entry to degree courses. Choosing these subjects is likely to help students keep their university options open. The Russell Group represents 24 of the most competitive universities in the UK.
Attainment of grades AAB is one possible indicator of high attainment, but it should not be taken as the level of qualifications required to successfully apply to a Russell Group university. Certain degree courses will require 3 facilitating subjects; many require 1 or 2 and some have no subject specific requirements. The Russell Group advise that students unsure of what they want to study at university should consider choosing 2 of these facilitating subjects to keep their options open. The Russell Group have produced a guide Informing Choices (pdf) which gives more advice on making choices post-16 relevant to applying to a member university.
11.3 How are we performing?
| 2008-09 | 2009-10 | 2010-11 | 2011-12 | 2012-13 | 2013-14 | |
|---|---|---|---|---|---|---|
| Pupils from state funded schools | 5.8% | 6.3% | 7.0% | 8.4% | 8.7% | 8.7% |
| Pupils from independent schools | 22.3% | 22.3% | 23.1% | 23.3% | 23.3% | 22.6% |
| Gap | 16.5pp | 16.0pp | 16.1pp | 14.7pp | 14.6pp | 13.9pp |
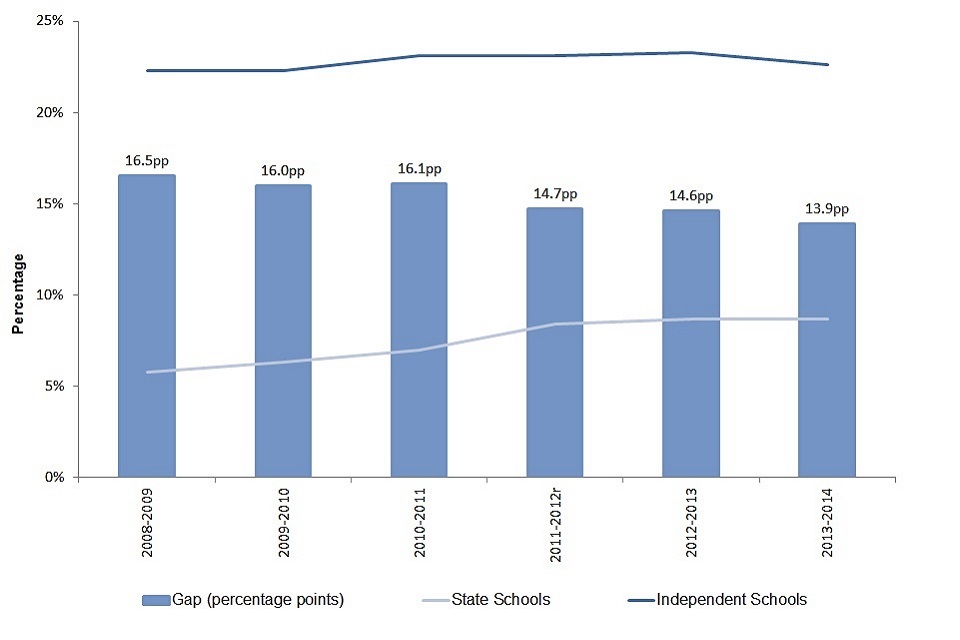
11. Chart comparing proportion of 16-18 year olds studying towards A-level qualifications achieving at least AAB at A-Level in 'facilitating subjects', by type of school or college attended
11.4 What will influence this indicator?
Key drivers include:
- performance of maintained and independent schools and colleges
- prior attainment of children in maintained schools at age 16
11.5 How will we ensure progress is made?
Key policies include:
- curriculum and qualification reform pre-16 to ensure young people are well prepared for stretching A level courses
- improving teacher quality through, for example, increasing the supply of specialist subject teachers
- improving school quality through our school improvement programme
Further information
Data will be published annually in GCE/Applied GCE A/AS and Equivalent Examination Results in England:
- A level and other level 3 results: 2013 to 2014 (revised) – Department for Education (January 2015)
12. 18 to 24 participation in education by social background
12.1 Indicator definition
Proportion of 18 to 24-year-olds who are participating in full or part-time education and training activity, with a gap measure for participation in full-time education by social background, defined using the NS-SEC class of the main earner in the household when the individual was 14.
12.2 Why is this indicator important to social mobility?
Participation in learning and gaining higher level qualifications is an important driver of success in the labour market. Long periods spent not in education, employment or training can often have a permanent ‘scarring’ effect on future earnings and waste a young person’s potential.
12.3 How are we performing?
| 1991-95 | 1996-00 | 2000-04 | 2005-09 | 2009-12* | 2014* | |
|---|---|---|---|---|---|---|
| More advantaged background (NS-SEC 1-2) | 31% | 33% | 35% | 37% | 43% | 54% |
| Others | 12% | 14% | 19% | 18% | 26% | 40% |
| Gap (percentage points) | 19pp | 19pp | 15pp | 19pp | 17pp | 14pp |
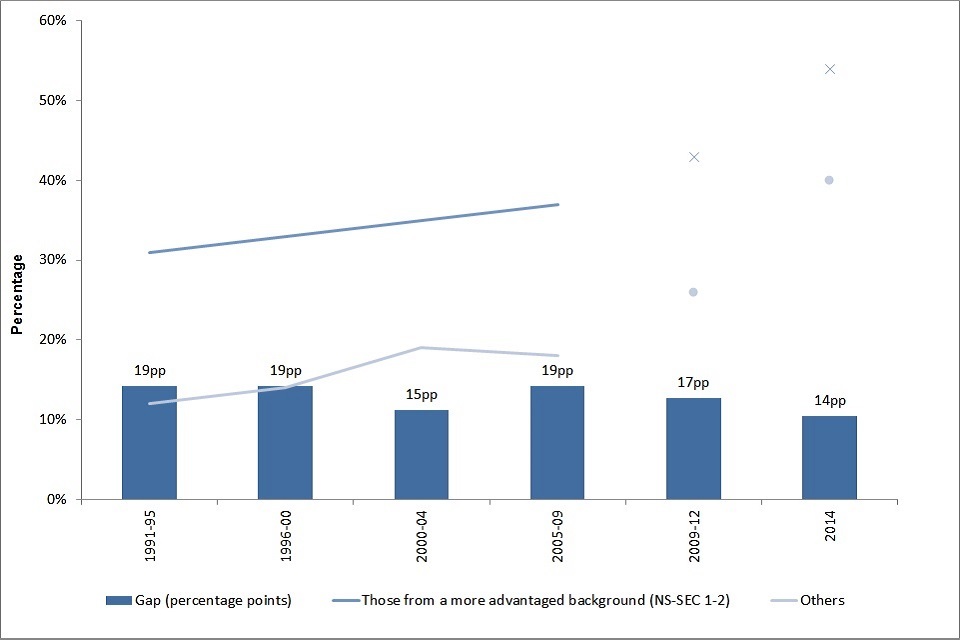
12. Chart comparing proportion of 18 to 24 year olds who are participating in full or part-time education and training activity, by parental socio-economic background.
Note on data: The measures developed using the British Household Panel Survey (BHPS) and Understanding Society (UKHLS) cover only full-time education. The UKHLS measure defines being on a government training scheme as full-time education. The measure for social background was also based on the NS-SEC class of the individual’s father. The Labour Force Survey (LFS) measure includes those defined as in education and training using the definition set out in the ONS paper Harmonised NEET methodology - technical notes (pdf). It also uses the NS-SEC class of the main earner in the household when the individual was 14 to measure social background.
Figures for 2009 to 2012 use the UKHLS measure and are not directly comparable to figures for earlier years, which use the BHPS measure.
Figures for 2014 use the LFS measure and are not directly comparable to figures for earlier years.
12.4 What will influence this indicator?
Key drivers of this indicator include:
- demand for education and training by young people and businesses
- the number of publicly funded further education and higher education places
12.5 How will we ensure progress is made?
Key policies include the reforms set out in the:
- further education white paper Skills for Sustainable Growth
- higher education white paper Students at the Heart of the System
- Participation Strategy Building Engagement, Building Futures
13. 18 to 24 participation in employment by social background
13.1 Indicator definition
Proportion of 18-24-year-olds not in full-time education who are inactive or unemployed, by social background defined using the NS-SEC class of the main earner in the household when the individual was 14.
13.2 Why is this indicator important to social mobility?
A number of studies find that for people who are unemployed when they are young, experience more unemployment and lower wages when they are older. There is a strong association between social background and likelihood of being NEET (not in education, employment or training).
13.3 How are we performing?
| 1991-95 | 1996-00 | 2000-04 | 2005-08 | 2014* | |
|---|---|---|---|---|---|
| More advantaged groups (NS-SEC 1-2) | 17% | 13% | 13% | 16% | 21% |
| Others | 25% | 21% | 21% | 22% | 31% |
| Gap (percentage points) | 7pp | 8pp | 9pp | 6pp | 10pp |
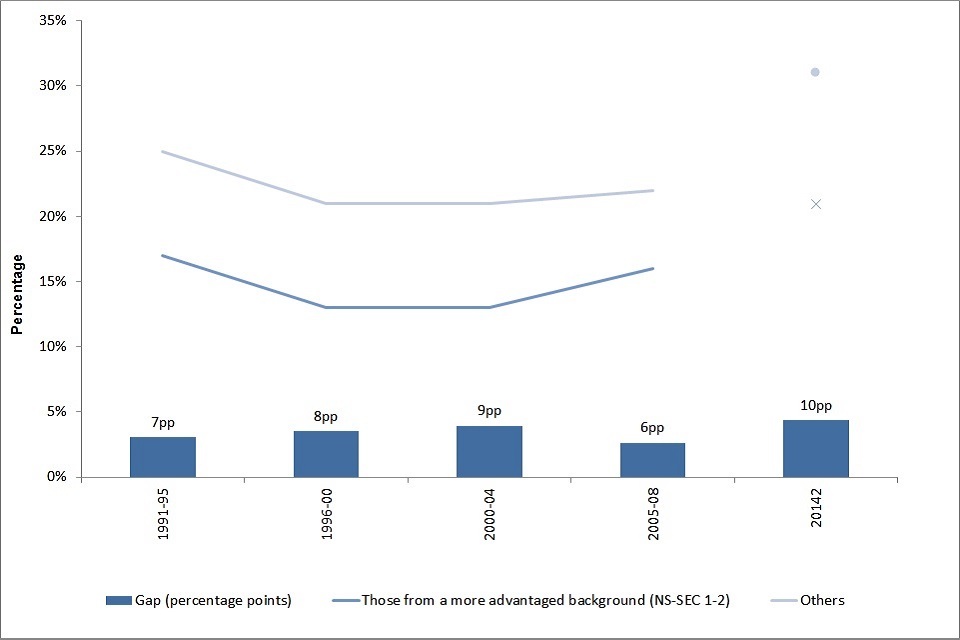
13. Chart comparing proportion of 18 to 24-year-olds who are not participating in full-time education and training activity and who are inactive or unemployed, by background.
Note on data: the 2014 estimate uses data from the Labour Force Survey and is not directly comparable with the estimates for previous years, which use data from the British Household Panel Survey. The definition of social background is different, with the latter based on the NS-SEC class of the father, while the LFS estimate uses the NS-SEC class of the main earner in the household when the individual was 14.
13.4 What will influence this indicator?
Key drivers of this indicator will include:
- the educational attainment gap at school and access to further and higher education and support in getting training and finding jobs
- the impact of macroeconomic conditions on the labour market
13.5 How will we ensure progress is made?
Key policies which will drive improvement against this indicator include:
- enhanced assistance for unemployed young adults in getting back to work through the Work Programme, work experience and sector based work academies
- ensuring young people have access to further education and Apprenticeship programmes to ensure they have the skills to be productive in work
- Helping inactive young adults move back into the labour force through access to careers advice and support from Jobcentre Plus
14. Progression to higher education by age 19, by free school meal eligibility at age 15
14.1 Indicator definition
Proportion of children in maintained schools who progress to higher education by age 19, by free school meal status.
14.2 Why is this indicator important to social mobility?
Participation in higher education is associated with significant labour market returns. Children from more disadvantaged backgrounds are less than half as likely to enter higher education as other children.
14.3 How are we performing?
| 2005-06 | 2006-07 | 2007-08 | 2008-09 | 2009-10 | 2010-11 | 2011-12 | |
|---|---|---|---|---|---|---|---|
| Pupils eligible for free school meals | 13.5% | 14.1% | 15.2% | 17.2% | 18.4% | 19.9% | 20.8% |
| Others | 32.8% | 33.3% | 33.3% | 35.0% | 36.3% | 37.7% | 38.9% |
| Gap (percentage points) | 19.3pp | 19.2pp | 18.1pp | 17.8pp | 17.9pp | 17.8pp | 18.1pp |
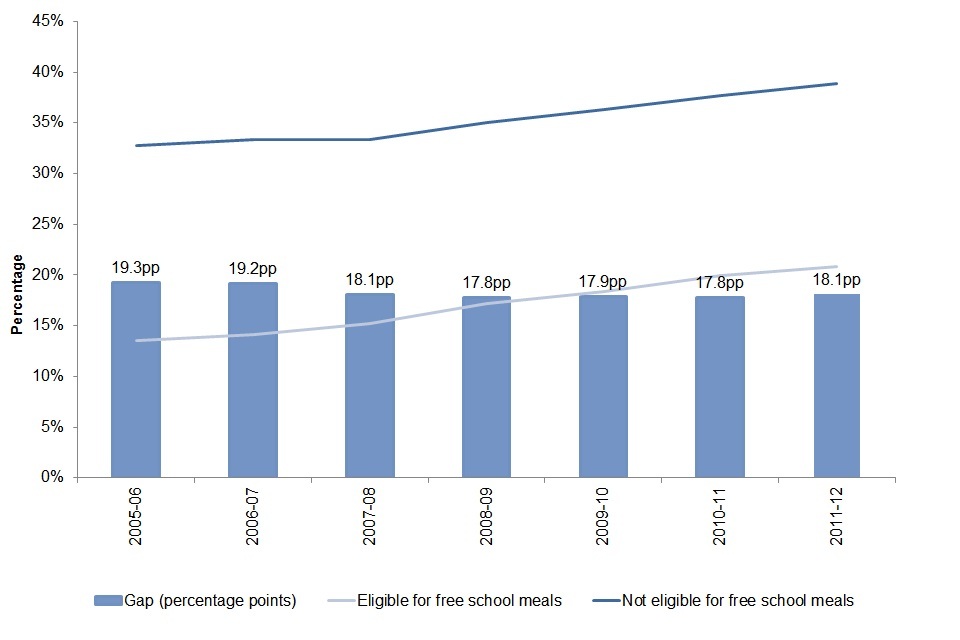
14. Chart comparing proportions of students who progress to the higher education by age 19 by eligibility for free school meals
14.4 What will influence this indicator?
Key drivers include differences by social background in:
- post-16 participation in education and attainment at A level
- aspirations to participate in higher education and application rates
- understanding among young people about the options available to them
14.5 How will we ensure progress is made?
The white paper Students at the Heart of the System set out a large number of measures being implemented to widen participation in higher education, including:
- improving the quality of careers advice
- new ‘Fair access’ agreements between the Office for Fair Access (OFFA) and universities setting out actions, including financial support to attract disadvantaged students
- the new National Scholarship Programme
Further information
Data is published annually in Widening Participation in Higher Education, though this is only available after a significant time lag. UCAS is working with the government to develop measures using data from the applications process to provide a more timely indication of trends in progression to higher education.
15. Higher education participation in the most selective institutions by type of school or college attended
15.1 Indicator definition
Proportion of A level students who progress to the most selective universities (top third ranked by UCAS tariff score) by age 19, by type of school or college attended.
15.2 Why is this indicator important to social mobility?
Graduates leaving the most selective universities have a greater chance of quickly moving into a graduate job and experience higher labour market returns. There has been little change over the past 15 years in access to the most selective universities.
15.3 How are we performing?
| Progressing into higher education by age 19 in year: | 2006-07 | 2007-08 | 2008-09 | 2009-10 | 2010-11 | 2011-12 |
|---|---|---|---|---|---|---|
| Pupils from state funded schools | 25.9% | 24.8% | 25.6% | 25.9% | 23.8% | 23.0% |
| Pupils from independent schools | 62.8% | 62.4% | 62.4% | 65.0% | 63.7% | 61.9% |
| Gap (percentage points) | 36.9pp | 36.8pp | 36.8pp | 39.1pp | 39.9pp | 38.9pp |
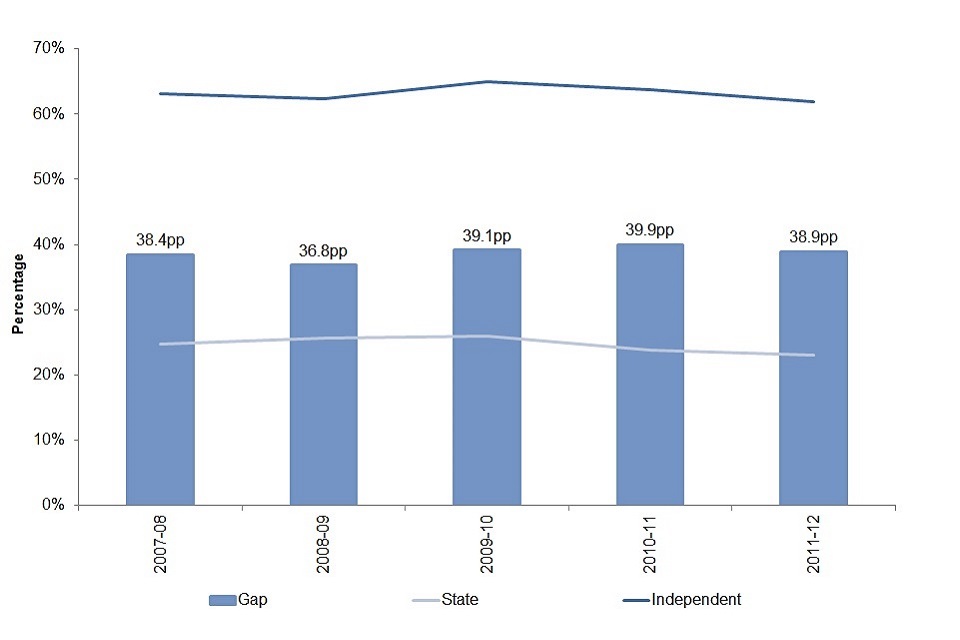
15. Chart comparing proportion of students who entered the most selective higher education institutions by their type of school
15.4 What will influence this indicator?
Key drivers include:
- attainment of very good A levels (eg 30% of children achieving AAB+ at A level are educated in the independent sector) and choice of A level subjects
- aspirations to apply to the most selective universities and admissions processes, driven by careers advice
15.5 How will we ensure progress is made?
Key policies include:
- raising standards in state schools to narrow the attainment gap
- improving the quality of careers guidance and raising aspirations
- policies to widen participation set out in Students at the Heart of the System
Further information
Data is published annually in Widening Participation in Higher Education, though is only available after a significant time lag. UCAS is working with the government to develop measures using data from the applications process to provide a more timely indication of trends in progression to higher education.
16. Higher education – graduate destinations
16.1 Indicator definition
Proportion of graduates in full-time employment 6 months after graduating who are in ‘graduate jobs’, by social background (defined as the occupational group of their highest earning parent).
16.2 Why is this indicator important to social mobility?
Ensuring fair access to professional occupations and other higher-level jobs is crucial to developing a more socially mobile society. This indicator is one way of looking at this issue – are graduates from less advantaged backgrounds as able to enter ‘graduate jobs’ as their peers from more advantaged backgrounds?
16.3 How are we performing?
| 2005-06 | 2006-07 | 2007-08 | 2008-09 | 2009-10 | 2010-11 | 2011-12 | 2012-13 | |
|---|---|---|---|---|---|---|---|---|
| Most advantaged groups (SOC 1-3) | 64% | 69% | 69% | 68% | 70% | 72% | 71% | 73% |
| Less advantaged groups (SOC 4-9) | 61% | 65% | 65% | 64% | 65% | 66% | 67% | 67% |
| Gap (percentage points) | 3pp | 4pp | 4pp | 3pp | 5pp | 6pp | 4pp | 6pp |
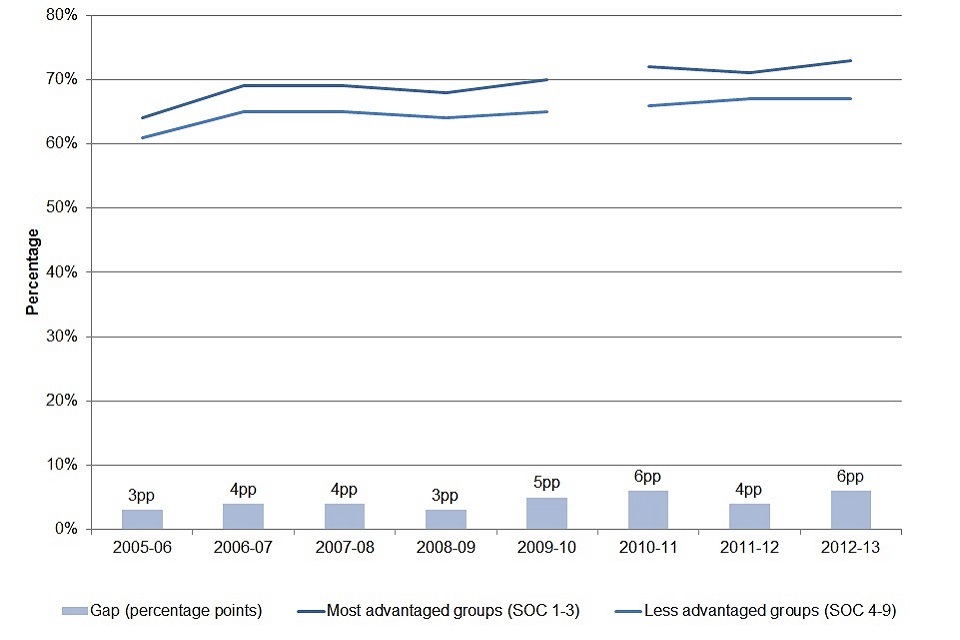
16. Chart showing proportion of the lowest earners who have experienced wage progression over the course of a decade
Note on data: The data from 2010 to 2011 onwards is not comparable to the rest of the data due to a change to the UCAS survey question on occupation.
16.4 What will influence this indicator?
Key drivers of this indicator include:
- access to the high quality higher education courses that give young people the skills they need to access graduate jobs
- recruitment practices of graduate employers (eg access to internships and graduate entry programmes etc)
16.5 How will we ensure progress is made?
Key policies include:
- policies to widen participation set out in Students at the Heart of the System
- allowing the most selective universities to expand through the relaxation of number controls for those achieving ABB+ at A level
- improving the information students have available to inform their choice of university
- working with employers to champion open and accessible graduate programmes which monitor and evaluate access by socio-economic background, including through the Social Mobility Business Compact and Champion Tier
Further information
Widening Participation in Higher Education (Department for Business, Innovation and Skills, July 2014) looks at the position 6 months after graduation. At this point, many people have not reached their career destination. These is the best data currently available. It must be noted that, due to response rates in the survey from which this data is taken, all figures should be treated as estimates.
17. Access to the professions
17.1 Indicator definition
Proportion of working-age population employed in managerial or professional positions (defined as NS-SEC 1 or 2) by social background (defined using NS-SEC class of the main earner in the household when respondent was 14).
17.2 Why is this indicator important to social mobility?
There is evidence that a large number of the professions remain dominated by a small section of society and that in recent decades many professions have become less socially representative.
17.3 How are we performing?
| 1991-95 | 1996-00 | 2001-04 | 2005-08 | 2009-12 | 2014 | |
|---|---|---|---|---|---|---|
| More advantaged background (NS-SEC 1-2) | 43% | 47% | 48% | 51% | 42% | 49% |
| Others | 21% | 23% | 25% | 28% | 25% | 30% |
| Gap (percentage points) | 22pp | 23pp | 23pp | 23pp | 16pp | 19pp |
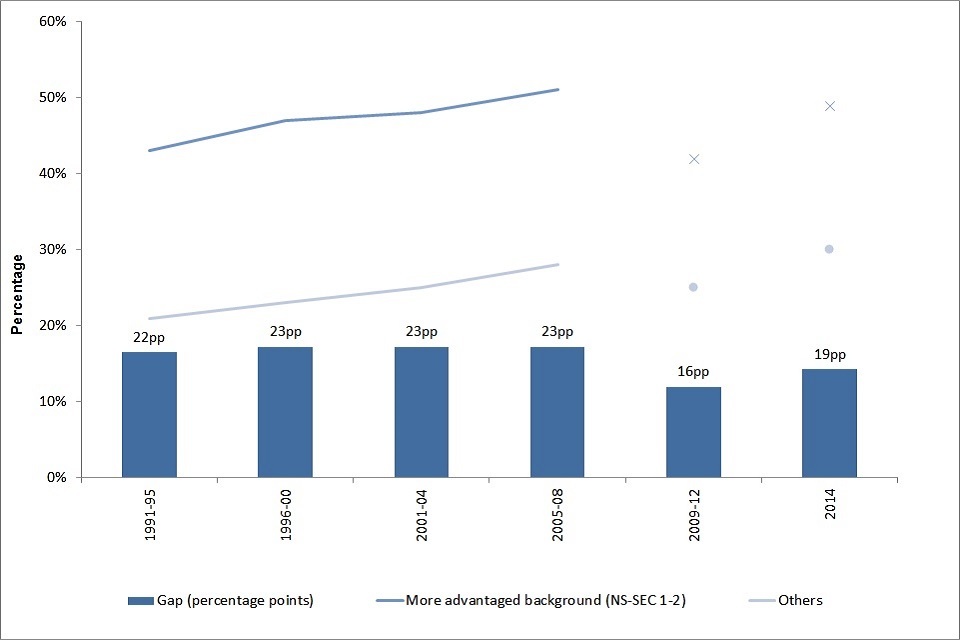
17. Chart of achievement of level 2 and level 3 qualifications by adults aged 19 and over
Notes on data: the latest estimate measured social background as the social class of the main earner in an individual’s household when he or she was 14 years old. Previous measures had used the social class of the father only. Social class is described using the National Statistics Socio-Economic Classification (NS-SEC). NS-SEC is an occupationally based classification that can provide coverage of the whole adult population. Groups 1 and 2 cover higher managerial, administrative and professional occupations. The British Household Panel Survey (BHPS) was used for data shown from 1991 to 2008 and was superseded by Understanding Society, the UK Household Longitudinal Study (UKHLS), for 2009 to 2012 data. The latest estimate, for 2014, used data from the Labour Force Survey for the third quarter of 2014. This means that the 2014 data is not directly comparable with previous years, and the data for 2009 to 2012 is not directly comparable with data used prior to that.
17.4 What will influence this indicator?
Key drivers include:
- attainment of relevant higher education and professional qualifications
- recruitment practices of the professions (eg availability of non-graduate entry routes, access to internships and graduate entry programmes etc)
17.5 How will we ensure progress is made?
Key policies include:
- work with the professions as part of the Gateways to the Professions Collaborative Forum to ensure practices that support social mobility are shared and promoted (eg best practice code for high quality internships)
- working to open up access to internships (eg new guidance on internships and the national minimum wage)
- Working with employers to champion open and accessible recruitment, which monitors and evaluates access by socio economic background, including through the Social Mobility Business Compact and Champion Tier
18. Proportion of the lowest earning 25 to 30-year-olds that experience wage progression 10 years later
18.1 Indicator definition
Proportion of the lowest earners (defined as those in the bottom 20% of earners at age 25 to 30) who have experienced wage progression over the course of a decade (defined as being 20 percentiles or higher in the earnings distribution 10 years later).
18.2 Why is this indicator important to social mobility?
It is important for social mobility that everyone has an opportunity to move on and up in the workplace. This indicator focuses on the progression of low earners - those who are most likely to face disadvantages in the labour market.
18.3 How are we performing?
| 2001-2010 | 2002-2011 | 2003-2012 | 2004-2013 | 2005-2014 | |
|---|---|---|---|---|---|
| % experiencing wage progression | 12.5% | 11.7% | 12.1% | 12.1% | 12.5% |
| % not experiencing wage progression | 40.8% | 41.0% | 39.1% | 37.3% | 36.7% |
| % progression is unknown | 46.6% | 47.3% | 48.7% | 50.6% | 50.8% |
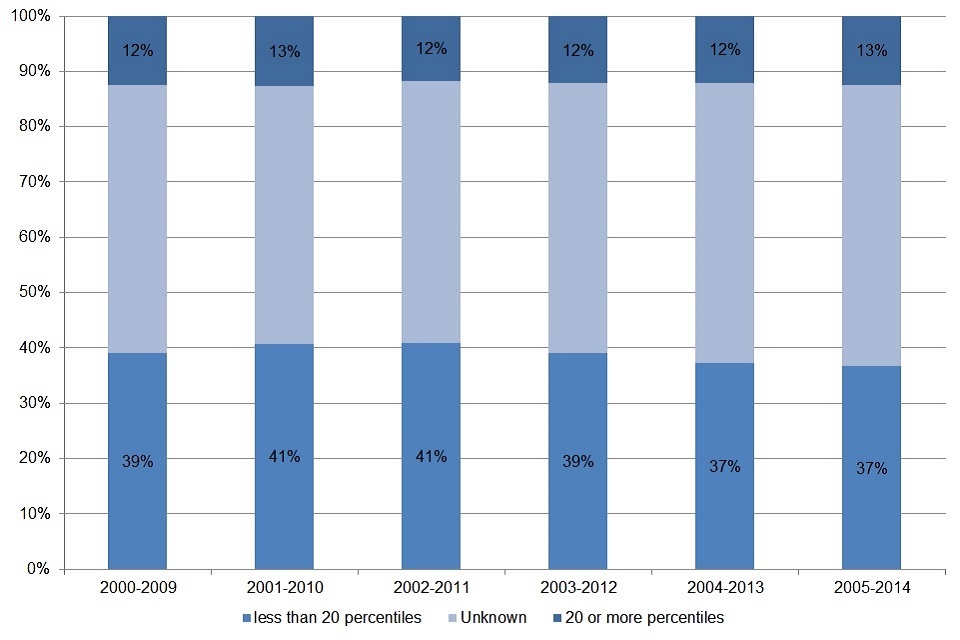
18. Chart showing proportion of low earners who have experienced wage progression over the decade
Data note: progression is unknown when those who start off in the bottom quintile have no earnings recorded 10 years later. This could be for many reasons, including a switch to self-employment, unemployment, inactivity, migration or death.
18.4 What will influence this indicator?
Key drivers include:
- how the market values different people’s skills, qualifications and experience
- how productivity changes in different industries or occupations
- routes to progression from low-wage jobs, eg the availability of promotion opportunities and ‘second chances’ to gain new skills or qualifications
18.5 How will we ensure progress is made?
Key policies include:
- supporting individuals into sustainable employment allowing them to accumulate the skills and experience necessary to move to a better paid job
- ensuring people have the ability to improve their skills during adulthood
- providing low-paid individuals with more incentives to progress in work, eg through enhanced in-work support for those eligible for Universal Credit
Further information
Data is available in the Department for Work and Pension’s business plan transparency measures and updated annually:
19. Second chances
19.1 Indicator definition
Achievement of level 2 and level 3 qualifications by adults aged 19 and over.
19.2 Why is this indicator important to social mobility?
Qualifications play an important role in allowing people to progress in the labour market – those with few qualifications have lower employment rates and less earning potential. Access to opportunities to gain qualifications and update skills throughout adulthood is important in giving people a ‘second chance’ to succeed.
19.3 How are we performing?
| 2008-09 | 2009-10 | 2010-11 | 2011-12 | 2012-13 | 2013-14 | |
|---|---|---|---|---|---|---|
| Full level 2 (5 GCSEs or equivalent) achievement | 493,900 | 556,000 | 561,800 | 546,600 | 557,800 | 494,100 |
| Full level 3 (2 A Levels or equivalent) achievement | 170,200 | 237,800 | 242,700 | 216,200 | 201,700 | 191,500 |
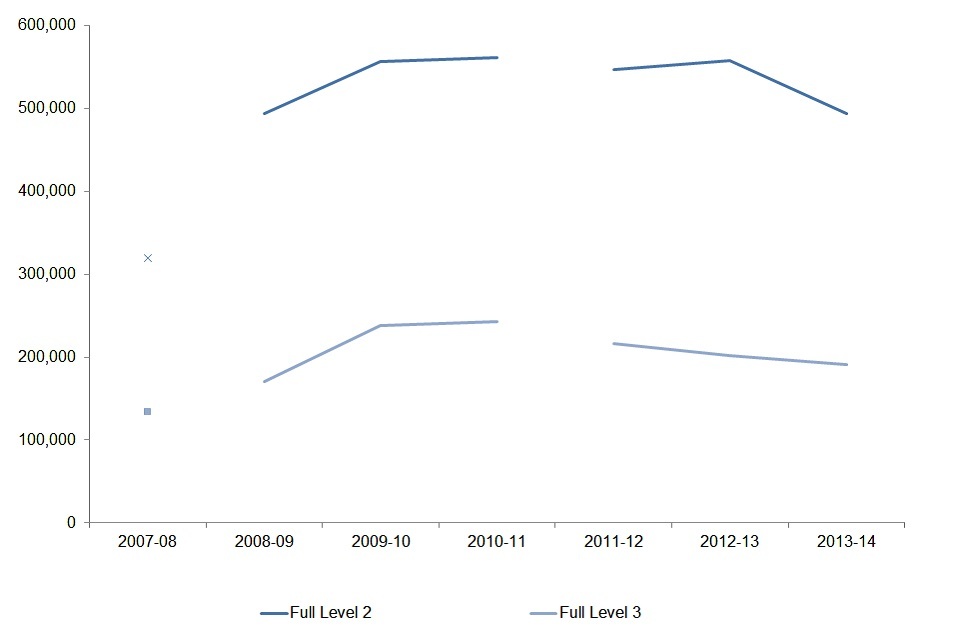
19. Chart showing achievement of level 2 and level 3 qualifications by adults aged 19 and over
19.4 What will influence this indicator?
Key drivers include:
- aspirations among adults to improve their qualifications and demand for qualifications from employers
- availability of financial support to help adults access education and training
- access to high quality courses that meet aspirations and circumstances
19.5 How will we ensure progress is made?
Key policies include:
- the National Careers Service: a universal careers service to help support people to develop and achieve their aspirations
- funding support for courses and other costs, such as fee remission for all or part of courses for certain groups and loans for courses at level 3 and above
- improvement in the quality, range and availability of apprenticeships
- increased employer influence over the use of public funding for skills and improvements to vocational qualifications
Further information
Data is published annually:
- Learner participation, outcomes and level of highest qualification held – Skills Funding Agency (January 2015)