Seasonal workers survey results 2025
Updated 17 September 2026

© Crown copyright 2026
This publication is licensed under the terms of the Open Government Licence v3.0 except where otherwise stated. To view this licence, visit nationalarchives.gov.uk/doc/open-government-licence/version/3 or write to the Information Policy Team, The National Archives, Kew, London TW9 4DU, or email: psi@nationalarchives.gov.uk.
Where we have identified any third party copyright information you will need to obtain permission from the copyright holders concerned.
This publication is available at https://www.gov.uk/government/publications/seasonal-workers-pilot-review/seasonal-workers-survey-results-2025
Executive Summary
This document provides a summary of results from a survey of workers who were issued Seasonal Worker visas and came to work in the UK during 2025. The survey’s purpose is to gain insight into workers’ experiences to understand what went well and where improvements may be needed. The survey was conducted between 19 December 2025 and 16 February 2026. Further information on the Seasonal Worker visa route.
In line with our commitment to continual improvement, the survey questions were updated in 2025. Whilst maintaining comparability with previous surveys as much as possible, the 2025 survey questions included some additional answer choices and one new question.
Overall, there were 17,796 responses to the 2025 survey, a 43.3% return rate (a slight improvement on the 39.4% in 2024). The majority of respondents were from Kazakhstan, Kyrgyzstan, Tajikistan and Uzbekistan in Central Asia (87.6% of all respondents), with Kyrgyzstan having the greatest representation for any single nationality (33.4% of all respondents).
Recruitment and pre-arrival costs
Nearly all respondents (90.1%) stated they paid for their visa themselves, whilst 54.3% reported paying for travel costs to the UK. A small proportion of respondents also stated they incurred other pre-arrival costs, the most reported of these being Labour or Migration Ministry fees (5.9%, a reduction from 13.3% in 2024).
Most respondents stated they paid their costs from their own savings (61.7%), with a further 27.5% of respondents paying their costs through loans from family and friends. The percentage of respondents stating they paid £500 to £999 increased from 38.9% in 2024 to 63.0% in 2025.
Most respondents (between 77.0% and 83.1%, depending on the topic in question) considered the information provided to them during the recruitment process as accurate; this included information on accommodation costs, pay rates and contract length.
Contracts, pay and hours worked, and duration of work
Almost all respondents (97.5%) were provided with a contract in a language they could understand (either their first language or a language they were fluent in).
The majority of respondents (87.7%) stated they were paid for all the work they performed, with 97.0% of respondents being provided with at least an average of 32 hours of work per week, and 90.8% of respondents working in the UK for over 4 months.
Costs in the UK and on-farm experiences
Responses to the survey indicated that the majority of workers on the Seasonal Worker visa route were content with their working and living conditions whilst in the UK, with between 84.2% and 95.6% of respondents answering they were ‘happy’ for each topic, which included accommodation, pay, access to healthcare, and safety.
The most frequently reported costs whilst in the UK were travel to the respondents’ first farm and between farms (44.2%) followed by accommodation (41.4%).
Complaints, transfers, and access to healthcare
Over three-quarters of respondents (83.8%) stated they knew how to raise a complaint. The majority of respondents (88.8%) stated that while working in the UK, they did not have a grievance or feel the need to raise a formal complaint. A small proportion (1.8%) stated that they had raised a formal complaint.
Workers can request a transfer between farms. 15.9% of respondents stated they had requested a transfer to another farm, with the most chosen reasons being ‘the season or contract ended and no more work was available’ (29.8%) and ‘not enough hours’ (22.5%).
When considering access to medical care, 6.1% of respondents stated they needed medical treatment due to sickness or injury during the course of their work in the UK.
Overall satisfaction
Almost all respondents (94.1%) reported they had a ‘positive’ or ‘extremely positive’ experience working in the UK, and 98% of respondents expressed a desire to return to the UK through the Seasonal Worker visa route.
Experiences by nationality, age, gender and country of work within the UK
The survey identified variation in answers across nationalities. For example, 26.8% of Uzbek respondents reported having paid Labour or Migration Ministry fees, compared to just 5.9% combined for all non-Uzbek respondents.
Survey responses also revealed some differences in experience between age groups. For example, 18 to 24 year olds were more likely (43.9% of their cohort) than other age groups (31.0%) to raise a complaint to a supervisor.
Similarly, the results suggest that experiences differed by gender. For instance, female respondents were more likely than male respondents to report that their claims were followed up (86.9% female compared with 66.0% male).
Survey results show that respondents’ experiences varied depending on where they spent most of their time working. Respondents working mainly in Scotland, Northern Ireland or Wales, were more likely to report receiving medical treatment when it is requested compared with respondents who primarily worked in England, (80.3% compared with 64.2% of respondents respectively).
Comparison with previous worker welfare surveys
The questions for the 2025 survey were updated and, whilst similar to the 2024 survey, there are differences between them which mean direct comparisons are not always possible. However, some broad trends can be identified.
Many areas show similar positive results, notably that 98% of respondents stated they would work on a UK farm again compared with 96.9% in 2024, 95.0% in 2023 and 91.4% in 2022.
The vast majority of respondents were provided with a contract in a language they could understand (97.5% in 2025, versus 96.2% in 2024, and 94.4% in 2023) and received over 32 hours of work a week (97.0% in 2025, versus 96.7% in 2024, and 93.9% in 2023).
Satisfaction with on farm conditions shows consistent, small improvements across the years. For example, 94.3% of respondents were ‘happy’ with their accommodation in 2025 compared with 93.4% (2024), 91.2% (2023), and 88.3% (2022). Requests for transfers have also fallen, down to 15.9% (2025), compared to 19.3% (2024), and 23.5% (2023).
Workers want to maximise their earnings whilst in the country. There was a positive upwards trend in respondents who reported starting work within 3 days of arrival on farm: 93.1% in 2025 compared to 85.5% in 2024. And the proportion of respondents working 5 months or longer has also increased: 75.0% (2025), 74.7% (2024), 69.5% (2023), from 60.7% (2022).
In terms of grievances, the majority (83.8%) knew how to raise a complaint in 2025, up from 81.8% in 2024 and 78.3% in 2023. Rates of follow ups to complaints have also improved: 70.4% (2025), 63.0% (2024), 58.9%, (2023), and 55.2% (2022).
The granting of worker requests for transfers shows a mixed picture over the last 3 years. Of respondents who requested a transfer to another farm, 61.4% were granted in 2025 - an improvement on 2024 (57.7%), but less than 2023 (64.9%), perhaps reflecting seasonal variability in how the flow of workers has matched work availability.
The 2025 survey also shows some negative trends. For example, slightly fewer respondents reported being paid for all the work they did: 87.7% (2025), compared to 96.2% (2024). More respondents reported paying relatively high pre-arrival costs of between £500 to £999: 63.0% (2025), compared to 38.9% (2024).
In terms of healthcare, there was an increase in the number of respondents reporting they were not well supported by the farm when asked a question about when they sought medical treatment and received it when they needed it (19.7% compared to 14.7% in 2024).
The 2024 workers survey report can be found here on GOV.UK for comparison.
Section A – Introduction to the 2025 seasonal workers survey results
This report presents the results of the 2025 seasonal workers survey conducted between 19 December 2025 and 16 February 2026.
The survey is a monitoring tool used by the Department for Environment, Food, and Rural Affairs (Defra) to gain insights into the experience and welfare implications of workers on the Seasonal Worker visa route. The annual survey began in 2019 and further information on the visa route can be found at Seasonal Worker visa (Temporary Work): Overview - GOV.UK
In line with our commitment to continual improvement, the survey questions were updated in 2025 in partnership with industry and NGO stakeholders, building on revisions made for the 2024 survey. Whilst maintaining comparability with previous surveys as much as possible, development of the 2025 survey included additional options for answers to healthcare and transfer questions and a new question on claiming back tax.
As with previous surveys, insights and detail from this survey will be used to track the impact of changes made to the visa route’s operation and support future policy development aimed at improving migrant welfare. Survey results for 2019 to 2024 can be found at Seasonal workers reviews and surveys - GOV.UK (www.gov.uk).
In 2025, the total number of Seasonal Worker visas available for the horticulture sector was 43,000, with an additional 2,000 visas for the poultry sector. Holders of horticulture Seasonal Worker visas are entitled to work for up to 6 months from their time of arrival, whereas holders of poultry Seasonal Worker visas can work for up to 3 months in the poultry sector ahead of peak demand at Christmas.
Official Home Office statistics show that 38,805 Seasonal Worker visas were granted in 2025 (an increase of 9.7% from 2024). According to data provided to Defra by Seasonal Worker visa route operators, 604 were for poultry.
Between 2024 and 2025, the proportion of Seasonal Worker visa holders who were from Central Asian countries, principally Kazakhstan, Kyrgyzstan, Tajikistan and Uzbekistan, increased by 10.4% to 30,436 individuals. This represents 78.4% of Seasonal Worker visa holders in 2025.
Five scheme operators were licensed to recruit seasonal workers for horticulture during 2025: Pro-Force, Concordia, Fruitful Jobs, HOPS, and Agri-HR. Pro-Force and a sixth operator, RE Recruitment, were also licensed to recruit for poultry. Scheme operators source and sponsor seasonal workers on behalf of UK growers. A breakdown of the total number of visas issued to seasonal workers by their country of residence can be found in Table 1.
Table 1: Total number of visas issued to seasonal workers in calendar year 2025 (from official Home Office statistics)
(Values were rounded, therefore percentages may not equal 100%)
| Country of residence | Visas issued in 2025 | Percentage of total visas issued in 2025 | Change in percentage of total visas issued, compared to 2024 |
|---|---|---|---|
| Kyrgyzstan | 12,650 | 32.6% | +29.2% |
| Uzbekistan | 6,307 | 16.3% | +0.7% |
| Kazakhstan | 5,767 | 14.9% | -0.2% |
| Tajikistan | 5,712 | 14.7% | -1.8% |
| Kenya | 2,549 | 6.6% | +97.9% |
| Moldova | 1,940 | 5.0% | -4.4% |
| Romania | 798 | 2.1% | +1.5% |
| South Africa | 600 | 1.5% | +39.5% |
| Ukraine | 530 | 1.4% | -24.9% |
| Bulgaria | 500 | 1.3% | -25.7% |
| North Macedonia | 279 | 0.7% | -20.5% |
| Poland | 255 | 0.7% | +12.3% |
| All others | 918 | 2.4% | -26.2% |
| Total | 38,805 | 100.0% |
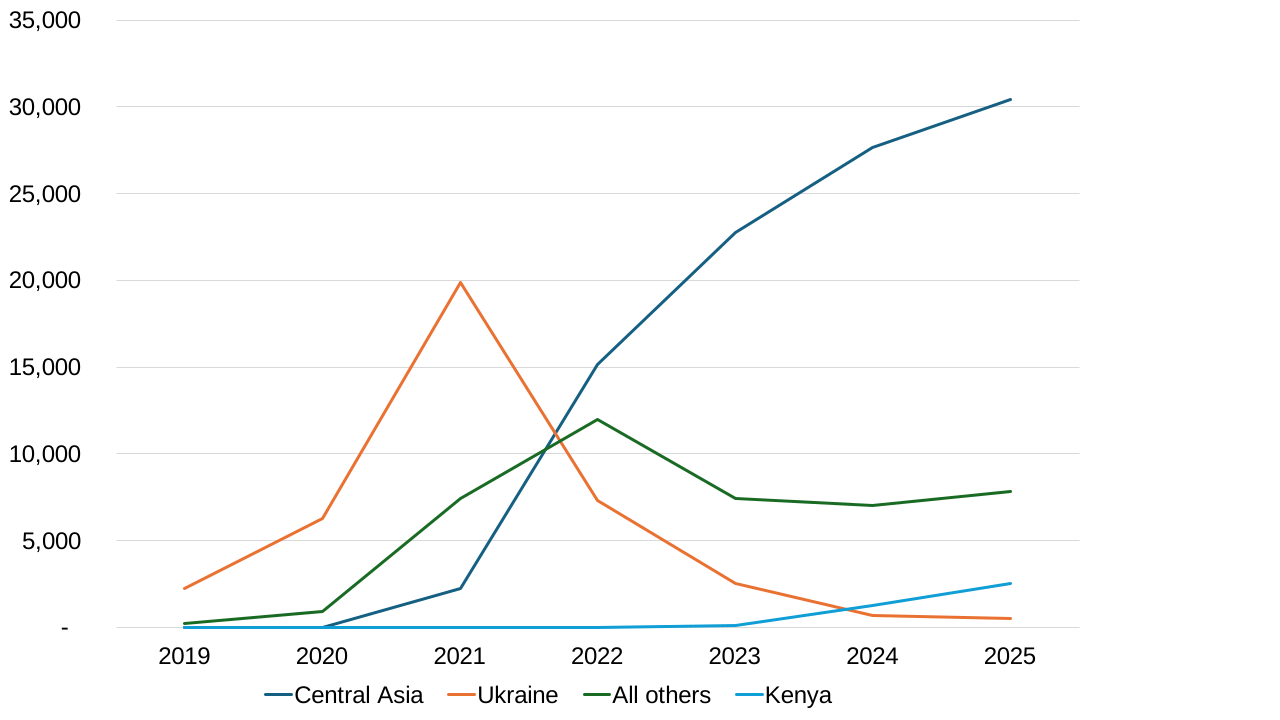
Recruiting workers from the same countries over successive years should improve the safety, certainty and stability of recruitment in those areas, allowing recruiters to make more meaningful connections and establish better relationships in-country. As such, it is common for the same source countries to be used each year. The demographic composition of Seasonal Worker visa holders has, however, changed over the years. During 2022, the visa route gained an expanded visa allocation, but recruitment switched away from being predominantly focussed on Ukrainian and Russian nationals following Russia’s invasion of Ukraine. Recruitment pivoted to Central Asian countries (see Figure 1). The Central Asian countries of Kazakhstan, Kyrgyzstan, Tajikistan and Uzbekistan have been the main source of seasonal workers between 2022 and 2025.
This shift in countries which are the focus of recruitment is reflected in the demographic composition of survey respondents. Respondents from Kazakhstan, Kyrgyzstan, Tajikistan and Uzbekistan accounted for 30.4% of responses in 2021, 73.8% in 2022, 85.9% in 2023, 91.5% in 2024, and 87.6% in 2025.
Figure 1: Number of seasonal workers on the visa route from Ukraine, Central Asia, Kenya vs all other countries, 2019 to 2025 (from official Home Office statistics)
1. Insights from the seasonal workers survey
The 2025 Survey of Workers was hosted online by survey software Qualtrics. The survey was distributed on Defra’s behalf by all scheme operators who recruited seasonal workers during 2025 and still held a licence by the end of the year.
The annual workers survey collects both quantitative and qualitative data from migrant seasonal workers and provides valuable insights across 5 dimensions of their welfare:
- Recruitment and pre-arrival costs
- Contracts, pay and hours worked, and duration of work
- Costs in the UK and on farm experiences
- Complaints, transfers, and access to healthcare
- Overall satisfaction
The 2025 report themes are similar to the 2022 to 2024 reports but differ from the themes included in the 2020 and 2021 reports following a greater focus on welfare questions from 2022 onwards.
2. Methodology and analysis
A link to the online Qualtrics based survey was disseminated between 19 December 2025 and 16 February 2026 by the operators on behalf of Defra to workers that held Seasonal Worker visas for 2025. The survey will, in most cases, have been completed by the worker after they had returned to their home country.
The survey asked a variety of questions on issues such as working experience, accommodation, pay, complaints, and desire to return to the UK for future seasonal work. The survey comprised 30 questions (some with sub-questions), including 2 screening questions and 7 free text fields to gain further detail on respondents’ answers. The questionnaire was translated into 10 languages to make it accessible to the majority of workers employed through the visa route.
The survey received 17,796 responses. Analysis was conducted inhouse by Defra. A process of data cleansing removed duplicate responses, responses where consent to participate in the study was not provided by the respondent, and responses from participants who did not work on farms in the UK in 2025. This left 16,787 eligible and completed responses in the final sample, representing a 43.3% response rate from the total number of migrant workers who received Seasonal Worker visas in 2025.
The response rate for 2025 of 43.3% is consistent with recent years: 39.4% in 2024 and 42.5% in 2023. All 3 are much higher than 12.4% in 2022 and 12.0% in 2021, reflecting the significant improvements in survey format and operation introduced from 2023 onward.
The results of the survey are presented as counts and percentages before being broken down by nationality, age, gender, and the country the respondent primarily worked in (either England, or Scotland, Northern Ireland and Wales together). These breakdowns are included to identify whether migrants of different demographics, or location of work, have reported different experiences of the UK Seasonal Worker visa route. These results consider the percentage of respondents who selected certain responses which is then compared to the overall proportion of respondents to that question.
For the nationality breakdown, analysis has been limited to responses from countries whose nationals account for more than 5% of the total survey responses (see Table 2), allowing meaningful analysis to be undertaken and conclusions drawn from the results. These are the following countries: Kazakhstan; Kyrgyzstan; Tajikistan; and Uzbekistan. Responses from all ‘other’ nationality countries are presented as a group.
Analysis was undertaken on free text answers to identify common themes. These were translated into English where necessary. The method for thematic analysis of free text responses was expanded and improved in 2026. An R Shiny app was built to replace the usual thematic coding method in Excel, with the aim to increase productivity while coding and improve readability of responses. The app shows responses individually with highlighting of keywords related to codes, filters unhelpful responses to reduce coding burdens, and displays the final coded responses more clearly in an easily readable table to improve quality assurance.
Respondents did not need to answer all questions, hence the number of responses to each question might differ from each other and from the total number of respondents to the survey as a whole. Similarly, the percentages stated throughout the report relate to the number of responses to the specific question under discussion, rather than to the total number of respondents to the survey, unless otherwise stated. Results have been rounded to a single decimal place, therefore percentages may not sum to equal 100%. Data is represented in tables and figures in the order the answer options were presented to respondents in the survey.
2.1 Limitations of survey
While seasonal migrant workers can be hard to reach as a research population, their welfare is of great importance to all those connected with the visa route’s successful operation. This survey provides valuable insight into seasonal workers’ experiences of working in the UK and contributes to the body of literature on the subject of migrant welfare and to improvements in visa route operation.
The online survey was disseminated to migrant workers via the scheme operators (the businesses licenced to sponsor workers for the visa route) to reach the maximum number of participants. Respondents submitted their answers on Qualtrics, an online survey tool, which allowed them to contribute their feedback anonymously. Defra downloaded the anonymised results from Qualtrics, ensuring respondents could not be identified by their responses.
There are, however, limitations to collecting the data in this way. Defra could not follow up with survey respondents, for example, to further explore questions raised.
Although workers were provided with assurances around confidentiality, they depend on the operators, who are their sponsors, to access work. As the operators also distributed the survey, some workers may have been reluctant to provide negative feedback (or respond to the survey at all) due to a lack of confidence about who can view their responses. It should be noted, however, that the operators do not have access to the raw survey data.
There is also a risk of self-selection bias as participants were free to choose whether to respond to the survey or not. Hence, there is a possibility of overrepresentation of subgroups that had a particularly positive or negative experience working in the UK.
Language barriers can be another limitation, bringing a risk that information is lost in the translation of survey questions into other languages or responses into English. Across the survey, 92.7% of respondents answered a translated version of the survey (95.5% in 2024). The Russian survey translation was the most popular translation used by respondents (66.8%). Only 7.3% of respondents answered the English language version of the survey. A professional translator was used to convert to English a number of the non-English responses from the free text options in questions 19a, 23b, 24a, 25d, 27b, 28c and 30 prior to their analysis. They translated responses for all languages.
Finally, due to the way in which the survey is conducted, and its confidential nature, there is a risk that respondents submitted multiple responses to this survey. There are no measures in place to prevent respondents mistakenly submitting multiple responses. The data cleaning process attempts to identify and remove duplicate responses; however, it cannot be guaranteed that all duplicates are removed from the dataset.
The survey is designed to capture the experience of seasonal workers on the visa route. Experiences of other seasonal workers (for example, EU workers with Settled or Pre-Settled Status or Ukrainians with extended visas) on farm are not included in this survey.
2.2 Comparisons with previous surveys
This report will make some comparisons with the findings from the 2022, 2023 and 2024 Survey of Workers as there were similarities between the themes explored. When comparison between 2022, 2023, 2024 and 2025 responses is undertaken in this report, it is noted where the questions differed between the iterations of the survey. Comparison with the results from pre-2022 surveys would be less meaningful due to changes to the Seasonal Worker visa route since then, and a re-design of the 2022 survey.
3. Respondent characteristics
The survey collected basic demographic information from respondents, including nationality, age, and gender.
3.1 Nationality of survey respondents (total number of respondents: 16,784)
Table 2 demonstrates that the largest proportion of survey respondents (87.6%) were from 4 Central Asian countries (Kyrgyzstan, Tajikistan, Kazakhstan, and Uzbekistan).
Table 2: Nationality of 2025 survey respondents (total number of respondents: 16,784)
| Nationality | Number of respondents | Proportion of respondents |
|---|---|---|
| Kyrgyz | 5,599 | 33.4% |
| Tajik | 3,182 | 19.0% |
| Kazakh | 3,087 | 18.4% |
| Uzbek | 2,830 | 16.9% |
| Moldovan | 576 | 3.4% |
| Kenyan | 504 | 3.0% |
| Ukrainian | 255 | 1.5% |
| South African | 167 | 1.0% |
| Romanian | 95 | 0.6% |
| Macedonian | 94 | 0.6% |
| Azerbaijani | 93 | 0.6% |
| Bulgarian | 75 | 0.4% |
| Turkish | 39 | 0.2% |
| All other | 188 | 1.1% |
| Total | 16,784 | 100.0% |
3.2 Age of survey respondents (total number of respondents: 16,657)
Most respondents to the survey were aged between 25 and 38 years (65.0%) (see Table 3).
Table 3: Age group of 2025 survey respondents (total number of respondents: 16,656)
| Age group | Number of respondents | Proportion of respondents |
|---|---|---|
| 18-24 | 1,745 | 10.5% |
| 25-31 | 5,592 | 33.6% |
| 32-38 | 5,240 | 31.5% |
| 39+ | 4,079 | 24.5% |
| Total | 16,656 | 100.0% |
Figure 2: Distribution of respondent age in the 2025 Survey of Workers
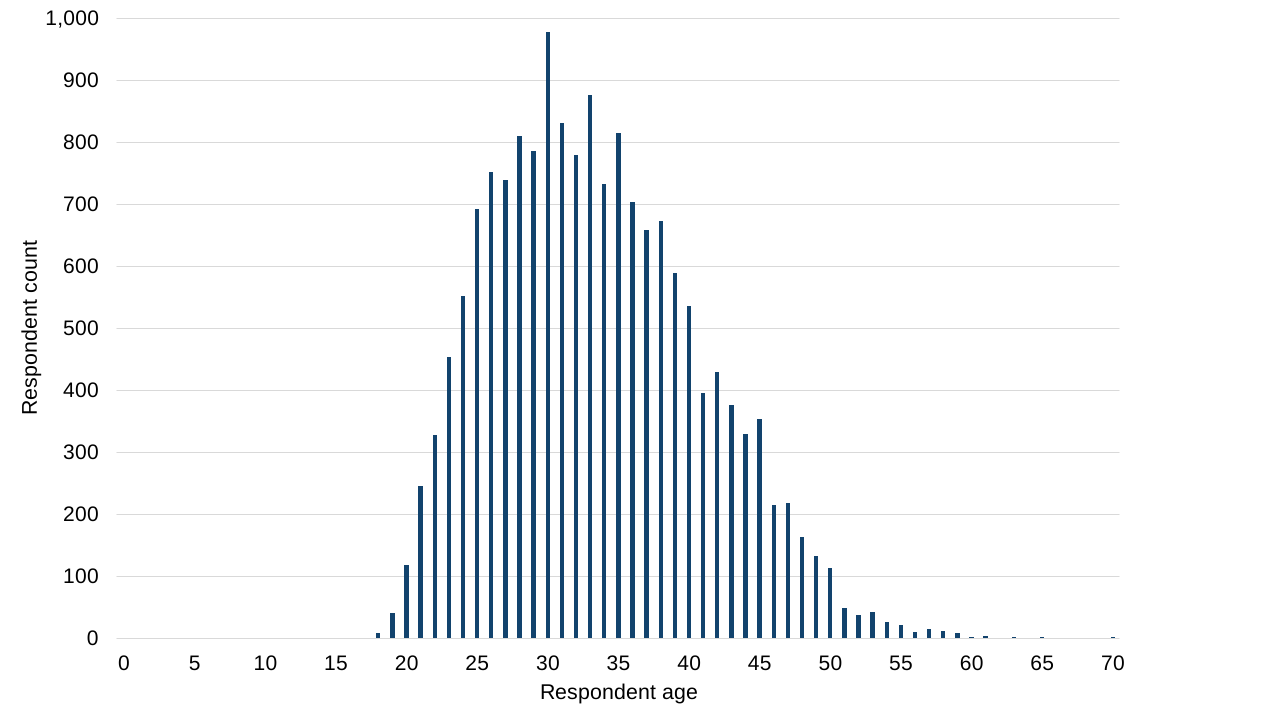
Figure 2 shows that the most commonly stated age was 30. The average (mean) age of survey respondents was 33.
The age of respondents has changed across the last 5 surveys with a decline in the younger age groups (18-24) and (25-31) and an increase in the older age groups (32-38) and (39+) (see Table 4).
Table 4: Age groups of survey respondents in 2021- 2025
| Age group | 2021 proportion | 2022 proportion | 2023 proportion | 2024 proportion | 2025 proportion |
|---|---|---|---|---|---|
| 18 to 24 | 23.1% | 16.6% | 16.0% | 13.3% | 10.5% |
| 25 to 31 | 43.3% | 39.7% | 36.4% | 33.4% | 33.6% |
| 32 to 38 | 21.6% | 27.1% | 28.4% | 31.8% | 31.5% |
| more than 39 | 12.1% | 16.6% | 19.2% | 21.5% | 24.5% |
| Total | 746 | 4,210 | 13,507 | 13,876 | 16,657 |
3.3 Gender of survey respondents (total number of respondents: 16,674)
Most respondents to the 2025 seasonal workers survey stated they were male (76.9%), and 23.0% stated they were female (see Table 5).
Table 5: Gender of 2025 survey respondents (total number of respondents: 16,674)
| Gender | Number of respondents | Proportion of respondents |
|---|---|---|
| Male | 12,827 | 76.9% |
| Female | 3,829 | 23.0% |
| Other | 4 | 0.0% |
| Prefer not to say | 14 | 0.1% |
| Total | 16,674 | 100.0% |
There has been an increase in the proportion of female respondents over the last 4 years (see Table 6) and an increasing proportion of females in the older age groups (see Annex B, Table B1).
Table 6: Gender of survey respondents 2022-2025
| Gender | 2022 proportion | 2023 proportion | 2024 proportion | 2025 proportion |
|---|---|---|---|---|
| Male | 84.9% | 80.9% | 79.1% | 76.9% |
| Female | 14.9% | 18.9% | 20.8% | 23.0% |
| Other | less than 0.1% | less than 0.1% | 0.0% | 0.0% |
| Prefer not to say | 0.1% | 0.1% | 0.1% | 0.1% |
| Total | 4,225 | 13,554 | 13,895 | 16,674 |
3.4 Country of work of survey respondents (total number of respondents: 16,310)
Respondents were asked where in the UK they primarily worked while on the Seasonal Worker visa route (see Table 7).
Table 7: Respondents by country in which they primarily worked (total number of respondents: 16,310)
| Country respondent mainly worked in | Number of respondents | Proportion of respondents |
|---|---|---|
| England | 14,053 | 86.2% |
| Scotland | 1,761 | 10.8% |
| Northern Ireland | 413 | 2.5% |
| Wales | 83 | 0.5% |
| Total | 16,310 | 100.0% |
Given far more respondents worked in England than elsewhere in the UK, respondents who worked in Scotland, Northern Ireland and Wales were analysed as a single group in comparison to respondents from England.
Section B - Main findings
When reading this section please bear in mind the following:
- As set out in Section 2.2, some of the results from this section are directly comparable to the 2022 to 2024 surveys but not to reports prior to 2022.
- With regards to overall frequencies and proportions, we have considered variations in responses by nationality. The nationality groups analysed are Kazakhstan, Kyrgyzstan, Tajikistan and Uzbekistan, representing 87.6% of survey respondents. These are sometimes referred to as the 4 main Central Asian countries. The remaining 2,086 respondents (12.4% of all responses) are grouped into an ‘other’ nationality category, of which the majority came from Moldova, Kenya and Ukraine.
- Variations between respondents of different ages and genders, and variations between respondents who worked in Scotland, Northern Ireland and Wales as opposed to England, are also commented upon where there were noticeable variations.
4. Recruitment and pre-arrival costs
To investigate the costs that workers are incurring, survey respondents were asked how much they paid on things related to their seasonal work before arriving in the UK and how they funded these costs.
To see if workers understood what their working and living experience would be like in the UK, the survey also asked about the accuracy of the information provided during recruitment on topics including accommodation, working hours, pay and contract length.
4.1 Costs incurred before arriving in the UK
4.1.1 Type of costs incurred (total number of responses: 26,921)
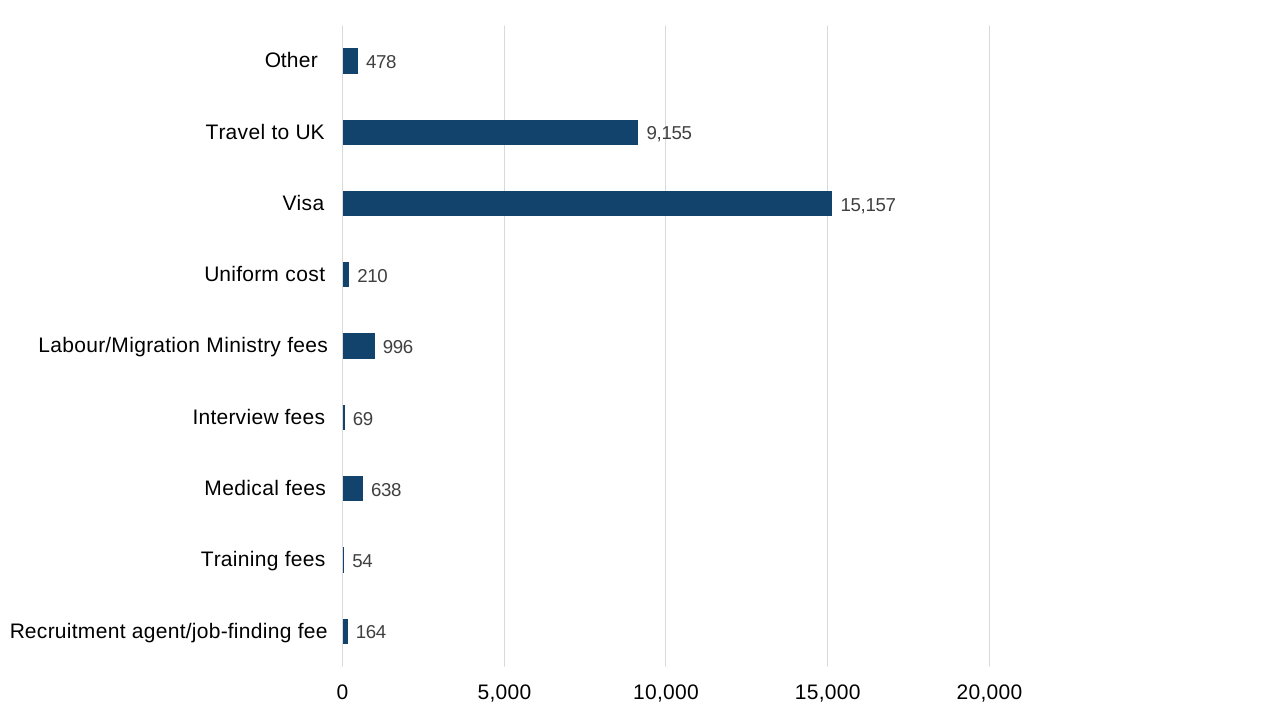
A range of options were provided in the survey’s multiple-choice selection (see Figure 3). Visa fees were the cost most frequently selected by respondents at 90.3%, followed by travel costs at 54.3%. The expectation is, however, that almost all seasonal workers will pay for their travel to the UK.
All remaining cost options were selected much less frequently by respondents, with the next most often selected being ‘labour/migration ministry fees’ at 5.9% (a decrease on 2024’s 13.3% figure), followed by ‘medical fees’ at 3.8%.
Figure 3: Type of costs incurred before arrival in the UK (total number of responses: 26,921)
Variation by nationality
A greater proportion of Uzbek respondents reported having paid ‘labour/migration ministry fees’ (26.8%) compared with ‘other’ countries (2.0%); this is a decrease from 43.1% last year (see Annex A, Table A1). A greater proportion of respondents from ‘other’ nationalities stated they paid ‘medical fees’ (17.7%) compared to the 4 main Central Asian countries (see Annex A, Table A1).
4.1.2 Amount paid in up-front costs (total number of respondents: 15,801)
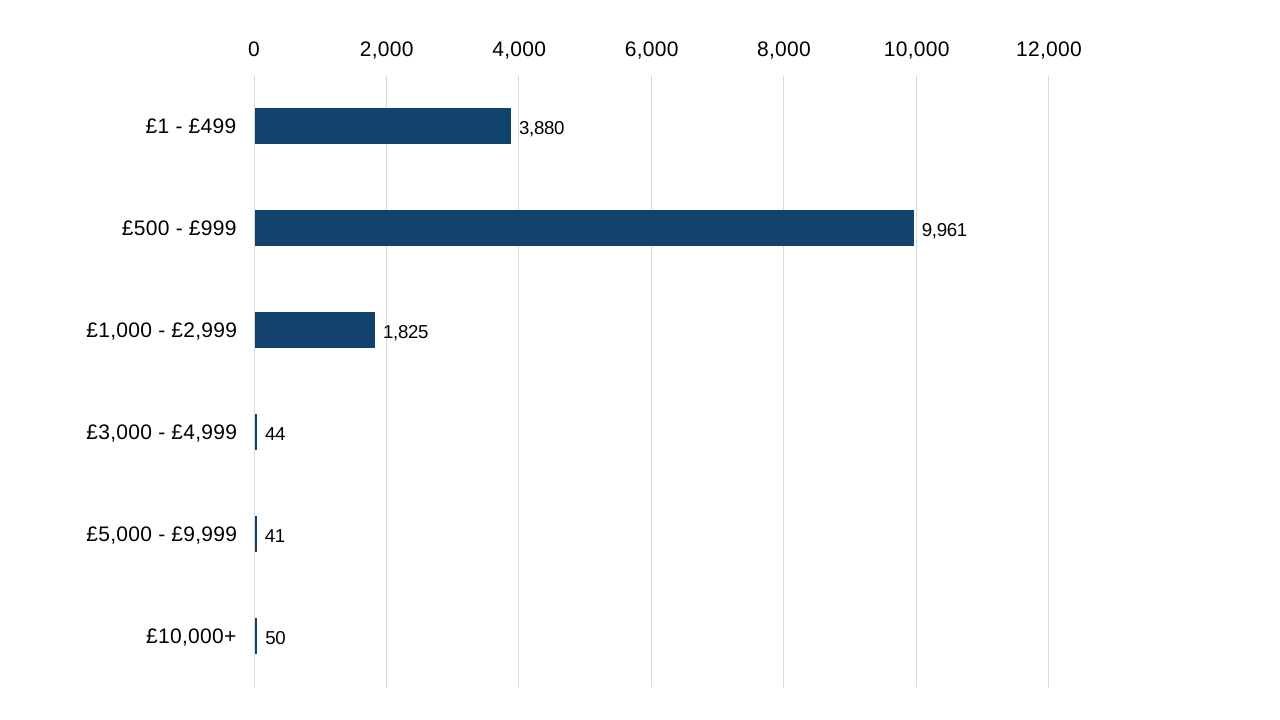
Most respondents reported paying less than £1,000 in up-front costs before arriving in the UK (87.6%), with 24.6% respondents stating they paid £499 or less (see Figure 4). However, 0.9% respondents stated they paid over £3,000. These responses were examined in more detail, and there is no clear explanation for these unusual reports of high expenditure.
Figure 4: Amount paid by workers before arrival in the UK (total number of respondents: 15,801)
4.2 Funding pre-arrival costs (total number of respondents: 15,540)
The survey asked respondents how they funded their pre-arrival costs to understand the prevalence of workers entering debt before arriving in the UK.
Most respondents stated they paid for their trip through their savings (61.7%). A further 27.5% of respondents stated they borrowed the money, mostly from family or friends (see Table 8).
Table 8: How respondents funded their pre-arrival costs (total number of respondents: 15,540)
| Funded by | Respondents | Percentage |
|---|---|---|
| Savings | 9,584 | 61.7% |
| Loan (family or friends) | 4,277 | 27.5% |
| Formal loan, for example banks | 1,135 | 7.3% |
| Informal loan, for example money lenders | 114 | 0.7% |
| Recruitment company | 140 | 0.9% |
| Selling possessions | 290 | 1.9% |
| Total | 15,540 | 100.0% |
Variation by nationality
A greater proportion of Kazakh respondents than those of all other nationalities stated they covered their pre-arrival costs using a formal loan (17.5%) compared to all other countries, for example, Uzbekistan (1.9%). They were also less likely to get a loan from family and friends (18.4%) compared with all other countries, for example, 31.3% of respondents from Kyrgyzstan (see Annex A, Table A2).
In comparison, Uzbek respondents reported more frequently than other nationalities that they used savings to fund their recruitment and travel costs (70.6%) (see Annex A, Table A2).
4.3 Accuracy of information provided during the recruitment process (total number of respondents: 15,998)
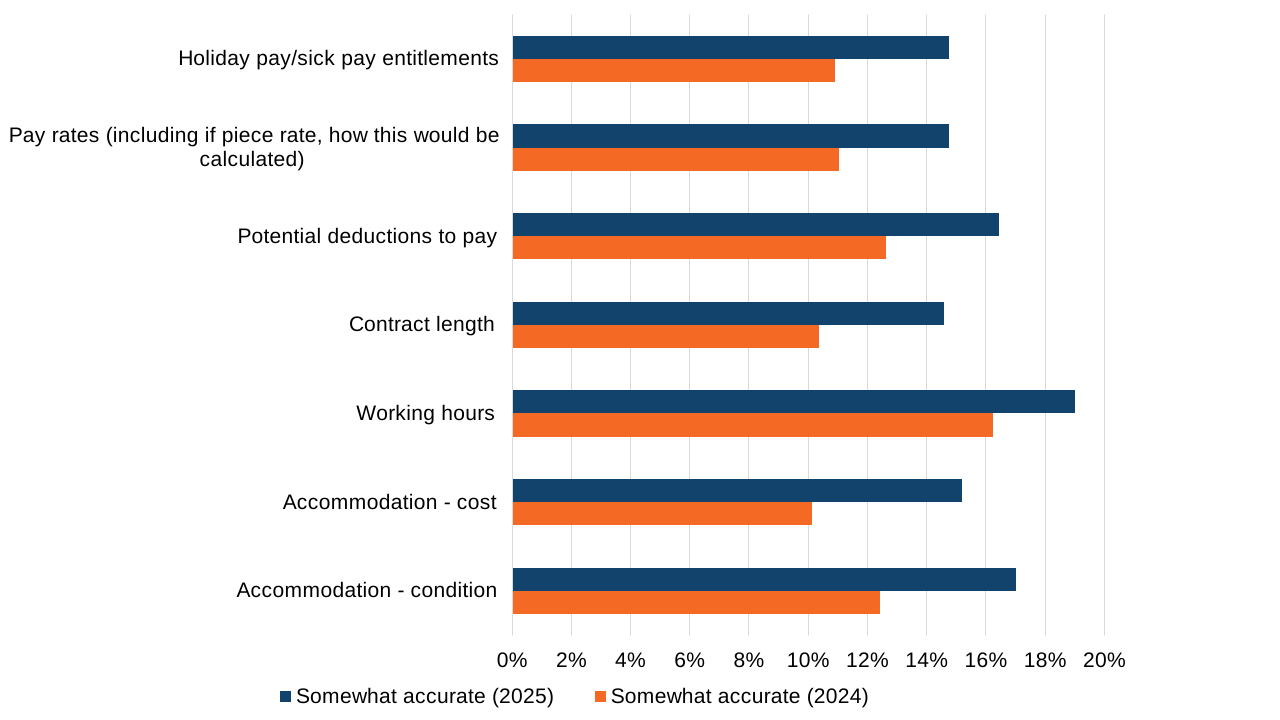
Most respondents stated the information provided during recruitment was accurate (see Figure 5). The majority of respondents indicated the information on the cost of accommodation was accurate (83.1% or 1,299 responses), while information on working hours was least frequently stated as accurate (77.0% or 12,316 responses). The proportion of respondents reporting that the information was ‘accurate’ or ‘somewhat accurate’ was very similar to 2024. See Figures 5, 6a and 6b.
When given the opportunity to comment on anything else about their experience, some respondents further elaborated on the information provided. For example, one respondent wrote:
“Overall, my experience was positive. The process was clear and organised, and the information was provided in a timely manner. There were small points where I would like to have more clarification or quicker feedback, but overall it didn’t affect the overall impression.”
Figure 5: Accuracy of information provided during recruitment (total number of respondents: 15,998)
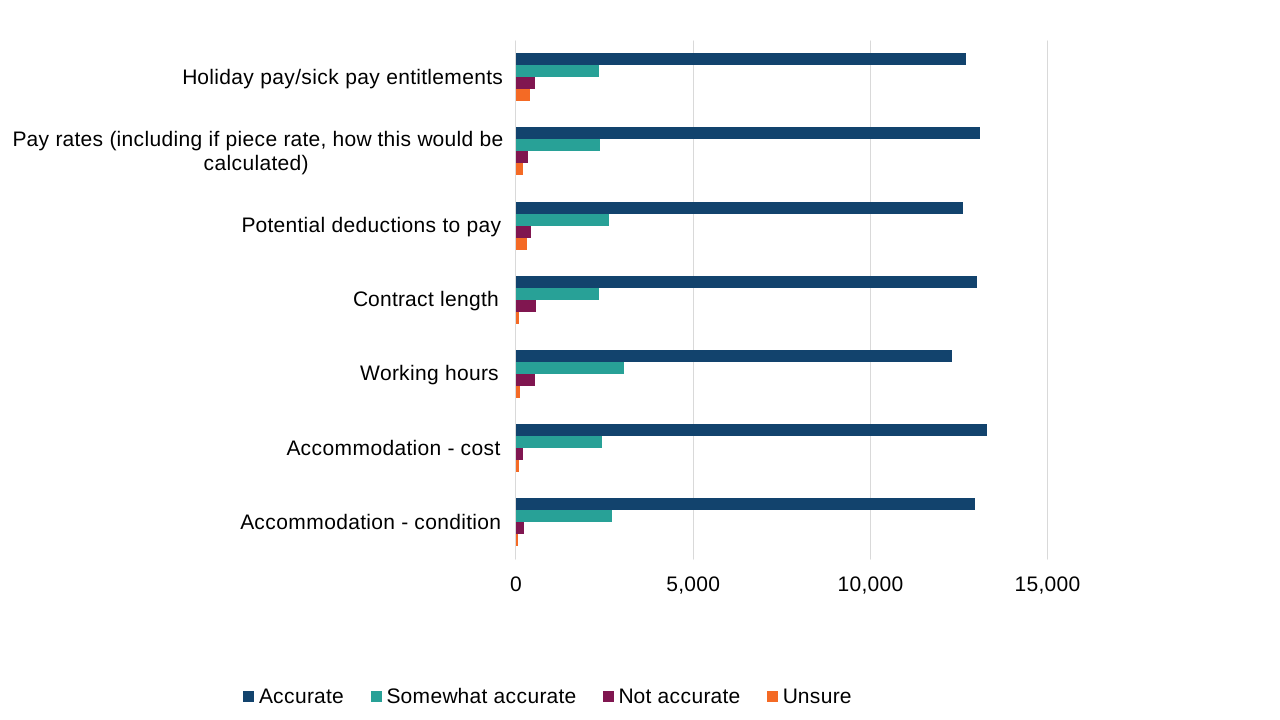
Figure 6a: Accuracy of information provided during recruitment, 2024/25 comparison: ‘Accurate’
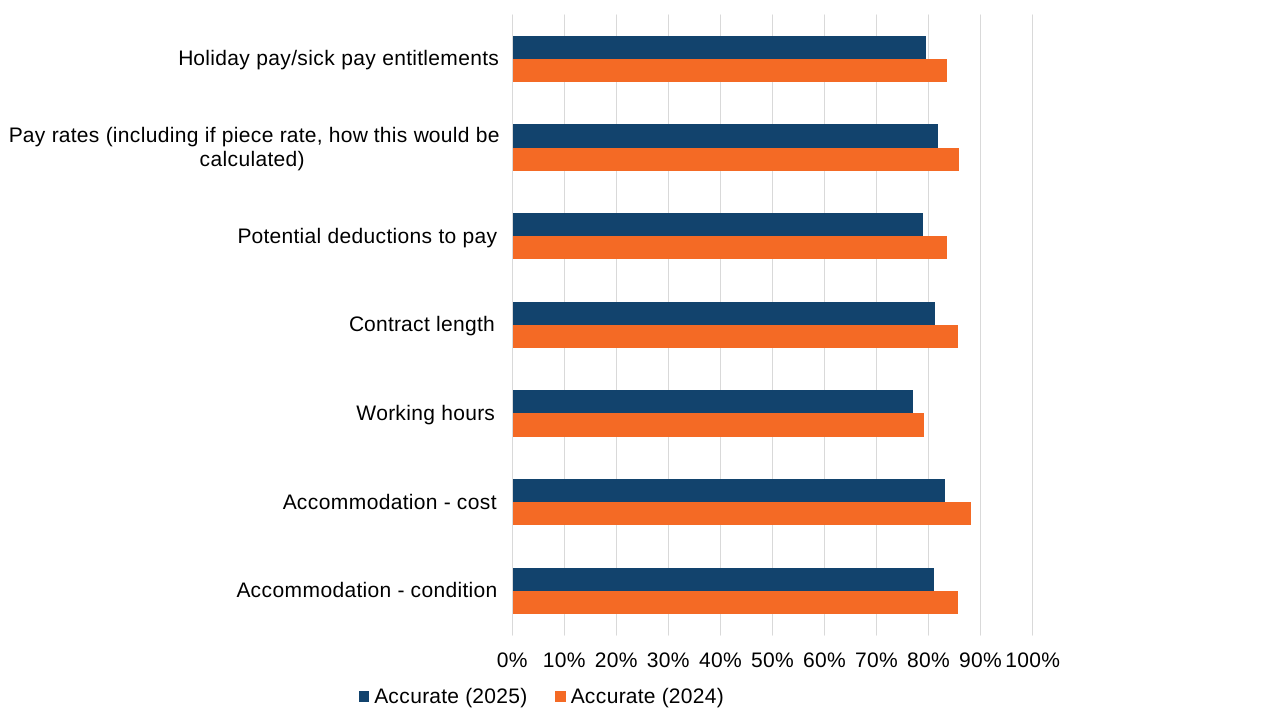
Figure 6b: Accuracy of information provided during recruitment, 2024/25 comparison: ‘Somewhat inaccurate’
5. Contracts, pay and hours worked, and duration of work
It is important that pay and working conditions are fully understood by migrant workers. The survey asked if contracts were available to them in their first language and, if not, in a language they were fluent in.
To check if workers were paid fairly, the survey asked if respondents were paid for all the work they did, and if they received the minimum number of hours of pay per week (32 hours averaged over their pay period). Workers often want to maximise their earning potential, so the survey asked how long they worked in the UK and how long after arriving in the UK they started work.
5.1 Contracts
Most respondents were provided with a contract in their first language (81.3%, see Table 9), with this proportion increasing from 2024 (75.2%). Of those 2,982 of respondents who stated they were not provided a contract in their first language, 86.8% of respondents stated their contract was provided in a language they were fluent in, while the remaining 13.2% of respondents said they did not receive a contract in a language that they were fluent in (see Table 10).
Therefore, 2.5% stated they did not receive a contract in either their first language or a language they were fluent in; a reduction from 3.7% in 2024.
Table 9: Contract provided in respondent’s first language (total number of respondents: 15,973)
| Contract provided in first language | Respondents | Percentage |
|---|---|---|
| Yes | 12,991 | 81.3% |
| No | 2,982 | 18.7% |
| Total | 15,973 | 100.0% |
Table 10: Contract provided in a language the respondent was fluent in (total number of respondents: 2,979, respondents were asked this question if they answered that their contract was not provided in their first language)
| Contract provided in language fluent in | Respondents | Percentage |
|---|---|---|
| Yes | 2,586 | 86.8% |
| No | 393 | 13.2% |
| Total | 2,979 | 100.0% |
5.2 Pay and hours worked (total number of respondents: 15,516)
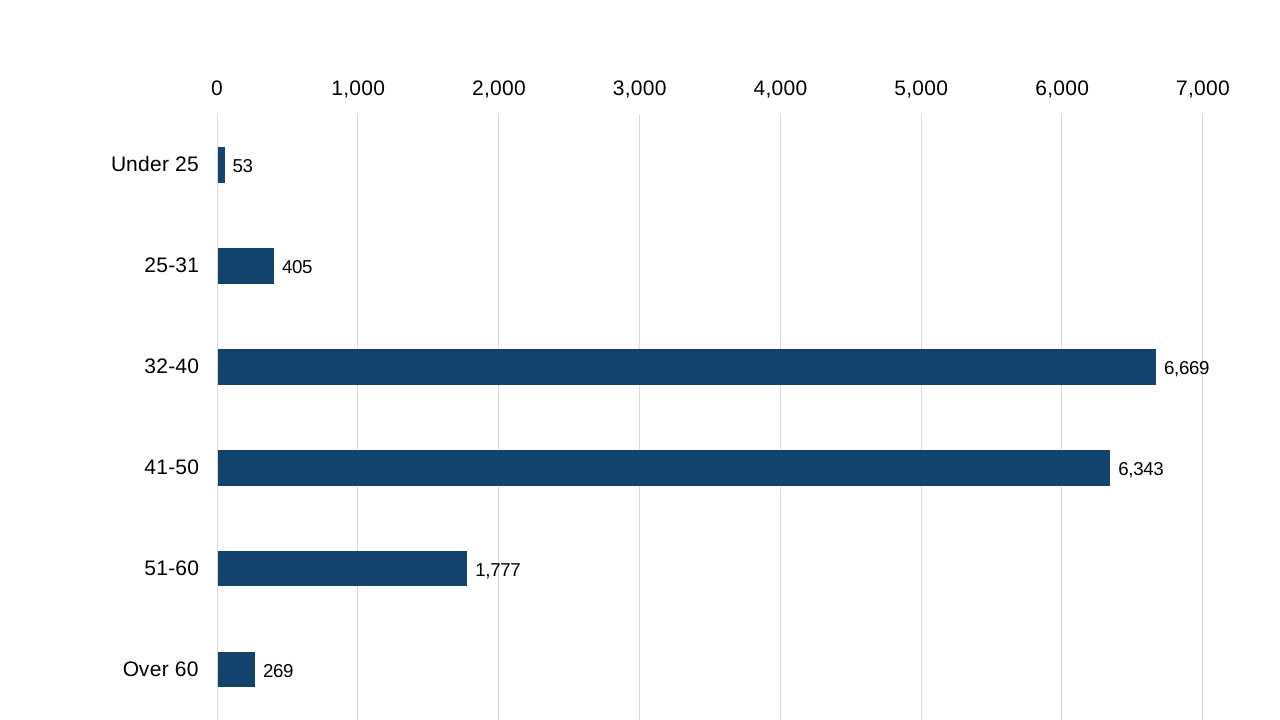
Almost all (97.0%) stated they worked on average for 32 or more hours per week, with 43.0% of respondents stating they worked between 32 to 40 hours, and 40.9% worked between 41 to 50 hours a week (see Figure 7).
Figure 7: Average number of hours worked in a week (total number of respondents: 15,516)
The 2025 survey showed a decrease in the percentage of respondents stating that they were paid for all their work (including associated time such as setting up and cleaning), from 96.2% in 2024 to 87.7% in 2025.
Respondents who answered that they were not paid for all of the work they did (12.3%, an increase from 3.8% in 2024) were given the opportunity to explain in more detail what they were not paid for. The most common responses were weather conditions impacting working hours, seasonal downturn, and only being paid for the hours they worked.
When given the opportunity to comment on their experience, some respondents further elaborated on their working hours and pay. For example, one respondent wrote:
“Unloading crates, cleaning the greenhouse. The working time is stopped, as we put down our knives. However, time for cleaning all the boxes, unloading, preparing everything for tomorrow (it takes 25–35 min) is not added to the working time. And then we wait for the transfer home from 1 hour to 2.5 hours. Sometimes we can go to a break, and the break time is deducted.”
Variation by country of work in the UK
Respondents in England more frequently reported working 41 hours or over on average per week (55.3%) than those working in Scotland, Northern Ireland and Wales (46.3%). In 2024, the proportion was 49.0% in England compared with 31.6% in Scotland, Northern Ireland and Wales (see Annex D, Table D1).
5.3 Length of time in UK before work started (total number of respondents: 15,396)
The majority of respondents (93.1%) were in the UK for 3 days or less before starting work, with 5.2% of respondents waiting for between 4 and 7 days between arriving to the UK and starting work (see Figure 8 and Table 11).
Figure 8: Length of time respondents spent in UK before starting work (total number of respondents: 15,396)
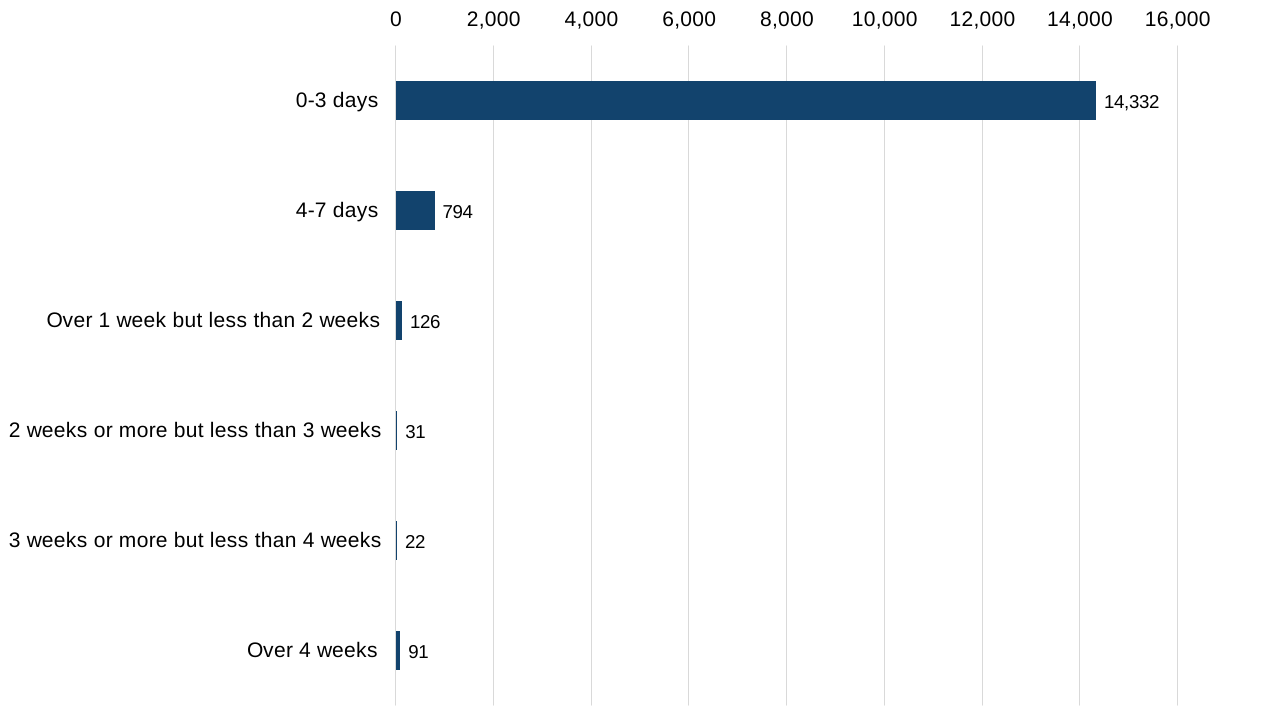
Table 11: Length of time respondents spent in UK before starting work (2023-2025)
| How long after arriving in the UK did you begin working? | 2023 | 2024 | 2025 |
|---|---|---|---|
| 0-3 days | 82.1% | 85.5% | 93.1% |
| 4-7 days | 12.5% | 11.0% | 5.2% |
| Over 1 week but less than 2 weeks | 3.8% | 2.3% | 0.8% |
| 2 weeks or more but less than 3 weeks | 0.9% | 0.6% | 0.2% |
| 3 weeks or more but less than 4 weeks | 0.2% | 0.2% | 0.1% |
| Over 4 weeks | 0.5% | 0.5% | 0.6% |
| Total | 100.0% | 100.0% | 100.0% |
5.4 Duration of work (total number of respondents: 15,461)
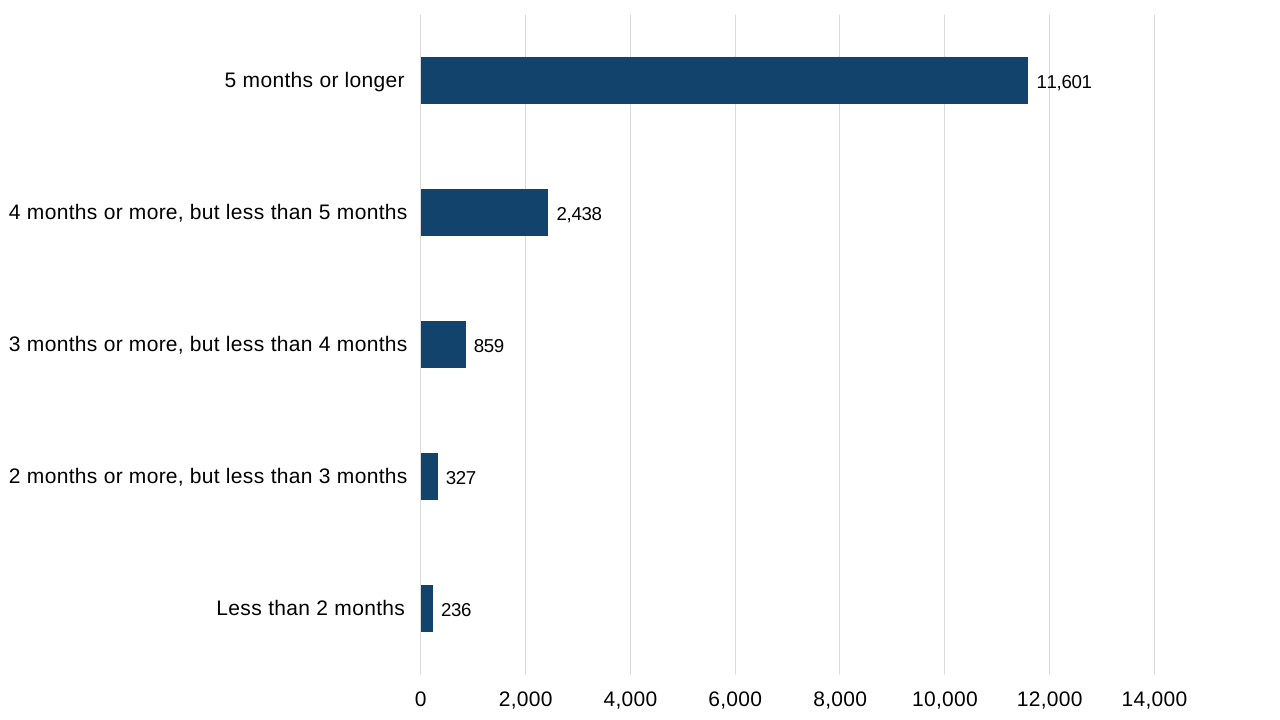
Most respondents (75.0%) stated they worked in the UK for 5 months or longer (see Figure 9). There has been an increase in the proportion of respondents answering they worked for 5 months or longer in recent surveys, increasing from 60.7% in 2022, to 69.5% in 2023, to 74.7% in 2024, and 75.0% in 2025. For most workers, it is preferable to spend as long as their visa allows working in the UK, as this helps improve their earning potential while on the Seasonal Worker visa route. For example, one respondent noted in their free text answer, when asked whether there was anything else about their experience they would like to share, that they wanted work for the full period of their visa:
“I would like to be given work exactly until the end of my visa. That is, find me a job fully for 6 months.”
Another respondent wrote:
“My main request is that, regardless of which country we come from, I would kindly ask for the visa duration to be extended to one year, because with more time we could work more and achieve more.”
Figure 9: Duration of work in the UK (total number of respondents: 15,461)
5.5 Payslips and claiming back income tax
Almost all respondents (97.1% or 14,846 responses) stated that their payslip clearly explained how their pay was calculated, including the hours they worked, bonus pay, deductions and what the deductions were for.
Respondents who stated their payslip did not clearly explain how their pay was calculated were then asked what was not clearly explained, via a multiple-choice question: ‘tax/National Insurance’, ‘hours’ and ‘bonus’ received the greatest proportions of responses (see Table 12).
Table 12: What respondents stated their payslips did not clearly explain (total number of respondents: 638)
| What payslips did not clearly explain | Respondents | Percentage |
|---|---|---|
| Hours | 150 | 23.5% |
| Pay rate | 86 | 13.5% |
| Bonus | 149 | 23.4% |
| Deductions | 80 | 12.5% |
| Tax or National Insurance | 173 | 27.1% |
| Total | 638 | 100.0% |
We added a new question in the 2025 survey on whether workers successfully claimed back their tax after working in the UK (15,025 respondents). 74.9% said that they did; however, 25.1% said they did not. In addition, respondents provided follow-up comments to explain why they did not claim back tax. Of the responses that offered further explanation, the most common responses were that they intended to apply later, and their tax refund was taking longer than expected.
Table 13: Were you successful in claiming your tax back? (total number of respondents: 15,025)
| Were you successful in claiming your tax back? | Respondents | Percentage |
|---|---|---|
| Yes | 11,255 | 74.9% |
| No | 3,779 | 25.1% |
| Total | 15,025 | 100.0% |
Variation by gender
Gender variation was evident in the responses. A greater proportion of male respondents stated their payslip did not clearly explain ‘bonus’ (24.6% or 126 responses compared with 17.7% of females or 22 responses), (see Annex B, Table B2).
6. Costs in the UK and on farm experiences
To check migrant workers are not paying undue costs in the UK that unfairly reduce their take home earnings, the survey asked respondents what they paid for after arriving in the UK. This included a range of potential costs, including travel, accommodation, utility bills and living essentials.
The survey also asked respondents to describe their experience working in the UK regarding factors including their accommodation, their supervisors/farm managers, and their access to healthcare.
6.1 Costs incurred after arriving in the UK (total number of responses: 27,436)
The most commonly selected costs in the UK were travel to get to the farm when arriving in the UK or travel to a new farm (44.2%), accommodation (41.4%) and living essentials (30%), (see Table 14).
Table 14: Costs after arrival in the UK (total number of responses: 27,436)
(Respondents were asked to select all that apply, therefore total percentages may not equal 100%)
| Post-arrival cost | Respondents | Percentage |
|---|---|---|
| Accommodation cost | 6,945 | 41.4% |
| Travel costs to get to farm when arriving in UK/to a new farm | 7,415 | 44.2% |
| Personal Protective Equipment e.g. uniform, boots, gloves (equipment your employer says you must wear/use for your safety) | 2,105 | 12.5% |
| Living essentials for example bedding, cooking utensils | 5,039 | 30.0% |
| Utilities, for example electric, gas, water | 2,521 | 15.0% |
| Laundry | 2,252 | 13.4% |
| WiFi | 1,159 | 6.9% |
When given the opportunity to provide feedback on their experience, some respondents further elaborated on the additional costs they incurred for things like utilities and travel. For example, one respondent wrote:
“I would like electricity, gas, and laundry to be included in the accommodation payment rather than charged separately. And I would like transportation to and from the supermarket every week. In my case, during the first 2 months, we were not taken because there were few people on the farm. Later, when they started taking us, it was only one-way, without return transport.”
Another respondent wrote:
“During my employment, accommodation was provided directly on the farm, and its cost was deducted from wages. Given the high food prices and the general cost of living, these deductions significantly reduced actual income, and real earnings were much lower than expected.”
6.2 On-farm experience (total number of responses: 3,596)
Figure 10 shows the response to questions regarding on-farm experience was generally positive, with between 84.2% and 95.6% of respondents answering that they were ‘happy’ with the listed topics, including accommodation, hours available, and pay.
The least frequently selected options for the ‘happy’ responses were ‘access to healthcare’ (84.2%), and the ‘ability to raise complaints / complaints procedure’ at 85.5% of responses.
In comparison, far fewer respondents stated they were ‘unhappy’ with the listed conditions, ranging from 1.3% respondents answering they were ‘unhappy’ with ‘safety’ to 4.8% of respondents for ‘ability to raise complaints / complaints procedure’.
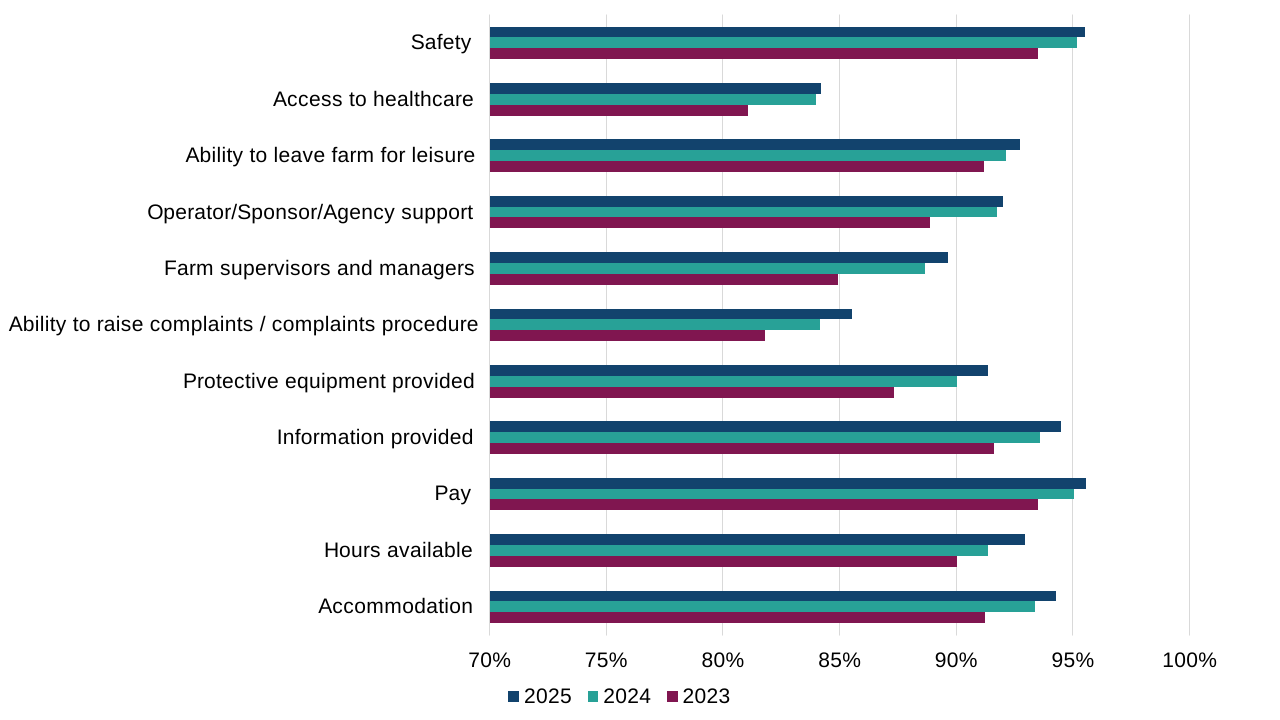
Compared to the previous 2 years (2023 to 2024), the percentage of respondents who have selected ‘happy’ for each listed topic has increased (see Figure 10a).
Figure 10: Satisfaction across a range of farm conditions (total number of responses: 3,596)
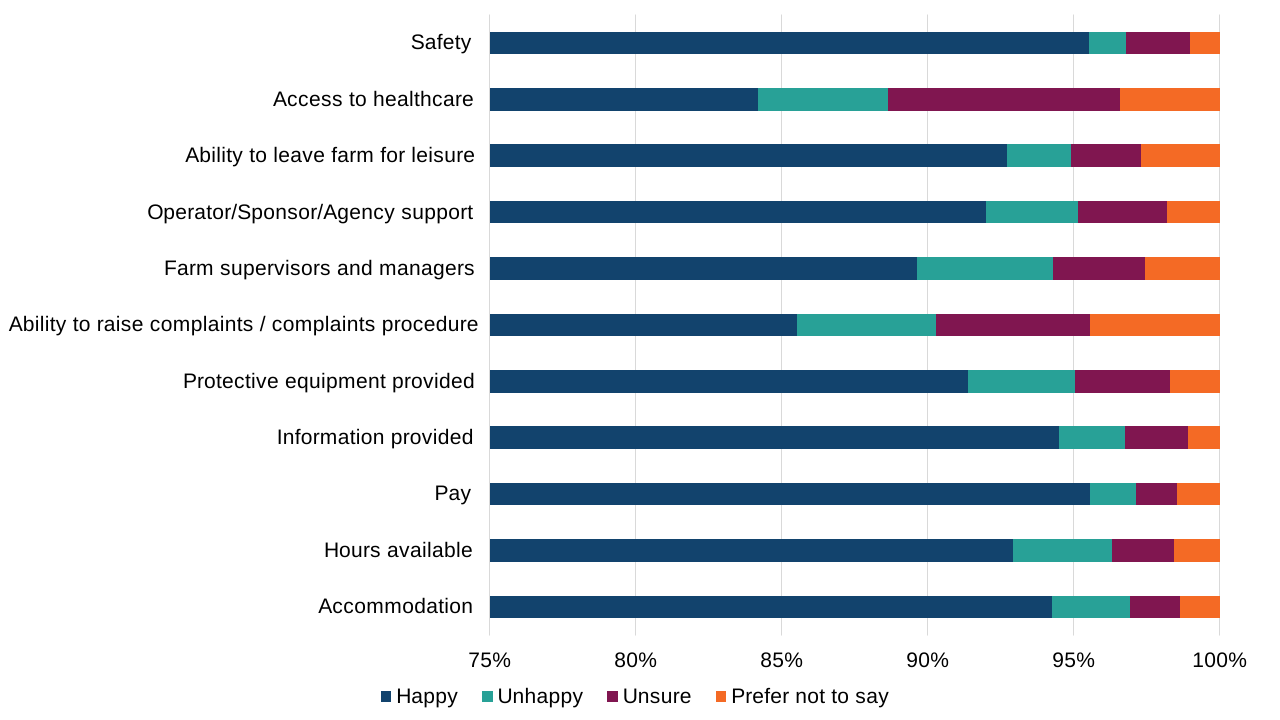
Figure 10a: How did you feel about the following when working in the UK? (Happy) 2023 to 25
When given the opportunity to provide feedback on their experience, some respondents elaborated on the state of their accommodation. For example:
“The caravans need updating and their conditions improved. Also, washing machines and dryers should be available for free use.”
Another respondent noted:
“More than 30 people for 2–3 washing machines is a lot, the machines do not endure! Same thing with dryers! The rooms are cold as there are gaps in the walls. For such conditions I think 330 pounds was a lot. you have to stand in queues just to cook food. I wish they’d at least let us have a rest after work.”
Another respondent noted:
“I really liked the farm, especially the caravans. They are very cosy, pleasant; everything is new and in good condition. I also really liked the work, the salary was paid on time, and the colleagues are excellent.”
Variation by nationality
Respondents from the ‘other’ nationality category marginally less frequently reported that they were ‘happy’ across several of the conditions on farm compared with Central Asian nationals. For example, 84.4% of ‘other’ nationalities answered that they were happy with their personal protective equipment, compared with 88.5% of respondents from the 4 Central Asian countries (see Annex A, Table A3).
7. Complaints, transfers, and access to health care
If a seasonal worker is unhappy with their employment, or life on farm, it is important they can access a complaints process that they trust. The survey asked respondents if they knew how to raise a complaint, whether they had raised a formal complaint and, if they had, who they raised it with, what the grievance was about and if it was followed up. The survey also asked respondents who had a grievance but did not raise a formal complaint why they did not do so.
The ability to transfer to another farm is an important option for seasonal workers. The survey asked respondents several questions on this topic, such as if they had requested a transfer and why, and if their transfer request was accepted and they moved.
The survey also addressed access to healthcare (if required), with questions including whether appropriate treatment was received for any sickness or injury, and if respondents were well supported by their farm and scheme operator.
7.1 Complaints (total number of respondents: 15,242)
Slightly more than 8 out of 10 respondents (83.8% or 12,791 responses) stated they knew how to raise a complaint if they were unhappy with their employment and/or life on the farm. This is an increase from 81.8% in 2024, 78.3% in 2023 and 70.7% in 2022, though it should be noted the question in 2022 asked whether they were unhappy with their employment.
Respondents were also asked whether they had a grievance while working in the UK and if they raised a complaint as a result (15,242 total respondents, see Table 15). The majority of respondents answered they did not have a grievance (88.8%); however, 1.8% had a grievance and raised a formal complaint and 9.4% had a grievance but did not raise a formal complaint.
Table 15: Whether the respondent experienced a grievance (total number of respondents: 15,242)
| Whether the respondent experienced a grievance | Respondents | Percentage |
|---|---|---|
| Yes, and I raised a formal complaint | 276 | 1.8% |
| Yes, I had a grievance but did not raise a formal complaint | 1,432 | 9.4% |
| No | 13,534 | 88.8% |
| Total | 15,242 | 100.0% |
Of the 268 respondents who did raise a formal complaint and answered the follow-up question about who they raised the complaint with, respondents most frequently reported raising a complaint to their farm manager (31.3%), supervisor (30.2%), or to an operator/sponsor/agency (24.3%), (see Table 16).
Table 16: Who workers raised complaints with (total number of respondents: 268)
| Complaint raised with | Respondents | Percentage |
|---|---|---|
| Supervisor | 81 | 30.2% |
| Farm manager | 84 | 31.3% |
| Operator/Sponsor/Agency | 65 | 24.3% |
| Embassy or consulate | 0 | 0.0% |
| Gangmasters and Labour Abuse Authority (GLAA) – (UK government) | 7 | 2.6% |
| UKVI (Home Office, UK government) | 2 | 0.7% |
| A worker support organisation (not the farm or operator) | 16 | 6.0% |
| Other, please provide details | 13 | 4.9% |
| Total | 268 | 100.0% |
The most common reasons stated by respondents for raising a grievance were ‘not enough hours’ (14.8%) closely followed by ‘supervisor/manager’ (13.5%). This was followed by ‘accommodation’ (10.4%), (see Table 17).
Table 17: Categories and numbers of complaints raised (total number of responses: 386)
| Nature of complaint | Respondents | Percentage |
|---|---|---|
| Accommodation | 40 | 10.4% |
| Racism or discrimination | 38 | 9.8% |
| Bullying or harassment | 26 | 6.7% |
| Assault or sexual assault | 5 | 1.3% |
| Not enough hours | 57 | 14.8% |
| Pay | 28 | 7.3% |
| Supervisor or manager | 52 | 13.5% |
| Co-workers | 25 | 6.5% |
| Transfers | 18 | 4.7% |
| Working conditions | 26 | 6.7% |
| Productivity targets | 11 | 2.8% |
| Health and safety concerns | 21 | 5.4% |
| Other | 39 | 10.1% |
| Total | 386 | 100.0% |
When asked whether their complaint was followed up (see Table 17a), 29.6% of respondents (79 responses) answered it was not, a reduction from 37.0% in 2024. Answers to this question show an improving picture over the last few years, with 55.2% in 2022, 58.9% in 2023, 63.0% in 2024 and 70.4% in 2025 stating their complaint was followed up.
Table 17a: Complaint followed up or not followed up (total number of respondents: 267)
| Q27d: Was your complaint followed up? | Respondents | Percentage |
|---|---|---|
| Yes | 188 | 70.4% |
| No | 79 | 29.6% |
| Total | 267 | 100.0% |
Those who stated they had a grievance but did not raise a formal complaint (9.4% or 1,432 respondents) were asked why they did not do so. Respondents were asked to select all that apply; therefore, the total count of responses does not equate to the total number of respondents. The most frequently reported answers were ‘worried I would not be invited back to work’ at 22.1% of respondents, followed by ‘did not believe action would be taken’ at 17.0% of respondents and ‘afraid I would lose my job’ at 14.6% of respondents (see Table 18).
Table 18: Reason respondents who had a grievance did not raise a formal complaint (total number of responses: 3,061)
| Reason complaint was not raised | Responses | Percentage |
|---|---|---|
| Concerned my employer would find out | 294 | 9.6% |
| Did not believe action would be taken | 521 | 17.0% |
| Was worried it would have an impact on my right to stay in the UK | 370 | 12.1% |
| Afraid I would lose my job | 446 | 14.6% |
| Transferred off farm where grievance occurred | 53 | 1.7% |
| My grievance was resolved | 250 | 8.2% |
| Did not know who to tell | 255 | 8.3% |
| Language barrier | 196 | 6.4% |
| Worried I would not be invited back to work next year | 676 | 22.1% |
| Total | 3,061 | 100.0% |
Table 18a shows the reasons for grievances where respondents did not raise a formal complaint.
Table 18a: Nature of grievance where a formal complaint was not raised (total number of responses: 2,401)
| Nature of grievance where a formal complaint was not raised | Responses | Percentage |
|---|---|---|
| Accommodation | 165 | 6.9% |
| Racism or discrimination | 233 | 9.3% |
| Bullying or harassment | 85 | 3.5% |
| Assault or sexual assault | 5 | 0.2% |
| Not enough hours | 208 | 8.7% |
| Pay | 59 | 2.5% |
| Supervisor or manager | 342 | 14.2% |
| Co-workers | 104 | 4.3% |
| Transfers | 31 | 1.3% |
| Working conditions | 148 | 6.2% |
| Productivity targets | 62 | 2.6% |
| Health and safety concerns | 65 | 2.7% |
| Other | 904 | 37.7% |
| Total | 2,401 | 100.0% |
When given the opportunity to feedback on their experience, a few respondents further elaborated on their ability to raise a complaint. For example, one respondent wrote:
“We have stuff to say, but we stay silent so as not to lose our jobs. Because we really need this job.”
Variation by nationality
Very few respondents stated the nature of their complaint, and therefore meaningful comparisons between nationalities cannot be made.
Nine respondents from Kazakhstan and 9 respondents from the ‘other’ countries stated their complaint was due to racism or discrimination. Four respondents from Kyrgyzstan and 8 respondents from the ‘other’ countries stated their complaint was about their co-workers. Two respondents from Tajikistan and 20 respondents from the ‘other’ countries stated they raised a complaint about accommodation (see Annex A, Table A4).
Additionally, only 39.3% (11 responses) of Kazakh and 59.5% (47 responses) of Kyrgyz respondents reported that their complaint was followed up, compared with 90.2% or 83 responses for ‘other’ countries (see Annex A, Table A5).
Variation by age group
There was a slight variation between age groups regarding who respondents complained to. For example, 18 to 24 year olds were more likely than other age groups to raise their complaint to a supervisor compared to those respondents reporting as age 39 and over (see Annex C, Table C1).
The 18 to 24 year old group also reported most frequently that their complaint was followed up, at 92.9% compared with the overall proportion of 70.4% (total of 267 respondents), (see Annex C, Tables C2 and C3).
Variation by gender
Females were more likely (37.1% or 23 responses) than males (28.1% or 57 responses) to make a complaint to their supervisor, and less likely to complain to the operator/sponsor/agency (14.5% of females or 9 responses, compared with 27.1% of males or 55 responses). Females reported that their complaints were more likely to be followed up (86.9% or 53 responses) compared with males (66.0% or 134 responses), (see Annex B, Table B3).
7.2 Transfers
Over recent years there has been a reduction in the number of respondents who requested transfers to another farm during their time in the UK. In 2025, it was 15.9% (2,437 responses). This compares to 19.3% (2024) and 23.5% (2023). Of the 15.9% in 2025, 61.4% were transferred, 33.6% were not and 5.0% had their transfer granted but were unable to move. This compares to 57.7%, 38.0% and 5.0% of respondents respectively in 2024.
In this 2025 survey we added new options to the question ‘Why did you request a transfer to another farm?’. The greatest proportion of respondents stated, ‘season or contract ended and no more work was available’ (a new survey option for 2025), followed by ‘not enough hours’ (see Table 19). The next most frequently stated reason was ‘to be with friends and/or family’.
Table 19: Reason respondents requested a transfer to another farm (total number of responses: 3,138)
| Reason for requesting a transfer | Responses | Percentage |
|---|---|---|
| Not enough hours | 705 | 22.5% |
| To be with friends and/or family | 536 | 17.1% |
| Poor housing conditions | 211 | 6.7% |
| Poor treatment from supervisor/others on current farm | 422 | 13.4% |
| Season or contract ended and no more work was available | 934 | 29.8% |
| Dismissed | 76 | 2.4% |
| High productivity targets at farm | 107 | 3.4% |
| Health, e.g. allergy | 76 | 2.4% |
| Work or cultural experience | 71 | 2.3% |
| Total | 3,138 | 100.0% |
Respondents were given the opportunity (questions 25d and 30) to tell us about their experience and responses on the topic of transfers included:
“We worked very well in Scotland, but after 4 months, our contract was terminated, and we were not given a transfer. It would be good to work until the end of the contract. Please review this issue.”
Another respondent noted:
“After the heavy rains, working hours decreased gradually and I was afraid that there won’t be any work for us. But the manager promised that we will get the minimum hours even if there isn’t much work to do, they’ll find us work no matter what. So, I ended up not accepting the transfer because I had assurance and they provided work as promised.”
Another respondent noted:
“Our manager ignored us. We asked and explained the situation many times.”
Table 20 shows that, of those who were refused a transfer, ‘no job available’ was by far the most frequently selected answer at 45.2% of respondents (367 responses), a 5.9% increase compared to 2024. There was also a 5.8% decrease compared to 2024 in the proportion of respondents who were refused a transfer and reported ‘transfer was refused and no reason given’.
Table 20: Reason respondent’s transfer request was not fulfilled (total number of responses: 812)
| Reason why transfer was refused | Respondents | Percentage |
|---|---|---|
| No job available | 367 | 45.2% |
| No job available at the farm I wanted to go to | 102 | 12.6% |
| Required on current farm | 56 | 6.9% |
| Visa was about to expire | 25 | 3.1% |
| Additional training requirements made it not possible | 0 | 0.0% |
| Transfer was refused and no reason given | 69 | 8.5% |
| No response to the transfer request | 143 | 17.6% |
| Other | 50 | 6.2% |
| Total | 812 | 100.0% |
Variation by nationality
Reasons for requesting a transfer varied widely. For example, respondents from the 4 Central Asian countries (ranging from 15.6% to 25.6% of respondents) requested a transfer to be with friends, in comparison with 6.4% of respondents from ‘other’ countries (see Annex A, Table A6). 57.7% of Tajik respondents and 41.1% of Kazakh respondents stated they were not transferred to another farm as there was ‘no job available’ (see Annex A, Table A7).
Respondents from the ‘other’ nationalities were more likely to seek a transfer if the contract ended early and no more work was available (47.7%), compared with the 4 Central Asian countries (varying from 24.1% to 33.4%), (see Annex A, Table A6). 16.8% of Uzbek respondents stated that they were unable to transfer as they were ‘required on current farm’ compared with the other 3 Central Asian countries and ‘other’ countries which ranged from 4.5% to 6.3% (see Annex A, Table A7).
7.3 Access to healthcare (total number of responses: 15,216)
A few respondents indicated that they required medical treatment due to sickness or injury while in the UK (6.1%). Of those respondents who were sick or injured, 66.7% of respondents received treatment. This represents a slight improvement from the 2024 worker survey findings, where 62.5% of respondents indicated they had received treatment.
The respondents who stated they did not receive treatment were asked why not (see Table 21). To note, comparison between previous surveys is not reliable due to rephrasing of the question and options. The most frequently chosen option was ‘I thought it would be too expensive’ (23.1%). This was followed by ‘I chose not to seek treatment’ (19.6%) and ‘I didn’t know how to seek treatment’ (18.1%).
Table 21: Reason respondents did not receive treatment for sickness or injury (total number of respondents: 403)
| Reason for not receiving treatment | Respondents | Percentage |
|---|---|---|
| I chose not to seek treatment | 79 | 19.6% |
| I didn’t know how to seek treatment | 73 | 18.1% |
| I thought it would be too expensive | 93 | 23.1% |
| I couldn’t take time off work or was told to keep working | 17 | 4.2% |
| I was told I was not allowed to see a healthcare professional (e.g. a doctor/dentist) in the UK | 16 | 4.0% |
| I couldn’t get an appointment to see a doctor/dentist, or I couldn’t travel to the appointment | 39 | 9.7% |
| I didn’t want or need the treatment offered | 43 | 10.7% |
| Other | 43 | 10.7% |
| Total | 403 | 100.0% |
The majority of respondents to this question in 2025 (76.7% or 733 responses) indicated they were well supported in accessing and receiving treatment (see Table 22). This is similar to 2024 where 76.9% (613 responses) stated they were well supported. However, 19.7% (188 responses) stated that they were not well supported, an increase compared to 14.7% (117 responses) in 2024.
Table 22: Support in accessing and receiving treatment (total number of respondents: 956)
| Respondents’ answer to whether they were supported in accessing and receiving treatment | Respondents | Percentage |
|---|---|---|
| Yes | 733 | 76.7% |
| No, I was not well supported by the farm | 188 | 19.7% |
| No, I was not well supported by my visa Operator/Sponsor/Agency | 35 | 3.7% |
| Total | 956 | 100.0% |
Variation by gender
Female respondents (73.2% or 183 responses) reported more frequently that they received treatment compared with males (64.6% or 439 responses), (see Annex B, Table B4).
Variation by country of work in the UK
A greater proportion of respondents who worked in Scotland, Northern Ireland and Wales than those who worked in England reported that they received treatment (80.3% or 122 responses compared with 64.2% or 496 responses), (see Annex D, Table D2).
8. Overall Satisfaction
For the welfare of workers and for the business interests of UK farms, it is important to understand seasonal workers’ experiences living and working in the UK. It is vital for the Agriculture and Horticulture sectors that seasonal workers have a positive experience whilst in the UK, want to return the following year, and would recommend the UK as a good place to work when they return to their home country.
8.1 Overall experience whilst in the UK (total number of respondents: 15,637)
Selecting from multiple choice options, nearly all respondents (94.1% or 14,713 responses) stated they would describe their experience working in the UK as either ‘extremely positive’ or ‘positive’. Only 2.4% (371 responses) stated their experience was ‘negative’ or ‘extremely negative’ (see Figure 11).
Figure 11: Description of experience working in the UK (total number of respondents: 15,637)
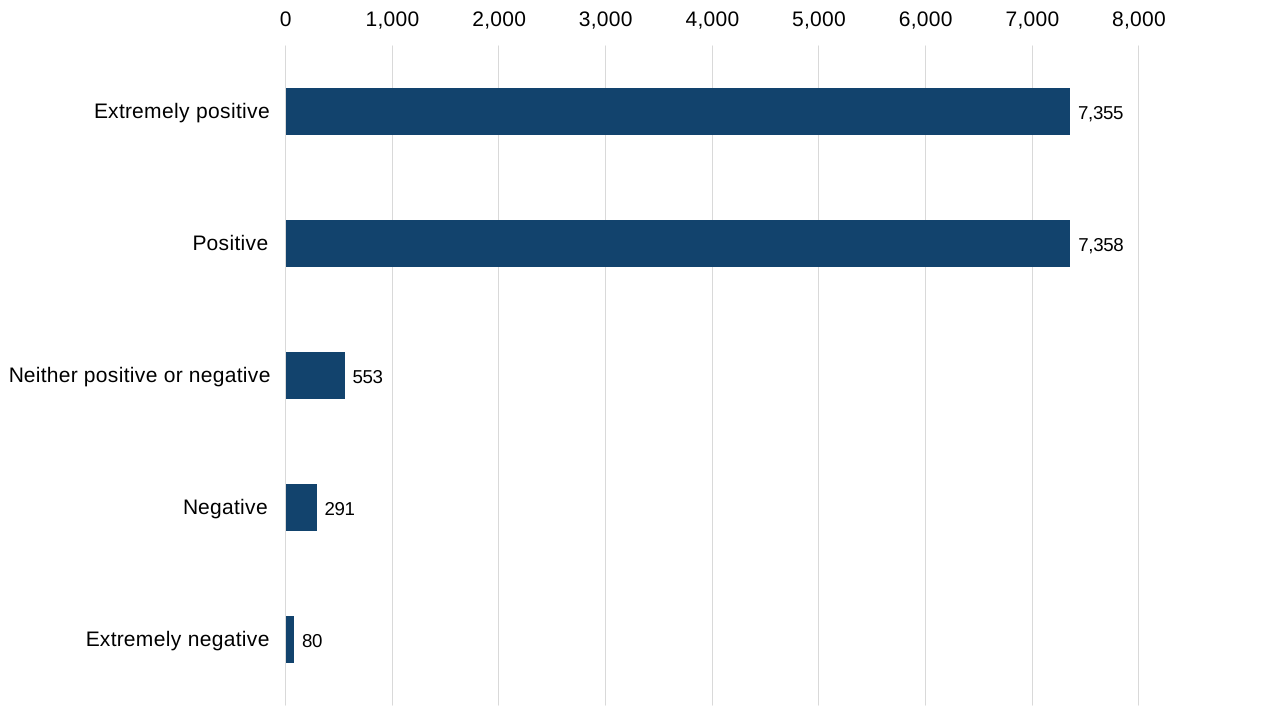
There has been an improvement in this score over the years the survey has been running. In 2022, 85.9% of respondents stated that their overall experience of seasonal work in the UK was either ‘extremely positive’ or ‘positive’, increasing to 91.0% in 2023, then to 94.2% in 2024 and 94.1% in 2025.
8.2 Desire to return to the UK to work (total number of respondents: 15,207)
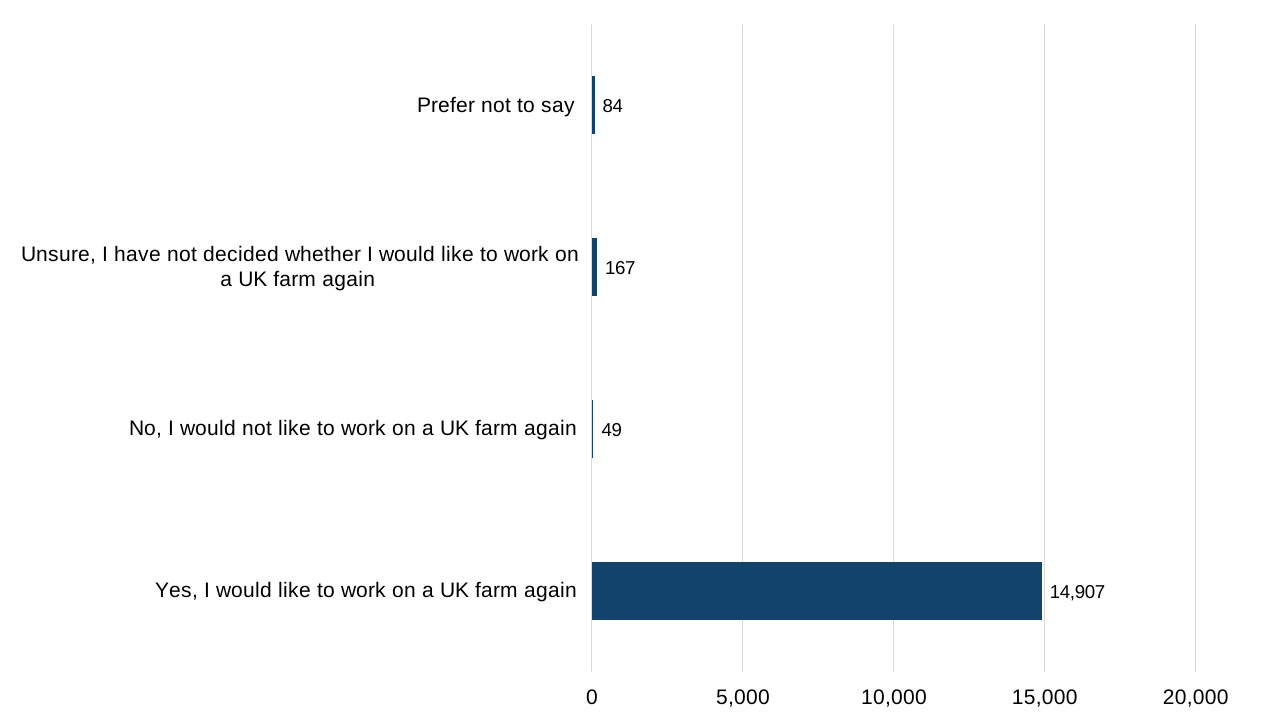
Almost all respondents (98%) selected they would like to return to work on a UK farm again (see Figure 12) and only 0.3% of respondents stated they did not want to return to the UK to work on a farm. When given the opportunity to provide feedback on their time in the UK, many respondents said they would like to return for seasonal work in the UK in the future, and that they had learnt new skills and experience. However, some respondents reported experiencing or witnessing discrimination or racism:
“The experience is very positive in terms of work, but unfortunately, there is a great deal of racism from other nationalities.”
Another respondent wrote:
“In my second year I faced problems from the very beginning of my arrival on the farm, such as discrimination, discriminating by nations, bullying of my colleagues…”
Some commented on general conditions and challenges:
“The only disadvantage is that the housing is an hour away from work. As a result, problems arise, such as being late for work. Sometimes the bus breaks down, and after work, one has to wait a long time for it to come.”
Another respondent noted:
“Since the term of our work is only 6 months, and travelling requires significant financial costs, we would like to draw attention to some points. Given that the work is hard, it would be appropriate to increase the hourly wage above the minimum wage, and to reduce the cost of accommodation or improve the living conditions — no more than 4 people in one caravan. In addition to that, please consider simplifying the tax system or partial/full tax exemption for workers.”
Most respondents who provided additional feedback wrote positively about their time in the UK and their desire to return to work again in future, for example:
“I liked the work and the working conditions. We were paid on time, and all contract terms were observed. The conditions in our trailer were excellent.”
Another respondent noted:
“My work experience in the UK was very positive. I worked in a friendly and supportive environment, learned new skills, and gained valuable experience. I am grateful for the opportunity and the people I worked with.”
Another respondent noted:
“I worked in England for the second year and liked it there, not only for the work but also for living there, meeting new people, and communicating with locals. I would like to go again and work in England.”
Figure 12: Desire to return to work on a UK farm (total number of respondents: 15,207)
Section C – Discussion and conclusion
The Seasonal Worker visa route provides a vital source of labour for the horticulture and poultry sectors. The 2025 survey continues the positive findings from previous surveys, with most respondents being satisfied with their living and working experience, and 98% of respondents want to work again in the UK.
It is important that the visa route continues to provide a positive experience, and there have been improvements in several areas, including duration of work (those working 5 months or more), complaints (a reduction in those stating they made a complaint compared to 2024), and increased ‘happiness’ across a range of living and working conditions.
The 2025 survey has, however, highlighted areas for attention. This includes the increase in respondents who answered that they were not paid for all the work they did and the proportion of workers reporting only ‘getting work for 3 months or less’. There was also a higher proportion of respondents stating they paid higher pre-arrival costs (£500 to £999) than previous years.
Responses on transfers and the accuracy of information provided indicate areas where communications could be improved, for example, on transfer requests and the explanations of why a request is refused. Issues also remain on how accessible healthcare is for workers, and that workers don’t always feel comfortable or informed enough to raise a complaint.
The 2025 survey reveals some differences of experience between age groups, genders and work locations. For example, respondents who mainly worked in Scotland, Northern Ireland and Wales reported more frequently than those who primarily worked in England that they received healthcare treatment, while respondents in England more frequently reported working 41 hours or more on average per week.
Demographic changes are also noted including an increase in female workers, as well as increases in the number of visa holders from Kyrgyzstan and Kenya, and a declining trend in younger age groups.
Defra’s Seasonal Labour and Worker Welfare team will evaluate the survey findings and continue to work across government, with colleagues in the Devolved Governments, and with operators and workers’ groups to see where improvements can be made.
In 2025, UK Visas and Immigration (UKVI) compliance staff conducted 118 farm audits across the UK, each of which included an interview with a farm manager. They also regularly engage with operators, providing advice and guidance on matters relating to their sponsorship duties. Compliance staff visit farms primarily to ensure operators are adhering to their duties and undertake welfare checks by interviewing a proportion of workers, checking correct salaries are paid and undertaking a sample check of worker accommodation. Across these visits, the team conducted 726 interviews with workers on the Seasonal Worker visa route in 2025.
Since 2019, improvements have been progressively introduced to improve the safety and wellbeing of workers on the Seasonal Worker visa route. As most workers in recent years have come from 4 Central Asian countries, targeted interventions have been implemented in those source countries to enhance welfare during the recruitment process, reduce the risk of scams and fraud, and ensure applicants are better informed about living and working conditions in the UK, including how to manage their wellbeing effectively.
For example, the UK Integrated Security Fund is funding the International Organization for Migration (IOM) project to support the safer participation of Central Asian migrants in the UK Seasonal Worker Visa Scheme, promoting a positive migration experience in the UK and sustainable reintegration on return to home countries.
Since the last survey, some departmental and policy changes have occurred. The Home Office has changed the ‘cooling off period’ rule, which requires a worker to not re-apply to the Seasonal Worker visa route for a period of time once they are back in their home country. The requirement has shortened from 6 to 4 months.
Another recent change is the establishment of the Fair Work Agency (FWA), launched in April 2026, bringing together the Gangmasters and Labour Abuse Authority, the Employment Agency Standards Inspectorate, the Office for the Director of Labour Market Enforcement, and HMRC’s National Minimum Wage function. Its initial responsibilities include enforcing the Employment Agencies Act 1973 and the Conduct of Employment Agencies and Employment Businesses Regulations 2003, the Gangmasters (Licensing) Act 2004, tackling serious labour abuse and modern slavery, and National Minimum Wage enforcement. Defra will work with the FWA on ways to reduce the risks of seasonal worker exploitation and on specific issues highlighted in the 2025 survey including pay and working hours.
Defra continues to work with the governments of countries where workers are recruited, collaborating with sponsors, the Foreign, Commonwealth & Development Office, the IOM and other NGOs, to ensure workers are fully aware – before they arrive, of what to expect when working on farms in the UK, and how to avoid paying unnecessary costs and fees.
Defra is also working with the Seasonal Worker Scheme Taskforce to identify measures to reduce risks to workers from visa, travel and other related costs and ways to improve the information for workers on payslips and advice on how to claim back tax. A Seasonal Workers Support Line has been launched as a pilot scheme (May 2026) to provide a safe, simple, and accessible way for seasonal workers to raise concerns which are triaged and directed to the appropriate organisation. Workers will be able to access the service via telephone, online platforms, and messaging services, with support available in over 260 languages.
Defra will continue to run this important survey. The 2026 season survey will launch at the end of 2026 and will be published in 2027. Defra’s Seasonal Labour and Worker Welfare team looks forward to continuing its collaboration with workers, growers and worker representative organisations to support seasonal workers and to find ways to improve the Seasonal Worker visa route.
Annex A – Nationality level data
Table A1: Nationality level data: Items paid for before arrival in the UK (respondents were asked to tick all that apply - therefore percentages may not equal 100%)
| Type of costs incurred before arrival in the UK | Kazakh | Kyrgyz | Tajik | Uzbek | Other | Total Count |
|---|---|---|---|---|---|---|
| Recruitment agent or job finding fee | 0.5% | 0.6% | 0.6% | 1.7% | 2.2% | 164 |
| Training fees | 0.2% | 0.1% | 0.2% | 1.0% | 0.2% | 54 |
| Medical fees | 0.9% | 1.2% | 0.2% | 5.8% | 17.7% | 638 |
| Interview fees | 0.2% | 0.3% | 0.2% | 0.6% | 1.0% | 69 |
| Labour or migration ministry fees | 1.9% | 1.9% | 0.9% | 26.8% | 2.0% | 996 |
| Uniform cost | 0.5% | 1.4% | 1.7% | 1.1% | 1.4% | 210 |
| Visa | 93.3% | 91.9% | 86.3% | 91.8% | 85.7% | 15,157 |
| Travel to UK | 65.4% | 53.3% | 49.5% | 40.2% | 68.8% | 9,155 |
| Other | 2.2% | 3.0% | 3.1% | 2.0% | 4.3% | 478 |
Table A2: Nationality level data: How respondents funded their pre-arrival costs
| How did you fund your trip to the UK? Tick all that apply | Kazakh | Kyrgyz | Tajik | Uzbek | Other | Total Count |
|---|---|---|---|---|---|---|
| Savings | 62.7% | 58.4% | 60.6% | 70.6% | 58.4% | 9,584 |
| Loan (family and friends) | 18.4% | 31.3% | 30.7% | 24.4% | 30.4% | 4,277 |
| Formal Loan e.g. banks | 17.5% | 5.5% | 6.1% | 1.9% | 6.1% | 1,135 |
| Informal loan e.g. money lenders | 0.4% | 0.7% | 0.5% | 0.9% | 1.7% | 114 |
| Recruitment company | 0.5% | 0.5% | 1.3% | 0.7% | 2.3% | 140 |
| Selling possessions | 0.6% | 3.6% | 0.9% | 1.5% | 1.1% | 290 |
Table A3: Nationality level data: ‘Happy’ responses to different topics relating to on farm experience
| Topics relating to on farm experience | Kazakh | Kyrgyz | Tajik | Uzbek | Other | Total Count |
|---|---|---|---|---|---|---|
| Accommodation | 93.4% | 94.1% | 96.4% | 96.9% | 89.2% | 14,647 |
| Hours available | 92.8% | 91.5% | 95.1% | 96.6% | 88.6% | 14,440 |
| Pay | 95.2% | 95.5% | 96.2% | 97.7% | 92.2% | 14,848 |
| Information provided | 94.6% | 93.2% | 96.1% | 97.3% | 91.7% | 14,685 |
| Protective equipment provided | 90.6% | 90.5% | 94.3% | 95.7% | 84.4% | 14,198 |
| Ability to raise complaints / complaints procedure | 83.5% | 81.8% | 88.4% | 93.1% | 83.8% | 13,288 |
| Farm supervisors and managers | 88.4% | 86.7% | 92.2% | 95.1% | 87.8% | 13,928 |
| Operator support | 90.8% | 89.9% | 95.6% | 96.4% | 88.1% | 14,297 |
| Ability to leave farm for leisure | 93.0% | 91.7% | 92.1% | 96.0% | 91.7% | 14,408 |
| Access to healthcare | 82.4% | 80.6% | 88.1% | 92.5% | 79.2% | 13,083 |
| Safety | 95.5% | 94.4% | 97.1% | 98.4% | 92.4% | 14,843 |
Table A4: Nationality level data: Categories and number of complaints raised
| Nature of complaint | Kazakh | Kyrgyz | Tajik | Uzbek | Other | All | Total Count |
|---|---|---|---|---|---|---|---|
| Accommodation | 5.2% | 9.4% | 5.1% | 6.8% | 16.9% | 10.4% | 40 |
| Racism or discrimination | 15.5% | 8.7% | 10.3% | 11.4% | 7.6% | 9.8% | 38 |
| Bullying or harassment | 8.6% | 4.7% | 7.7% | 4.5% | 8.5% | 6.7% | 26 |
| Assault or sexual assault | 0.0% | 0.8% | 2.6% | 0.0% | 2.5% | 1.3% | 5 |
| Not enough hours | 12.1% | 18.9% | 12.8% | 15.9% | 11.9% | 14.8% | 57 |
| Pay | 8.6% | 7.1% | 15.4% | 2.3% | 5.9% | 7.3% | 28 |
| Supervisor/manager | 15.5% | 17.3% | 17.9% | 9.1% | 8.5% | 13.5% | 52 |
| Co-workers | 13.8% | 3.1% | 5.1% | 4.5% | 7.6% | 6.5% | 25 |
| Transfers | 3.4% | 5.5% | 2.6% | 6.8% | 4.2% | 4.7% | 18 |
| Working conditions | 5.2% | 10.2% | 2.6% | 4.5% | 5.9% | 6.7% | 26 |
| Productivity targets | 3.4% | 3.1% | 0.0% | 4.5% | 2.5% | 2.8% | 11 |
| Health and safety concerns | 5.2% | 3.1% | 7.7% | 4.5% | 7.6% | 5.4% | 21 |
| Other | 3.4% | 7.9% | 10.3% | 25.0% | 10.2% | 10.1% | 39 |
Table A5: Nationality level data: Was your complaint followed up?
| Was your complaint followed up? | Kazakh | Kyrgyz | Tajik | Uzbek | Other |
|---|---|---|---|---|---|
| Yes | 39.3% | 59.5% | 72.7% | 65.7% | 90.2% |
| No | 60.7% | 40.5% | 27.3% | 34.3% | 9.8% |
Table A6: Nationality level data: Reason respondents requested a transfer to another farm
| Reason for requesting a transfer | Kazakh | Kyrgyz | Tajik | Uzbek | Other | Total Count |
|---|---|---|---|---|---|---|
| Not enough hours | 19.8% | 23.9% | 23.7% | 23.7% | 19.2% | 705 |
| To be with friends and/or family | 15.6% | 16.9% | 25.6% | 19.1% | 6.4% | 536 |
| Poor housing conditions | 5.9% | 9.0% | 4.3% | 5.9% | 2.5% | 211 |
| Poor treatment from supervisor/others on current farm | 14.4% | 16.2% | 8.2% | 11.1% | 8.5% | 422 |
| Season or contract ended and no more work was available | 30.1% | 24.1% | 32.1% | 33.4% | 47.7% | 934 |
| Dismissed | 3.2% | 2.5% | 0.2% | 1.9% | 3.9% | 76 |
| High productivity targets at farm | 4.6% | 3.4% | 2.2% | 1.1% | 5.3% | 107 |
| Health, eg allergy | 4.0% | 1.8% | 1.7% | 1.9% | 2.8% | 76 |
| Work or cultural experience | 2.3% | 2.2% | 1.9% | 1.9% | 3.6% | 71 |
Table A7: Nationality level data: Reason respondents’ transfer request was not fulfilled
| Reason respondents’ transfer requests were not granted | Kazakh | Kyrgyz | Tajik | Uzbek | Other | Total Count |
|---|---|---|---|---|---|---|
| No job available | 41.1% | 43.3% | 57.7% | 43.2% | 47.5% | 367 |
| No job available at the farm I wanted to go to | 12.6% | 15.1% | 10.8% | 12.6% | 3.8% | 102 |
| Required on current farm | 5.7% | 5.7% | 4.5% | 16.8% | 6.3% | 56 |
| Visa was about to expire | 3.4% | 3.1% | 0.9% | 3.2% | 5.0% | 25 |
| Transfer was refused and no reason given | 6.9% | 9.1% | 9.0% | 5.3% | 12.5% | 69 |
| No response to the transfer request | 21.1% | 18.5% | 14.4% | 13.7% | 15.0% | 143 |
| Other | 9.1% | 5.1% | 2.7% | 5.3% | 10.0% | 50 |
Annex B – Gender-level data
Table B1: Gender-level data: age group
| Gender level age group | 18-24 | 25-31 | 32-38 | 39+ | All % |
|---|---|---|---|---|---|
| Male | 81.4% | 82.9% | 77.8% | 65.7% | 76.9% |
| Female | 18.5% | 16.9% | 22.1% | 34.3% | 23.0% |
| Other | 0.0% | 0.0% | 0.0% | 0.0% | 0.0% |
| Prefer not to say | 0.1% | 0.1% | 0.1% | 0.0% | 0.1% |
| Total | 100% | 100% | 100% | 100% | 100% |
Table B2: Gender level data: What payslips did not clearly explain (total number of respondents: 636)
| What payslips did not clearly explain | Number of male respondents | % of male respondents | Number of female respondents | % of female respondents |
|---|---|---|---|---|
| Hours | 121 | 23.6% | 29 | 23.4% |
| Pay rate | 71 | 13.9% | 15 | 12.1% |
| Bonus | 126 | 24.6% | 22 | 17.7% |
| Deductions for accommodation | 61 | 11.9% | 19 | 15.3% |
| Tax / National Insurance | 133 | 26.0% | 39 | 31.5% |
| Total | 512 | 100.0% | 124 | 100.0% |
Table B3: Gender level data: Was complaint followed up
| Was complaint followed up | Male percentage | Female percentage |
|---|---|---|
| Yes | 66.0% | 86.9% |
| No | 34.0% | 13.1% |
| Total | 100.0% | 100.0% |
Table B4: Gender level data: Did you received treatment (total number of respondents: 933)
| Q28a: Did you receive treatment? | Number of male respondents | % of male respondents | Number of female respondents | % of female respondents | Total respondents | % respondents |
|---|---|---|---|---|---|---|
| Yes | 439 | 64.6% | 183 | 73.2% | 622 | 66.7% |
| No | 241 | 35.4% | 67 | 26.8% | 311 | 33.3% |
Annex C – Age group-level data
Table C1: Who workers raised complaints with
| Who workers raised complaints with | 18-24 | 25-31 | 32-38 | 39+ | All | Total Count |
|---|---|---|---|---|---|---|
| Supervisor | 43.9% | 35.7% | 26.2% | 14.9% | 31.0% | 81 |
| Farm manager | 39.0% | 33.0% | 29.5% | 27.7% | 32.2% | 84 |
| Operator/Sponsor/Agency | 12.2% | 24.1% | 26.2% | 36.2% | 24.9% | 65 |
| Gangmasters and Labour Abuse Authority (GLAA) - (UK Gov) | 0.0% | 0.0% | 0.0% | 0.0% | 0.0% | 0 |
| UK Visa & Immigration (UKVI) (Home Office/UK Gov) | 0.0% | 0.9% | 1.6% | 0.0% | 0.8% | 2 |
| A worker support organisation (not the farm or Operator/Sponsor/Agency) | 0.0% | 4.5% | 8.2% | 12.8% | 6.1% | 16 |
| Other | 4.9% | 1.8% | 8.2% | 8.5% | 5.0% | 13 |
Table C2: Was complaint followed up or not (counts)
| Complaint followed up or not followed up | 18-24 | 25-31 | 32-38 | 39+ |
|---|---|---|---|---|
| Yes | 39 | 82 | 41 | 26 |
| No | 3 | 33 | 23 | 20 |
Table C3: Was complaint followed up or not (percentages)
| Complaint followed up or not followed up | 18-24 | 25-31 | 32-38 | 39+ | All |
|---|---|---|---|---|---|
| Yes | 92.9% | 71.3% | 64.1% | 56.5% | 70.4% |
| No | 7.1% | 28.7% | 35.9% | 43.5% | 29.6% |
Annex D – Primary country of work level data
Table D1: Primary country of work level data: Average hours worked in a week (total number of respondents: 15,455)
| Average number of hours per week | Number of respondents who worked in England | Proportion | Number of respondents who worked in Scot/Wales/NI | Proportion |
|---|---|---|---|---|
| Under 25 | 48 | 0.4% | 5 | 0.2% |
| 25-31 | 327 | 2.5% | 74 | 3.4% |
| 32-40 | 5,569 | 41.8% | 1,074 | 50.0% |
| 41-50 | 5,457 | 41.0% | 860 | 40.1% |
| 51-60 | 1,661 | 12.5% | 112 | 5.2% |
| Over 60 | 247 | 1.9% | 21 | 1.0% |
| Total | 13,309 | 100.0% | 2,146 | 100.0% |
Table D2: Did you receive treatment? (total number of responses: 925)
| Did you receive treatment? | Number of respondents who worked in England | Proportion | Number of respondents who worked in Scot/Wales/NI | Proportion |
|---|---|---|---|---|
| Yes | 496 | 64.2% | 122 | 80.3% |
| No | 277 | 35.8% | 30 | 19.7% |
| Total | 773 | 100.0% | 152 | 100.0% |