Considering the context of schools in challenging circumstances: an analysis of similar schools data
Updated 16 October 2026
Applies to England

© Crown copyright 2026
This publication is licensed under the terms of the Open Government Licence v3.0 except where otherwise stated. To view this licence, visit nationalarchives.gov.uk/doc/open-government-licence/version/3 or write to the Information Policy Team, The National Archives, Kew, London TW9 4DU, or email: psi@nationalarchives.gov.uk.
Where we have identified any third party copyright information you will need to obtain permission from the copyright holders concerned.
This publication is available at https://www.gov.uk/government/publications/school-inspections-statistical-commentaries-2025-to-2026/considering-the-context-of-schools-in-challenging-circumstances-an-analysis-of-similar-schools-data
Introduction
In May 2026, we published an analysis of our efforts to recognise challenging contexts within school inspections, while holding high expectations for all children.[footnote 1] Challenging contexts can include a disproportionately high number of pupils eligible for free school meals (FSM), pupils with special educational needs and/or disabilities (SEND) or pupils who do not speak English as a first language, as well as other circumstances unique to that school.
Our analysis concluded that:
‘Inspectors are allowing for context, without normalising lower levels of achievement for children from more disadvantaged backgrounds.’
We also announced that we would begin using a new ‘similar schools’ measure. We developed this with the Department for Education as part of our joint commitment to recognising when schools are providing a high standard of education for their pupils, irrespective of the context they are in. We started using this measure on school inspections from September 2026.
That is why we are updating our analysis today. In this commentary, we consider:
- how achievement grades were given before and after we started using the similar schools measure
- how we are using the similar schools measure to be even more precise with our quality assurance of inspections
- examples of when we have given ‘strong standard’ and ‘exceptional’ grades to schools working in the most challenging contexts
This work is part of our ongoing efforts to hold the highest expectations for children, while recognising the fantastic work schools do in different contexts.
Accounting for context in 2025/26 school inspections
In 2025/26, 72% of the schools we inspected were graded ‘expected standard’ or above for achievement.[footnote 2] During that year, we carried out nearly 3,300 inspections, which represents just 15% of state-funded schools. Schools are selected for inspection according to their previous inspection outcomes, with weaker schools inspected more often. This means the outcomes of inspections carried out in a single year are not representative of the school population as a whole.
Our renewed education inspection framework (EIF) recognises that many schools work in challenging circumstances. The Inspection Data Summary Report (IDSR) gives inspectors a range of data on a school’s context and performance before its inspection begins.[footnote 3] To better support this, we introduced the similar schools measure into the IDSR in September 2026.[footnote 4] This adds an extra layer of context alongside the headline measures of attainment and progress data (where available).
While the similar schools measure was not available during our 2025/26 inspections, we gave inspectors a range of data to enable them to take a school’s context into account on inspection. To show how they used this data when determining the achievement grades given last year, we have compared these grades with what the similar schools data is now telling us.
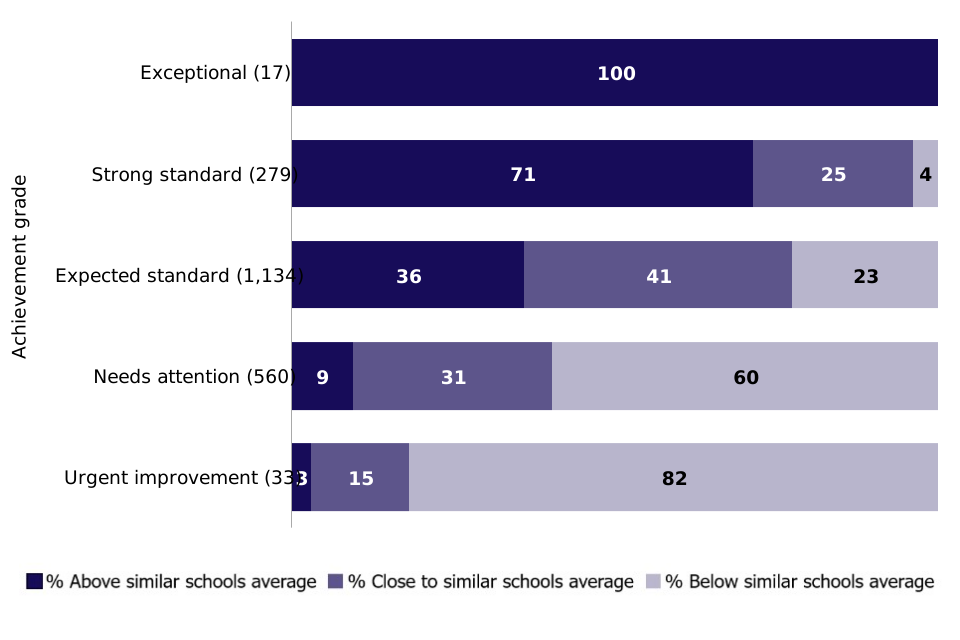
The charts below show how closely aligned schools are to the average attainment for their ‘similar schools group’ by achievement grade.[footnote 5]
Figure 1: Achievement grades for primary schools, by key stage 2 reading, writing and mathematics similar schools group comparator, 2025/26
Notes: The key stage 2 data used to create the similar schools groups is based on the final data for 2024/25. We have not included schools with no key stage 2 data (for example, infant schools), schools with no similar schools group, or very small schools where the similar schools comparators are not available in the IDSR.
View data in an accessible table format.
We found that 73% of primary schools graded ‘strong standard’ or ‘exceptional’ for achievement were outperforming their similar schools average in key stage 2 reading, writing and mathematics. All schools graded ‘exceptional’ were performing above their similar schools average. In addition, 61% of schools that were graded ‘needs attention’ or ‘urgent improvement’ were performing below their similar schools average.
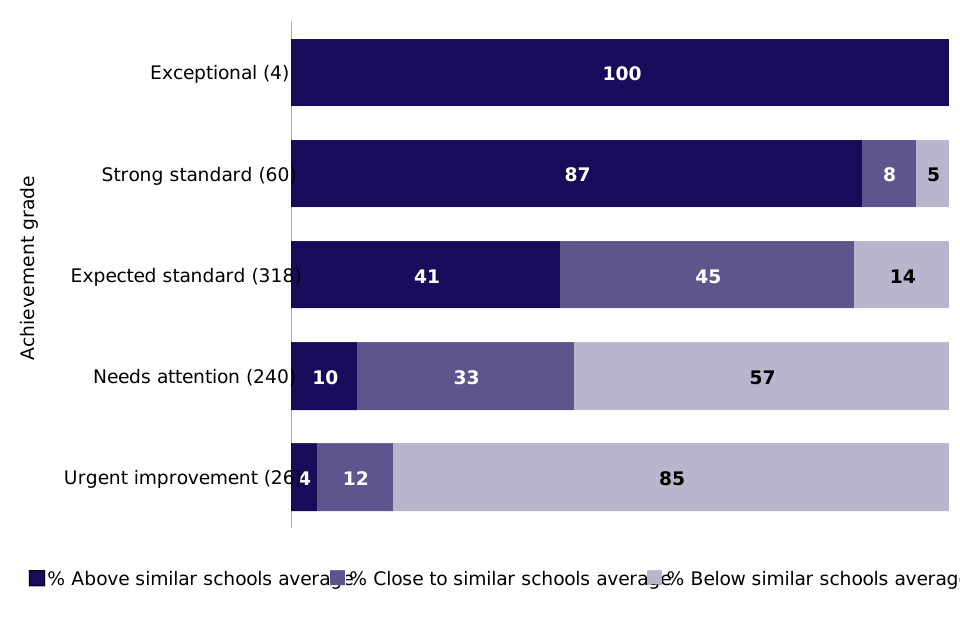
Figure 2: Achievement grades for primary schools with ‘above’ and ‘well above’ proportions of pupils eligible for FSM, by key stage 2 reading, writing and mathematics similar schools group comparator, 2025/26
Notes: The key stage 2 data used to create the similar schools groups is based on the final data for 2024/25. We have not included schools with no key stage 2 data (for example, infant schools), schools with no similar schools group, or very small schools where the similar schools comparators are not available in the IDSR.
View data in an accessible table format.
Although the number of inspections was smaller, Figure 2 shows a similar set of findings for schools with a high proportion of disadvantaged pupils (those in the ‘above’ and ‘well above’ bandings for FSM).[footnote 6] Given their challenging circumstances, 88% of these schools that were graded ‘strong standard’ or ‘exceptional’ were performing above their similar schools average, compared with 73% for all schools inspected in the same year. As above (Figure 1), around two thirds of schools that were graded ‘needs attention’ or ‘urgent improvement’ were performing below their similar schools average.
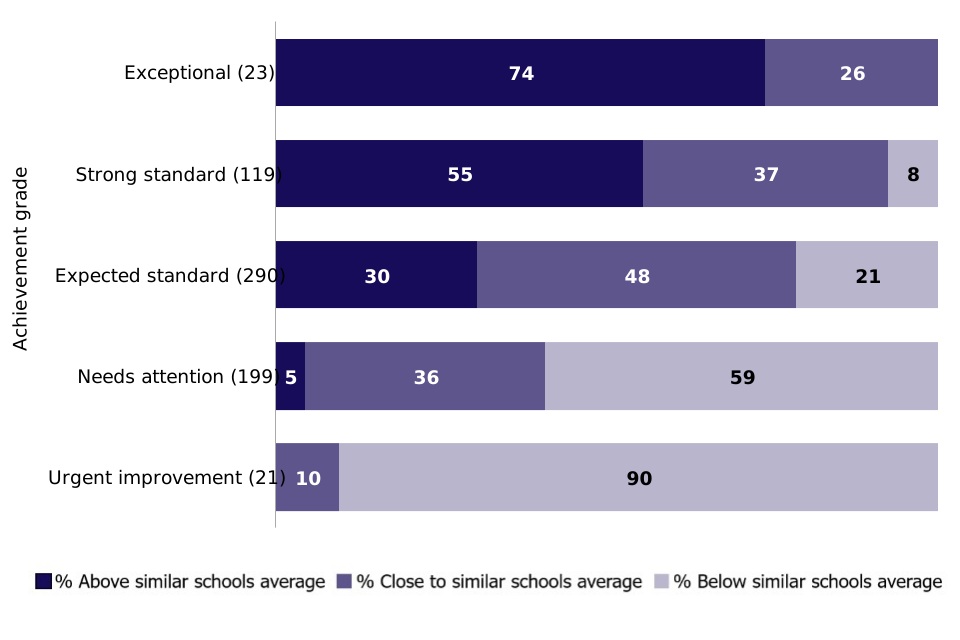
Figure 3: Achievement grades for secondary schools, by key stage 4 attainment 8 similar schools group comparator, 2025/26
Notes: The key stage 4 data used to create the similar schools groups is based on the final data for 2024/25. We have not included schools with no key stage 4 data or no similar schools group.
View data in an accessible table format.
We found that 58% of secondary schools graded ‘strong standard’ or ‘exceptional’ were performing above their similar schools average on the key stage 4 attainment 8 measure. Two thirds of schools graded ‘needs attention’ or ‘urgent improvement’ were performing below their similar schools average.
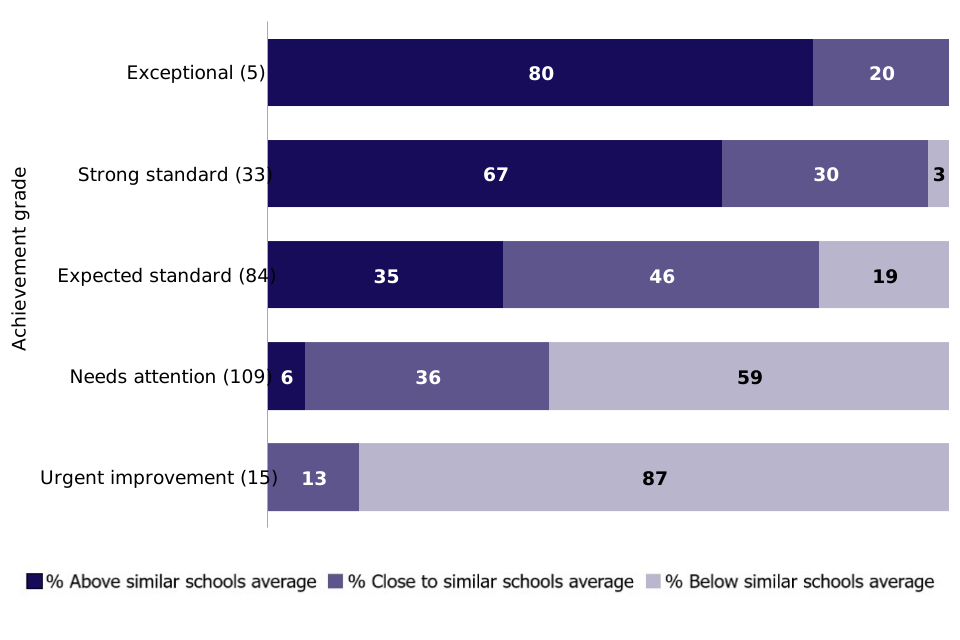
Figure 4: Achievement grades for secondary schools with ‘above’ and ‘well above’ proportions of pupils eligible for FSM, by key stage 4 attainment 8 similar schools group comparator, 2025/26
Notes: The key stage 4 data used to create the similar schools groups is based on the final data for 2024/25. Schools with no key stage 4 data, or no similar schools group, are not included.
View data in an accessible table format.
Again, while it represents a smaller number of inspections, Figure 4 shows a consistent pattern for schools with a high proportion of disadvantaged pupils compared with figure 3. In fact, 68% of schools graded ‘strong’ or ‘exceptional’ were outperforming their similar schools average compared with 58% of all secondary schools inspected. As before, almost two thirds of schools that were graded ‘needs attention’ or ‘urgent improvement’ were performing below their similar schools average.
Taken together, these findings suggest that similar schools data supports conclusions that inspectors were already reaching through their consideration of context and the wider evidence base.
An early look at the similar schools measure in 2026/27 school inspections
It is important to note that the similar schools measure is one of several factors that inspectors consider when grading and reporting on achievement. We have trained inspectors to understand and apply this new contextual information alongside a range of evidence other than just external data. This includes evidence from learning walks, visits to lessons, looking at pupils’ work over time and talking to pupils themselves about their learning.
The similar schools measure has also further strengthened existing quality assurance and moderation processes. It has added another layer of information, especially in atypical contexts, such as where there are high levels of disadvantage. Inspectors are referring to this measure from the beginning of inspections, during the planning discussions with leaders, and when in school.
Recent inspection evidence shows that the similar schools measure is helping inspectors to understand a school’s context and achievement data even better. This is enabling them to form a more rounded view of its performance over time.
In both of the case studies below, the inspection team used the similar schools measure to verify what they were seeing and hearing first-hand on site. And in both examples, it allowed for evidence-based quality assurance of the findings.
Primary school case study
A primary school in an area of high deprivation was recently graded ‘strong standard’ for achievement. The overall data for the school showed attainment close to average for pupils overall, which was more in line with the ‘expected standard’ grade in the toolkit.
However, the inspection team carefully took into account the school’s context of having well above average levels of pupils eligible for FSM (more than 50%) and pupils with SEN support (more than 30%). The school also had well below average stability (less than 70%). Inspection evidence shows that school leaders thoroughly considered the progress of these pupils from their starting points. This on-site evidence of progress from pupils’ starting points was compelling. Inspectors also went beyond the core subjects to be assured that pupils were achieving well across the whole curriculum. Once this was established, the similar schools measure then proved useful in providing additional contextual evidence.
The similar schools measure showed that, despite the challenges it faced, this school was performing significantly better than similar schools over time, including for disadvantaged pupils. This additional piece of evidence, alongside evidence gathered during the inspection, provided inspectors with the assurance they needed that the school had met the ‘strong standard’ grade for achievement.
This indicates that the similar schools measure is being used on inspection as intended: to add further contextual information to the compelling first-hand evidence, in order to strengthen the evidence for inspectors to give a grade of ‘strong standard’ for achievement.
Secondary school case study
Another recent example is a secondary school working within a challenging context that had well above average levels of pupils eligible for FSM (more than 60%) and pupils with SEN support (more than 20%). Its performance data showed that pupils’ attainment was close to average overall in most subjects. Inspectors made understanding the experiences of pupils with SEND and the progress they were making a focal point of their evidence-gathering. They assured themselves that pupils had the necessary foundational knowledge to access the curriculum. They checked out pupil destinations, including for disadvantaged pupils. They then used the similar schools measure to add to this picture of the school’s context and check it against what they had seen first-hand.
The inspection team used the similar schools measure proportionately to show that the school had performed significantly better than similar schools over a sustained period of time, especially for its disadvantaged pupils. As a result of all the evidence gathered, the school was graded as ‘strong standard’ for achievement.
‘Strong standard’ and ‘exceptional’ grades in challenging contexts
Where we see provision at ‘strong standard’ and ‘exceptional’, we recognise it. When we encounter provision that is so effective and transformative at improving the experiences and outcomes of those from disadvantaged backgrounds, we want every child and learner to benefit from the same opportunities. That is why we set high expectations. We know these standards are achievable because we see them every day, in every context, and in every part of the country.
We have also inspected schools in challenging contexts where we identify that more can be done to raise standards and improve the experiences and outcomes for pupils that need the most support. It is equally important that we identify areas for improvement; it is what pupils from all backgrounds deserve.
Below, we illustrate this with 3 sets of examples from the first year of inspections under the renewed EIF.[footnote 7] For instance, in the North East, Yorkshire and Humber region, only 17% of primary schools have been graded ‘strong standard’ or ‘exceptional’ for achievement, compared with 44% in London. However, there are primary schools in the region that are defying this trend, despite their highly challenging contexts.
We can see this in Worsbrough Common, Barnsley, an area that has experienced post-industrial decline. More than half (57%) of children in Worsbrough Common are from low-income families, and 36% are eligible for FSM. At Oakwell Rise Primary Academy, 47% of pupils are eligible for FSM and a significant number speak English as an additional language. The school also has well above average rates of pupils on education, health and care plans. Our inspection found that the school’s leaders defy their challenging context by identifying pupils’ needs precisely, prioritising reading and spoken language, and ensuring teaching is adapted effectively, so that all pupils achieve well. Three quarters of disadvantaged pupils reach the expected standards in reading, writing and mathematics: above the 47% that do nationally.
Just over a mile away, in Worsbrough, over half the pupils at Bank End Primary Academy are eligible for FSM. Leaders there are uncompromising in their belief that every child can achieve highly. In 2024/25, 92% of pupils from disadvantaged backgrounds met the expected standards in reading, writing and mathematics – almost double the national average for disadvantaged pupils. This was an increase from 60% just 2 years previously.
Oakwell and Bank End are turning around the life chances of their pupils by offering their disadvantaged pupils a high-quality education, regardless of their challenging context. These schools were given 12 ‘strong standard’ grades between them.
In the West Midlands, a region where only 15% of primary schools have received a grade of ‘strong standard’ or ‘exceptional’ for achievement, 2 primaries in Walsall show what can be achieved in highly challenging contexts. Goldsmith Primary Academy and Reedswood E-ACT Academy both serve communities with well above average levels of deprivation, and 67% of the pupils at Goldsmith, and 42% of the pupils at Reedswood, are eligible for FSM. Between these 2 primary schools, we gave 6 ‘exceptional’ grades and 8 ‘strong standard’ grades. Last year, 70% of the disadvantaged pupils at Goldsmith and 77% of the disadvantaged pupils at Reedswood met expected standards in reading, writing and mathematics; these are significant achievements in context, which we recognised with ‘strong standard’ and ‘exceptional’ grades respectively.
An illustration of how we are recognising secondary schools in challenging contexts can be found in the North West. Since we implemented the renewed EIF, we have inspected 119 secondary schools in the North West. Of these, 41% have received grades below ‘expected standard’ for achievement – more than 3 times that of London. Only 18% of secondary schools in the North West received ‘strong standard’ or ‘exceptional’ grades for achievement, compared with 57% of secondary schools in London. Both regions have fairly similar numbers of pupils and proportions of pupils eligible for FSM. However, in the autumn and spring terms we inspected Our Lady’s RC High School, Wright Robinson College, and Eden Boys’ Leadership Academy – 3 superb secondary schools in Manchester that defy this regional trend.
In the city of Manchester, nearly half of all pupils are eligible for FSM – almost double the national average. This is consistent across these 3 Manchester schools, where between 45% and 54% of pupils are eligible for FSM. The schools are all are based in areas with well above average levels of deprivation. And while the average attainment 8 for pupils eligible for FSM in Manchester is 39.4 (slightly above the national average for these pupils), across these 3 schools it is considerably higher; for disadvantaged pupils at Eden Boys it was 50.4 in 2024/25.
In this context, we inspected all 3 Manchester schools under the renewed EIF and graded all evaluation areas as at least ‘strong standard’, and gave 5 ‘exceptional’ grades between them. In each of these schools we celebrated not just the achievement of the pupils but the experiences they received, as they were given every opportunity to develop into thriving young people. These schools show how deprivation and disadvantage does not need to be a barrier to success for pupils in Manchester.
These schools in Barnsley, Walsall and Manchester have all overcome their challenging contexts to improve the experiences and outcomes of the pupils they serve. We have recognised their performance in context in our inspection reports, both to celebrate these schools for their success but also to highlight what is possible so that other schools in their regions and in similar contexts may do the same.
Conclusion
We commissioned an independent evaluation of education inspections (including schools, further education and skills, early years, and initial teacher education providers), which found strong evidence that inspectors have been accounting for context.[footnote 8]
‘Almost three quarters (74%) of providers surveyed agreed that the inspection team sought to understand and take account of their provision’s unique context, and a similar proportion (72%) agreed that the recent inspection under the renewed EIF was tailored to, and took account of, the context of their provision.’
But this masks concerns in schools, especially secondary schools:
‘Over three quarters of early years settings (79%) agreed that inspection teams sought to understand their context and took account of it; two thirds (65%) of schools said the same. Less than half (47%) of secondary schools agreed that their inspection was tailored to their context; a similar proportion of secondaries disagreed (44%).’
This shows that Ofsted still has work to do. It is heartening that a majority of providers – including a clear majority of schools – consider their inspection to have accounted for context. And this is reinforced by today’s analysis, which shows that inspectors are taking context into account, while still holding schools to high standards, and that this was happening before the similar schools measure became available.
But as we know we have more to do, this analysis has also shown how we are using the similar schools measure to improve our work. We anticipate continuing to provide analysis as our work becomes increasingly sophisticated.
We are pleased to share this analysis, which we hope is reassuring to the teachers and leaders working in disadvantaged communities.
Data tables for figures
Data for Figure 1: Achievement grades for primary schools, by key stage 2 reading, writing and mathematics similar schools group comparator, 2025/26
| Achievement grade | % above similar schools average | % close to similar schools average | % below similar schools average |
|---|---|---|---|
| Exceptional (17) | 100 | 0 | 0 |
| Strong standard (279) | 71 | 25 | 4 |
| Expected standard (1,134) | 36 | 41 | 23 |
| Needs attention (560) | 9 | 31 | 60 |
| Urgent improvement (33) | 3 | 15 | 82 |
Data for Figure 2: Achievement grades for primary schools with ‘above’ and ‘well above’ proportions of pupils eligible for FSM, by key stage 2 reading, writing and mathematics similar schools group comparator, 2025/26
| Achievement grade | % above similar schools average | % close to similar schools average | % below similar schools average |
|---|---|---|---|
| Exceptional (4) | 100 | 0 | 0 |
| Strong standard (60) | 87 | 8 | 5 |
| Expected standard (318) | 41 | 45 | 14 |
| Needs attention (240) | 10 | 33 | 57 |
| Urgent improvement (26) | 4 | 12 | 85 |
Data for Figure 3: Achievement grades for secondary schools, by key stage 4 attainment 8 similar schools group comparator, 2025/26
| Achievement grade | % above similar schools average | % close to similar schools average | % below similar schools average |
|---|---|---|---|
| Exceptional (23) | 74 | 26 | 0 |
| Strong standard (119) | 55 | 37 | 8 |
| Expected standard (290) | 30 | 48 | 21 |
| Needs attention (199) | 5 | 36 | 59 |
| Urgent improvement (21) | 0 | 10 | 90 |
Figure 4: Achievement grades for secondary schools with ‘above’ and ‘well above’ proportions of pupils eligible for FSM, by key stage 4 attainment 8 similar schools group comparator, 2025/26
| Achievement grade | % above similar schools average | % close to similar schools average | % below similar schools average |
|---|---|---|---|
| Exceptional (5) | 80 | 20 | 0 |
| Strong standard (33) | 67 | 30 | 3 |
| Expected standard (84) | 35 | 46 | 19 |
| Needs attention (109) | 6 | 36 | 59 |
| Urgent improvement (15) | 0 | 13 | 87 |
-
‘The ‘achievement’ grade, attainment data and schools in challenging circumstances’, Ofsted, May 2026. ↩
-
Based on inspections under the renewed education inspection framework since 10 November 2025, where the report card was published by 30 September 2026. See tab C1 of ‘Management information – state-funded schools – as at 30 September 2026’, ‘State-funded school inspections and outcomes: management information’, Ofsted, 16 October 2026. The nearly 3,300 inspections include nearly 3,200 full inspections where we graded achievement. ↩
-
For full details of the data used in the IDSR, including how the FSM and similar schools bands are calculated, and example IDSR reports for primary and secondary schools, see the School inspection data summary report (IDSR) guide. This analysis focuses on two key attainment measures, but the IDSR includes additional attainment measures and data for up to 3 academic years. ↩
-
For more information, see ‘Similar schools model for attainment: overview’, Department for Education, July 2026. ↩
-
In the IDSR, the key stage data for each school is compared to the average of the 50 schools in its similar schools group. Schools are then placed into one of 5 groups according to whether the school’s data is above or below its similar schools, and whether the difference is statistically significant. These 5 groups are summarised as 3 groups for this analysis, by combining ‘well above’ and ‘above’ into ‘above’, and ‘well below’ and ‘below’ into ‘below’. ↩
-
FSM bands are based on the Department for Education’s FSM 6 measure, which looks at pupils eligible for FSM at any time in the last 6 years, at the time of the January 2026 census. The 5 FSM bands used in the IDSR are calculated by Ofsted and are based on the difference between the school’s percentage and the national average for that phase. The 5 bands are not evenly sized (the ‘close to similar schools average’ band is bigger), but are a similar size when summarised as 3 bands in this analysis. ↩
-
The data in this section is taken from a range of sources. Data on individual schools and how this compares with the national average is taken from their published report cards (see links) to reflect the data at the time of the inspection (but may have changed since). Data on the deprivation level of the local area is from ‘English indices of deprivation 2025’, Ministry of Housing, Communities and Local Government, November 2025. Key stage 4 data is from ‘Key stage 4 performance’, Department for Education, August 2026. Local and national data on FSM is from ‘Schools, pupils and their characteristics’, Department for Education, July 2026. National and local inspection data is from the ‘State-funded school inspections and outcomes: management information’ as at 30 September 2026, listed earlier. ↩
-
‘Evaluation of Ofsted’s renewed approach to education inspection: summary of interim findings’, IFF Research, October 2026. ↩