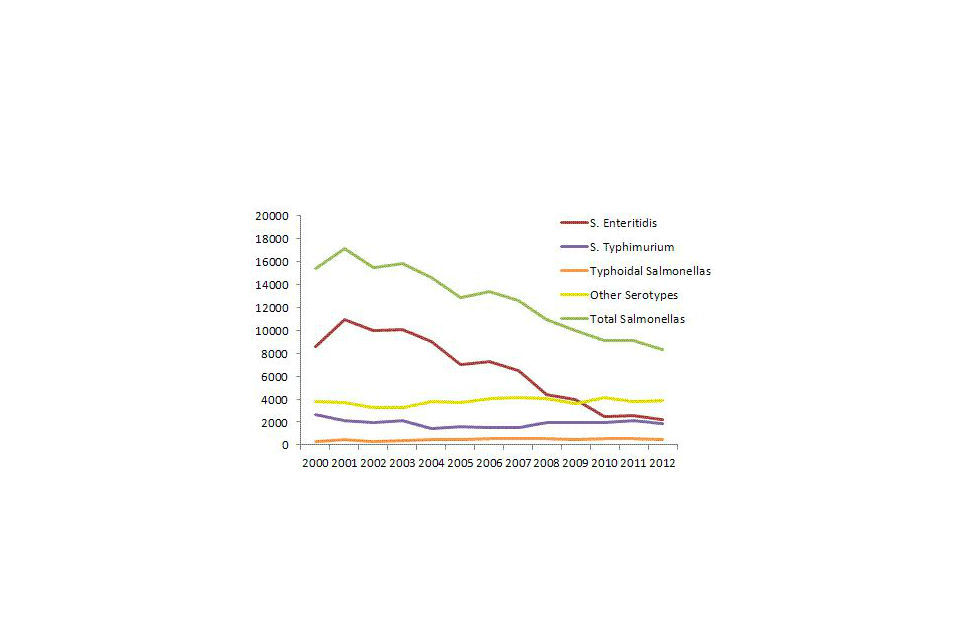
Salmonella by serotype 2000 to 2010
Published 19 December 2010
Salmonella by serotype
| Year | S. Enteritidis | S. Typhimruium | Typhoidal Salmonellas | Other serotypes | Total Salmonellas |
|---|---|---|---|---|---|
| 2000 | 8616 | 2688 | 331 | 3798 | 15435 |
| 2001 | 10913 | 2129 | 433 | 3688 | 17163 |
| 2002 | 9962 | 1945 | 309 | 3277 | 15493 |
| 2003 | 10095 | 2087 | 409 | 3273 | 15864 |
| 2004 | 8990 | 1450 | 443 | 3763 | 14648 |
| 2005 | 7046 | 1643 | 472 | 3714 | 12875 |
| 2006 | 7319 | 1511 | 546 | 4022 | 13398 |
| 2007 | 6467 | 1530 | 525 | 4107 | 12629 |
| 2008 | 4361 | 1923 | 581 | 4038 | 10903 |
| 2009 | 3978 | 1920 | 481 | 3577 | 9956 |
| 2010 | 2444 | 1959 | 569 | 4161 | 9133 |
| 2011 | 2582 | 2150 | 571 | 3824 | 9127 |
| 2012 | 2169 | 1902 | 430 | 3854 | 8355 |
Source: HPA Salmonella Dataset (Labbase2). Numbers may be higher than previously reported due to the inclusion of all isolates of Salmonella rather than only faecal and lower gastrointestinal tract isolates.

Salmonella epidemiological data by serotype
