Estimate flood flow from rainfall and river flow data (source)
Updated 8 May 2026
Applies to England

© Crown copyright 2026
This publication is licensed under the terms of the Open Government Licence v3.0 except where otherwise stated. To view this licence, visit nationalarchives.gov.uk/doc/open-government-licence/version/3 or write to the Information Policy Team, The National Archives, Kew, London TW9 4DU, or email: psi@nationalarchives.gov.uk.
Where we have identified any third party copyright information you will need to obtain permission from the copyright holders concerned.
This publication is available at https://www.gov.uk/government/publications/river-modelling-technical-standards-and-assessment/estimate-flood-flow-from-rainfall-and-river-flow-data-source
This document is part of the flood modelling standards for river systems. There are 4 more documents that cover this topic. Read all the documents to make sure you have the information you need to start your modelling project.
Flood hydrology study
You should use the Flood Estimation Handbook (FEH) and the latest Environment Agency (EA) Flood Estimation Guidelines (FEG) to inform your flood flow estimation and hydrological analysis in England.
These standards do not replace the FEH and FEG. You should use this guidance alongside these documents.
Hydrological analysis is a complex process with many aspects. These standards give you an introduction to the topic. You must have the appropriate knowledge, skills and experience to complete these studies and allow enough time for the task.
A flood hydrology study estimates flood flows from rainfall and river flow data. This refers to the ‘source’ part of the source, pathway, receptor (SPR) model.
For fluvial systems, examples of ‘sources’ are:
- inflows to the river from upstream topographic catchments
- catchments that join the river along the modelled length
A catchment is an area of land that water drains from before flowing into the fluvial system.
You should always include a flood hydrology study as part of your modelling project. If a flood hydrology study exists, you should review it. If the existing study is good enough you can reuse it. If it’s not good enough or there is no existing study, you’ll need to complete a new one. You should complete a new flood hydrology study if the existing one is more than 5 years old, to account for new data and methods.
Do not complete or review your flood hydrology study without considering the extents, needs and assumptions of your hydraulic model. You should consider the hydrology and hydraulics together - information in one can affect the outcome of the other.
Ideally, the hydrologist and hydraulic modeller should be the same person. If this is not practical, they should work together throughout the project.
People who review these models should be different to those who build them. You should complete your own quality assurance process before you share your flood hydrology study with the client.
Flood hydrology is not an exact science. The calculations involve many assumptions and judgement decisions, and there will always be a high level of uncertainty in flow probability estimates for extreme flood events. While you should aim to reach the best estimate you can with the methods and data available, it’s important to acknowledge the uncertainty.
By its very nature, flood estimation is an uncertain business, and this uncertainty is probably greater than many hydrologists realise.” (Environment Agency LIT11832: Flood Estimation Guidelines)
Complete a method statement
It’s best practice to write a method statement describing how the study will be completed. You should get the method statement approved by your client and other stakeholders before you start your study. You should refer to the FEG for more details on method statements, and use the LIT 65087: flood estimation report template to record your method statement.
Your method statement should:
- describe the purpose of the study
- establish if there are existing flood hydrology studies for the subject area - they may provide valuable information you can use
- show an understanding of the catchment rainfall-runoff processes and pathways - use Ordnance Survey (OS) maps, geological and soil maps, site visits and previous reports
- identify what hydrometric data is available, review its quality, and assess whether any further work is needed before beginning the flow estimation calculations
- include plots that show available hydrometric data and your interpretation and analysis of them
You’ll also need to explain what conditions are likely to lead to flooding. This should include whether:
- tide levels will have an effect on water level
- flood risk could be affected by peak flows or volumes
- the catchment is prone to groundwater flooding
- runoff from part of the catchment could cause severe flooding
- snowmelt is likely to be an important factor
There can be multiple sources of flooding in the area of interest.
Decide where to estimate flows
You need to choose the locations where you’ll calculate flood flows. This will depend on:
- the size and complexity of your hydraulic model
- the spatial pattern of watercourses, tributaries and confluences
- catchment characteristics such as soil types and urbanisation
- location of structures such as reservoirs
- locations of any flow or level gauging stations
You should make sure the whole catchment draining to the downstream extent of your hydraulic model is included.
You also need to choose whether to adopt a ‘lumped’ or ‘distributed’ approach to estimating flood flows. You should discuss these choices with the hydraulic modeller and explain your reasons in your report. There is more information about estimating flows in the FEH and FEG.
Lumped approach
For a lumped approach, you should estimate flow for the whole catchment draining to each location where design flows are needed. The catchment areas will increase in the downstream direction and flows will usually do the same.
Lumped approaches are appropriate where:
- good quality hydrometric data is available
- you can accurately include attenuation in the hydrological calculations
- where peak flow is the main factor in determining flood risk
You’ll always need one lumped estimate at the upstream boundary of your hydraulic model. This could represent either:
- the whole catchment draining to the extent of your hydraulic model downstream, if your model is small
- the upstream part of your catchment only, with more inflow locations downstream in your model to represent the remaining areas draining to the extent of your hydraulic model downstream
You can adjust upstream inflows to match lumped inflow estimates downstream.
Distributed approach
For a distributed approach, you should divide the whole catchment draining to the extent of your downstream model into sub catchments that do not overlap. You should then estimate flood flows individually for each sub catchment area and use the model to route the flows through the area of interest.
This approach incorporates different catchment response times and allows the model to determine the effects of features such as reservoirs that might not be well represented in hydrological calculations.
You can also scale distributed inflows to match lumped inflow estimates downstream, for example at a downstream gauging station.
Select calculation methods
There are 2 standard calculation methods available for flood flow estimation in the UK. Currently, these are the FEH improved statistical method and the revitalised flood hydrograph (ReFH1/ ReFH2) rainfall-runoff method.
Flood estimation methods are continuously being improved and you should refer to the FEG to make sure you are using the right methods.
Older methods that are still available but not generally used except in particular circumstances include the FEH original statistical method and the flood studies report (FSR) rainfall-runoff method. These are not covered in this guidance.
There are also non-standard methods such as continuous simulation and direct rainfall. These are not covered in this guidance.
The FEH offers advice that you should consider when choosing calculation methods (volume 1, section 2.2). You should:
- Estimate flood frequency from gauge data, where possible.
- Use data transfer from nearby or similar sites - it can be as useful as subject site data.
- Only estimate important variables from catchment descriptors if there is no other data available.
- Choose your method based on data availability, the needs of the study and the nature of the catchment.
- Choose a hybrid method if appropriate - combining estimates from statistical and rainfall-runoff approaches.
- Use multiple sources of information.
Get and check catchment descriptors
Catchment descriptors are numerical values that characterise properties of a catchment, such as soil permeability, slope steepness and urban extent. FEH statistical and the ReFH1/ReFH2 methods can use catchment descriptors to estimate flood flows.
You should get catchment descriptors that are specific to each location where you need to estimate flow. Download catchment descriptors from the FEH web service. There is a charge for this service.
You should always check that the main catchment descriptors are representative of the subject catchment. These include:
- catchment boundary - the area of high ground that divides river systems
- AREA - topographic catchment area in km2
- BFIHOST and BFIHOST19 - base flow index derived using Hydrology of Soil Types (HOST) classification, you should always use the appropriate version of BFIHOST for your method
- DPLBAR - drainage path length
- FARL - measure of online reservoir influence in the catchment
- SAAR - average annual rainfall 1961 to 1990
- URBEXT2000 - fraction of urban land cover in 2000
You can check descriptor values using Ordnance Survey maps, elevation data (for example, Light Detection and Ranging (LiDAR) data), soil and land use maps. You should update URBEXT2000 to your year of interest which is usually the current year.
Catchment boundaries and descriptors do not always accurately reflect the real catchment area and characteristics, so you may need to make adjustments. This is common on small, urbanised and flat catchments where it can be difficult to define the topographic boundary. You should record any adjustments you make.
If the URBEXT2000 value is unrepresentative of the catchment, you can account for urbanisation by digitising the urban extent of a catchment. You do this using Ordnance Survey 1:50,000 scale mapping.
Select and check hydrometric data
Hydrometric data are measurements of hydrological phenomena including rainfall, river flow and river level. For flood flow estimation, the availability and quality of flow data can be the greatest influence on the choice of method and quality of result.
A peak flows dataset is hosted by the National River Flow Archive (NRFA) and is updated annually. Use the NRFA peak flow dataset as the primary source of flood peak data for statistical method calculations.
You can get continuous (15 minute) rain, flow and level data from the EA. You can then use this data to improve rainfall-runoff method calculations.
If no hydrometric data is available for your catchment, consider whether you can install temporary gauging. As little as 2 years’ data can give a significant improvement in the reliability of flood flow estimates, and can make a large difference to the outcomes of a study. This is particularly important for unusual catchments such as highly permeable or heavily urbanised catchments, where uncertainty is very significant.
Refer to the FEG for more advice on how to select and check hydrometric data.
Review and update rating curves
A rating curve is a relationship between water level (stage) and water flow (discharge) at a point in a river. Rating curves are often used to estimate flow from the measured water level at gauging sites. This is because many gauging sites only record water levels, not flows.
You can use data from a high-quality gauge in your hydrological analysis if the data is reliable during large flood events. The NRFA provides more information on gauge quality.
How to update a rating curve
You should review and update rating curves if necessary. This will depend on available data and project size.
The EA document, ‘LIT14089: high flow rating curve development using hydraulic models’ gives guidance on updating and extending rating curves. You can use a hydraulic model to:
- extend gauge rating to include flows that might bypass (go around) the gauge site when river levels are high
- assess effects of downstream controls
- investigate the effect of changes at the site over time
- help you understand variable backwater effects and hysteresis - a looped rating curve due to a differing level to flow relationship between rising and falling limbs of a hydrograph
You’ll need a greater resolution of local topographic data to capture all controls on local hydraulics and construct a rating review hydraulic model.
For a hydraulic model at a gauging site, you’ll need to gather survey data from:
- the natural river channel upstream of any structure
- a cross section at the gauge inlet pipe or sensor
- the structure (if present) including a long profile through the structure
- bypassing flow route - you can get this from LiDAR
- the natural river channel downstream of any structure, including sections on any areas of scour or sediment accumulation
- the reach downstream, including any downstream controls
When creating your model, you should:
- decide the best way to model the in-channel structure - if there are spot level gaugings, check the part of the rating curve that represents the gaugings to assess if the unit and coefficients are suitable
- simulate your model in unsteady mode to include any lag (hysteresis)
You might need to create separate simulations for winter and summer, for example in-channel vegetation growth can cause seasonal variations in channel roughness and the level-flow relationship.
Your model should:
- extend far enough downstream to prevent boundary assumptions affecting the rating curve
- represent any bypassing flow routes around the gauging structure - for example, ungauged areas
- include locations where water spills from, and re-enters the channel
- account for any changes to the site with rating curves for before and after the change, for example the installation of a new gauging weir
Once your model is complete you can convert the results into a rating curve or use it to extend an existing curve.
You can also add a new out-of-bank modelled limb to in-channel ultrasonic measurements. Once approved, you can use the new flow record in your estimates. Depending on the result of the update, it might still be suitable to maintain the existing rating or discard the site from consideration.
Use the FEH statistical method: peak flood estimates
FEH statistical method is a lumped hydrological approach that gives peak flow estimates. Flows are estimated at intervals along the model length. This affects how you apply flow to the model.
You can use WINFAP software to do FEH statistical analysis, or any other software that implements the method correctly (for example, UKFE R package).
You must consider how much flow data is available before you begin. If you have done a rating curve update, you should also update your hydrometric records.
You can estimate the median annual flood flow (called ‘QMED’) with a high quality flow record of more than 2 years. The gauge record can be at the site of interest, or nearby. You can estimate the QMED by calculating the median value of the annual maximum (AMAX) flow record if there is more than 2 years of data.
You can use the alternative peak over threshold (POT) method for good quality gauges with a record length between 2 to 13 years.
If there is no suitable gauge at the site of interest, estimate QMED from catchment descriptors using the QMED equation. You should also use up to 6 donor sites to adjust the QMED estimate. You should select donor sites based on proximity of catchment centroids, not catchment similarity. Donor sites do not need to be on the subject watercourse.
There are some occasions where you should not choose donor catchments on proximity alone. For example, if the donor catchment is affected by artificial influences including:
- urbanisation
- forest drainage
- reservoirs
- opencast mining
You should justify and report your reasons for choosing donor catchments. You’ll also need to check any donor adjusted QMED estimates against upstream or downstream gauging stations for consistency.
Flow estimates become uncertain when there is a lack of gauge data. You can use other methods to estimate QMED, such as bank full channel width, or low flow statistics (read the Environment Agency (EA) LIT 11832: Flood Estimation Guidelines (FEG) for details). You should only consider estimating QMED from just catchment descriptors as a last resort. You should not use the QMED catchment descriptors equation for catchments containing reservoirs or pumped catchments.
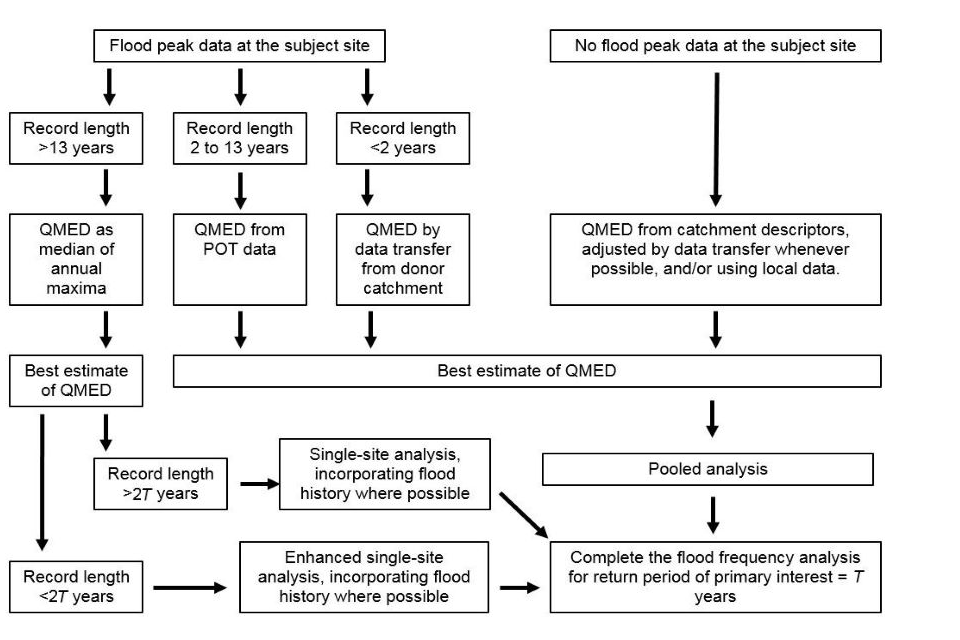
The figure shows a process flow chart for statistical flow estimation. Important acronyms used in the diagram are QMED (the median annual flood) and POT gauge data.
Estimate growth curves
Growth curves show the relationship between peak flow and flood rarity. They are used to extend QMED estimates for longer return period events or lower probability AEPs.
Growth curves may not be accurate for estimating very extreme floods (1% Annual Exceedance Probability (AEP) or less). You may need to use rainfall-runoff methods to extend the statistical growth curve if you do not have a flood chronology spanning several hundred years.
There are 3 methods available to estimate growth curves. You should use more than one method to create multiple growth curves. You can then compare these with known flood history and identify which curve best represents extreme flood flow. You should include longer-term historical data, such as flood rankings, in your growth curves whenever possible. Read the Flood Estimation Guidelines for more information.
Pooled method
You can use a ‘pooling’ group of catchments with hydrological similarities to the subject site to create a long record period.
Use this method if the:
- area of interest and subject site is ungauged
- subject gauge record is less than twice that of the target return period
The catchments in a pooling group should be rural with a fraction of urban land cover in 2000 (URBEXT2000) of less than 0.03.
You should review the initial pooling group. Do not rely on it to be accurate. You should remove catchments with records less than 8 years. Do not remove catchments just because their flow record is different to other sites in the group.
You can use a single pooling group for multiple estimation points along a watercourse, if they have similar characteristics. This will help you maintain spatial consistency. You will need a new pooling group if the catchment characteristics change, for example, if a major tributary joins the subject site.
Once you have created a satisfactory pooling group, fit a statistical distribution to estimate flows for the event severity you are interested in. Although the default distribution for UK catchments is the generalised logistic distribution, other distributions may be a better fit for your pooling group. You should explain why you have chosen your statistical distribution in your hydrology report.
Single site method
You can use just the flow record at the subject gauge to create the growth curve, if your record is:
- high quality
- at least double the flood return period you are interested in
You can find specific guidance on how to do this in the FEH and FEG. This method can be unreliable if your data quality is poor, or you have a short flow record.
You should fit a statistical distribution to the flow data. You should explain why you have chosen your statistical distribution in your hydrology report. Even if your chosen distribution fits the flow record well, it could still be different from the true growth curve. This is because the duration of hydrometric records in the UK is generally short.
Enhanced single site method
This method combines the pooled and single site methods.
Use the pooling group with your subject site gauge included as the first entry in the group. This will give it the most influence over the calculation.
Use this method at or near gauge sites with at least 8 years of good quality data.
This will give you the benefit of using local data but you’ll not need to rely on just a single gauge record.
Use the ReFH method: select the best data
ReFH1/ReFH2 are rainfall-runoff models you can use to simulate observed floods or design events.
To model an observed flood, you should use recorded catchment-averaged rainfall data and the initial conditions as your input data. This will give you flows as your output data.
For a design event you must input information about the storm and the local conditions of the event. This includes:
- duration
- time of year
- URBEXT2000
- initial conditions
Regardless of the method, you should include all the available data and justify any data you exclude.
If you include hydrometric data in your model it will increase its accuracy and reduce uncertainty. However, this is not always possible.
The FEG provides guidance for estimating parameters for rainfall-runoff models. It includes which parameters you should consider and what methods you should use if hydrometric data is unavailable.
ReFH1/ReFH2 have 4 parameters. They are:
- maximum soil moisture capacity in millimetres (CMAX)
- time to peak (Tp)
- baseflow lag (BL)
- baseflow recharge (BR)
Estimate parameters from hydrometric data
Estimating parameters from hydrometric data is the preferred option.
You should use hydrometric data if:
- suitable data is available near the site of interest
- the effort to get hydrometric data is justifiable
- you have appropriate experience and training
You can estimate 4 parameters using the ReFH2 calibration utility. CMAX and Tp can be calculated by an optimisation method that needs catchment rainfall, flow and evaporation data. You can then use these parameters in your model.
Hydrologists can estimate parameters as part of rainfall-runoff models. Also, estimating parameters will take more time than using catchment descriptors in your model.
Estimate Tp data using lag analysis
If you cannot get flow data but rainfall and river level data are available, you should use this data to estimate Tp as a second-best option.
Tp data is the most influential parameter if you are creating a hydrograph shape using ReFH. For this reason, you should estimate it from hydrometric data rather than relying on catchment descriptors alone.
You should calculate lag times between rainfall centroids and peak levels from hydrometric records. You should use data from different flood events and make sure they are not double-peaked events.
You should then work out the average lag time from your chosen data.
To convert this into Tp you can use the following equation from the FEH: Tp = [0.879(LAG)]^(0.951).
The ReFH2 catchment descriptor parameter calculations assume that the catchment is rural. Hydrometric data estimates could include an urban influence.
This means you should take care when comparing Tp estimates between catchment descriptors and hydrometric data. They may not be comparable.
You can remove the urban influence from your Tp by dividing the observed Tp by an urban component. You can do this using the following equation:
Observed rural Tp = Obs urban Tp divided by ((1+URBEXT2000) ^-0.336)
Use data transfer in your model
To apply the observed rural Tp to locations beyond the gauge site, you need to get an adjustment factor. You can do this instead of entering the observed rural Tp directly into ReFH.
You can get an adjustment factor by comparing your observed rural Tp with the rural Tp estimate from catchment descriptors.
Data transfer for ReFH 1 was explored by Faulkner and Barber (2009).
They concluded that you can use data transfer in your model for ReFH1 if there is a nearby flow gauging station on the same watercourse.
To do this, you can create an estimate of the 4 model parameters and generate a ratio with those from catchment descriptor estimates at the site of interest.
Use catchment descriptors in your model
In some cases, you may only be able to use catchment descriptors in your model. Using catchment descriptors is your only option on ungauged watercourses.
Select a storm profile and storm duration
You must define a winter or summer storm profile for your simulation in ReFH2. You also need to account for the level of urbanisation in your catchment.
You can do this by using the URBEXT2000 catchment descriptor.
You should use a winter profile unless URBEXT2000 is more than 0.30. You should also use it if:
- URBEXT2000 is more than 0.15
- BFIHOST19 is equal to or more than 0.65
If you apply your storm profile using the lumped approach, you should adopt a storm duration specific to each lumped catchment.
If you use a distributed approach, you should use critical storm duration testing. The storm duration, storm profile and areal reduction factor must be consistent across all sub catchments for a particular simulation.
Use Urban ReFH methods for urbanised catchments
The ReFH2 software divides the catchment into rural and urban components, modelled separately with results combined into a total catchment hydrograph. This approach is commonly called urban ReFH.
Urban ReFH accounts for urbanisation by setting an impervious runoff factor (IRF) of 70% by default. This forces 70% of the rainfall to become direct runoff over the urban area in your simulation.
ReFH2.3 applies a Tp scaling factor of 0.75 which decreases the catchment response time. In ReFH 2.2 the Tp scaling factor is 0.50. You can alter the Tp scaling factor if you need to.
You can also define areas where sewers drain away from the topographic catchment to remove a portion of the hydrograph. You base this on an assumed sewer capacity.
Scale a hydrograph shape
If you have decided that the FEH statistical approach gives the most reliable peak flow estimates, you can estimate a hydrograph shape using either:
- scale a ReFH derived hydrograph to the statistical peak
- apply observed hydrograph shapes from a gauge - these should be averaged across multiple large events
If you are using ReFH1 or ReFH2, hydrographs are given as an output.
The approach you choose should depend on the availability and quality of local hydrometric data.
If data is available close to the upstream model extent, you can use observed average hydrographs to include catchment specific characteristics.
It may not always be suitable for you to use observed data. For example, if a gauge is located downstream of an attenuation feature such as a reservoir. If this is represented within the hydraulic model, the influence of the feature may be double-counted if you use observed data.
If you use ReFH hydrographs, you can scale the resultant hydrograph to the statistical peak.

The figure shows: when scaling the hydrograph shape, ReFH estimates lose the volume estimate of the hydrograph. As the volume of the hydrograph is manually increased or decreased you should not use them for catchments where flood risk is driven by volume rather than peak flows.
Create average hydrographs
You can also create hydrograph shapes by averaging out major flood event peaks.
There are 2 methods you can use to do this.
- Normalise the peak flow of each event and align them so peaks occur at the same time - you then take the average of these events.
- Use observed hydrographs to find an average of the widths.
To do this you should:
- Select the flood hydrographs you would like to use for your analysis.
- Gather the duration of exceedance of selected percentiles of peak flow from the hydrographs you have selected.
- Assess the duration before and after the peak to make sure that in synthesis, you get a more realistic asymmetrical profile.
- Get median durations for each exceedance percentile and determine a hydrograph shape that is non-dimensional with respect to discharge.
- Apply the median hydrograph shape to the estimated peak flow from flood frequency analysis.
Choose the best method for estimating peak flows
It can be difficult to decide whether to use the FEH statistical method or the REfH1/ReFH 2 rainfall-runoff method.
The method you decide to use will depend on the data you have available and the characteristics of your catchment area. You should use local data in your decision. This includes:
- available peak flow data
- size of your catchment area
- whether lakes or water bodies are present
- the level of urbanisation
Before choosing your method, you should calculate flows from both methods. This will help you decide which method is best for your subject site.
You should not select a method just because it has the highest or lowest flows or because the results align with a previous study.
Often you’ll only know a set of flows is unrealistic after the initial flow has been reviewed and tested in a hydraulic model.
When to use the FEH statistical method
You should consider using the FEH statistical method if:
- there is more than 2 to 3 years of peak flow data on the watercourse from a suitable gauging station - the watercourse does not have to be at the subject site
- the catchment area exceeds 1,000km-squared
- there are lakes or water bodies in the catchment and you are not going to use flood routing
You should avoid using the FEH statistical method in lowland catchments. This is due to the lack of flow gauging sites and the importance of hydrograph volumes in these areas.
When to use ReFH1 or ReFH2
You should consider using the ReFH1 and ReFH2 method if:
- there are reasons to believe flood hazard is influenced by factors other than peak flow - for example, volume or timing of hydrographs
- there is no continuous flow data but flow or level data is available for 5 or more flood events
- the catchment area includes sub-catchments with very different flood responses
- there is a need to estimate extreme floods - for example, in reservoir safety work
If the ReFH method is most suitable for your subject site, you should use ReFH2. This is because ReFH2 uses up-to-date rainfall statistics. ReFH2 is particularly recommended on permeable catchments with a BFIHOST of more than 0.65.
Select the right method for urban areas
If your subject site includes urbanised catchments, you can use either FEH statistical or ReFH1/ReFH2 for your model.
However, you should use ReFH1/ReFH2 if:
- there is no flow data
- there is a major difference between the boundaries of topographic catchments and sewer catchments
- flow estimates are needed for high probability or low magnitude floods when a high proportion of the flow will be within sewer systems
- there is time and budget available for derivation of sewer catchment boundaries
The ReFH2 method offers significant improvements over ReFH1 for permeable catchments. If your subject site includes permeable catchments, you should use ReFH2 for your model.
The FEH statistical method is more appropriate for ungauged models. This is despite the uncertainty in QMED estimation.
You can find out more guidance on permeable catchments in the Flood Estimations Guidance Section 7.3.
Select a method in catchments with reservoirs
If your flood peak data is downstream of a reservoir or reservoirs, you can use the FEH statistical method in your model.
Catchments that include reservoirs can reduce (attenuate) flood flows even if reservoirs are at full capacity.
The FEH statistical method lets you directly account for the influence of reservoirs in your model.
If you do not have suitable data available, you should use ReFH2 with flood routing calculations to determine reservoir outflow. This will help to represent reservoir attenuation in your model. This means you do not have to rely on the flood attenuation by reservoirs and lakes (FARL) index.
Direct rainfall modelling
Direct rainfall modelling is the application of rainfall directly to the hydraulic model.
Since the development of 2D models, direct rainfall modelling has become popular. It’s widely used in surface water modelling where rainfall is applied to the 2D domain and routed overland.
You should make sure you apply direct rainfall methods that are suitable for your chosen areas. To help you do this, you should consider if they:
- adequately represent hydrological processes
- can be justified by comparison with flow measurements
This mainly applies to the use of a direct rainfall approach for fluvial modelling, rather than in a specific surface water model.
When to use direct rainfall modelling
You should only use direct rainfall modelling for fluvial studies in:
- heavily urbanised areas where most runoff will be overland.
- lowland systems where there is permanent standing water or near saturated soils.
- gauged catchments where results can be compared against gauged records
You can use direct rainfall modelling for sewer modelling in most circumstances.
For surface water or sewer modelling, the Chartered Institution for Water and Environmental Management (CIWEM) Urban Drainage Group (UDG) Rainfall Guide provide further guidance.
You must specify storm duration, storm profile and spatial patterns. Complete critical duration testing once the hydraulic model is available.
You should generate rainfall using the FEH13 depth-duration-frequency rainfall model, a UK wide 1 kilometre resolution grid. You can also generate design storms using modules provided in urban drainage models.
FEH 13 rainfall estimates are based on rainfall information up to 2008 and do not represent rainfall from 2008 onwards. You should consider if there have been any significant events since 2008 or a period of heavier rainfall in your model.
Represent losses in your model
You must represent losses and routing of flow from runoff in your model.
As part of your modelling, you should not assume that all runoff will find its way quickly into channels.
In temperate climates most rapid runoff occurs through shallow soil layers rather than overland. Tests have shown nearly all water entering the river following a storm is “old water” stored in soil and displaced by new infiltrating water.
There are 2 approaches to representing losses in your model. They are:
- pre-calculation of losses, leading to net rainfall inputs to a model
- using infiltration equations to calculate losses dynamically within the hydraulic model
Use baseflow
You should represent baseflow if you are using direct rainfall for fluvial flood modelling. This is recommended by the Flood Estimations Guide.
To do this, you can use ReFH2 to calculate baseflow and add this to the river channel.
Non-stationarity and flood frequency analysis
If you are planning and appraising flood risk management schemes, you should be aware of non-stationarity and its effect on flood frequency analysis.
You do not need to take into account non-stationarity for flood mapping projects.
Non-stationarity takes into account that statistical properties of flow can change over a relevant timescale. For example, the mean, median or variance of AMAX flows might change during the gauged period of the record.
This contrasts with models of flood risk management that presume the processes producing floods are stationary.
According to stationary models, statistical properties of flood flow time series do not change over time (excluding short term fluctuations such as seasonality). This means the probability of a particular flood occurring would not change over time.
EA guidance on non-stationarity
The EA has published interim guidance to introduce practitioners to the concept of non-stationary flood frequency analysis.
Find out about the tools and techniques recommended by the EA.
Currently, the guidance only applies to gauged sites. Research in applying the methods to ungauged sites (for example, in FEH pooling groups) is ongoing but has not yet been converted into a published method.
FEH methods fit statistical distributions to flood peak data to create a flood growth curve. This most often uses the generalised logistic (GLO) or generalised extreme value (GEV) distribution. Each distribution includes three parameters - location, shape and scale.
In a conventional hydrology approach that does not use non-stationarity, the parameters are fixed.
In non-stationarity approaches, one or more is not fixed. They may change over time or in response to changes in variables other than flow. These are called covariates, either time-based or physically-based.
As part of the guidance development, some initial non-stationarity analysis was undertaken for all NRFA flow gauges across England and Wales.
This helped to establish recommendations for a stationarity or non-stationarity approach at each site. The analysis based conclusions on statistical analysis of the gauged records’ time-based predictions (covariates).
375 gauges were analysed, 287 of these were recommended to maintain a stationary approach. 13% of gauging stations showed an upward trend, at a 5% statistical significance level in annual peak flows over the period of record.
Apply flows to the hydraulic model
You should apply your final flow estimates as inflows to your hydraulic model. Inflows are usually represented as units adding flows into selected locations in your hydraulic model.
Managed discharges from reservoirs or pumping stations can also be represented as inflows to your hydraulic model if appropriate.
You can present inflow as either:
- a time series of flow data
- a time series of rainfall depths
- tidal curves or levels on a downstream watercourse which can add water to a model domain
Apply flows to your fluvial model
Once you have estimated flows you should apply them to a hydraulic model.
Your hydrologist and hydraulic modeller should work together to help you do this.
If your model includes short reaches of larger catchments it’s likely you’ll only need a single inflow representing the catchment. The size of your inflow is unlikely to change significantly over the length of the model.
If you are creating a larger model it can be difficult to design an effective hydraulic model because:
- the design flood concept cannot be applied to large or catchment wide systems
- a catchment wide design storm is not possible in the real world
You still need to design flood maps, sometimes across large areas.
You can mitigate against these challenges when modelling over larger areas by:
- splitting up a model into small segments or reaches and running a separate design flood through each. You can then merge the results together. This may result in useful outputs but does not create a model useful for strategic study area-wide decision making
- making compromises and focusing on getting the design flows correct in the main area or areas of interest.
- avoiding the need to think about what a design flood looks like by simulating numerous floods over a long period of time - you should then analyse the results for flood mapping purposes
Use lumped hydrology
If you need to use a lumped hydrologic approach in your model, you should follow these steps:
- Apply flows to the extent of the upstream model.
- Add tributary or lateral inflows to represent the catchments between the extent of the upstream and downstream models.
- Adjust the magnitude of flow from these catchments to maintain the lumped flows estimates in the main channel. This assumes a consistent design event along the main channel, something unlikely to occur in reality, and inflows from lateral catchments are not assigned a particular probability.
If your subject site is located where 2 watercourses join, you may have to do a joint probability analysis.
This will help you assess the range of conditions on each tributary that may give rise to a design event at the confluence.
If the confluence is between watercourses draining catchments of significantly different sizes, you can assume a single storm will not give rise to a significant flood on both simultaneously. In this case, it’s likely you will not have to carry out joint probability analysis.
Use a distributed method
A distributed method will let you apply a design storm to all catchments to create the design conditions that are needed at the subject site.
You can include a distributed approach by carrying out critical duration testing within the hydraulic model. This will help you identify which storm duration (consistent across all subject catchments) generates the highest flows, levels and greatest flood extents in the subject sites.
For large, distributed models, you may have to simulate different storm events to represent the design event in different parts of the catchment. You’ll then have to combine your results for flood mapping.
Tidal influence can add complexity to your model. For example, the critical duration may be determined by the duration of tidal locking rather than catchment responses.
To establish if your results are sensitive to event magnitude, you can test storm durations for the 1% AEP event plus one other lower magnitude event.
Flow and pipe network models
Flow can typically enter pipe network models by either:
- catchments (1D) representing connected areas directly routed to modelled nodes
- direct rainfall (2D) generated overland where flow drains into the pipe network by a 1D2D connection at the surface
1D catchments are divided by land use. You can use a different runoff model for land use such as paved areas, roofs and greenspace.
Apply a fixed runoff model (such as fixed or constant) for paved or roof areas.
Use a time varying runoff model (such as NewUK or GreenAmpt) for greenspace. You can use either spatially uniform or varied runoff models for direct rainfall. Which one you choose depends on the complexity of the model but will either be fixed, constant or Horton.
You can find more guidance on runoff models by the UDG.
Take into account downstream boundaries
Downstream model boundaries can input flow in your model but are often considered as mechanisms for removing water from the model domain. For example, in the case of a tidal boundary.
Although they can be considered as an inflow source, these are normally considered in the hydraulic modelling process and not under the hydrological analysis.
Read about modelling downstream boundaries for further guidance.
Allow for climate change in your model
In fluvial modelling, the effect of climate change relates to:
- changes to river flow
- rainfall intensity
- sea level rise
- extreme wave heights
You must add climate change allowances to your model. You can find climate change allowances in the flood and coastal risk projects, schemes and strategies: climate change guide.
Allowances you can add include:
- peak flow
- rainfall intensity
- sea level rise
- offshore wind speed
- extreme wave height
If you are carrying out a flood risk assessment (FRA) or flood mapping study, you should include climate change allowances. This usually involves percentage increases to inflows or rainfall.
You may also have to apply tidal uplifts that are presented as annual increases in sea level. Also, if you increase peak flows within a hydrograph as part of your climate allowances you’ll also increase hydrograph volume.
If you are carrying out a mapping study, the requirements are often set out in project scopes. Increasing peak flows within a hydrograph will also increase hydrograph volume.
Climate change uplifts are subject to periodic revisions so check at the start of each project, or when flows are reused for subsequent projects.
Depending on the nature of the study you might need to use different epochs or categories. You should include these in your hydrological method statement and stakeholders should approve them.
Calculate joint probability
You may need to calculate joint probability as part of your model. Joint probability is a statistical approach that allows you to calculate the likelihood of 2 or more events occurring at the same time.
For example, a joint probability problem in flood risk would be the likelihood of a high magnitude fluvial flood combining with a storm surge tidal event.
According to the FEG, almost every type of flood is influenced by multiple causes. However, for many studies joint probability analysis may not be needed as one cause of flooding dominates.
Methods to calculate joint probability
You should decide whether joint probability analysis is needed when you write your method statement.
If joint probability analysis is necessary, the method you choose will depend on:
- the complexity of the problem
- available data
- your budget
- the knowledge available to you
The Combining probabilities from different factors to improve the design of flood defences page on GOV.UK gives guidance on how to carry out joint probability analysis.
A more sophisticated method to calculate joint probability is the Heffernan and Tawn model.
Include detailed reporting with flow estimates
You must include detailed reporting alongside your final flow estimates. This is due to the complexity and number of decisions you’ll have to make during hydrological analysis.
Your report should follow the EA LIT 65087: flood estimation report template. The EA LIT 65088: flood estimation report template note will provide further information on filling out the template.
The template will:
- help you check that you have chosen the right approach and applied methods correctly
- help you, reviewers and project managers by setting out calculations in a standard format
- provide a study audit trail so work can be reviewed and reproduced in the future
- help hydraulic modellers know how to apply flows to the model
The document includes a section where you should discuss uncertainty, assumptions and limitations associated with the analysis. This should be considered alongside sensitivity testing of the hydraulic model
Request referenced documents
To get a copy of a document referenced in this guidance or a copy of the full PDF version of this guidance and the Microsoft Excel-based Fluvial Model Assessment Tool, email enquiries@environment-agency.gov.uk.
You should quote the reference number of the document you need, for example, LIT11327.