Reproduction number (R) and growth rate: methodology
Updated 6 September 2021
Applies to England

© Crown copyright 2021
This publication is licensed under the terms of the Open Government Licence v3.0 except where otherwise stated. To view this licence, visit nationalarchives.gov.uk/doc/open-government-licence/version/3 or write to the Information Policy Team, The National Archives, Kew, London TW9 4DU, or email: psi@nationalarchives.gov.uk.
Where we have identified any third party copyright information you will need to obtain permission from the copyright holders concerned.
This publication is available at https://www.gov.uk/government/publications/reproduction-number-r-and-growth-rate-methodology/reproduction-number-r-and-growth-rate-methodology
Introduction
This document outlines how the national and NHS England region estimates of the reproduction number (R) and growth rate are produced and subsequently published on GOV.UK:
-
section 1 below outlines how each academic group produces their individual estimates, using a mixture of data sources and modelling techniques
-
section 2 below outlines how these estimates are statistically combined to form a single consensus range
-
section 3 below outlines the approval and quality assurance process that the individual and combined estimates go through to ensure they are robust and reliable
-
section 4 below outlines how the final consensus range is communicated
This document refers mainly to the production of the R value and growth rate for England. However, the same process applies to estimates of the R value and growth rates for Scotland, Wales and the NHS England regions.
The devolved administrations publish estimates of the R value and growth rate for their own nations. Scotland and Wales use UK Health Security Agency (UKHSA) estimates of the R value and growth rate. In Northern Ireland, the R value is produced by the COVID-19 modelling group on behalf of the Department of Health.
- R value and growth rate for Scotland
- R value and growth rate for Wales (Cymraeg)
- R value for Northern Ireland
1. Estimates from individual modelling groups
The effective reproduction number – Re[footnote 1] – and growth rate are estimated using modelling, and these estimates will be affected by the data and methods used. There are a number of ways to estimate the R value and growth rates, and multiple leading academic groups produce a variety of models that use different approaches and data sources to estimate these metrics. These models are constantly being developed, amended, and updated to improve their representation and simulation of the current epidemic across the UK.
Several different academic groups submit estimates of the R value and growth rate each week. Not all groups submit all model estimates every week, although this is uncommon. The main models that submit on a weekly basis are described below. References to hospital data and deaths relate to COVID-19 hospitalisations and deaths within 28 days of a positive test.
Further information about some of these models can be found in:
- SPI-M-O: COVID-19: Medium-term projections explainer, 31 October 2020
- the Royal Society rapid review Reproduction number (R) and growth rate (r) of the COVID-19 epidemic in the UK
- the model-specific links below[footnote 2]
University of Cambridge MRC Biostatistics Unit and Public Health England (PHE)
The University of Cambridge Medical Research Council (MRC) Biostatistics Unit and PHE use a deterministic age-structured compartmental model to estimate the reproduction number. This model uses the number of daily deaths and serology data as its primary inputs, combined with school attendance and mobility data.
Published results from the University of Cambridge MRC Biostatistics Unit and PHE
University of Exeter and University of Bristol
The University of Exeter and University of Bristol use a renewal equation model to estimate the reproduction number, based on the work by Cori and others (2013) and produced using the EpiEstim library. The model uses data on cases and hospital admissions.
Imperial College London
The MRC Centre for Global Infectious Disease Analysis at Imperial College London uses a stochastic age-structured compartmental model to estimate the reproduction number. The model includes transmission in care homes. Model parameters are fitted to epidemiological data, including hospital admissions and bed occupancy, ICU admissions, deaths, Pillar 2 testing, REACT community survey and blood donor serological data.
Download the code for the Imperial College London model
A second model has been developed in collaboration with the UKHSA that implements a Bayesian hierarchical model using the package Epidemia, which is fitted to deaths and cases. Model results from a similar implementation can be found here.
Lancaster University
Lancaster University uses 2 approaches to estimate reproduction numbers. The first is an application of the renewal equation method by Cori and others (2013) using the EpiEstim library, and using data on cases (England, Scotland) and hospital admissions (Northern Ireland, Wales). The second is a meta-population transmission model of infection within and between local authorities parameterised using movement data, fitted to case data, and used to estimate reproduction numbers at the local authority[footnote 3] and national scales.
London School of Hygiene and Tropical Medicine (LSHTM)
LSHTM jointly estimates the trajectory of infections and reproduction number using a renewal equation model and observed delays. The model is fitted to different data streams (in particular: cases and hospitalisations) separately.
Published results from the LSHTM model
University of Manchester
The University of Manchester uses a deterministic compartmental model to estimate the reproduction number. The model is fit to data on hospital admissions, hospital and ICU occupancy, and hospital deaths.
University of Warwick
The University of Warwick uses a deterministic age-structured compartmental model to estimate the reproduction number. Model parameters are fitted to epidemiological data including hospital admissions and occupancy, ICU admissions, deaths, serological data and for some model configurations, the proportion of Pillar 2 tests that are positive. Furthermore, a second model has been co-developed with the UKHSA and is an application of the renewal equation method by Cori and others (2013) using the EpiEstim library, and using data on cases.
University of Oxford
The University of Oxford, supplies 2 methods of estimating the reproduction number, both of which have been developed and adapted in collaboration with the UKHSA. The first model is a version of the Covasim model as a stochastic agent-based model to estimate the reproduction number. Model parameters are fitted to epidemiological data including cumulative and daily infections, hospital admissions and occupancy, ICU admissions and deaths (GOV-UK), but also Google mobility data, vaccination uptake and testing data (GOV-UK). The second is a Bayesian model based on the renewal equation with a spatio-temporal correlation between local authorities, and is informed by case data. Results from this model can be found here.
University of Liverpool
The University of Liverpool model is a Bayesian statistical model that fits epidemiological surveillance data, including deaths, hospital admissions, and symptomatic reports made via the NHS 111 online service. The model comprises a deterministic compartmental transmission model governed by a system of ODEs and a stochastic observation model.
European Bioinformatics Institute (EBI)
The EBI model combines Bayesian spline and multinomial regression to estimate the incidence, reproduction number and relative growth rate of SARS-CoV2 lineages. Model parameters are fitted to local daily new cases (GOV-UK) and genomic surveillance data (weekly aggregated SARS-CoV2 lineage counts, COG-UK).
Scottish Government (Scotland results only)
The Scottish Government uses a hierarchical Bayesian mechanistic model developed by Imperial College London, including the bespoke package Epidemia, to estimate the reproduction number. The model is informed by data such as deaths and contact patterns, and the method has previously been used by Imperial College to investigate the impact of non-pharmaceutical interventions on the spread of COVID-19.
Time delay of the estimates
These estimates of the R value and growth rate will not account for changes in transmission that have not yet been reflected in the data. Epidemiological data, such as hospital admissions, intensive care unit (ICU) admissions and deaths usually take up to 3 weeks to reflect changes in the spread of disease. This is due to the time delay between initial infection, developing symptoms, the need for hospital care and death. There may also be reporting delays for some metrics such as deaths, with figures typically revised upwards after initial release.
2. Combining the individual estimates into a single estimate
As described in section 1 above, several academic groups individually estimate the R value and growth rate using different data streams, modelling techniques and assumptions. Each academic group provides key insight into the current state of the epidemic through their own expertise and combined experience.
To capture the inherent uncertainty in the R value and growth rate, the individual estimates are combined into a single range for each metric that is based on the evidence available at the time and provide an indication of the reliability of the estimate. This combination process is currently done using CrystalCast Software by UKHSA.
The combination process
To provide a single range of the R value or growth rate, the outputs from multiple models are combined in a meta-analysis. As each candidate model uses a different method to calculate the estimate, the modelling approaches and/or underlying assumptions of the estimates are assumed to vary. For example, they may use different modelling approaches (for example, mechanistic or empirical) or different mixing assumptions based on space or age, causing different patterns of disease spread.
To account for this, a meta-analysis using a random effects model is undertaken. This approach uses the well-established restricted maximum likelihood (REML) method to calculate the variability between estimates and incorporates 2 different approaches to calculate the confidence intervals. Equal weighting is favoured over the more standard inverse-variance weighting in order to account for potential bias caused by the down-weighting of models providing estimates with higher levels of uncertainty.
As of 26 March 2021, the approach to combining the R values and growth rates has been normalised, so that modelling groups submit time series of estimates and a given date across all models is used, rather than their most recent estimates. Scientific Pandemic Influenza group on Modelling (SPI-M) analysed the difference between these 2 methods over the 4 weeks prior to the change being made and found little to no difference between the combined estimates. This makes the estimation of R more consistent and robust.
For more information on the combination process, see the paper Statistical methods used to combine the effective reproduction number, R(t), and other related measures of COVID-19 in the UK.
This meta-analysis produces a range for the R value or growth rate that accounts for the modelling assumptions, potential methodologies used, and associated uncertainties. The lower bound of the final range is rounded down (floored) and the upper bound rounded up (ceilinged) to 1 decimal point for R, or 2 decimal points for growth rates.
Reliability indicator
Both the R value and growth rate are average measures over an entire population. If the population is very variable in space (heterogeneous) or if low case numbers make the models themselves less reliable, then the R value becomes less helpful in monitoring the epidemic. The same is true of growth rates, but to a lesser extent as these rely on fewer assumptions about the disease (for example, generation time).
To ensure that the combined estimates are representative, a basic reliability score is calculated using the number of COVID-19 hospital admissions (to determine if the estimate is based on very few cases), and the variability of the numbers of cases in space (for example, to determine if there is an outbreak surrounded by areas with few or no cases within a region). These admissions data are correlated with the number of cases, and are averaged over a 10-day period to avoid the reliability score being skewed by random variation.
Until 30 April 2021, the reliability score used the number of daily deaths in an area instead of hospital admissions to assess whether the estimate is based on few cases. These death data were agreed to be the most reliable data stream and correlated with the number of cases when the indicator was developed in summer 2020. Over recent months, the number of deaths has been driven down to very low levels due to lockdown and the impact of the COVID-19 vaccination programme, consequently reducing reliability scores for many regions. As a result, the number of individuals admitted to hospital with COVID-19 and inpatients newly diagnosed with COVID-19 has now replaced deaths in estimating the reliability indicator
Each metric is scored and combined into 4 levels. Based on this score, the combined metric is marked as follows:
-
0 – it is highly unlikely that the estimates are homogeneous and there may be a clustered outbreak in the specified region
-
1 – it is unlikely that the estimates are homogeneous and there may be a clustered outbreak in the specified region
-
2 – it is likely that the estimates are homogeneous and are a good measure of the current situation for the specified region
-
3 – it is highly likely that the estimates are homogeneous and are a good measure of the current situation for the specified region
Estimates that score a 0 or 1 are accompanied with the following caveat when published on GOV.UK:
Particular care should be taken when interpreting these estimates, as they are based on low numbers of cases, hospital admissions or deaths, and/or dominated by clustered outbreaks. They should not be treated as robust enough to inform policy decisions alone.
3. How estimates are quality assured and approved
To ensure the individual and combined estimates are as robust and accurate as possible, all estimates are reviewed and scrutinised by a variety of experts.
Estimates are initially reviewed by a small sub-group of epidemiologists and statisticians
The individual and combined R value and growth rate estimates are initially quality assured by Statisticians and Epidemiologists in UKHSA on the Tuesday before publication. Any unusual estimates, for example those that do not follow recent trends in the data, are double checked with the modellers. Modellers may rerun their models to check unusual estimates, which they may ask to be excluded from the combination if deemed appropriate. The Nowcasts are also presented, along with Medium Term Projections, to SPI-M on the same day.
Estimates are formally reviewed by EMRG
The individual and the overall combined estimates are presented to members of the Epidemiology Modelling Review Group (EMRG), who scrutinise the estimates and combinations.
The final estimated ranges for the R value and growth rate are agreed by EMRG, with any requested changes implemented and checked by the EMRG secretariat. The final estimates are included in the EMRG regular consensus statement. The statement is approved by the UKHSA CEO.
Final estimates are formally approved for publication
The EMRG Secretariat submit the consensus statement for approval to the UKHSA CEO.
Once approved, the R values and growth rates are sent to a group of cross-government recipients before publication.
4. How estimates are communicated
As part of the approval process of the estimates by EMRG, commentary explaining some of the limitations or qualifiers of the estimates is also agreed.
The commentary starts as a conversation in the EMRG meeting, where members discuss the factors that need to be considered when using the estimates and any impacts as a result of the combination; for example, if models that use more timely data, such as cases, have estimated higher R values than those models that use more lagged data, such as deaths.
The proposed commentary is drafted by the EMRG secretariat and included in the weekly EMRG consensus statement. The consensus statement is agreed by the EMRG Chair and is subsequently approved by the UKHSA CEO.
EMRG agreed text forms the basis for the commentary published alongside the estimates on GOV.UK. The devolved administrations publish estimates for their own nations.
In the rare situation where the estimates are not approved, the UKHSA CEO will advise on whether the estimate will be released, the reason for non-approval, and next steps.
Flowchart: estimating the R value and growth rate – from production to publication
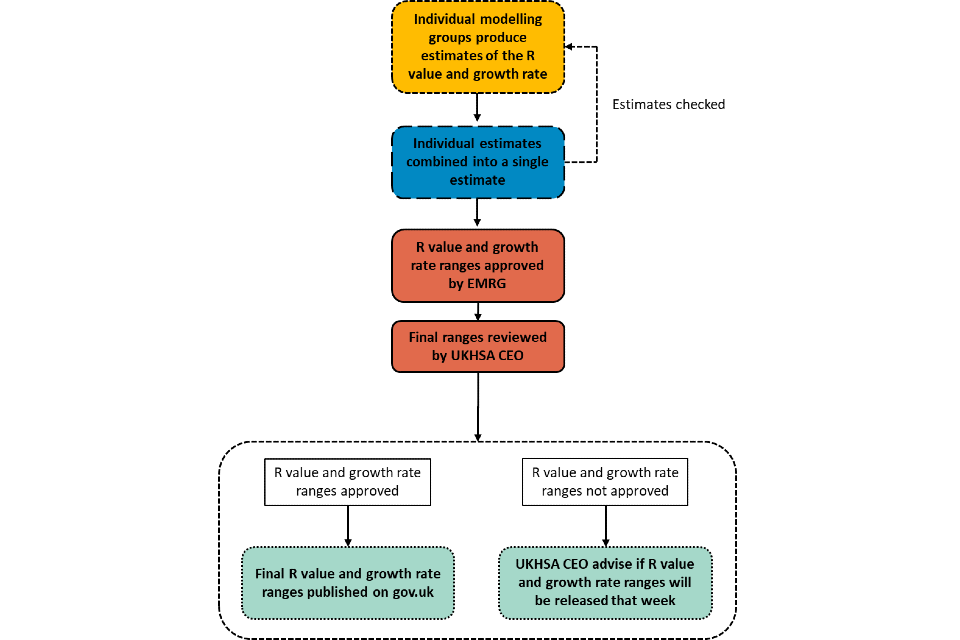
Text alternative to the flowchart
Estimates of the R value and growth rates are produced by individual modelling groups, combined and then reviewed.
Are EMRG content with the estimates?
No:
- individual modelling groups will re-run or exclude estimates of the R value and growth rate as appropriate, and they will be recombined
Yes:
- R value and growth rate ranges approved by EMRG
-
final ranges reviewed by UKHSA CEO
- see next section
Are the R value and growth rate ranges approved?
No:
- UKHSA CEO advise if R value and growth rate ranges will be released that week
Yes:
- R value and growth rate ranges are published on GOV.UK
-
This is also referred to as Rt and R. For simplicity, Re is referred to as R or the R value throughout this document. ↩
-
In general, the linked-to papers provided alongside each model description should take precedence. Refinements to the models continue to be made, and some elements of earlier model descriptions in these documents may have been updated since. ↩
-
In line with previous SAGE advice, only regional estimates of R and growth rate are included in the EMRG estimates. ↩