Psychotropic drugs and people with learning disabilities or autism: results
Published 22 March 2019

© Crown copyright 2019
This publication is licensed under the terms of the Open Government Licence v3.0 except where otherwise stated. To view this licence, visit nationalarchives.gov.uk/doc/open-government-licence/version/3 or write to the Information Policy Team, The National Archives, Kew, London TW9 4DU, or email: psi@nationalarchives.gov.uk.
Where we have identified any third party copyright information you will need to obtain permission from the copyright holders concerned.
This publication is available at https://www.gov.uk/government/publications/psychotropic-drugs-and-people-with-learning-disabilities-or-autism/psychotropic-drugs-and-people-with-learning-disabilities-or-autism-results
1. Summary
The database we used gave data about good numbers of adults with learning disabilities and autistic children and young people. Children with learning disabilities and older autistic adults are less well covered.
2. Adults with learning disabilities
Antipsychotics
Antipsychotics were prescribed to 9.3% at ages 18 to 24, 14.6% at ages 25 to 44 and 23.7% at older ages. There was a trend of slight increase in prevalence over time, however, the prevalence at the first and the last quarter of the study were not significantly different from each other. The overall prescribing trend changed from an increasing to a decreasing one, following STOMP. Fewer than 40% of people prescribed antipsychotics had a record of psychosis and this proportion was falling.
Antidepressant
Antidepressant prescribing increased during the period. From 7.1% to 11.4 % at ages 18 to 24, from 15.6% to 19.8% at ages 25 to 44 and from 20.2% to 26.1% at older ages. The overall prescribing trend changed from an increasing to a nearly level one, following STOMP.
Anxiolytics
Anxiolytics were prescribed to 4.5% at ages 18 to 24, 9.1% at ages 25 to 44, and 11.6% at older ages. Ages specific rates did not change but the overall prescribing trend did: it was nearly level until the STOMP launch. Following this a falling trend was apparent.
Antiepileptics
Antiepileptics were prescribed to 17.3% at ages 18 to 24, 22.7% at ages 25 to 44. Rates in older groups rose from 25.4% to 30.9% in people aged 45 to 64 and from 20.6% to 26.8% in people aged 65 and older.
Around 82% of adults with learning disabilities prescribed antiepileptics were being prescribed one of the subgroup which also have antimanic properties (valproate, lamotrigine and carbamazepine). Use of these was slightly dropping in younger adults (aged 25 to 44) but increasing in the oldest group (age 65 and older).
3. Autistic children and young people
Antipsychotics
Antipsychotics were prescribed for fewer than 0.5% of autistic 0 to 9 year olds, 2.5% of autistic 10 to 17-year-olds and 5% of autistic 18 to 24-year-olds. There were no sustained trends over time.
Antidepressant
Antidepressant prescribing rose for autistic young people aged 10 to 17 (from 1.6% to 4.1%) and 18 to 24 (from 11.3% to 13.6%). Antidepressants were very rarely prescribed for autistic children aged under 10. There was no obvious change in the rising trends associated with the STOMP programme.
Anxiolytics
Anxiolytics were not prescribed sufficiently commonly in autistic children and young people for useful analysis with this dataset.
Antiepileptic
Antiepileptics were prescribed to just over 1% of autistic children aged under 10, to just over 2% aged 10 to 17 and to almost 4% of autistic people aged 18 to 24.
Rates of prescribing of hypnotics
Rates of prescribing of hypnotics rose sharply for both the 0 to 9 and the 10 to 17-year-old groups. Starting rates were 1.8% and 3.8% respectively. By the end of the period over 9% of both groups were prescribed hypnotics. The overall trends showed a steeper increase post-STOMP.
Rates of prescribing of CNS stimulants
Rates of prescribing of CNS stimulants to people aged under 18 rose steadily through the period.
Within-group polypharmacy
Prescribing patterns within-group polypharmacy were comparatively rare. Exceptions were antiepileptic prescribing (where it is a recognised strategy) and prescribing of antipsychotics to adults with learning disabilities. However, it was becoming less common in the latter. Trend in within-group polypharmacy for antidepressants in adults with learning disabilities changed from an increasing to a level trend following STOMP. For autistic children and young adults, within- group polypharmacy for antipsychotics showed a steeper increase following STOMP.
Between-group polypharmacy
Prescribing patterns between-group polypharmacy affects increasing numbers with increasing age for both people with learning disabilities and autistic people. For adults with learning disabilities the trend in the rate of multi-group prescribing reversed following the STOMP launch from one of slight increase to one of slight decrease. By contrast for autistic children and young people, between-group polypharmacy became steadily more common throughout the period involving 2% at the earliest reading and almost 5% at the latest.
High dose prescribing
High dose prescribing of individual antipsychotics affected 1.8% of adults with learning disabilities prescribed any antipsychotic. Combinations of antipsychotics cumulatively exceeding recommended doses were prescribed for 3.5%. This was more common for men and at older ages.
Inceptions and terminations
Each year 2.5% of adults with learning disabilities not taking an antipsychotic started doing so and each year 14.1% of people taking an antipsychotic stopped. 5.8% of people not taking an antidepressant started and 32.5% of people taking an antidepressant stopped. Corresponding figures for autistic children and young people were, for antipsychotics: 1.1% and 55.2%, and for antidepressants 2.9% and 73.3%
THIN database
Since 2015, the THIN database has lost almost two-thirds of the number of patients covered. Whilst the monitoring approach demonstrated is promising, it needs to be used on a database with stable patient numbers.
4. Study population
Patients in our groups for study spent 84,598,803 days registered with practices reporting data in the 8 years of the study period. This equates to an average daily population of 28,952 meeting the criteria for learning disabilities, autism or both.
Of these, 58.0% were recorded as having learning disabilities and 42.0% as having autism without learning disabilities. 15.4% of those recorded as having a learning disability were also recorded as being autistic. Out of the 53,585 distinct individuals, 7,523 were registered with the same practice throughout the period. The remainder appear to represent separate individuals registered with a practice for less than the whole period. This figure would double count individuals who moved from one participating practice to another.
Table 1: Daily average age, gender and diagnosis profile of people in the study group
| Age group | Learning disabilities | Learning disabilities | Autism but not learning disabilities | Autism but not learning disabilities | Proportion with learning disabilities also diagnosed with autism | Proportion with learning disabilities also diagnosed with autism |
|---|---|---|---|---|---|---|
| Female | Male | Female | Male | Female | Male | |
| 00 to 09 | 427 | 702 | 762 | 3308 | 11.7% | 25.8% |
| 10 to 17 | 676 | 1337 | 938 | 3718 | 18.9% | 38.7% |
| 18 to 24 | 880 | 1572 | 395 | 1546 | 16.8% | 33.0% |
| 25 to 44 | 2298 | 2956 | 263 | 818 | 7.6% | 17.4% |
| 45 to 64 | 2097 | 2494 | 100 | 256 | 4.1% | 9.3% |
| 65 and over | 642 | 692 | 10 | 33 | 1.9% | 3.9% |
| All ages | 7020 | 9753 | 2468 | 9679 | 8.5% | 20.4% |
Table 1 shows the average number of patients by age group, gender and diagnostic group across the whole period. 58.1% of people with learning disabilities were male, as were 79.7% of autistic people. The age bandings however were very uneven.
Figure 1 shows population pyramids for the 2 groups using more detailed (quinary) age bands. Both groups showed evidence of more incomplete diagnostic identification at some ages than others. The pattern is slightly complicated because the birth rate has fluctuated considerably over the last 2 decades. For people with learning disabilities, the most obvious feature is lower prevalence rates in the youngest age groups. This probably reflects diagnostic delay.
Prevalence rates fall in older age groups as well. In part, this may represent more incomplete diagnosis in individuals whose schooling preceded the regime of school assessment testing that started in the 1990s, but a substantial proportion of it probably reflects higher mortality rates at all ages. For autistic people, the most obvious gap is the rapidly falling numbers at age groups over 20. This is only plausibly explicable as very substantial under-diagnosis.
In the light of these patterns in the data available for study we decided to focus on autistic children and young adults (aged 0 to 24) and adults with learning disabilities (aged 18 and older).
Figure 1: Population pyramids for the 2 groups by quinary age bands

For those with learning disabilities, the most obvious feature is lower prevalence rates in the youngest age groups. For autistic people, the most obvious gap is the rapidly falling numbers at age groups over 20
The second major feature of the data source was that it was apparent that the number of active English practices providing data had fallen sharply during the period studied. This decline started in the second half of 2012 and continued throughout the rest of the period studied.
In our power analyses for the study, we had estimated that population groups of 6,000 would be sufficient to identify changes of +/- 15% from the assumed 17% baseline prevalence of prescribing for antipsychotics or antidepressants, with 95% confidence and 80% power. In the latest quarter of the current study data the sample numbers were just about adequate. However, the trend indicated that for future monitoring, the analysis should be transferred to an alternative general practice research database.
The quarterly average number of active patients with learning disabilities fell from 21,637 in quarter 1 of 2010, to 6,985 in quarter 4 of 2017, a loss of 68%. Corresponding numbers for autistic people were 12,547 in the first quarter of 2010 and 6,941 in the last quarter of 2017, a loss of 45%.
The difference in the scale of the losses is explained in Figures 2 and 3 which show the crude prevalence rates for the 2 diagnostic groups across the study period. The prevalence of learning disabilities was fairly steady at just under 0.6% throughout the study period. The prevalence of autism rose from 1.1% in the first quarter of 2010 to 1.6% in the third quarter of 2016, a rise of about 45%. Thereafter it stayed roughly level.
Figure 2: Prevalence of learning disabilities (aged 18 and over) in THIN, by study quarter.
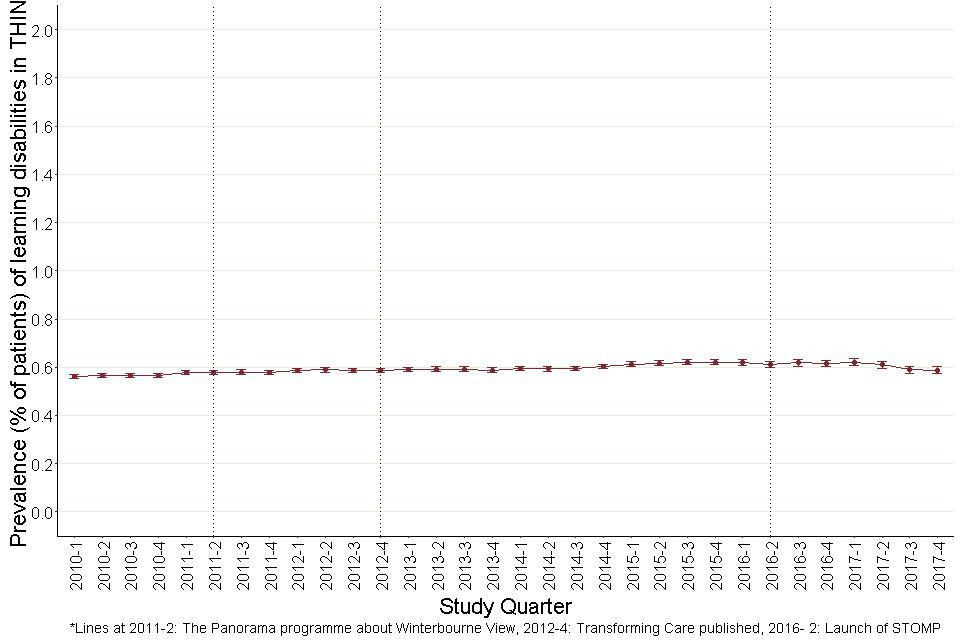
The prevalence of learning disabilities in adults remained more or less steady at 0.6% through the entire study period.
Figure 3: Prevalence of autism (aged 0 to 24) in THIN, by study quarter.
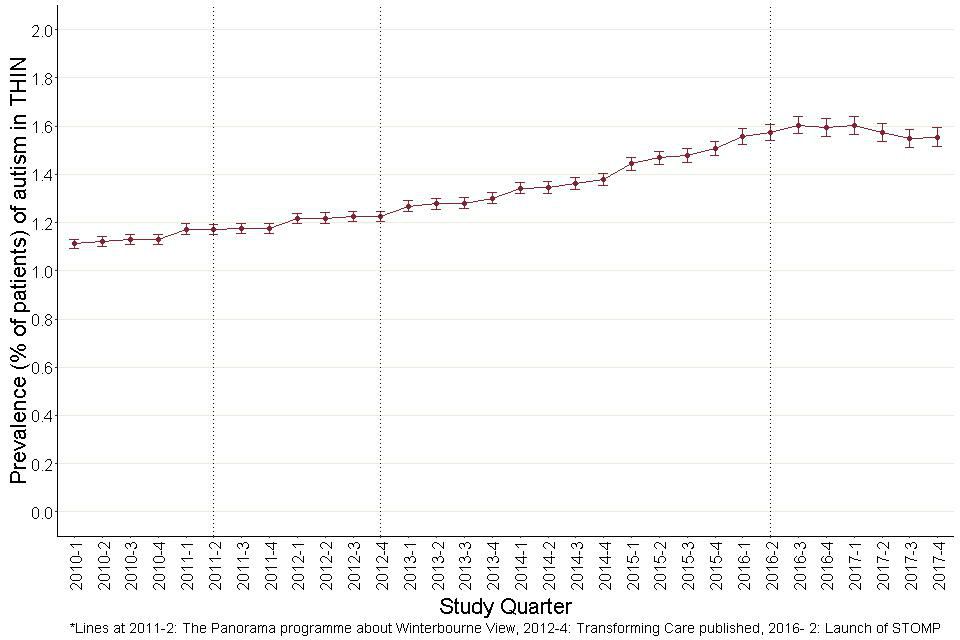
The prevalence of autism in children and young adults rises steadily throughout the study period. It was recorded at 1.1% in 2010- 1. Following 2012- 4, there was a steady rise up until 2013- 3, reaching a peak of 1.6% and then falling down to 1.5% in 2017- 4.
The result of this for the actual numbers of individuals across the age bands is shown in the next 3 figures. For clarity, Figure 4 shows population pyramids for the 2 groups in the first and final quarters of the study period. These are drawn on identical scales so the most obvious feature is the smaller size of the 2 for the later period, but the shapes are also different.
For autistic people without learning disabilities, there was a clear shift in the age profile of people aged under 25. Numbers (and rates of recorded diagnoses) under the age of 5 fell sharply, whilst the leading edge of the higher rates moved up from the 20 to 24 year, to the 25 to 29 year age band. This meant that, in the wider bandings we use for later analyses, in children and young people with recorded autism diagnoses aged under 25, there was an upward shift in age profile: at the start of the period 37% of people under age 10 were aged under 5 whilst at the end of the period only 12% were. Similar upward shifts were seen in the broader 10 to 17 and 18 to 24 age bands.
Figure 4: Population pyramids for the 2 groups in the first and final quarters of the study period.
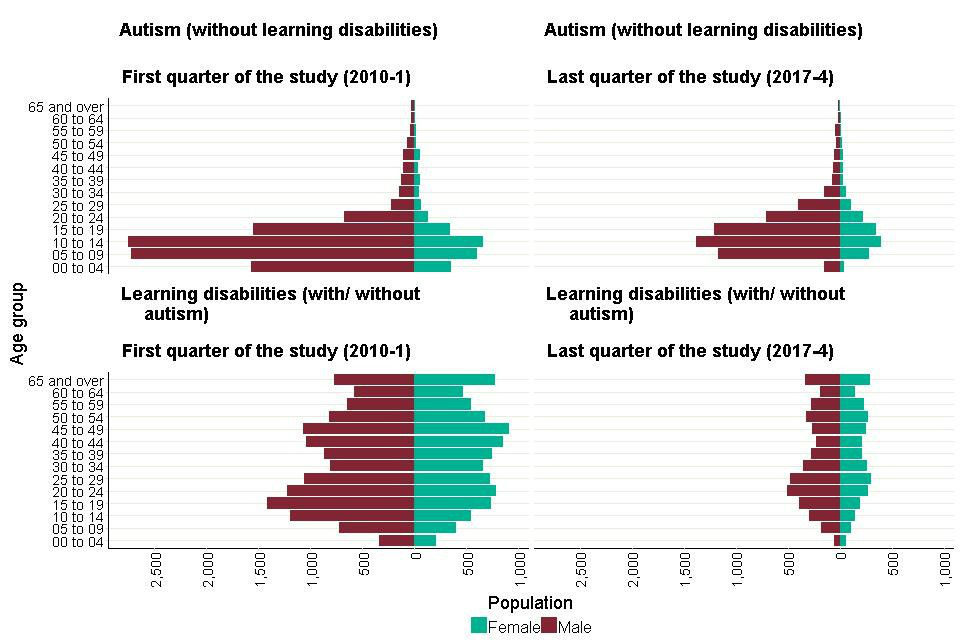
The most obvious feature is the smaller size of the 2 for the later period, but the shapes are also different. For those with autism but not learning disabilities.
Figures 5 (learning disabilities) and 6 (autism), show how all these trends in patient numbers developed over the course of the study period. The most obvious result of the falling numbers across the study period is that in the analyses that follow, confidence intervals widen for the more recent observations.
Figures 5 and 6 show one additional feature of the dataset seen in several other charts. For most of the questions we addressed, we chose to look at progress using quarter years as our time unit. Unfortunately, THIN does not allow calculation of patients’ ages precisely; years of birth are given but, for confidentiality reasons, not months or dates. Thus, we estimated ages assuming all patients to have been born at the mid-point of the year (3 July).
This is less noticeable in our learning disabilities calculations as the age bands are broader, so a smaller proportion of patients would have graduated up an age band each year. But with the autism analyses, an annual step pattern is apparent. This arises because in each year the early quarter figures overestimate both the numbers who have joined each age band from the band below and left for the band above. Where the total numbers in adjacent age bands are substantially different, this does not balance out resulting in the stepped pattern seen in Figure 6.
Figure 5: Average number of patients with learning disabilities (with and without autism) in each quarter from 2010-1 to 2017-4, by age groups.
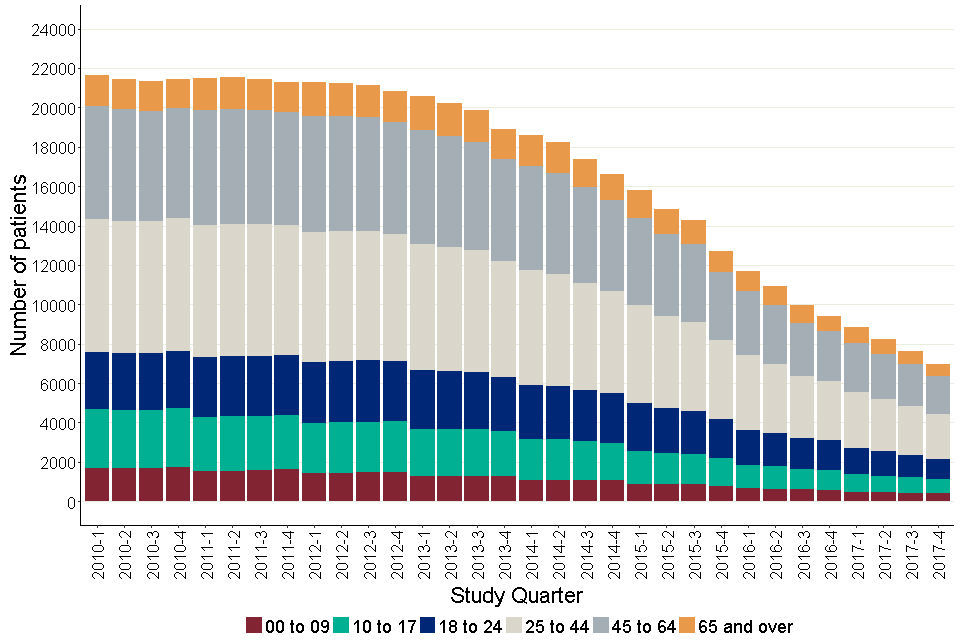
Age groups 25 to 44 and 45 to 64, showed a higher proportion of the total patients. The number of people with learning disabilities, had a more or less steady curve until the end of 2013, and then showed a steep downward trend.
Figure 6: Average number of autistic patients in each quarter from 2010-1 to 2017-4, by age groups
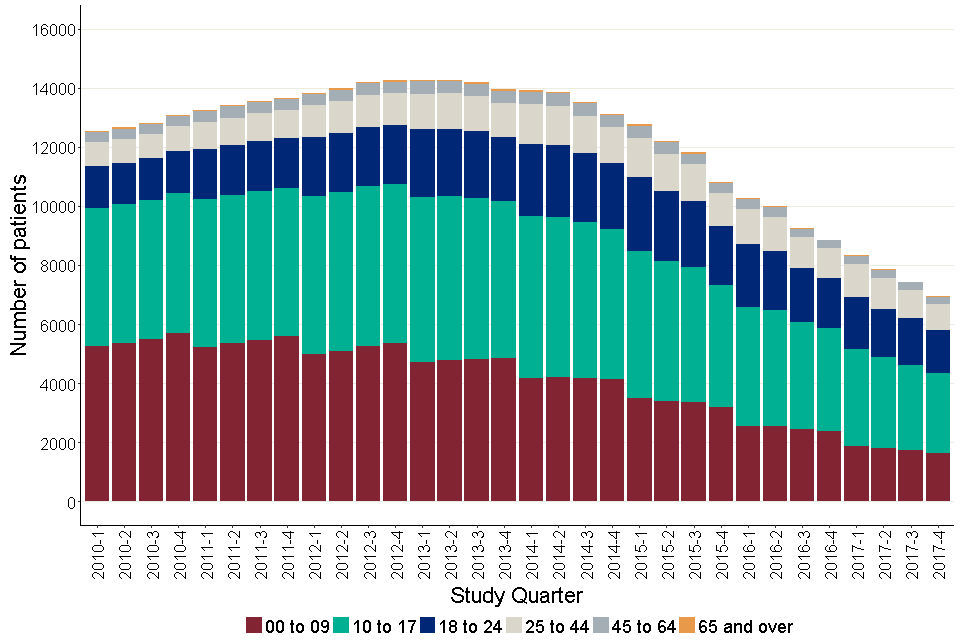
Age groups 00 to 09, 10 to 17 and 18 to 24 showed a higher proportion of the total patients. It showed a gradual rise up until 2013, and then showed a downward trend.
5. Prescription records
Full prescribing data, including the data from the free text field where used, was available for 64.5% of the prescription records for the patient and drug groups we were studying.
We compared the durations and dosages of prescriptions where full details were available with estimated durations and dosages using the method of dividing the total quantity prescribed by the interval between prescriptions. Dosages looked similar. We compared the dosages for the 3 most common drugs: sodium valproate, carbamazepine and risperidone.
The estimated doses were on average 71.3% of the definitive doses for risperidone, 63.5% for sodium valproate and 61.1% for carbamazepine. The average assumed duration of prescriptions for antipsychotics where this could only be estimated was higher than for prescriptions where it was clear (36 days vs 24 days, t- value= 455.1, p<0.0001). For antidepressants, the corresponding figures were 34 days and 25 days, t- value= 418.9, p<0.0001). 1.5% of prescriptions had to be omitted from analysis as we had neither full prescribing information nor a run of more than one prescription to allow estimation.
6. Prescribing rates
Table 2: Prescribing rates, as percentage of patients prescribed drugs to each of the drug groups, by gender and patient group
| Drug group | Learning disabilities (with or without autism)- aged 18 and over | Learning disabilities (with or without autism)- aged 18 and over | Autism (without learning disabilities)- aged 0 to 24 | Autism (without learning disabilities)- aged 0 to 24 |
|---|---|---|---|---|
| Female | Male | Female | Male | |
| Antipsychotics | 16.8 (15.8- 17.7) | 18.1 (17.3- 18.9) | 2.1 (1.5- 2.7) | 2.0 (1.7- 2.3) |
| All antidepressants | 22.6 (21.5- 23.6) | 15.1 (14.3- 15.8) | 6.21 (5.3- 7.3) | 2.7 (2.4- 3.11) |
| All antiepileptics | 23.8 (22.7- 24.9) | 22.9 (22.1- 23.9) | 2.8 (2.1- 3.6) | 1.7 (1.5- 2.1) |
| Anxiolytics | 10.2 (9.5- 11.1) | 9.0 (8.4- 9.6) | 0.7 (0.4- 1.1) | 0.2 (0.1- 0.3) |
| Hypnotics | 3.9 (3.5- 4.5) | 3.4 (3.0- 3.8) | 4.3 (3.5- 5.2) | 4.6 (4.2- 5.1) |
| CNS stimulants | 0.3 (0.2- 0.5) | 1.1 (0.9- 1.4) | 3.6 (2.9- 4.5) | 5.8 (5.3- 6.3) |
| Antimanics | 0.5 (0.4- 0.7) | 0.4 (0.3- 0.6) | - | - |
Table 2 shows the rate of prescriptions for all the drug groups. A table with full age and gender breakdown for both the disability groups is attached in the annex (Table 1 in annex). There were hardly any prescription records for antimanics and hence, we did not include this drug group for any further analysis. As mentioned earlier, for trends analysis, we focussed only on adults with learning disabilities, and autistic children and young adults. It is important to note that the rates shown are rates of prescription. The data does not tell us anything about compliance to taking the prescribed drugs.
6.1 Antipsychotics
Antipsychotics were prescribed to 17.5% of adults with learning disabilities.
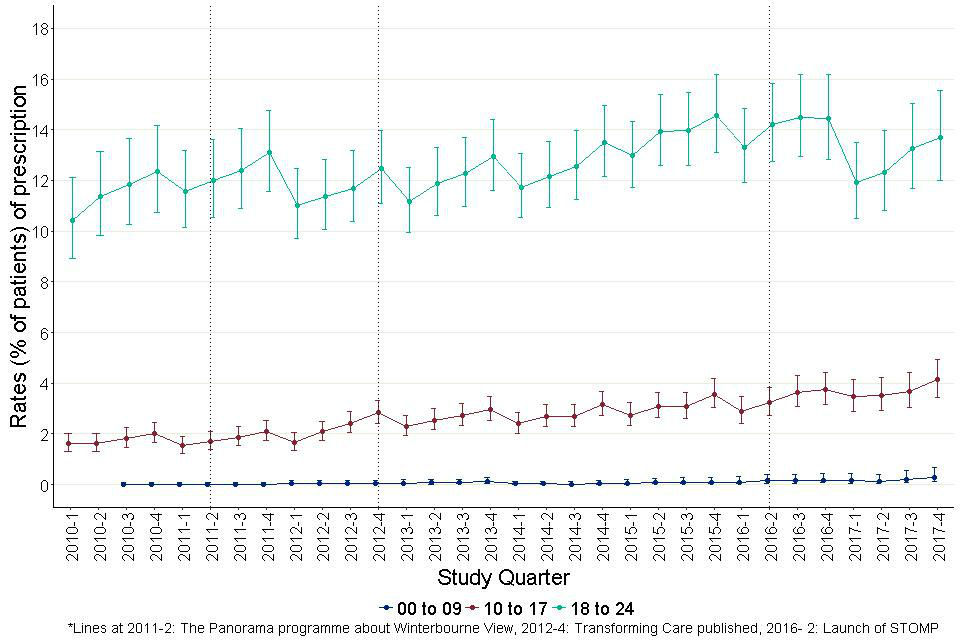
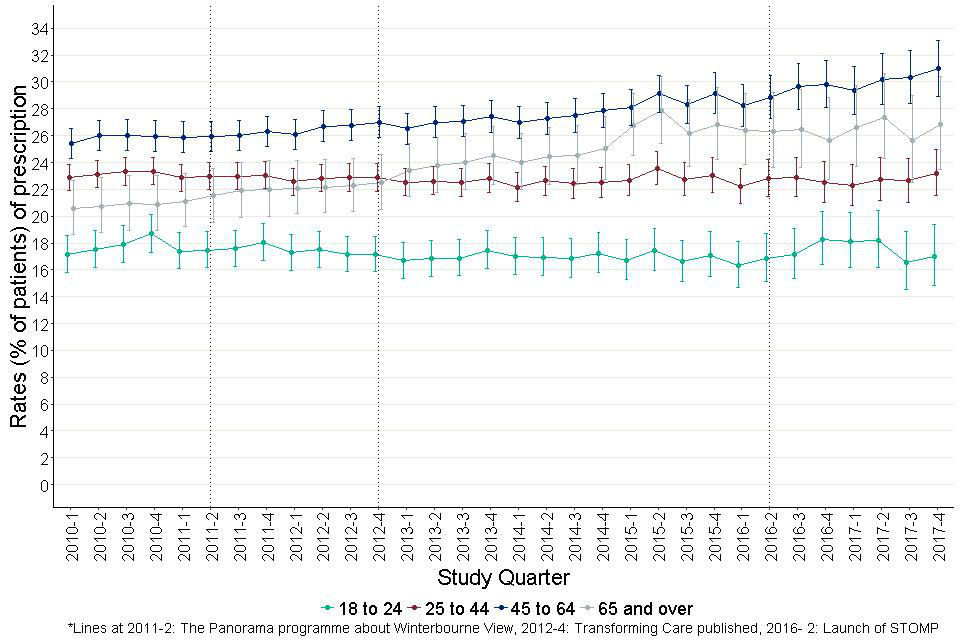
Figure 7 shows the quarterly prevalence of prescribing of antipsychotics for people with learning disabilities in 4 age bands.
The confidence interval bars around each point indicate the extent of change required to be statistically significant. There was a tendency for the rate in the youngest age group to rise over the period but the confidence intervals show this was not to a statistically significant extent. None of the other 3 groups appeared to change substantially.
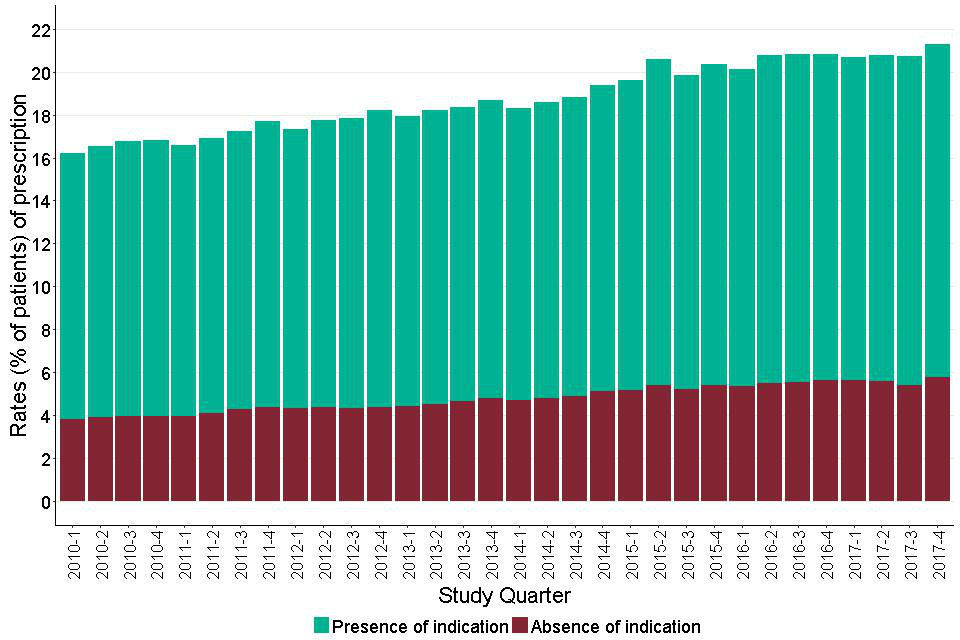
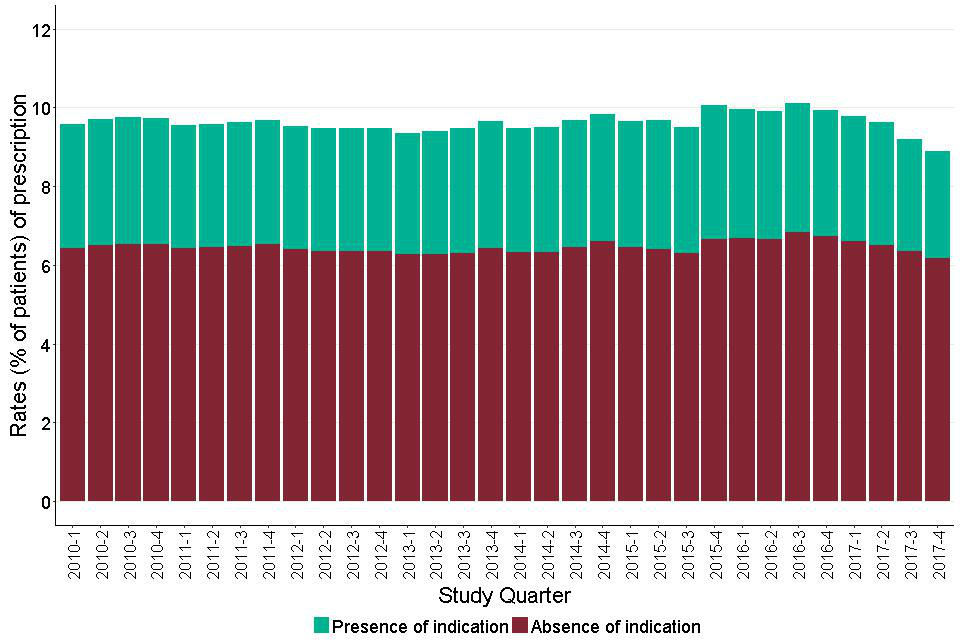
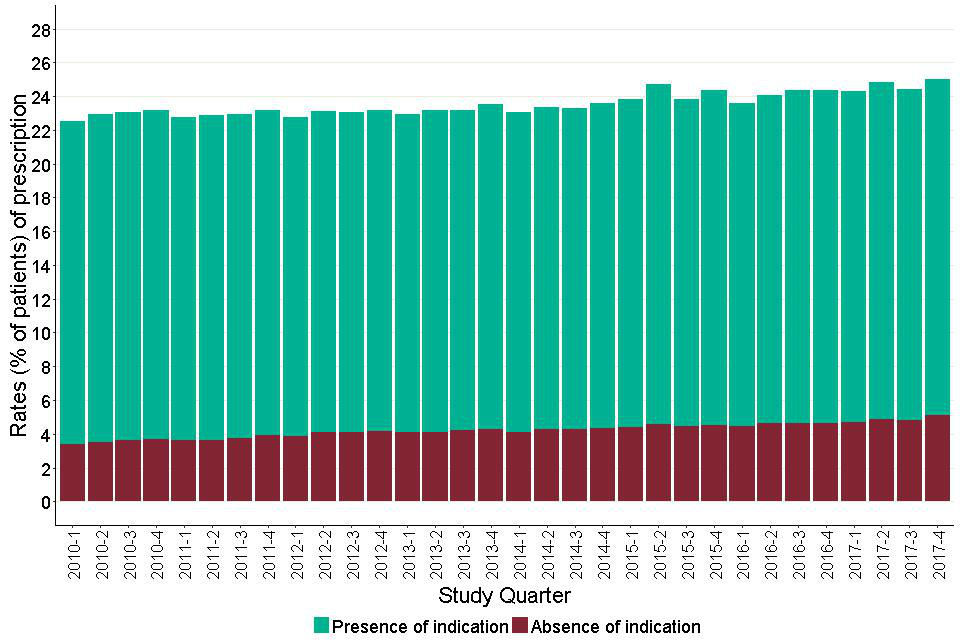
Figure 8 shows a bar chart of the overall quarterly prevalence of prescribing. Bars are split to show the amount of prescribing going to people with and without a recorded indication.
At the start of the period, 38.4% of people prescribed an antipsychotic were recorded as having one of the conditions we took as a recognised indication; 61.6% did not. By the end of the period, the proportion with a recognised indication had fallen to 33.3% (comparison of 2 proportions (z= -2.9, p<0.001).
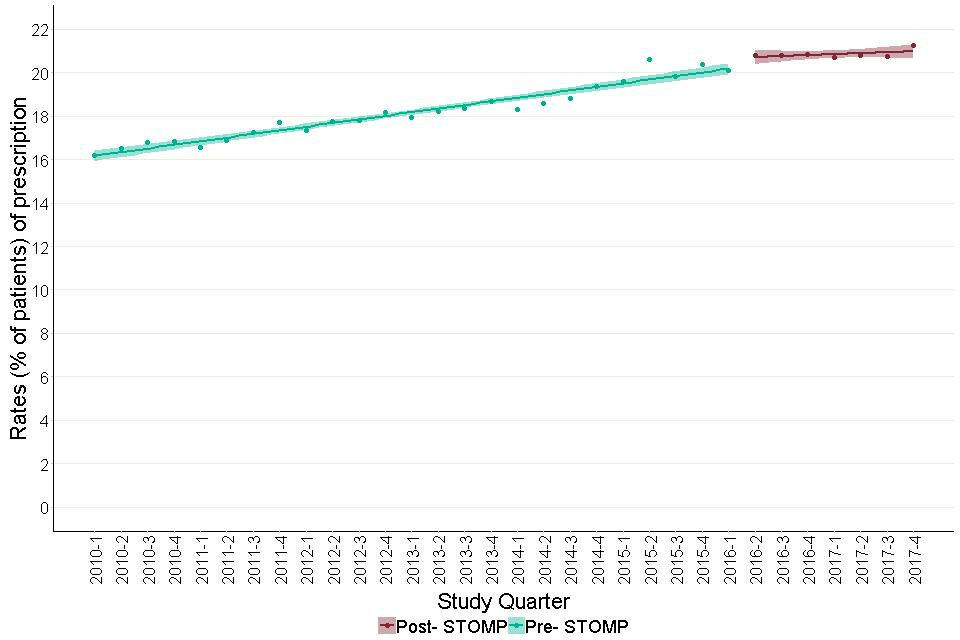
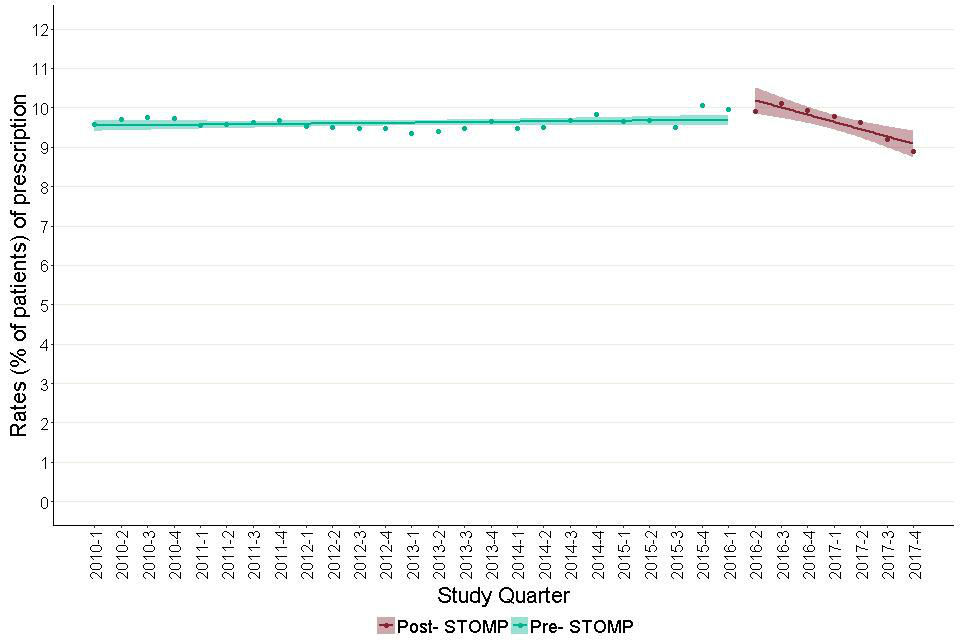
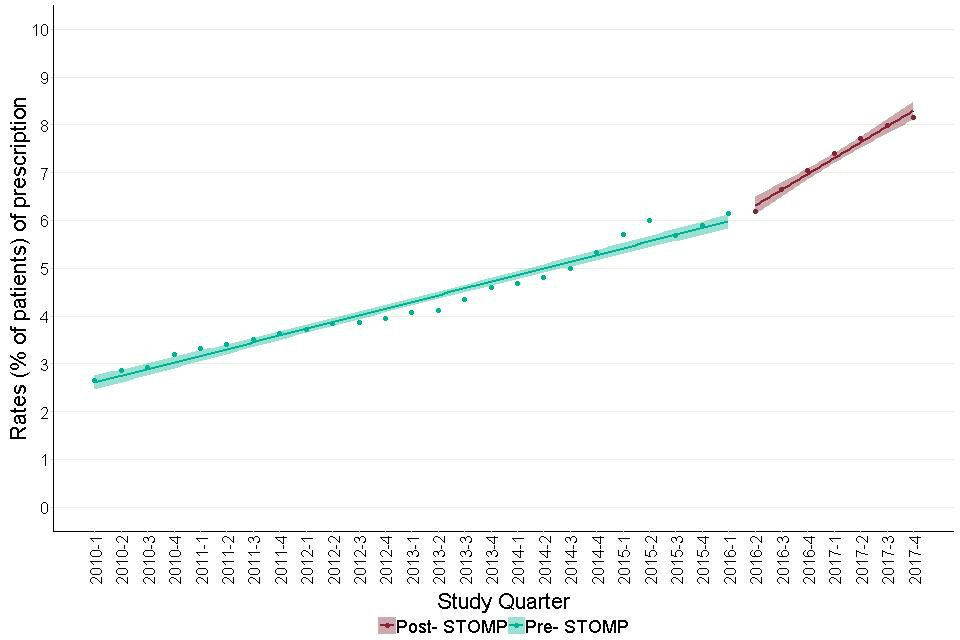
Figure 9 shows modelled estimates of the trend in antipsychotic prescribing in adults with learning disabilities, before and after the end of June 2016. The trend before June 2016, was positive (slope= 0.01, CI for slope= 0.00 to 0.03, t- statistic p- value= 0.08). Following June 2016, the trend was negative (slope= -0.10, CI for slope= -0.16 to -0.04, t- statistic p value= 0.02).
If these findings were representative of all the English GP learning disability registers, by the end of 2017 roughly 500 fewer adults with learning disabilities were being prescribed antipsychotics than would have been the case if pre-STOMP trends had persisted.
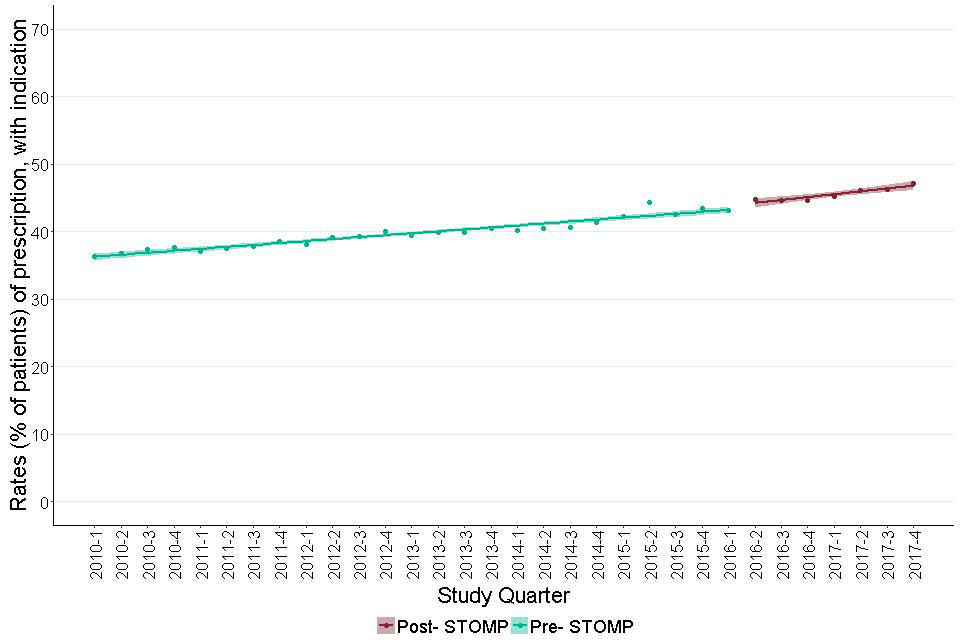
Figures 10a and 10b show modelled estimates of the trend in antipsychotic prescribing in adults with learning disabilities where a recognised indication is (Figure 10a) or is not (Figure 10b) recorded in their notes, before and after the end of June 2016, the launch of the STOMP programme. The prevalence of prescribing was naturally much higher for people with recorded indications, initially around 72%, and the trend before June 2016 was positive (slope= 0.05, CI for slope= 0.01 to 0.09, t- statistic p value= 0.05).
Following June 2016 the trend was negative (slope= -0.71, CI for slope= -0.96 to -0.46, t- statistic p value= 0.001). Moving the quarter taken as the STOMP launch point forwards or backward by a quarter made no substantial difference to the trends in either of the charts. The current prescribing rate was 4.4 percentage point below the extrapolated value of the earlier slope.
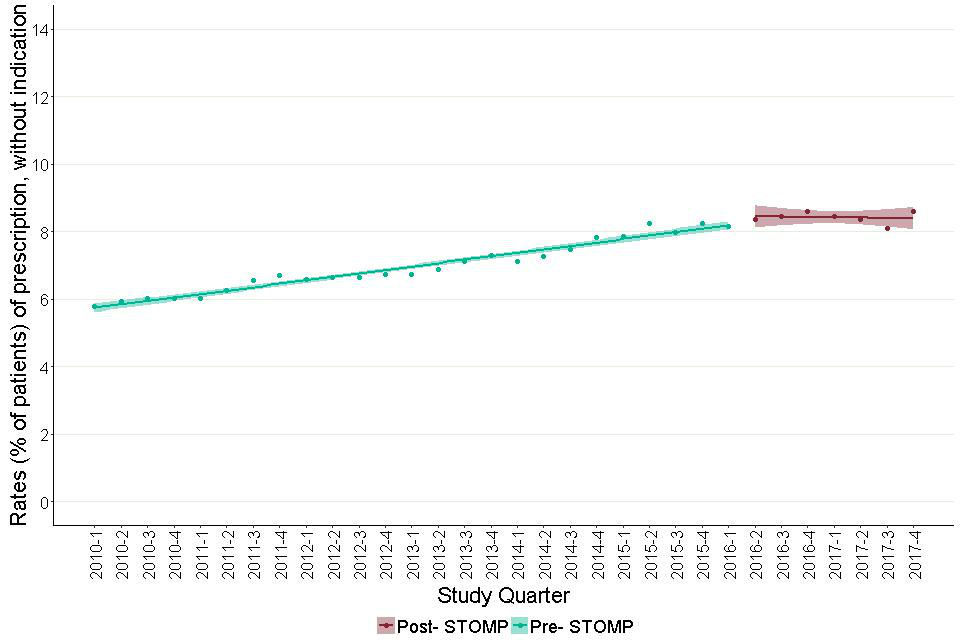
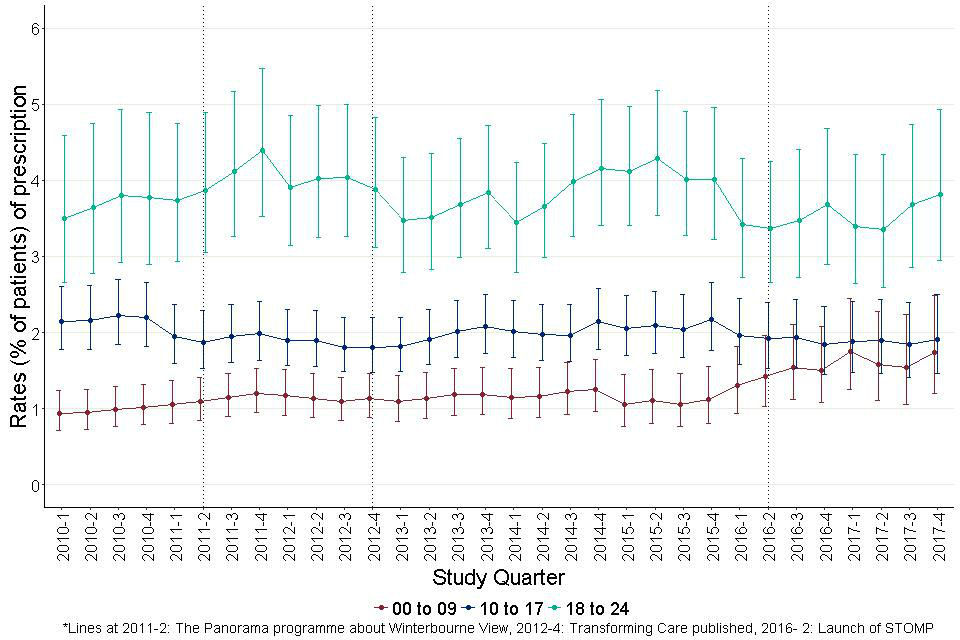
If this is representative of GP practices nationally, this would equate to roughly 900 fewer adults with learning disabilities who have a record of psychosis, prescribed an antipsychotic, than would have been expected had the earlier trend persisted. Figure 10b shows that by contrast, for people without records of indications, the trend in the prescribing rate was almost unchanged with the overall rate rising from just below 12% to nearly 13%. Antipsychotics were prescribed for 2.1% of autistic children and young people overall.
Figure 11 shows the quarterly prevalence of prescribing in 3 age bands. This varied sharply with age. Only 0.5% of autistic 0 to 9-year-olds had prescriptions, compared to 2.5% of autistic 10 to 17-year-olds and 5% of autistic 18 to 24-year-olds. There was no substantial or significant trend in any age group and there was no statistical difference in the trends before and after the launch of the STOMP programme.
Figure 7: Quarterly prescribing of antipsychotics for adults with learning disabilities by age group
The age bands are- 18 to 24, 25 to 44, 45 to 64 and 65 and over. There is a minor tendency for the rate for the youngest age group to rise over the period but the confidence intervals indicate that this is not statistically significant. None of the other 3 groups appears to change substantially.
Figure 8: Quarterly prescribing of antipsychotics for adults with learning disabilities showing people with and without recorded indication.
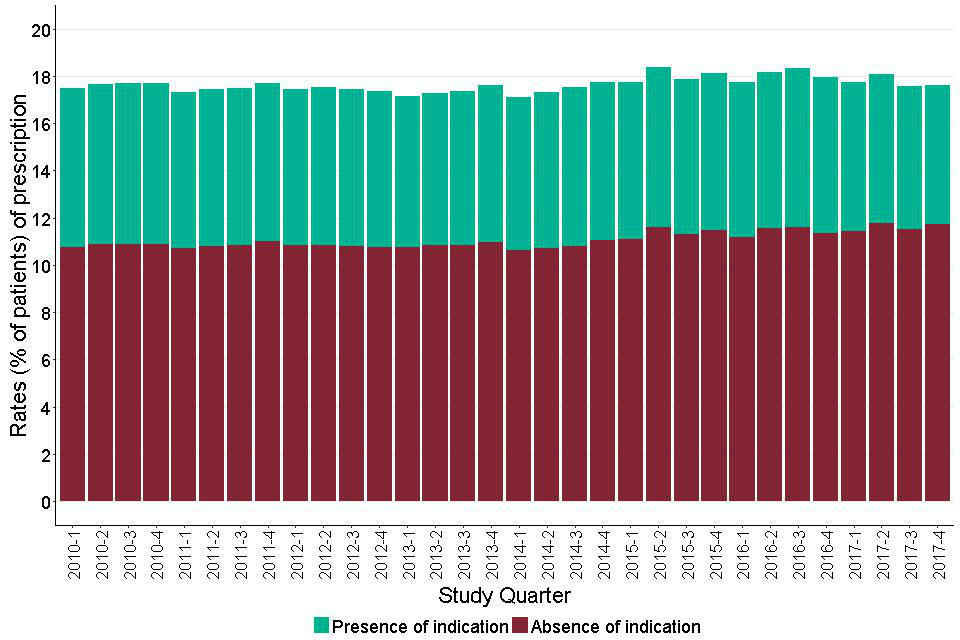
Shows the overall prevalence of prescribing in each quarter split between those with and those without a recorded indication. This shows that the overall prevalence remains reasonably steady at between 17 and 18 percent throughout the period.
Figure 9: Trends in prescription rates of antipsychotics for adults with learning disabilities, before and after June 2016.
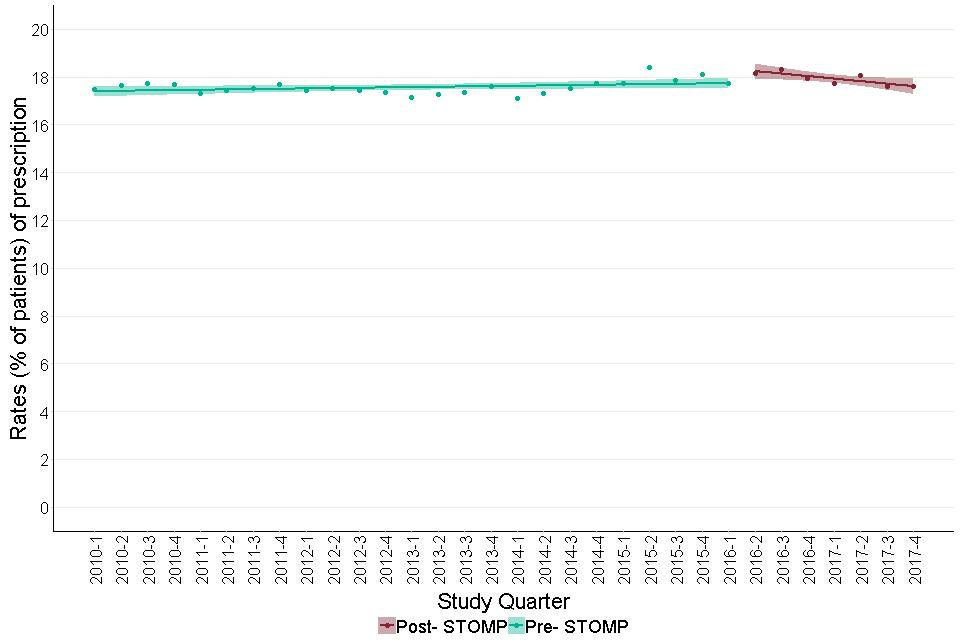
It shows modelled estimates in the trend of antipsychotic prescribing in adults with learning disabilities, before and after June 2016. The trend before June 2016 was positive. Following June 2016, the trend was negative.
Figure 10a: Trends in prescription rates of antipsychotics for adults with learning disabilities with a record of a recognised indication, before and after June 2016. This is a proportion of those with a recognised indication, prescribed an antipsychotic.
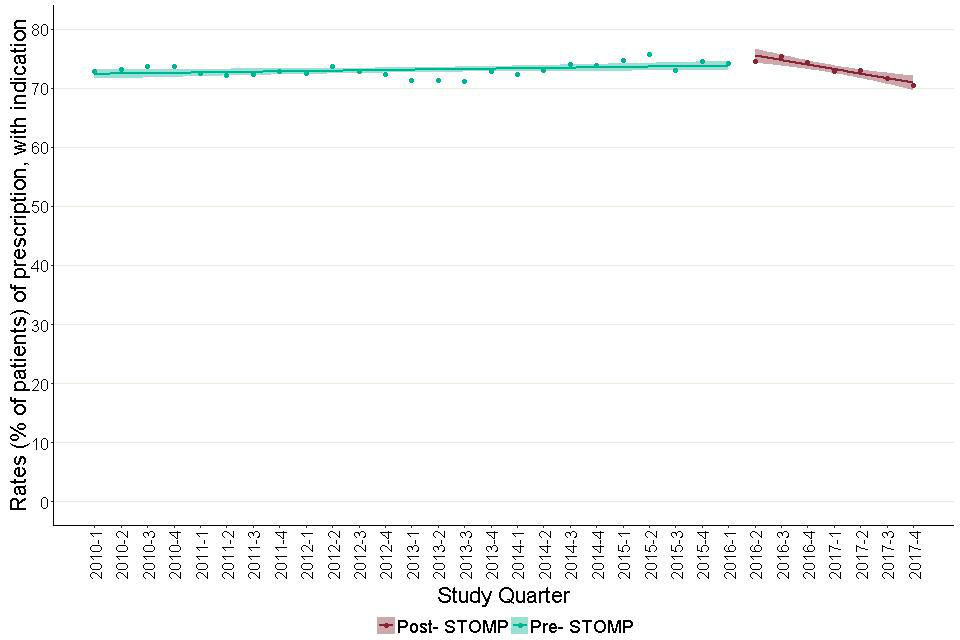
This is a proportion of those with a recognised indication, prescribed an antipsychotic. It shows a model estimate of the trend in antipsychotic prescribing in the presence of an indication in the period before and after the launch of the STOMP programme. This estimate showed a change in trend between the pre- STOMP and the post- STOMP period. The trend before the STOMP programme was nearly flat. The trend after shows a sharp decline.
Figure 10b: Trends in prescription rates of antipsychotics for adults with learning disabilities with no record of a recognised indication, before and after June 2016. This is a proportion of those without a recognised indication, prescribed an antipsychotic.
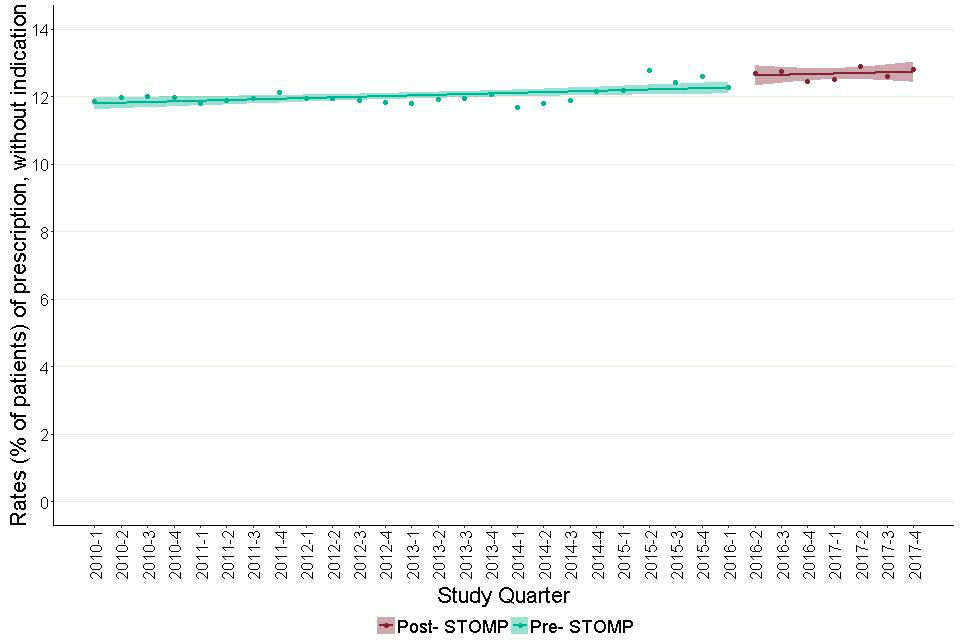
This is a proportion of those without a recognised indication, prescribed an antipsychotic. It shows that the trend in the prescribing rate was almost unchanged with the overall rate rising from just below 12% to nearly 13%.
Figure 11: Quarterly prescribing of antipsychotics for autistic children and young people (aged 0 to 24) by age group.
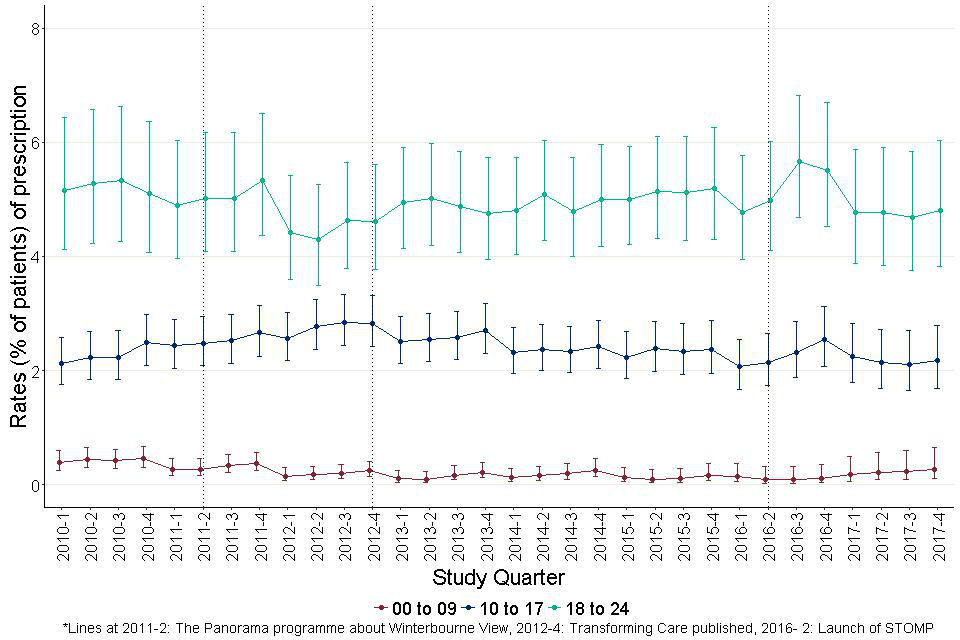
Three age bands, 0 to 9, 10 to 17 and 18 to 24. Throughout the study period, rates were around 5% at 18 to 24, 2.5% at 10 to 17 and less than 0.5% for 0 to 9. There was no substantial or significant trend in any age group.
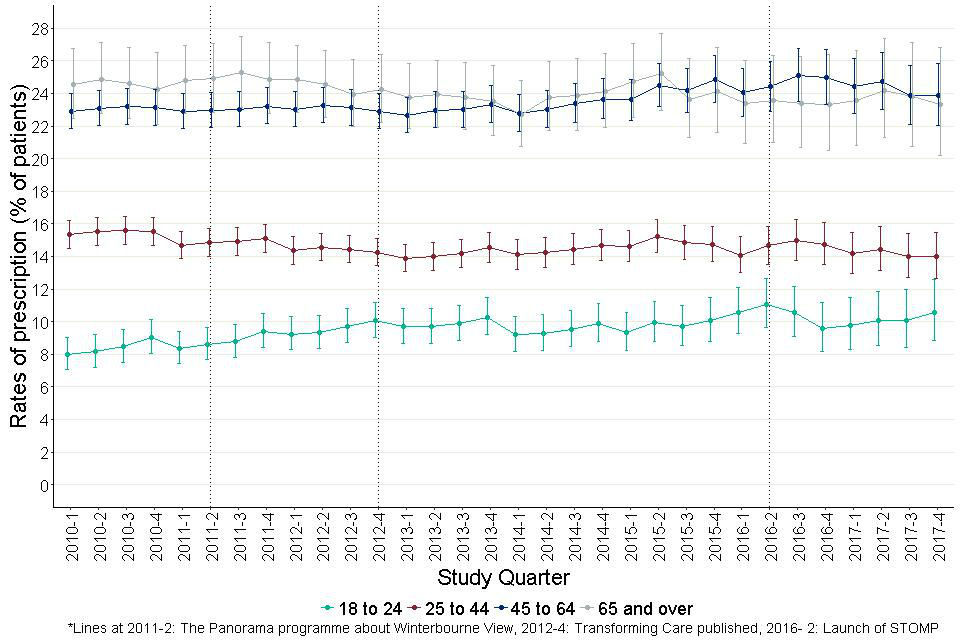
6.2 Antidepressants
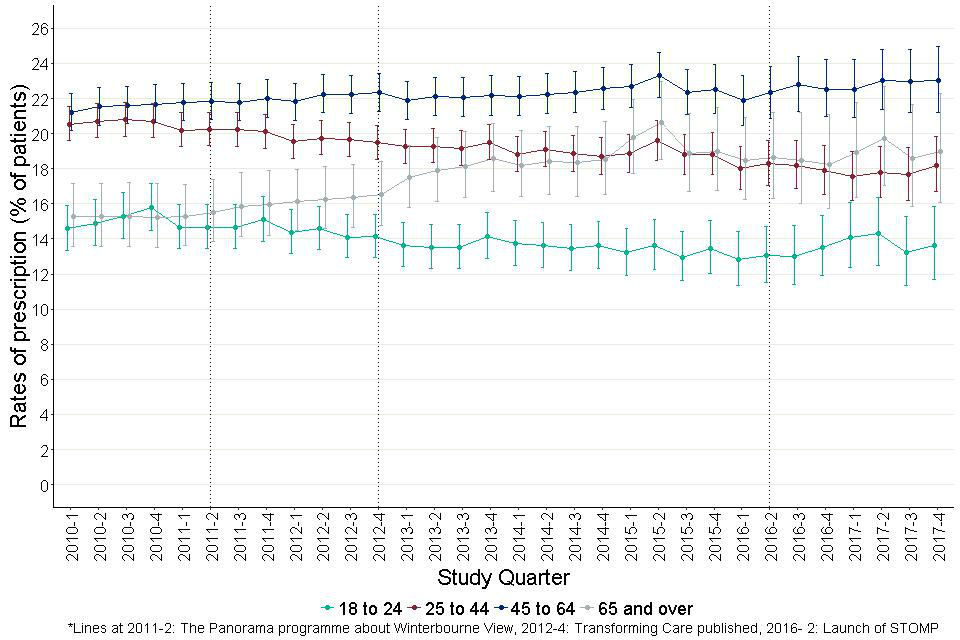
Antidepressants were prescribed for 18.3% of adults with learning disabilities; 22.5% for women and 15.4% for men. Figure 12 shows the quarterly prescribing prevalence in 4 age bands. Rates rose from 7.1% to 11.4% for people aged 18 to 24, from 15.6% to 19.8% for people aged 25 to 44 and from 20.2% to 26.1% for people in the older age groups, though for the oldest the change was not statistically significant.
Figure 13 shows a bar chart of the overall prevalence of prescribing in each quarter split between people with and without an indication. This shows that the overall prevalence rose steadily from 16.2% at the start of the period to 21.2% at the end (comparison of 2 proportions z=8.4, p<0.0001). The proportion of people prescribed antidepressants who had a record of a relevant indication was 76.4% at the start and 72.8% at the end of the period.
Figure 14 shows modelled estimates of the trend in antidepressant prescribing in adults with learning disabilities, before and after the end of June 2016. The trend before June 2016, was positive (slope= 0.16, CI for slope= 0.14 to 0.18, t- statistic p- value< 0.001). Following June 2016, there was no trend (slope= 0.04, CI for slope= -0.02 to 0.10, t- statistic p value= 0.2).
If these findings were representative of all the English GP learning disability registers, by the end of 2017 roughly 300 fewer adults with learning disabilities were being prescribed antidepressants than would have been the case if pre-STOMP trends had persisted.
Figures 15a and 15b show modelled estimates of the trend in antidepressant prescribing in adults with learning disabilities where a recognised indication is (Figure 15a) or is not (Figure15b) recorded in their notes, before and after the end of June 2016, the launch of the STOMP programme.
Figure 15a shows that for people with records of indications, the trend in the prescribing rate was rising. However, there were no significant changes to the trend, before and after June 2016. In contrast, the trend for prevalence of prescribing without a recorded indication, was positive before June 2016 (slope= 0.10, CI for slope= 0.09 to 0.11, t- statistic p value<0.002). Following June 2016, there was no trend (slope= -0.008, CI for slope= -0.07 to 0.05, t- statistic p value=0.8). The current prescribing rate was 0.3 percentage point below the extrapolated value of the earlier slope. If this is representative of GP practices nationally, this would equate to roughly 700 fewer adults with learning disabilities, without an indication of depression, prescribed an antidepressant, than would have been expected had the earlier trend persisted. Moving the quarter taken as the STOMP launch point forwards or backward by a quarter, made no substantial difference to trends in either of the charts.
Prescribing of antidepressants to autistic children and young people also showed an increase (Figure 16). Overall antidepressants were prescribed to 3.6% rising to 5.4% (comparison of 2 proportions z= 4.7, p<0.0001). However, these overall figures conceal big age-differences. There was almost no prescribing for children aged under 10 with the rate rising to from just under 2% to just over 4% in people aged 10 to 17 and from just under 12% to 13% in autistic people aged 18 to 24.
The ‘sawtooth’ appearance seen in the plots for the 2 older group in this chart reflect the combined effects of the rising prevalence with age and the necessity of estimating ages from only patients’ years of birth.
Trend analysis showed no significant difference in the rate of increase in prevalence between the pre-STOMP and post-STOMP periods, for prescribing of antidepressants for autistic people aged 0 to 24.
Figure 12: Quarterly prescribing of antidepressants for adults with learning disabilities by age group.
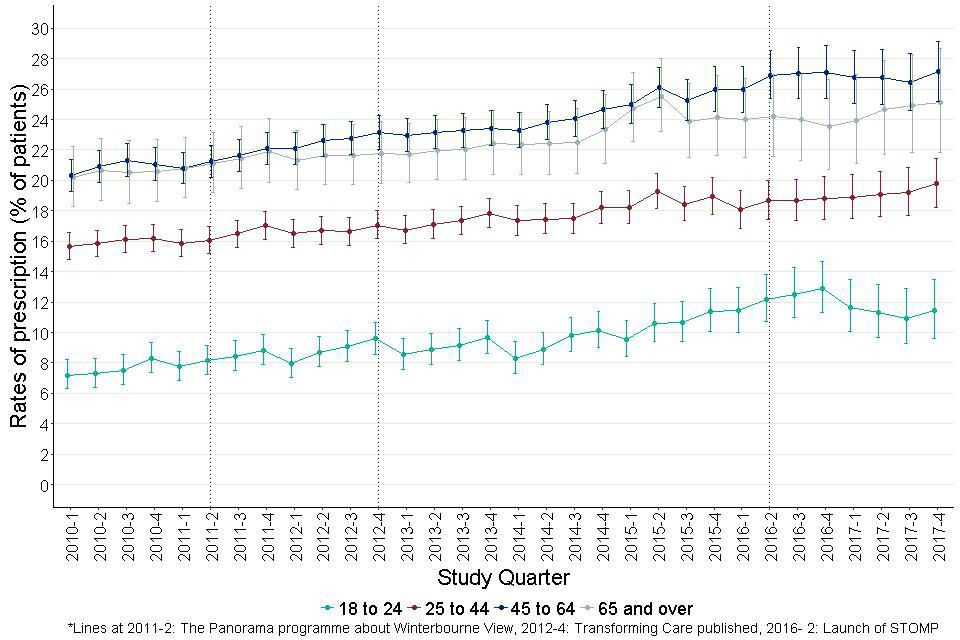
Figure 12: Quarterly prescribing of antidepressants for adults with learning disabilities by age group. Rates rose over the study period for the youngest 3 age groups (18 to 24, 25 to 44 and 45 to 64).
Figure 13: Quarterly prescribing of antidepressants for adults with learning disabilities showing people with and without recorded indication.
It shows a bar chart of the overall prevalence of prescribing in each quarter split between those with and those without an indication. This shows that the overall prevalence rises steadily throughout the study period.
Figure 14: Trends in prescription rates of antidepressants for adults with learning disabilities, before and after June 2016.
It shows modelled estimates of the trend in antidepressant prescribing in adults with learning disabilities, before and after the end of June 2016. The trend before June 2016, was positive. Following June 2016, there was no trend.
Figure 15a: Trends in prescription rates of antidepressants for adults with learning disabilities with a record of a recognised indication, before and after June 2016. This is a proportion of those with a recognised indication, prescribed an antidepressant.
This is a proportion of those with a recognised indication, prescribed an antidepressant. It shows a model estimate of the trend in antidepressant prescribing in the period before and after the launch of the STOMP programme. Both the periods showed an increasing trend.
Figure 15b: Trends in prescription rates of antidepressants for adults with learning disabilities with no record of a recognised indication, before and after June 2016. This is a proportion of those without a recognised indication, prescribed an antidepressant.
This is a proportion of those without a recognised indication, prescribed an antidepressant. It shows a model estimate of the trend in antidepressant prescribing in the period before and after the launch of the STOMP programme. The trend before STOMP showed a sharp rise while the post- STOMP slope was nearly flat or non- increasing.
Figure 16: Quarterly prescribing of antidepressants for autistic children and young people (aged 0 to 24) by age group.
There was almost no prescribing for children aged under 10 with the rate rising to from just under 2% to just over 4% in people aged 10 to 17 and from just under 12% to 13% in autistic people aged 18 to 24.
6.3 Anxiolytics
Anxiolytics were prescribed to 9.6% of adults with learning disabilities. Figure 17 shows the quarterly prevalence of prescribing in 4 age bands. At a first glance, the rate for the oldest group appeared to rise prior to June 2016 and the rates for the age groups 25 to 44 and 45 to 64 appeared to fall after June 2016 but none of these differences were statistically significant.
Figure 18 shows a bar chart of the overall prevalence of prescribing in each quarter split between people with and without an indication. This shows that the overall prevalence was between 8 and 10 percent throughout the study period. It was steady at around 9.5% up until the last quarter of 2014, plateaued for a year at around 10, and then fell over the next 5 quarters to 8.9%. Comparison of the first point on the plot (9.6%) with the last (8.9%) indicated these were not significantly different (comparison of 2 proportions z=-1.5, p- value=0.13).
Figure 19 shows modelled estimates of the trends in anxiolytic prescribing before and after June 2016. Before the launch of STOMP programme, the trend was nearly flat. After the launch it showed a sharp decline (Pre-STOMP trend: slope =0.01, CI for slope= 0.00 to 0.01, t-statistic p value= 0.18; post-STOMP slope =-0.18, CI for slope= -0.25 to -0.11, t statistic p value= 0.003). Moving the quarter taken as the STOMP launch point forwards or backwards by a quarter, made no substantial difference.
The final prescribing rate was 0.8 percentage points below the extrapolated value of the pre-STOMP slope. If these findings were representative of all the English GP learning disability registers, by the end of 2017 roughly 2,000 fewer adults with learning disabilities were being prescribed anxiolytics than would have been the case if pre-STOMP trends had persisted.
Anxiolytics were used very little for autistic children and young people. The overall prescribing rates were 0.3%. We did not consider this enough for useful analysis given the size of the dataset available.
Figure 17: Quarterly prescribing of anxiolytics for adults with learning disabilities by age group.
It shows the trend in prevalence of prescribing of anxiolytics for people with learning disabilities in 4 age bands: 18 to 24, 25 to 44, 45 to 64 and 65 and over.
Figure 18: Quarterly prescribing of anxiolytics for adults with learning disabilities showing people with and without recorded indications.
It shows a bar chart of the overall prevalence of prescribing in each quarter split between those with and those without an indication. This shows that the overall prevalence was between 8 and 10 percent throughout the study period.
Figure 19: Trends in prescription rates of anxiolytics for adults with learning disabilities before and after June 2016.
It shows a model estimate of the trend in anxiolytic prescribing in the period before and after the launch of the STOMP programme. The trend before the STOMP programme was nearly flat. The trend after shows a sharp decline.
6.4 Antiepileptics
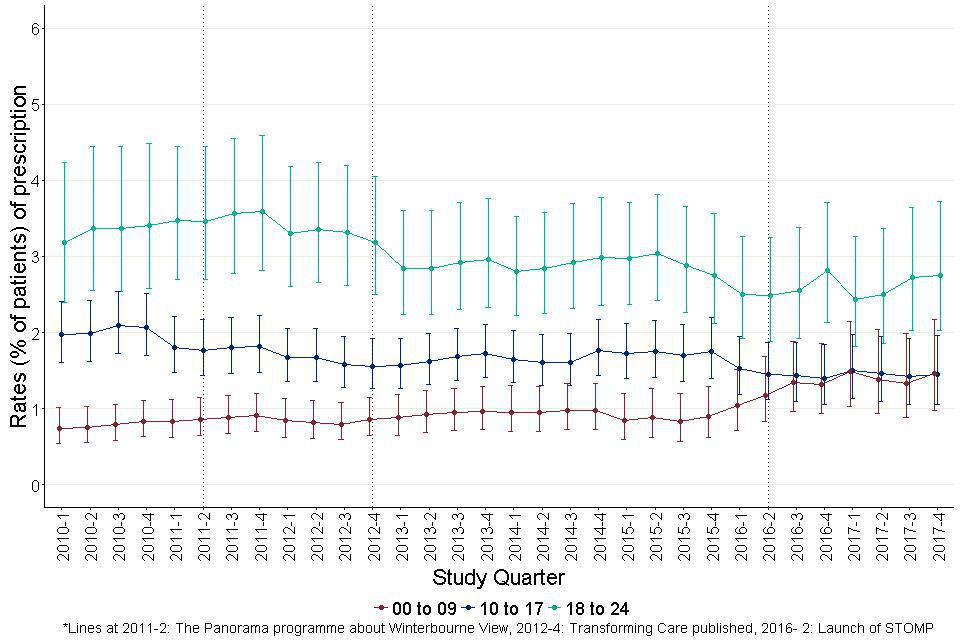
The overall prevalence of prescribing some type of antiepileptic drugs for adults with learning disabilities was 23.3%. Figure 20 shows the quarterly prevalence in 4 age bands. The 2 older age groups showed rises, the 2 younger ones did not. The rate for people aged 18 to 24 remained steadily around 17%, that for people aged 25 to 44 around 23%. The rate for people aged 45 to 64 rose from 25.4% to 30.9% (comparison of 2 proportions- z=4.7, p<0.001), that for people aged 65 and older rose from 20.6% to 26.8% (comparison for 2 proportions- z=3.1, p<0.001).
Figure 21 shows the quarterly overall prevalence of prescribing split to show the proportion of prescriptions to people with a record of an indication. The only indication considered in this instance was epilepsy. The overall prescribing prevalence rose from 22.6% to 25.0% (difference in proportions z = 3.8, p<0.001).
At the start of the period, 84.9% of people prescribed an antiepileptic were recorded as having a recognised indication of epilepsy; 15.1% did not. By the end of the period, the proportion with a recognised indication had fallen to 79.6% (comparison of 2 proportions- z= -4.6, p<0.001)
Modelled estimates of the trend in prescribing of antiepileptics showed no significant change between the periods before and after the launch of the STOMP programme.
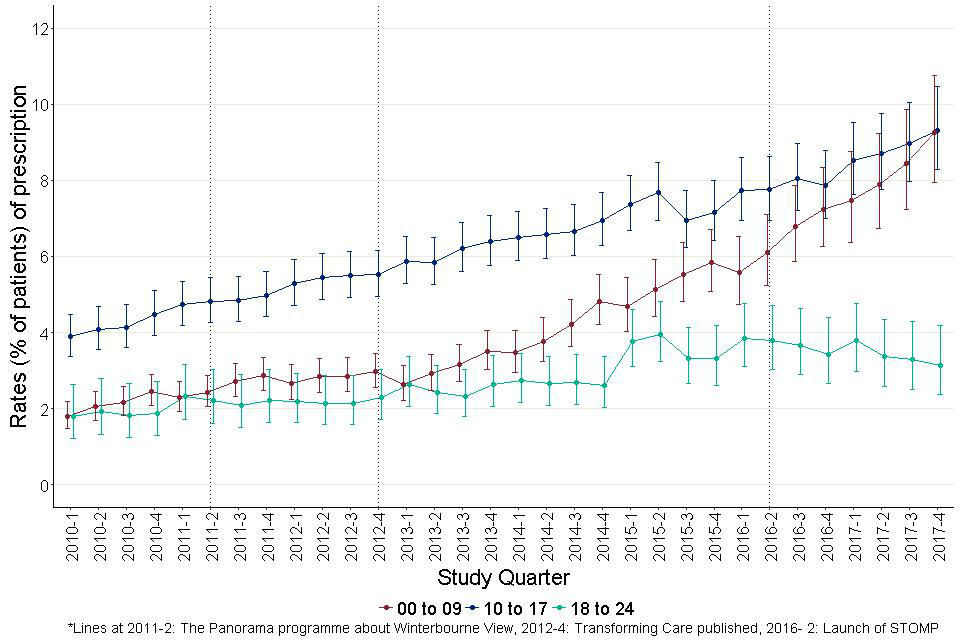
For autistic children and young people, the overall prevalence of prescribing of antiepileptics was 1.9%. Figure 22 shows that, as for other drugs there were sharp differences by age group. The rate for people aged 0 to 9 was between 1% and 1.5%. It showed a tendency to rise in the 2 most recent years but the movement was not statistically significant. Rates for people aged 10 to 17 and 18 to 24 were more or less steady at around 2% and 3.8% respectively.
Figure 20: Quarterly prescribing of all antiepileptics for adults with learning disabilities by age group.
It shows the trend in prevalence of prescribing of antiepileptics for people with learning disabilities in 4 age bands. The 2 older age groups showed rises, the 2 younger ones did not.
Figure 21: Quarterly prescribing of all antiepileptics for adults with learning disabilities showing people with and without recorded indication.
It shows a bar chart of the overall prevalence of prescribing in each quarter split between those with and those without an indication. This shows that the overall prevalence shows a steady rise throughout the study period.
Figure 22: Quarterly prescribing of all antiepileptics for autistic children and young people (aged 0 to 24) by age group.
There is a tendency for the rate of those aged 0 to 9, to rise over the study period but the confidence intervals indicate that this is not statistically significant. Neither of the other 2 groups appear to change substantially.
Figure 23 shows the quarterly prescribing prevalence for adults with learning disabilities for the subgroup of antiepileptics that have antimanic properties (valproate, carbamazepine and lamotrigine).
Figure 24 shows the quarterly overall level, distinguishing the subset where the patient concerned had a recorded diagnosis, in this case of either epilepsy or a bipolar disorder.
Figure 24 shows that the overall level stayed the same, but Figure 23 shows that there was some tendency for the rates to fall in people aged 25 to 44 and rise in people aged 65 and older. Figure 24 shows the profile of recorded diagnoses.
The largest group (85.3% on average) had recorded diagnoses of epilepsy. About 4.1% had diagnoses of bipolar disorder without epilepsy and a smaller group, 2.4% had both diagnoses. Consistently about 10% had neither diagnosis recorded.
Modelled analysis of the trends in overall prescribing of this group of drugs showed a fairly level trend. The trends in the periods before and after the launch of STOMP were similar (Pre-STOMP: slope= 0.05, CI for slope= 0.03 to 0.07, t- statistic p value<0.001; post- STOMP: slope= 0.12, CI for slope=0.04 to 0.20, t- statistic p value=0.03).
Figure 25 shows the quarterly prevalence of prescribing of antiepileptics with antimanic properties for autistic children and young adults in the usual 3 age groups. For the youngest group the rate tended to rise particularly in the last 2 years of the period; for the oldest group there was a slight fall at the end of the second year, but neither change reached statistical significance.
Figure 23: Quarterly prescribing of antiepileptics with antimanic properties for adults with learning disabilities by age group.
There is a minor tendency for the rate of those aged 25 to 44, to fall through the study period but the confidence intervals indicate this is not statistically significant.
Figure 24: Quarterly prescribing of antiepileptics with antimanic properties for adults with learning disabilities by recorded indications.
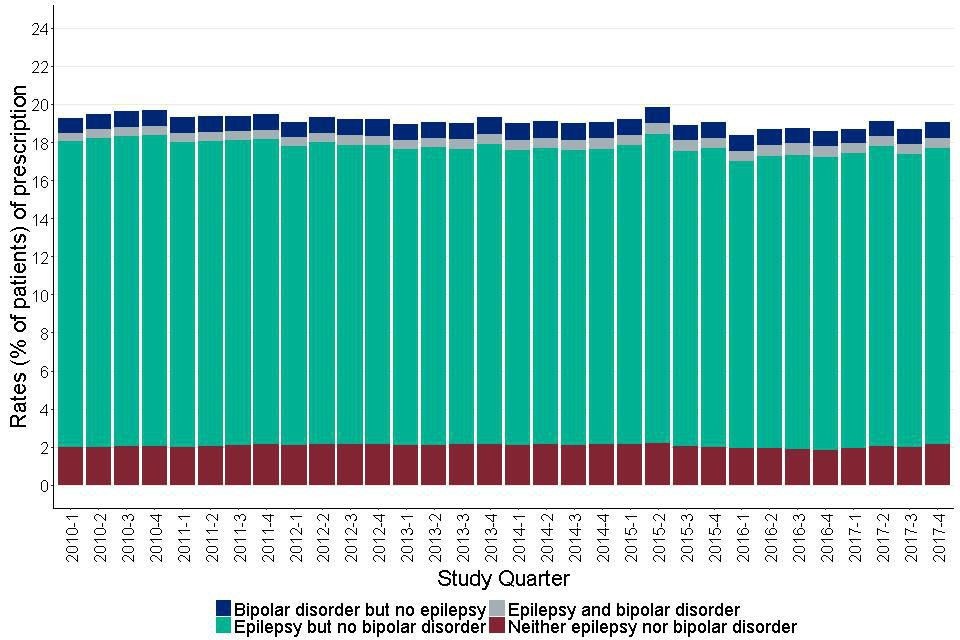
It shows a bar chart of the overall prevalence of prescribing in each quarter split between indication combinations for epilepsy and bipolar disorder. This shows that the overall prevalence remained reasonably steady at between 18 and 20, with around 85% of those prescribed, having an indication for epilepsy.
Figure 25: Quarterly prescribing of antiepileptics with antimanic properties for autistic children and young people (aged 0 to 24) by age group.
For the youngest group the rate tended to rise particularly in the last 2 years of the period; for the oldest group there was a slight fall at the end of the second year, but neither change reached statistical significance.
Prescribing of hypnotics and CNS stimulants were rare in adults with learning disabilities (3.6% for hypnotics and 0.8% for CNS stimulants). Hence, we focussed only on autistic children and young adults for these 2 drug groups.
6.5 Hypnotics
Overall 4.6% of autistic children and young people were prescribed hypnotics, but the pattern of this over time was very striking. The quarterly rate (Figure 26) for people aged 18 to 24 stayed fairly level at a little between 2% and 4%, although with a slight step up in the last 3 years.
The rates for the 2 younger age groups showed sustained increases throughout the period. Initially, the rates were 1.8% for people aged 0 to 9 and 3.8% for people aged 10 to 17. The rate for the younger group rose more sharply so that by the end of the period it was over 9% for both groups.
Figure 27 shows modelled estimates of the trends in hypnotic prescribing before and after June 2016. Both the pre-STOMP (slope= 0.14, CI for slope= 0.13 to 0.15, t- statistic p value<0.002) and the post- STOMP (slope= 0.22, CI for slope= 0.20 to 0.24, t- statistic p- value<0.001) periods showed positive trends, however, it was much steeper post- STOMP.
Figure 26: Quarterly prescribing of hypnotics for autistic children and young adults (aged 0 to 24) by age group.
The rates for the 2 younger age groups showed sustained increases throughout the period. Initially the rates were 1.8% for people aged 0 to 9 and 3.8% for people aged 10 to 17. The rate for the younger group rose more sharply so that by the end of the period it was over 9% for both groups.
Figure 27: Trends in prescription rates of hypnotics for children and young adults with autism before and after June 2016.
It shows modelled estimates of the trends in hypnotic prescribing before and after June 2016. Both the pre- STOMP and the post- STOMP periods showed positive trends, however, it was much steeper post- STOMP.
6.6 CNS stimulants and drugs used for ADHD
For autistic children and young people, the overall rate was 5.3%. The rate was highest in people aged 10 to 17.
For the youngest group it was initially lower than for people aged 18 to 24 but rose at a faster rate through the period (Figure 28). In the final quarterly reading, for the first time the rates for people aged 0 to 9 (4.7%) was higher than that for people aged 18 to 24 (4.2%) (although the confidence intervals overlapped substantially).
The overall trend for the period went upwards. The slopes before (slope= 0.07, CI for slope= 0.06 to 0.08, t- statistic p value<0.001) and after (slope= 0.07, CI for slope= 0.03 to 0.11, t- statistic p value= 0.03) the STOMP launch did not differ significantly.
Figure 28: Quarterly prescribing of CNS stimulants and drugs used for ADHD, for autistic children and young people (aged 0 to 24) by age group.
It shows the trends in prevalence of prescribing of CNS stimulants and drugs used for ADHD, for children and young adults with autism in 3 age bands. The highest prescribing rates were recorded in those aged 10 to 17.
7. Prescribing patterns: Within-group polypharmacy
We have taken ‘within-group polypharmacy’ to mean simultaneous prescribing of more than one agent from a single group. Table 3 shows the extent of this for each of the groups we studied.
For most groups it was unusual. The obvious exception to this was antiepileptics. In this case use of multiple drugs is a recognised therapeutic strategy. It was almost negligible for hypnotics and CNS stimulants. However, for more than 4% of adults with learning disabilities being prescribed antidepressants or anxiolytics, more than one agent was being prescribed. In the case of antipsychotics, this figure was 9.7%.
Among autistic children and young people, within-group polypharmacy was seen in 3.3% of people prescribed antidepressants. Where a single drug agent (for example flupentixol) was prescribed for both oral and depot injectable administration this was not counted as within-group polypharmacy.
Table 3: Percentages of within-group polypharmacy, by drug group, gender and patient group
| Drug group | Learning disabilities (with or without autism)- aged 18 and over | Learning disabilities (with or without autism)- aged 18 and over | Autism (without learning disabilities)- aged 0 to 24 | Autism (without learning disabilities)- aged 0 to 24 |
|---|---|---|---|---|
| Female | Male | Female | Male | |
| Antipsychotics | 9.2 (7.5- 11.1) | 10.3 (8.8- 12.1) | 2.4 (0.4- 12.3) | 1.2 (0.3- 4.1) |
| Antidepressants | 7.4 (6.1- 8.9) | 4.4 (3.4- 5.7) | 3.9 (1.7- 8.9) | 2.9 (1.4- 6.0) |
| All Antiepileptics | 40.0 (37.5- 42.6) | 37.8 (35.5- 40.1) | 21.8 (12.9- 34.3) | 16.9 (11.7- 23.7) |
| Anxiolytics | 4.5 (3.1- 6.4) | 4.3 (3.0- 6.1) | - | - |
| Hypnotics | 2.2 (0.9- 4.9) | 1.9 (0.8- 4.4) | - | - |
| CNS Stimulants | - | 2.3 (0.6- 8.1) | 1.3 (0.2- 7.1) | 4.0 (2.6- 6.1) |
Figure 29 shows the quarterly pattern of within-group polypharmacy of antipsychotics in adults with learning disabilities. There was a steady fall from 11.7% to 7.8% through the study period (comparison for 2 proportions- z=-3.5, p<0.001). Modelled estimates of the trends before (slope= -0.12, CI for slope= -0.13 to -0.11, t-statistic p value< 0.002) and after (slope=-0.6, CI for slope= -0.20 to 0.08, t-statistic p value= 0.3) the launch of the STOMP programme showed no substantial or significant change.
Figure 30 shows modelled estimates for the trends in prescribing more than one antidepressant before and after the launch of the STOMP programme. The trend before June 2016, was positive (slope= 0.04, CI for slope= 0.02 to 0.06, t- statistic p- value= 0.003). Following June 2016, there was no trend (slope= -0.04, CI for slope= -0.08 to 0.01, t- statistic p value= 0.14). A similar analysis was done in respect of antiepileptics. This showed no appreciable change throughout the period.
Figure 31 shows modelled estimates for the trends in prescribing of antipsychotics before and after the launch of the STOMP programme, in children and young adults with autism. Both the pre-STOMP (slope= 0.26, CI for slope= 0.18 to 0.32, t- statistic p value<0.003) and the post- STOMP (slope= 0.40, CI for slope= 0.34 to 0.46, t- statistic p value=0.06) periods showed positive slopes, however, the slope was much steeper post STOMP.
An alternative measure of within-group polypharmacy is the average number of different agents in a group prescribed for individuals receiving any. Ideally this should usually be 1.
In the period we examined, for adults with learning disabilities the figures were 1.11 for antipsychotics, 1.07 for antidepressants and 1.58 for antiepileptics, 1.05 for anxiolytics, 1.03 for hypnotics and 1.04 for CNS stimulants. Corresponding figures for autistic children and young adults were 1.03 for antipsychotics, 1.04 for antidepressants and 1.24 for antiepileptics, 1.02 for anxiolytics, 1.0 for hypnotics and 1.04 for CNS stimulants.
Figure 29: Within-group polypharmacy: Antipsychotics in adult patients with learning disabilities. Chart shows the quarterly proportion of adult patients with learning disabilities prescribed antipsychotics who were prescribed more than one antipsychotic agent.
Shows the quarterly proportion of adult patients with learning disabilities prescribed antipsychotics who were prescribed more than one antipsychotic agent. Shows a steady fall in the rate of prescribing of more than one antipsychotic over the study period.
Figure 30: Trends in proportion of adult patients with learning disabilities prescribed antidepressants who were prescribed more than one antidepressant agent, before and after June 2016.
It shows modelled estimates for the trends in prescribing more than one antidepressant before and after the launch of the STOMP programme. The trend before June 2016, was positive. Following June 2016, there was no trend.
Figure 31: Trends in proportion of children and young adults with autism prescribed antipsychotics, who were prescribed more than one antipsychotic agent, before and after June 2016.
It shows modelled estimates for the trends in prescribing of antipsychotics before and after the launch of the STOMP programme, in autistic children and young people. Both the pre- STOMP and the post- STOMP periods showed positive slopes, however, the slope was much steeper post STOMP.
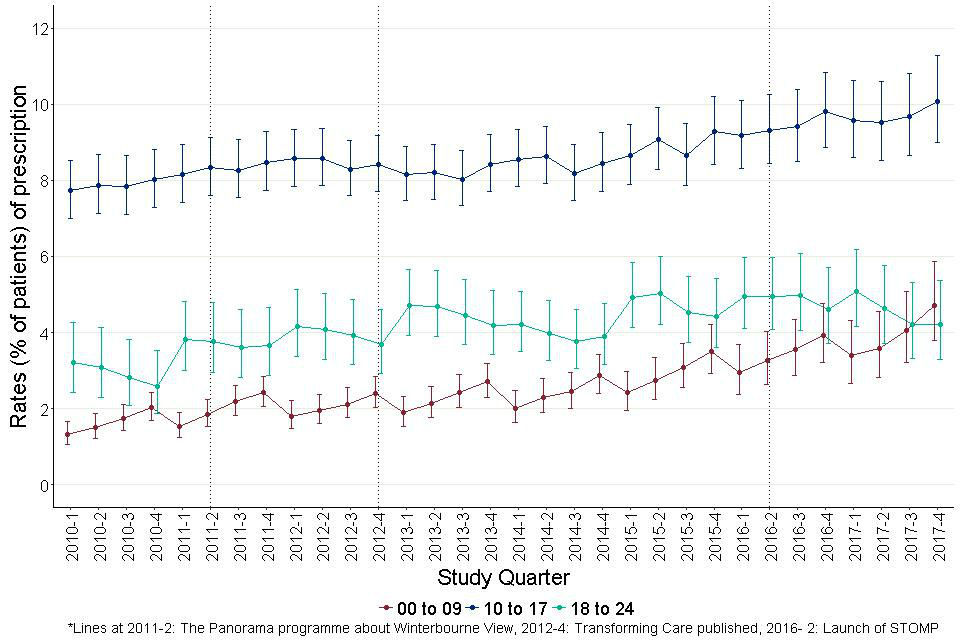
8. Prescribing patterns: Between-group polypharmacy
We have taken ‘between-group polypharmacy’ to mean simultaneous prescription of drugs from more than one of the groups we studied. Table 4 shows the distribution of numbers of drug groups prescribed on a given day, by gender and patient group. Annex table 3 gives a full breakdown by age group as well. This analysis did not consider how many drugs from each group a patient was prescribed.
Overall, 52.9% of adults with learning disabilities and 86% of autistic children and young adults, were prescribed none of the drug groups studied. This became less common in older groups; for people with a learning disability a quarter of people aged 10 to 17 and more than a half of people aged 45 and older were prescribed some type of psychotropic or antiepileptic medication (annex table 3).
Overall 19.1% of adults with learning disabilities and 3.2% of autistic children and young people were prescribed drugs from more than one group. This became more common with increasing age up to age 65. It was slightly less common in the oldest group of adults with learning disabilities.
The older groups of autistic adults were small in number so the confidence intervals were very wide. In reviewing annex table 3, it is worth speculating on what types of mental and neurological condition could make it appropriate for a person to be taking drugs from more than 3 of the groups as 2.4% of women and 1.9% of men with learning disabilities aged 45 to 64 currently are.
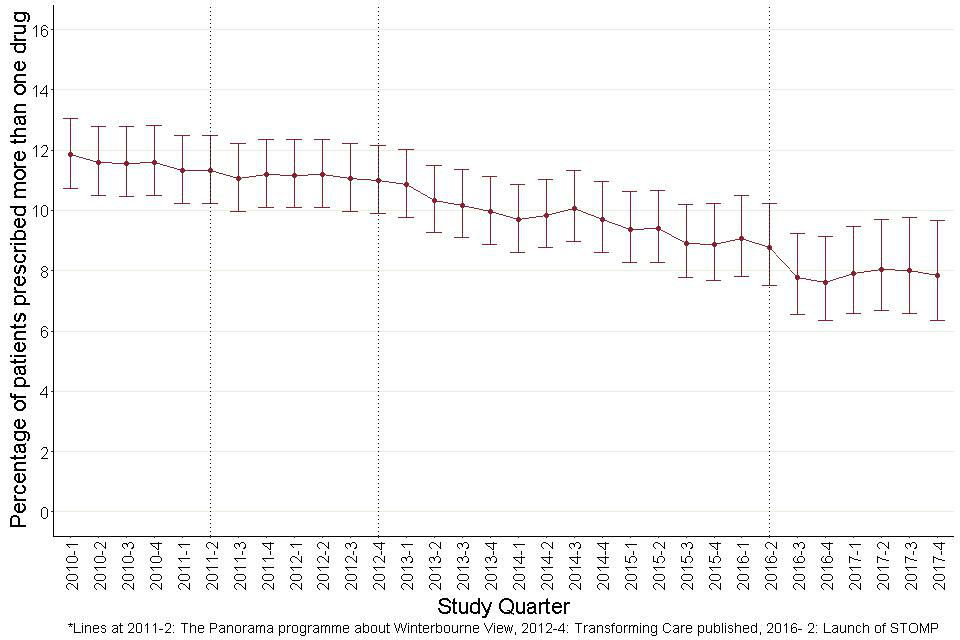
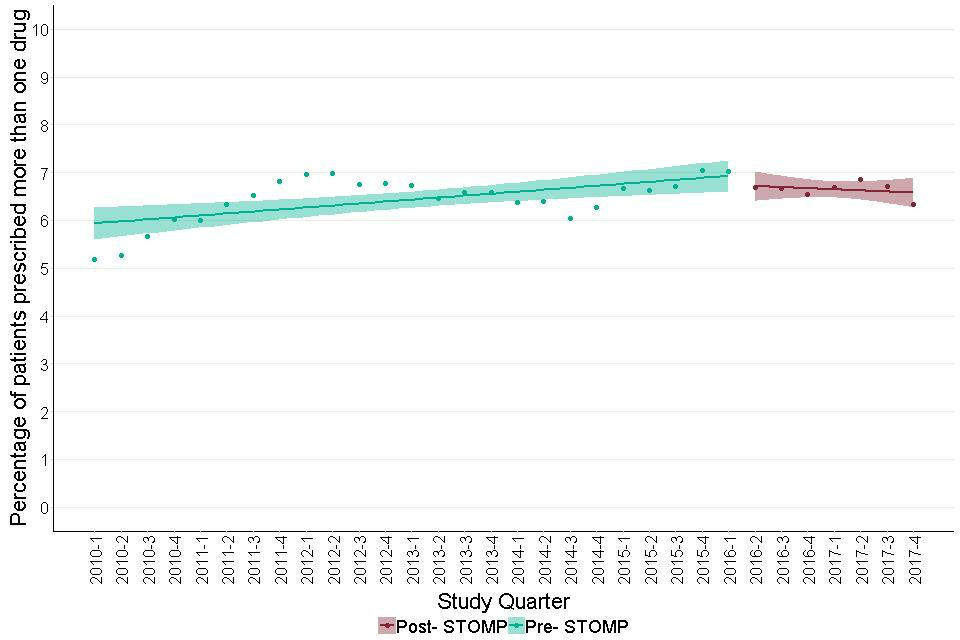
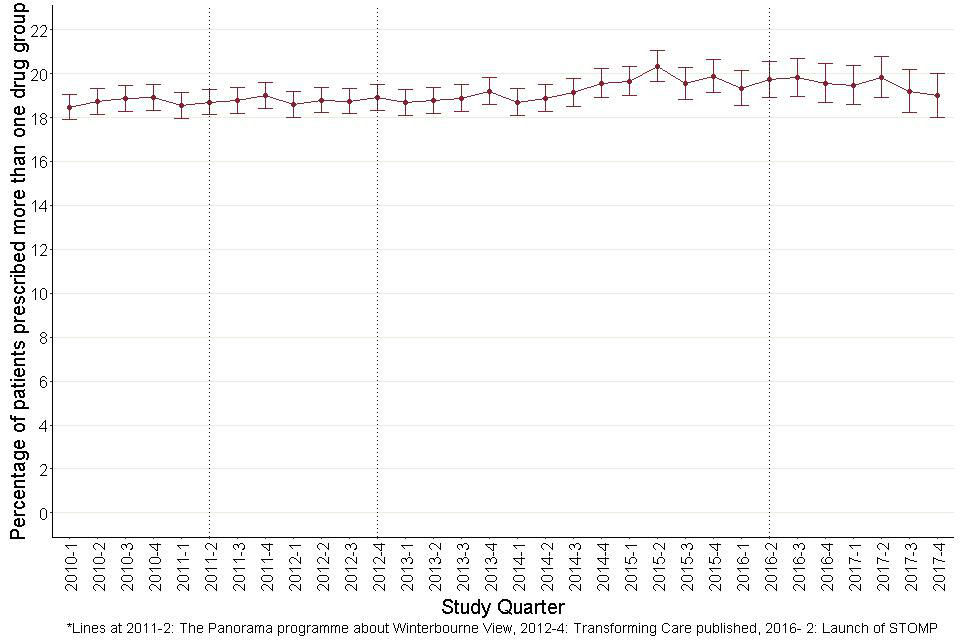
Figure 32 shows quarterly figures for the proportion of adults with learning disabilities prescribed drugs from more than one group. The overall rate appeared steady between 18% and 20% throughout the study period.
Deviations in individual quarters were largely within the span of the confidence interval bars. However modelled trends (Figure 33) suggest a slight change in the slope before and after the STOMP launch. The pre-STOMP slope was slightly positive (slope=0.04 (0.02 to 0.06); t-statistic p value=0.005), the post STOMP slope slightly negative (slope= -0.11 (-0.19 to -0.03); t-statistic p value=0.04). Moving the quarter taken as the STOMP launch point, forwards or backwards by a quarter, made no substantial difference.
The current multi-group prescribing rate was one percentage point below where it would have been if the earlier trend had continued. If the current study is representative of England as a whole, this would equate to around 2,500 fewer adults with learning disabilities in England, prescribed more than one drug group.
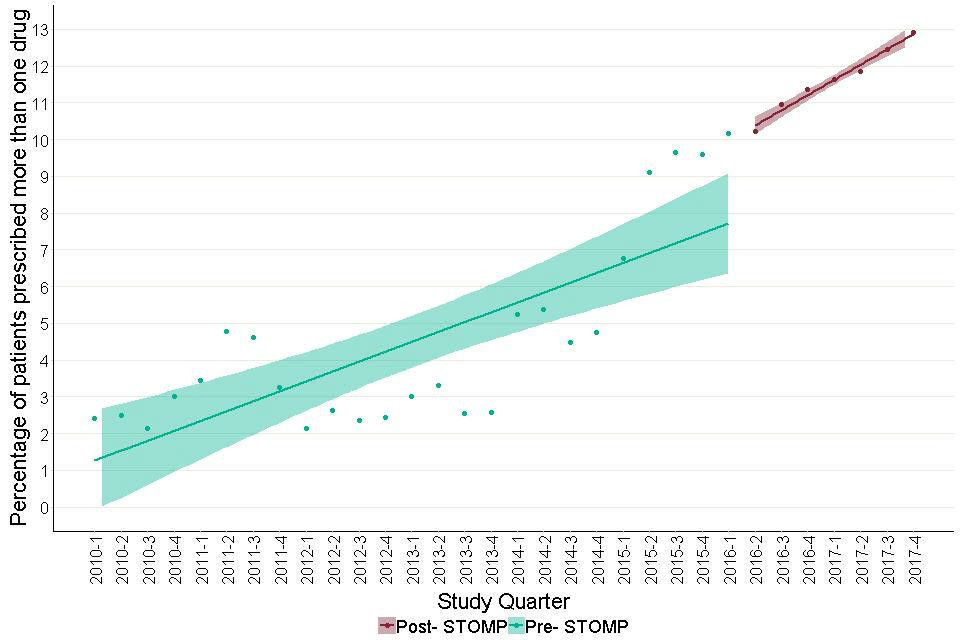
By contrast, Figure 34 shows that for autistic children and young people the proportion prescribed drugs from more than one of the groups studied rose steadily throughout the period. Modelled estimates of the trend slopes showed no significant change between the pre-STOMP (slope= 0.09, CI for slope= 0.08 to 0.10, t- statistic p value<0.002) and the post- STOMP (slope= 0.06, CI for slope= 0.02 to 0.10, t- statistic p value= 0.01) period. Both the periods showed an increasing trend.
Table 4: Percentage of patients prescribed psychotropic drugs, by number of drug groups prescribed on a given day, gender and patient group
| Number of drug groups | Learning disabilities (with or without autism)- aged 18 and over | Learning disabilities (with or without autism)- aged 18 and over | Autism (without learning disabilities)- aged 0 to 24 | Autism (without learning disabilities)- aged 0 to 24 |
|---|---|---|---|---|
| Female | Male | Female | Male | |
| 0 group | 50.3 (51.6- 49.1) | 54.9 (55.9- 53.7) | 84.2 (85.6- 82.5) | 86.5 (87.1- 85.7) |
| 1 group | 29.5 (28.4- 30.7) | 27 (26- 28) | 12.5 (11.2- 14) | 10.4 (9.7- 11) |
| 2 groups | 13.3 (12.5- 14.2) | 12.4 (11.7- 13.2) | 2.6 (2- 3.4) | 2.7 (2.4- 3.1) |
| 3 groups | 5.2 (4.7- 5.8) | 4.5 (4- 5) | 0.6 (0.4- 1.1) | 0.4 (0.3- 0.6) |
| More than 3 groups | 1.7 (1.4- 2) | 1.3 (1- 1.5) | 0.2 (0.1- 0.4) | 0.1 (0- 0.1) |
Figure 32: Quarterly prescribing of more than one psychotropic drug group for adults with learning disabilities.
It shows that the overall rate remains reasonably steady at between 18 and 20 percent throughout the study period.
Figure 33: Trends in prescription rates of more than one psychotropic drug groups for adults with learning disabilities, before and after June 2016.
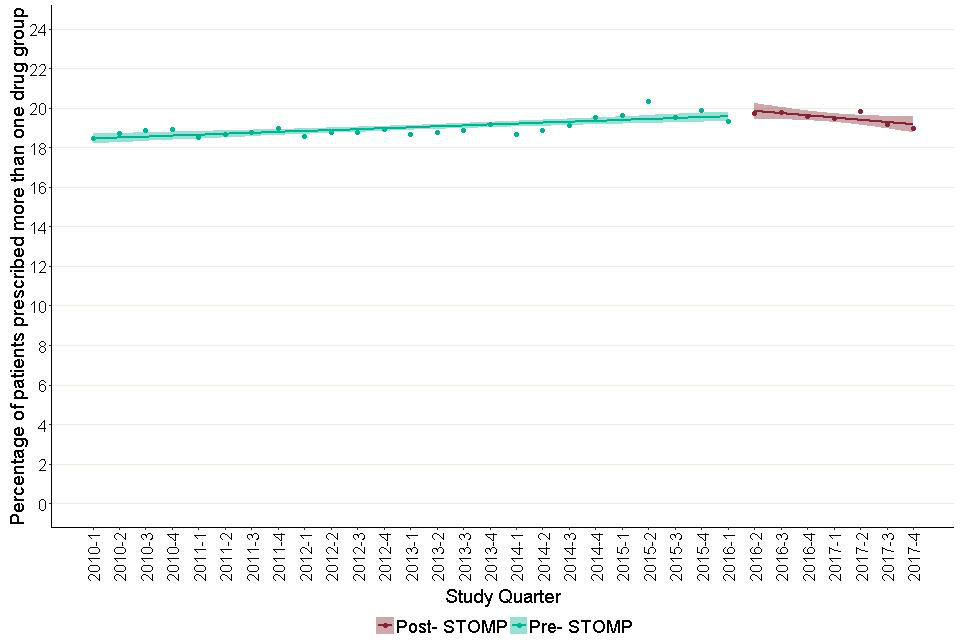
It shows modelled estimates of the trend in prescribing of more than one drug group, in the period before and after the launch of the STOMP programme. The trend before the STOMP programme shows an increasing trend. The trend after shows a decreasing one.
Figure 34: Quarterly prescribing of more than one psychotropic drug group for autistic children and young people (aged 0 to 24).
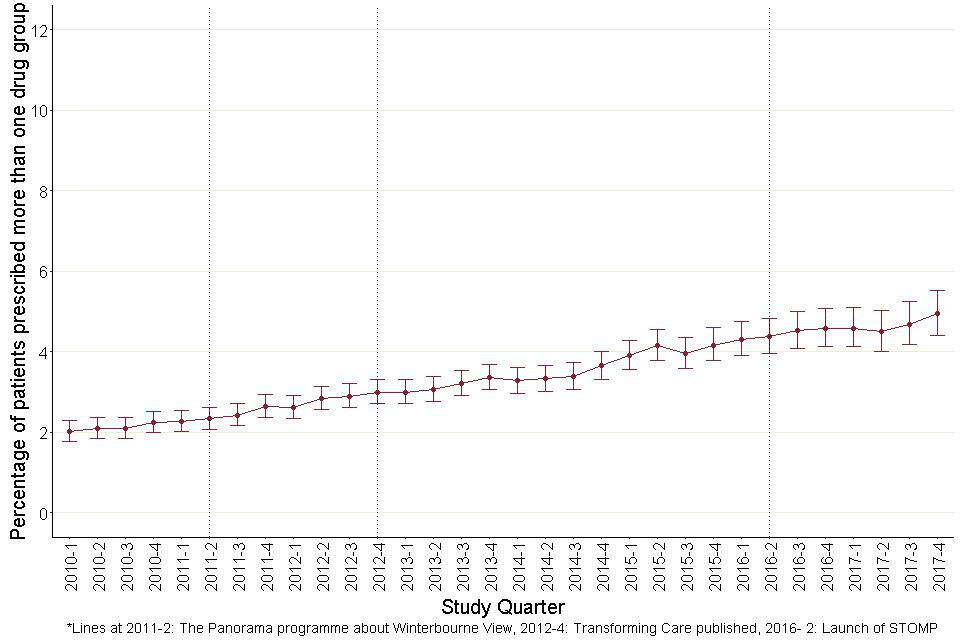
Figure 34: Quarterly prescribing of more than one psychotropic drug group for autistic children and young people (aged 0 to 24).
8.1 Drug group combinations
The previous section, on between-group polypharmacy, showed that nearly 19.1% of adults with learning disabilities were prescribed drugs from more than one of the groups studied. For autistic children and young people this was only the case for 3.2%.
Table 5 considers the combinations of drugs that are being taken. For each of the drug groups it shows the proportion of people taking drugs from the group who are not taking drugs from any of the other groups, and the proportions combining this group with each of the others. Perhaps most strikingly, 43.5% of women and 32.7% of men with learning disabilities taking antipsychotics were also taking antidepressants.
Of those prescribed antipsychotics, 68.4% were prescribed drugs in at least one other group. The corresponding proportion for autistic children and young adults was 57.2%. The most common of these groups for adults with learning disabilities were antidepressants (37.8%) followed by antiepileptics (35.8%), and those for autistic children and young adults were antidepressants (36.1%) and hypnotics (18.9%).
For adults with learning disabilities, of those prescribed antidepressants, 53.2% were prescribed drugs in at least one other group. The corresponding proportion for autistic children and young adults was 29.6%. The most common of these groups for adults with learning disabilities were antipsychotics (36.4%) followed by antiepileptics (24.4%), and those for autistic children and young adults were antipsychotics (16.6%) and hypnotics (11.7%).
For adults with learning disabilities, of those prescribed antiepileptics, 52.6% were prescribed drugs in at least one other group. The corresponding proportion for autistic children and young adults was 17.3%. The most common of these groups for adults with learning disabilities were antipsychotics (27.1%) followed by anxiolytics (20.4%), and those for autistic children and young adults were hypnotics (10.4%) followed by antidepressants (7.6%).
Table 5: Percentage of patients exposed to various combinations of drug groups, by gender and patient group
| Learning disabilities (with or without autism)- aged 18 and over | Learning disabilities (with or without autism)- aged 18 and over | Autism (without learning disabilities)- aged 0 to 24 | Autism (without learning disabilities)- aged 0 to 24 | |
|---|---|---|---|---|
| Female | Male | Female | Male | |
| Antipsychotics | ||||
| Prescribed just antipsychotics | 30.26 (27.3- 33.3) | 34.4 (31.8- 37.1) | 51.6 (34.8- 68.0) | 42.7 (35.2- 50.5) |
| Also prescribed anxiolytics | 24 (21.4- 26.7) | 22.6 (20.5- 24.9) | 7 (2.4- 18.6) | 2.9 (1.2- 6.6) |
| Also prescribed antidepressants | 43.5 (40.4- 46.6) | 32.7 (30.3- 35.2) | 39.5 (26.4- 54.4) | 24.3 (18.5- 31.2) |
| Also prescribed antiepileptics | 35.7 (32.8- 38.8) | 36.2 (33.8- 38.8) | 11.6 (5.1- 24.5) | 5.8 (3.2- 10.3) |
| Also prescribed hypnotics | 9.4 (7.8- 11.4) | 8.1 (6.8- 9.6) | 16.3 (8.1- 30) | 19.1 (13.9- 25.6) |
| Also prescribed antimanics | 2.5 (1.7- 3.7) | 2.1 (1.5- 3) | 0 (0- 8.2) | 0 (0- 2.2) |
| Also prescribed CNS stimulants | 0.3 (0.1- 0.9) | 1.4 (0.9- 2.2) | 9.3 (3.7- 21.6) | 24.9 (19- 31.8) |
| Antidepressants | ||||
| Prescribed just antidepressants | 49.6 (46.8- 52.3) | 46.16 (43.21- 49.14) | 76.5 (68.1- 83.2) | 70.2 (63.8- 75.9) |
| Also prescribed anxiolytics | 16.3 (14.4- 18.4) | 14.9 (13- 17.1) | 5.4 (2.6- 10.7) | 2.1 (0.9- 4.9) |
| Also prescribed antiepileptics | 24.6 (22.4- 27) | 24.1 (21.7- 26.6) | 5.4 (2.6- 10.7) | 3.8 (2- 7.1) |
| Also prescribed hypnotics | 7.9 (6.5- 9.4) | 6.5 (5.2- 8.1) | 10 (5.9- 16.4) | 12.3 (8.7- 17.2) |
| Also prescribed antimanics | 0.6 (0.3- 1.2) | 0.4 (0.2- 1) | 0 (0- 2.9) | 0 (0- 1.6) |
| Also prescribed antipsychotics | 32.4 (30- 35) | 39.3 (36.6- 42.2) | 13.1 (8.3- 19.9) | 17.9 (13.5- 23.3) |
| Also prescribed CNS stimulants | 0.1 (0- 0.4) | 0.8 (0.4- 1.5) | 6.2 (3.2- 11.7) | 8.9 (5.9- 13.3) |
| Hypnotics | ||||
| Prescribed just hypnotics | 3.3 (2.4- 4.3) | 5.2 (4.0- 6.7) | 72.2 (61.4- 80.8) | 59.4 (54.4- 64.2) |
| Also prescribed anxiolytics | 28 (22.6- 34) | 26.2 (21.3- 31.9) | 2.2 (0.6- 7.7) | 0.2 (0- 1.4) |
| Also prescribed antidepressants | 44.5 (38.3- 50.9) | 28.9 (23.8- 34.6) | 14.4 (8.6- 23.2) | 7.2 (5.1- 10.2) |
| Also prescribed antiepileptics | 37.3 (31.4- 43.6) | 38.4 (32.7- 44.4) | 4.4 (1.7- 10.9) | 4.5 (2.9- 7) |
| Also prescribed antimanics | 3 (1.4- 6) | 0.8 (0.2- 2.7) | 0 (0- 4.1) | 0 (0- 0.9) |
| Also prescribed antipsychotics | 39.8 (33.8- 46.2) | 43 (37.1- 49) | 7.8 (3.8- 15.2) | 8.2 (5.9- 11.3) |
| Also prescribed CNS stimulants | 0.4 (0.1- 2.4) | 4.2 (2.4- 7.3) | 16.7 (10.4- 25.7) | 31.3 (27- 36) |
| Anxiolytics | ||||
| Prescribed just anxiolytics | 21.8 (19- 24.9) | 22.1 (19.5- 25) | 62.5 (30.5- 86.3) | 58.3 (31.9- 80.6) |
| Also prescribed antidepressants | 35.9 (32.2- 39.8) | 24.9 (21.9- 28.3) | 46.7 (24.8- 69.9) | 25 (11.2- 46.9) |
| Also prescribed antiepileptics | 49.3 (45.3- 53.2) | 50.4 (46.7- 54.1) | 13.3 (3.7- 37.9) | 20 (8.1- 41.6) |
| Also prescribed hypnotics | 10.9 (8.6- 13.6) | 9.9 (7.9- 12.3) | 13.3 (3.7- 37.9) | 5 (0.9- 23.6) |
| Also prescribed antimanics | 1.5 (0.8- 2.8) | 1.3 (0.7- 2.4) | 0 (0- 20.4) | 0 (0- 16.1) |
| Also prescribed antipsychotics | 39.4 (35.6- 43.3) | 45.3 (41.6- 49) | 20 (7- 45.2) | 25 (11.2- 46.9) |
| Also prescribed CNS stimulants | 0 (0- 0.6) | 0.3 (0.1- 1) | 0 (0- 20.4) | 0 (0- 16.1) |
| Antiepileptics | ||||
| Prescribed just antiepileptics | 51.2 (48.9- 53.6) | 53.5 (51.4- 55.6) | 87.7 (76.8- 93.9) | 78.2 (71.4- 83.8) |
| Also prescribed anxiolytics | 21.2 (19.1- 23.4) | 19.8 (18- 21.7) | 3.4 (0.9- 11.5) | 2.6 (1- 6.6) |
| Also prescribed antidepressants | 23.3 (21.2- 25.6) | 15.8 (14.1- 17.5) | 11.9 (5.9- 22.5) | 5.9 (3.1- 10.9) |
| Also prescribed hypnotics | 6.2 (5.1- 7.6) | 5.7 (4.7- 6.9) | 6.8 (2.7- 16.2) | 11.8 (7.6- 17.9) |
| Also prescribed antimanics | 0.7 (0.4- 1.3) | 0.9 (0.6- 1.5) | 0 (0- 6.1) | 0 (0- 2.5) |
| Also prescribed antipsychotics | 25.2 (23- 27.6) | 28.5 (26.5- 30.7) | 8.5 (3.7- 18.4) | 6.6 (3.6- 11.7) |
| Also prescribed CNS stimulants | 0.3 (0.1- 0.7) | 0.7 (0.4- 1.2) | 1.7 (0.3- 9) | 6.6 (3.6- 11.7) |
9. High dose antipsychotics
We looked at 2 measures of use of high doses: individual drugs prescribed in doses exceeding the recommendation for that drug, and combined doses of all antipsychotics prescribed exceeding 100% of recommended doses in total. We looked at these measures only for antipsychotics and only in relation to adults with learning disabilities.
Overall, on an average day, 1.8% of patients prescribed any antipsychotic were prescribed at least one antipsychotic in a dose that exceeded the BNF recommended maximum. 3.5% were prescribed combinations of antipsychotics where the sum of the doses, expressed as proportions of the BNF recommended maxima, exceeded 100%.
Table 6 shows the measures for the age and sex groups we studied. In both, high doses were more common for older age groups and for men. Figures 35 and 36 show quarterly figures for the 2 measures by age group. The confidence intervals are relatively wide indicating that only a substantial and sustained trend would be statistically measurable. No sustained trend pattern was apparent.
Table 6: Percentage of patients prescribed antipsychotics above the BNF recommended maximum- learning disabilities (with or without autism) - aged 18 and over
| Proportion of any antipsychotic above BNF maximum | Proportion of any antipsychotic above BNF maximum | Cumulative antipsychotic proportion above BNF maximum | Cumulative antipsychotic proportion above BNF maximum | |
|---|---|---|---|---|
| Female | Male | Female | Male | |
| 18 to 24 | 0 (0- 5.8) | 0 (0- 2.2) | 0 (0- 5.8) | 1.2 (0.3- 4.3) |
| 25 to 44 | 1.4 (0.5- 3.5) | 2.3 (1.3- 4.1) | 3.1 (1.6- 5.8) | 3.9 (2.5- 6.1) |
| 45 to 64 | 1.4 (0.7- 2.9) | 2.5 (1.5- 4.1) | 3.3 (2.1- 5.3) | 4.5 (3.1- 6.5) |
| 65 and over | 1.8 (0.6- 5.3) | 3.1 (1.3- 7.1) | 3.7 (1.7- 7.8) | 4.3 (2.1- 8.7) |
| All adults | 1.4 (0.8- 2.3) | 2.2 (1.5- 3.1) | 3.1 (2.2- 4.3) | 3.9 (3.0- 5.1) |
Figure 35: Quarterly percentages of adults with learning disabilities prescribed antipsychotics who were prescribed at least one agent at a dose exceeding BNF recommended maximum.
This is a proportion of all patients prescribed antipsychotics. It shows that no significant conclusions can be made about the trends, given the rather wide confidence intervals around them.
Figure 36: Quarterly percentages of adults with learning disabilities prescribed antipsychotics who were prescribed drug combinations with total doses above recommended maxima (see text for explanation).
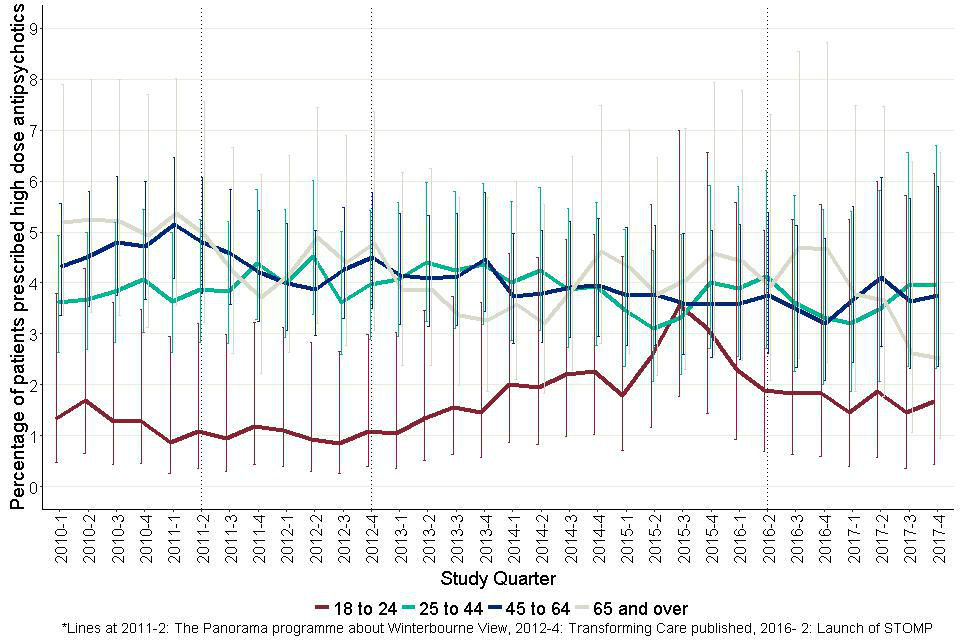
This is a proportion of all patients prescribed antipsychotics. It shows that no significant conclusions can be made about the trends, given the rather wide confidence intervals around them.
10. Prescribing patterns: inceptions and terminations
The inception rates for antipsychotics and antidepressants for adults with learning disabilities were 251.4 and 577.9 per 10,000 person years not currently taking the drug group respectively. Corresponding rates for autistic children and young adults were 114.9 and 294.5 per 10,000 person years. Table 7 shows the rates of prescribing inceptions for all the drug groups studied.
Table 8 shows these rates by age group and gender for antipsychotics and antidepressants. It shows that for both the drug groups, rates of inceptions were higher in the adult age groups compared to children. For antidepressants, these rates were consistently higher in females compared to males except for the youngest age group with learning disabilities.
As numbers of events were relatively small, plots over time are done for whole not quarter years (Figures 37, 38, 39 and 40). Inception rates for antipsychotic prescribing for adults with learning disabilities showed little movement other than a non-significant downward step following 2012. Inception rates for antidepressant prescribing showed little movement but possibly a non-significant upward step after 2014.
Rates of antipsychotic prescribing inceptions for autistic children and young people showed little movement over the period. By contrast rates of antidepressant inceptions for this group showed a sustained upward trend, more than doubling over the period. Comparison of the first and last points of this plot showed a statistically significant difference (comparison of proportions z=9.7, p <0.0001).
Table 7: Rates of inceptions of episodes per 10,000 person years not taking the drug group
| Learning disabilities (with or without autism)- aged 18 and over | Autism (without learning disabilities)- aged 0 to 24 | |
|---|---|---|
| Inceptions | Inceptions | |
| Antipsychotics | 251.4 (240.9- 262.2) | 114.9 (107.6- 122.6) |
| Antidepressants | 577.9 (563.4- 592.8) | 294.5 (282.9- 306.6) |
| Antiepileptics | 275.7 (264.3- 287.4) | 60.7 (55.4- 66.3) |
| Anxiolytics | 307.3 (296.3- 318.7) | 39.5 (35.3- 44.0) |
| Hypnotics | 212.1 (203.2- 221.3) | 302.2 (290.1- 314.6) |
| CNS stimulants | 17.6 (15.6- 20.3) | 239.7 (228.8- 250.8) |
Table 8: Rates of inceptions of episodes per 10,000 person years not taking the drug group, by gender and age group
| Learning disabilities (with/without autism) | Learning disabilities (with/without autism) | Autism | Autism | ||
|---|---|---|---|---|---|
| Female | Male | Female | Male | ||
| Antipsychotics | 00 to 09 | 19.1 (7.9- 39.4) | 25.2 (14.1- 41.9) | 21.1 (11.5- 35.8) | 23.1 (17.7- 29.7) |
| 10 to 17 | 107.2 (81.2- 139.1) | 134.6 (113- 159.3) | 136.6 (111.3- 166) | 132.2 (119.2- 146.3) | |
| 18 to 24 | 168.8 (138.5- 203.8) | 293 (261.8- 326.9) | 316.2 (255.6- 387.2) | 257.8 (229.4- 288.9) | |
| 25 to 44 | 221.1 (198.3- 245.7) | 254.3 (232.3- 277.9) | 381.2 (297.9- 480.9) | 406.4 (356.1- 461.9) | |
| 45 to 64 | 273 (244.9- 303.4) | 260.6 (235.2- 288) | 397.4 (267.8- 569.5) | 488.3 (391- 602.8) | |
| 65 and over | 291.6 (240.2- 350.9) | 232.2 (188.7- 282.8) | 334 (148.9- 655.8) | ||
| Antidepressants | 00 to 09 | 12.7 (4.3- 30.2) | 19.3 (9.9- 34.3) | 12.3 (5.5- 24.1) | 7.7 (4.8- 11.7) |
| 10 to 17 | 177.1 (143.3- 216.6) | 131.3 (110.3- 155.1) | 447.6 (400.7- 498.7) | 183.4 (168.2- 199.7) | |
| 18 to 24 | 763.3 (698.7- 832.4) | 495.1 (456.2- 536.5) | 1771.5 (1625.2- 1927.5) | 835.3 (784.3- 888.8) | |
| 25 to 44 | 792.4 (751.4- 835.2) | 551.5 (521.3- 582.9) | 1568.5 (1401.9- 1749.6) | 1215.4 (1130.9- 1304.5) | |
| 45 to 64 | 595.8 (558.9- 634.7) | 466.9 (436.9- 498.5) | 1414.9 (1167.6- 1699.7) | 1082.5 (944- 1235.7) | |
| 65 and over | 509.8 (449.4- 576.1) | 350 (302.2- 403.2) | 1019.5 (480.9- 1923.9) | 726.1 (445.7- 1122.9) |
Figure 37: Annual inception rates for antipsychotic prescribing – adults with learning disabilities.
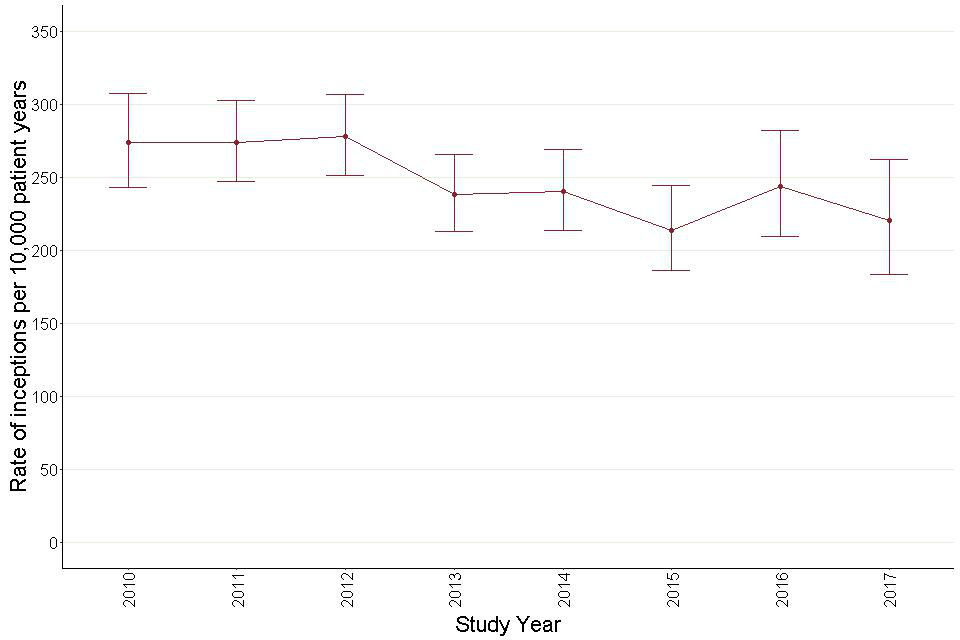
Inception rates for antipsychotic prescribing for adults with learning disabilities showed little movement other than a non-significant downward step following 2012.
Figure 38: Annual inception rates for antidepressant prescribing – adults with learning disabilities.
Inception rates for antidepressant prescribing showed little movement but possibly a non-significant upward step after 2014.
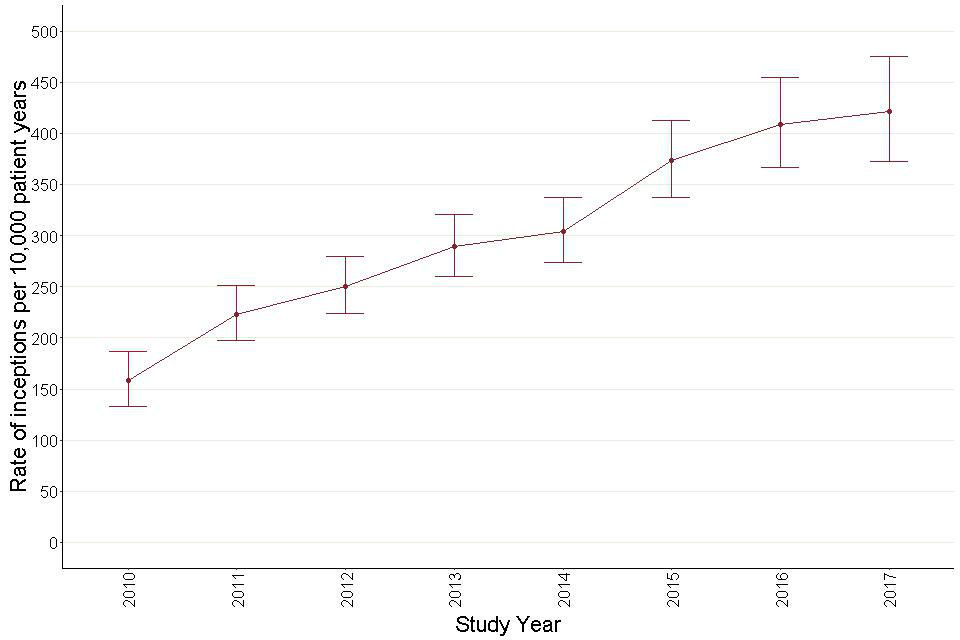
Figure 39: Annual inception rates for antipsychotic prescribing – autistic children and young people (aged 0 to 24).
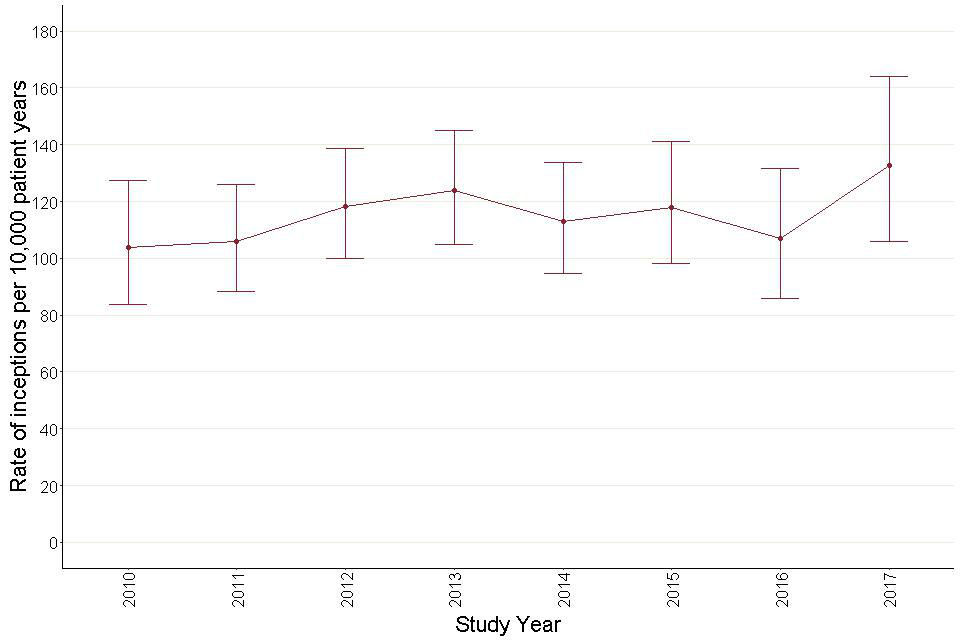
Rates of antipsychotic prescribing inceptions for autistic children and young people showed little movement over the period.
Figure 40: Annual inception rates for antidepressant prescribing – autistic children and young people (aged 0 to 24).
The rate of inceptions of antidepressants showed a sustained upward trend, more than doubling over the study period.
The rate of terminating prescribing for antipsychotics for adults with learning disabilities was 1409.8 per 10,000 person years taking the drug group. The corresponding rate for antidepressants was 3248.3. For autistic children and young people, the termination rate for antipsychotics was 5526.8 and for antidepressants 7334.3. Table 9 shows the overall rates for all the drug groups.
Table 10 shows these rates by age group and gender for antipsychotics and antidepressants.
Drug termination rates over time are shown in Figures 41, 42, 43 and 44. For adults with learning disabilities the rate of terminations of antipsychotic prescribing fell from 2011 to 2015 before showing a partial recovery. However, the confidence intervals for the annual rates were wide so few of the differences were statistically significant.
Termination rates for antidepressant prescribing remained fairly steady. The rate of terminations of antipsychotic prescribing for autistic children and young people showed some tendency to fall through the period, though not to a statistically significant extent. The rate of antidepressant terminations fell steadily and significantly throughout the period. A comparison of the initial and final termination rates for antidepressants showed these to be significantly different (comparison of proportions z= -7.2 p<0.0001).
Table 9: Rate of terminations of episodes per 10,000 person years taking the drug group
| Learning disabilities (with or without autism)- aged 18 and over | Autism (without learning disabilities)- aged 0- 24 | |
|---|---|---|
| Terminations | Terminations | |
| Antipsychotics | 1409.8 (1354.8- 1466.5) | 5526.8 (5158.4- 5914.7) |
| Antidepressants | 3248.3 (3165.9- 3332.4) | 7334.3 (7029.6- 7648.7) |
| Antiepileptics | 883.1 (845.4- 922.2) | 3015.1 (2741.8- 3307.2) |
| Anxiolytics | 3921.6 (3794.3- 4052.1) | 7624.6 (6844.6- 8967.8) |
| Hypnotics | 6835.6 (6568.2- 7111.2) | 5597.6 (5355.3- 5848.1) |
| CNS stimulants | 3425.2 (3026.9- 3861.8) | 4041.9 (3849.4- 4241.5) |
Table 10: Rate of terminations of episodes per 10,000 person years taking the drug group, by gender and age group
| Learning disabilities (with/without autism) | Learning disabilities (with/without autism) | Autism (without learning disabilities) | Autism (without learning disabilities) | ||
|---|---|---|---|---|---|
| Female | Male | Female | Male | ||
| Antipsychotics | 00 to 09 | 3862.4 (1068.9 -10304.3) | 5640.5 (2993.1 -9762.7) | 3016.1 (834.7 -8046.6) | 4529.9 (3028.8 -6533.9) |
| 10 to 17 | 2405.6 (1676.2 -3352) | 2348.1 (1904.3 -2865.7) | 6244.5 (4971.5 -7749.1) | 5110.9 (4584.6 -5681.4) | |
| 18 to 24 | 1820.8 (1456 -2250.7) | 3116.3 (2805.1 -3452.8) | 6498.6 (5294.2 -7898.8) | 5772.4 (5130.1 -6473.6) | |
| 25 to 44 | 1705.6 (1535.3 -1889.8) | 1564.6 (1436.9 -1700.7) | 2596.6 (1991.1 -3331.5) | 4549.8 (4010.7 -5141.8) | |
| 45 to 64 | 1079.5 (975.3 -1191.9) | 1043.2 (950.6 -1142.5) | 2229.6 (1387.3 -3410.4) | 3320.8 (2662.8 -4094.5) | |
| 65 and over | 1232.6 (1042.8 -1447.3) | 1142.2 (960.9 -1348.1) | 1952.6 (870.7 -3834) | ||
| Antidepressants | 00 to 09 | 6101.1 (1688.5 -16277) | 5321.6 (4869.2- 5618.2) | 4764.1 (1318.5 -12710.2) | 5216.6 (2168.4 -10753.1) |
| 10 to 17 | 5028.2 (3906.6 -6376.9) | 4296.4 (3410 -5346.2) | 6436.9 (5604.3 -7359.4) | 5259 (4720.6 -5842.4) | |
| 18 to 24 | 6002.8 (5490.3 -6550.5) | 5782.5 (5325.8 -6268.1) | 8358.2 (7710.9 -9045.5) | 8081.3 (7592 -8593.9) | |
| 25 to 44 | 3586.6 (3400.4 -3780.4) | 3722.4 (3522.9 -3930.3) | 4512.8 (4060.9 -5001.5) | 5516.7 (5160.6 -5890.9) | |
| 45 to 64 | 1921.4 (1799.5 -2049.4) | 2162.4 (2019.4 -2313) | 3633.1 (3003.5 -4357.3) | 3133.7 (2729.3 -3581.8) | |
| 65 and over | 1606.5 (1403.3 -1831.1) | 1584.2 (1356.1 -1840.1) | 2012.1 (897.3 -3950.8) | 3812.6 (2402.4 -5772.7) |
Figure 41: Annual termination rates for antipsychotic prescribing – adults with learning disabilities.
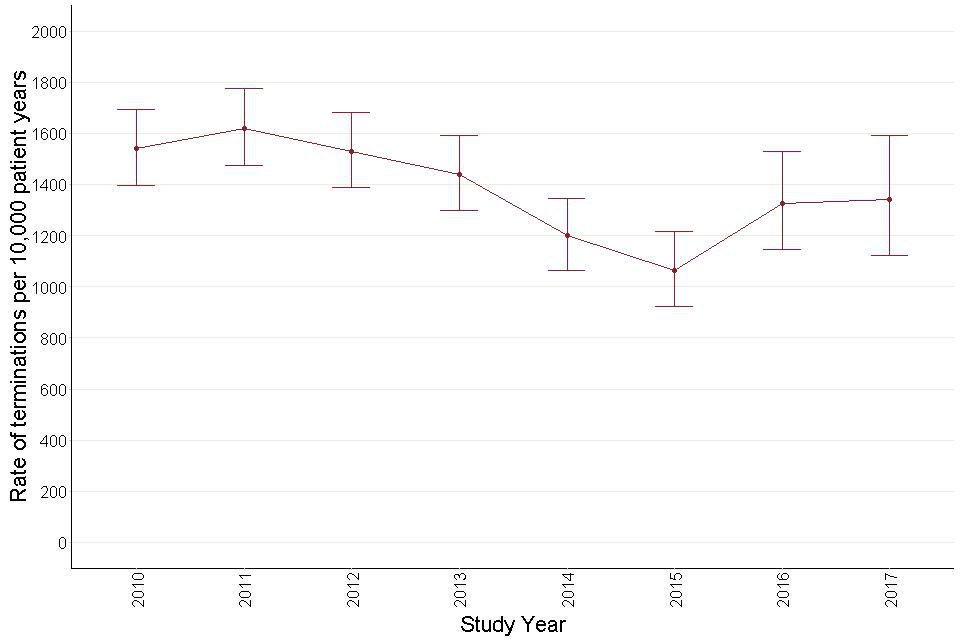
There seems to be a tendency for the rate of antipsychotic terminations to fall over the study period. However, the confidence intervals indicate that this is statistically not significant.
Figure 42: Annual termination rates for antidepressant prescribing – adults with learning disabilities.
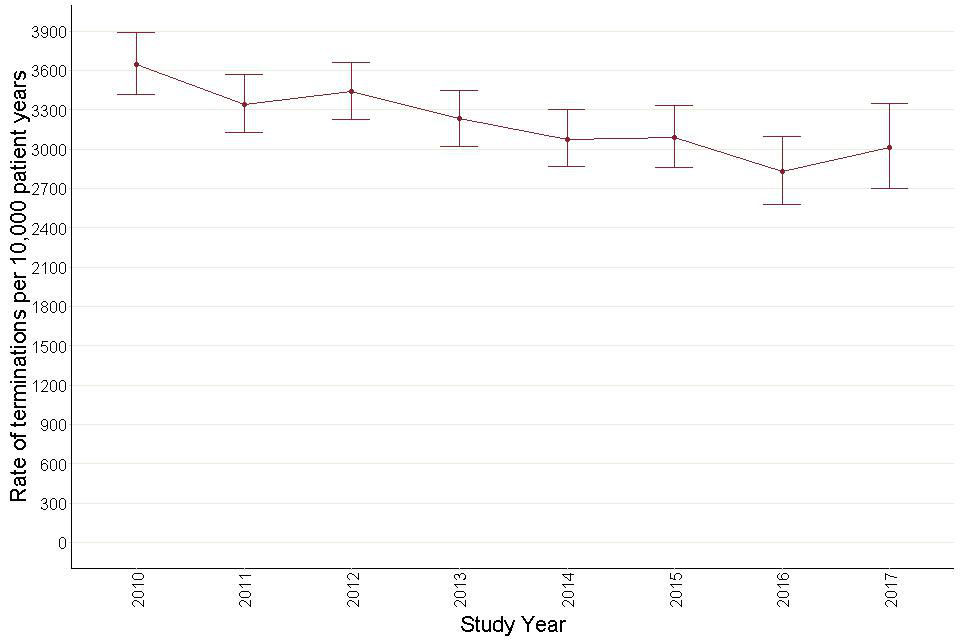
Figure 42: Annual termination rates for antidepressant prescribing – adults with learning disabilities.
Figure 43: Annual termination rates for antipsychotic prescribing – autistic children and young people (aged 0 to 24).
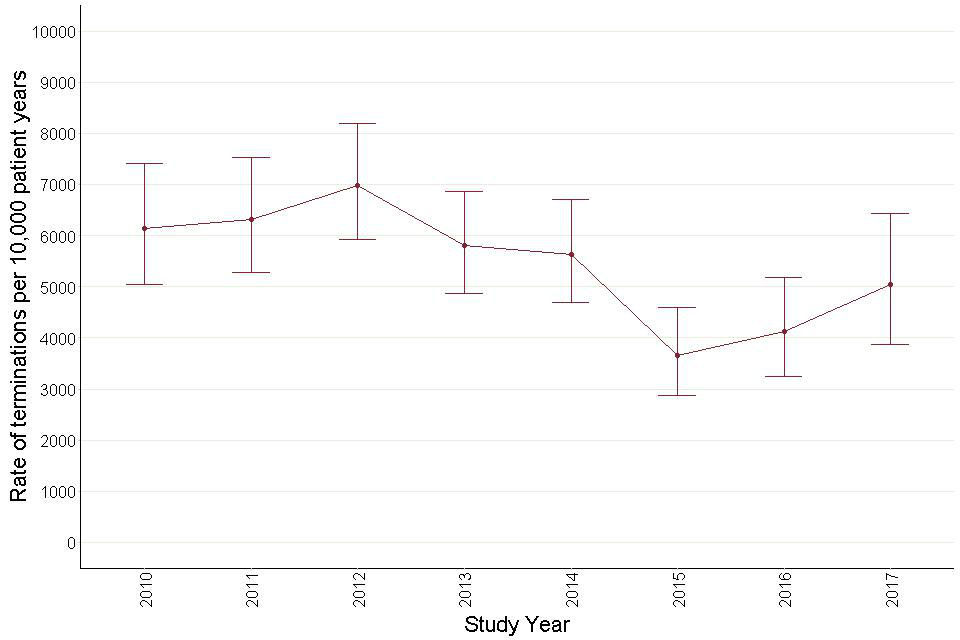
There seems to be a tendency for the rate of antipsychotics to fall over the study period. However, the confidence intervals indicate that this is statistically not significant.
Figure 44: Annual termination rates for antidepressant prescribing – autistic children and young people (aged 0 to 24).
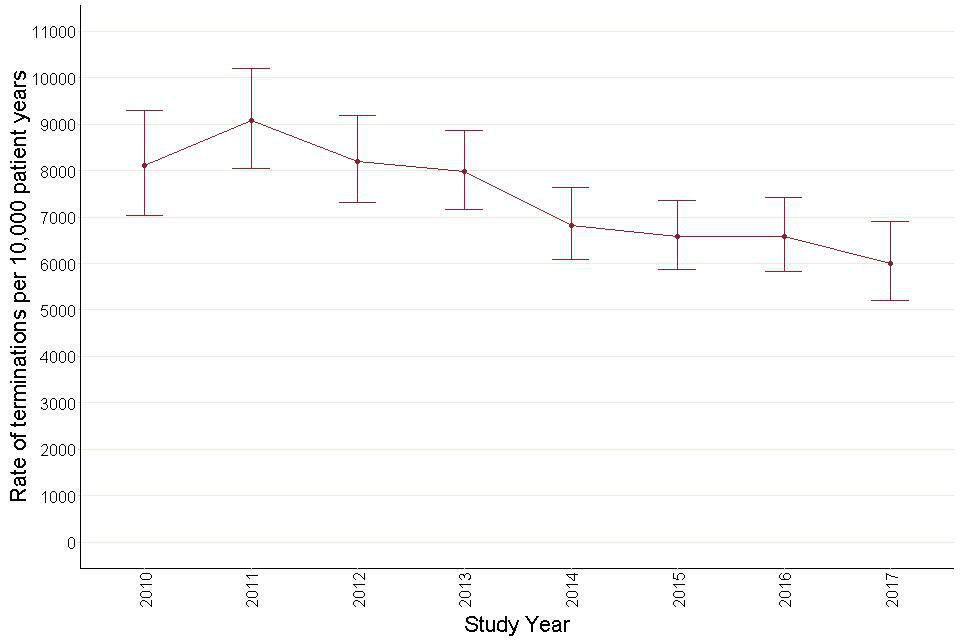
Figure 44: Annual termination rates for antidepressant prescribing – autistic children and young people.
11. Changes in trends
Table 11 shows the summary of trends for all the above measures. It shows the overall (background trends) over the entire study period, and the trends in the pre-STOMP and the post-STOMP periods.
The table shows that while there were hardly any changes in trends following the launch of STOMP in autistic children and young adults, there were quite a few in adults with learning disabilities, most in the direction of reducing inappropriate prescribing. The post-STOMP trend changed to a decreasing one for overall prescribing of antipsychotics and anxiolytics, prescribing of antipsychotics with indications, and prescribing of drugs from more than one drug group.
Trends for overall prescribing of antidepressants, prescribing of antidepressants without indications and prescribing of more than one antidepressants, changed from an increasing trend in the pre-STOMP period to a level trend or no significant trend in the post-STOMP period. By contrast, there were only 2 measures that showed significant changes for prescribing to autistic children and young adults, both in the opposite direction of intended STOMP effects. Overall prescribing of hypnotics and prescribing of more than one antipsychotic both showed a rising trend in the pre-STOMP period and for both the slope of the rise increased.
Wherever there is ‘-‘ in the table, we have either not analysed those measures for that particular patient group or the numbers were too small for any trends analyses. The table does not quote trends for inceptions and terminations in the pre-STOMP and the post-STOMP period, as this measure was analysed on an annual basis giving insufficient data points for the analysis.
Table 11a: Summary of trends, by measures and patient group: adults with learning disabilities
| Background trend (slope (LCI to UCI), p) | Pre-STOMP (slope (LCI to UCI), p) | Post-STOMP slope (slope (LCI to UCI), p) | Background or pre-STOMP trend | Change | |
|---|---|---|---|---|---|
| Overall prevalence | |||||
| Antipsychotics | 0.02 (0.01 to 0.03), p=0.003 | 0.01 (0.00 to 0.03), p=0.08 | -0.10 (-0.16 to -0.04), p=0.02 | Increasing | Change to decreasing |
| Antidepressants | 0.16 (0.15 to 0.17), p=0.002 | 0.16 (0.14 to 0.18), p<0.001 | 0.04 (-0.02 to 0.10), p=0.2 | Increasing | Change to no significant trend |
| anxiolytics | 0.01 (-0.01 to 0.02), p=0.7 | 0.01 (0.00 to 0.01), p=0.18 | -0.18 (-0.25 to -0.11), p=0.003 | no trend | Change to decreasing |
| antiepileptics | 0.06 (0.05 to 0.07), p<0.001 | 0.05 (0.03 to 0.07), p<0.001 | 0.12 (0.04 to 0.20), p=0.03 | Increasing | No significant change |
| hypnotics | - | - | - | ||
| CNS stimulants | - | - | - | ||
| Prevalence in relation to indications | |||||
| antipsychotics with indications | 0.02 (-0.02 to 0.06), p=0.3 | 0.05 (0.01 to 0.09), p=0.05 | -0.71 (-0.96 to -0.46), p=0.001 | no trend | Change to decreasing |
| antipsychotics without indications | 0.03 (0.02 to 0.04), p<0.001 | 0.02 (0.01 to 0.06), p=0.003 | 0.01 (-0.05 to 0.07), p=0.5 | Increasing | No significant change |
| antidepressants with indications | 0.32 (0.30 to 0.34), p<0.001 | 0.28 (0.26 to 0.30), p<0.001 | 0.42 (0.28 to 0.56), p=0.002 | Increasing | No significant change |
| antidepressants without indications | |||||
| 0.09 (0.08 to 0.10), p<0.001 | 0.10 (0.09 to 0.11), p<0.002 | -0.008 (-0.07 to 0.05), p=0.8 | Increasing | Change to no significant trend | |
| Polypharmacy | |||||
| more than one antipsychotic | -0.13 (-0.14 to -0.12), p<0.001 | -0.12 (-0.13 to -0.11), p<0.002 | -0.6 (-0.20 to 0.08), p=0.3 | Decreasing | no significant change |
| more than one antidepressant | 0.02 (0.01 to 0.03), p=0.001 | 0.04 (0.02 to 0.06), p=0.003 | -0.04 (-0.08 to 0.01), p=0.14 | Increasing | Change to no significant trend |
| more than one anti-epileptic | -0.03 (-0.04 to -0.02), p<0.001 | -0.04 (-0.06 to -0.02), p<0.001 | 0.02 (-0.04 to 0.08), p=0.46 | Decreasing | No significant change |
| more than one drug group | 0.03 (0.02 to 0.04), p<0.001 | 0.04 (0.02 to 0.06), p<0.005 | -0.11 (-0.19 to -0.03), p=0.04 | Increasing | Change to decreasing |
| Inceptions and terminations | |||||
| antipsychotic inceptions | -8.52 (-13.10 to -3.92), p=0.009 | - | - | Decreasing | |
| antipsychotics terminations | -53.5(-98.2 to -8.7), p=0.05 | - | - | Decreasing | |
| antidepressants inceptions | 10.5 (3.6 to 17.7), p=0.02 | - | - | Increasing | |
| antidepressant terminations | -97.9(-132.6 to -63.2), p=0.0001 | - | - | Decreasing |
Table 11b: Summary of trends, by measures and patient group: autistic children and young adults
| Background trend (slope (LCI to UCI), p) | Pre-STOMP slope (slope (LCI to UCI), p) | Post-STOMP slope (slope (LCI to UCI), p) | Background or pre-STOMP trend | Change | |
|---|---|---|---|---|---|
| Overall prevalence | |||||
| Antipsychotics | 0.02 (0.01 to 0.02), p<0.001 | 0.02 (0.02 to 0.03), p<0.002 | -0.01 (-0.03 to 0.02), p=0.6 | Increasing | No significant change |
| Antidepressants | 0.09 (0.07 to 0.11), p<0.001 | 0.08 (0.06 to 0.10), p<0.001 | 0.05 (-0.03 to 0.13), p=0.2 | Increasing | No significant change |
| anxiolytics | - | - | - | ||
| antiepileptics | 0.02 (0.01 to 0.02), p<0.001 | 0.02 (0.02 to 0.03), p<0.002 | 0.02 (0.01 to 0.03), p=0.01 | Increasing | No significant change |
| hypnotics | 0.15 (0.14 to 0.16), p<0.002 | 0.14 (0.13 to 0.15), p<0.002 | 0.22 (0.20 to 0.24), p<0.001 | Increasing | Steeper increase |
| CNS stimulants | 0.08 (0.07 to 0.09), p<0.002 | 0.07 (0.06 to 0.08), p<0.001 | 0.07 (0.03 to 0.11), p=0.03 | Increasing | No significant change |
| Prevalence in relation to indications | |||||
| antipsychotics with indications | - | - | - | ||
| antipsychotics without indications | - | - | - | ||
| antidepressants with indications | - | - | - | ||
| antidepressants without indications | |||||
| Polypharmacy | |||||
| more than one antipsychotic | 0.18 (0.12 to 0.24), p<0.001 | 0.26 (0.18 to 0.32), p<0.003 | 0.40 (0.34 to 0.46), p=0.06 | Increasing | Steeper increase |
| more than one antidepressant | 0.05 (-0.01 to 0.11), p=0.9 | 0.08 (-0.02 to 0.10), p<0.7 | 0.10 (0.06 to 0.12), p<0.001 | No significant trend | No significant change |
| more than one anti-epileptic | 0.35 (0.23 to 0.47), p<0.001 | 0.09 (0.03 to 0.15), p=0.03 | 0.61 (-0.57 to 1.23), p=0.3 | Increasing | No significant change |
| more than one drug group | 0.09 (0.08 to 0.09), p<0.002 | 0.09 (0.08 to 0.10), p<0.002 | 0.06 (0.02 to 0.10), p=0.01 | Increasing | No significant change |
| Inceptions and terminations | |||||
| antipsychotic inceptions | 2.32 (-0.36 to 5.12), p=0.1 | - | - | No significant trend | |
| antipsychotics terminations | -344.2 (-593.4 to -95.0), p=0.03 | - | - | Decreasing | |
| antidepressants inceptions | 37.55 (33.11 to 41.99), p<0.001 | - | - | Increasing | |
| antidepressant terminations | -524.9 (-720.3 to -329.5), p<0.001 | - | - | Decreasing |
12. Citation
Cite as: ‘Mehta H. and Glover G. Psychotropic drugs and people with learning disabilities or autism, 2019. Public Health England’