Ofsted Annual Report 2016/17 data summary
Published 13 December 2017

© Crown copyright 2017
This publication is licensed under the terms of the Open Government Licence v3.0 except where otherwise stated. To view this licence, visit nationalarchives.gov.uk/doc/open-government-licence/version/3 or write to the Information Policy Team, The National Archives, Kew, London TW9 4DU, or email: psi@nationalarchives.gov.uk.
Where we have identified any third party copyright information you will need to obtain permission from the copyright holders concerned.
This publication is available at https://www.gov.uk/government/publications/ofsted-annual-report-201617-education-childrens-services-and-skills/ofsted-annual-report-201617-data-summary
Each year, we write an Annual Report that says what we have found during our inspections. This summary sets out the main data behind it.
Read the full Annual Report. You can also look at the data in more detail by provider type or regional area on our Data View tool.
Early years
The term ‘early years’ covers the care and early education of children aged between 0 and 5.
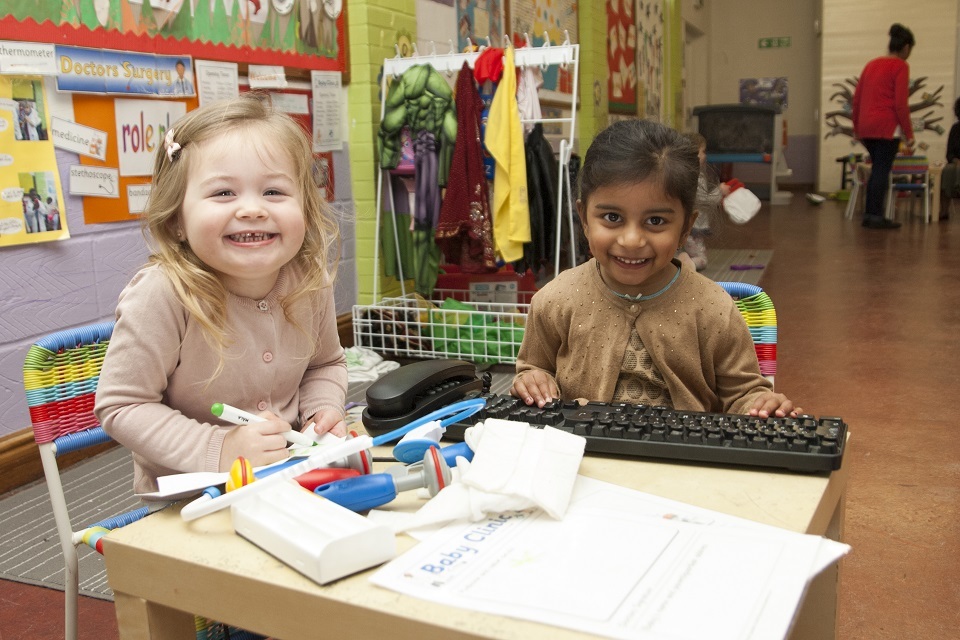
Two girls sitting at a table in a nursery.
Inspection outcomes
In the 2016 to 2017 academic year, we carried out inspections of 15,100 providers on the Early Years Register (EYR). We judged 88% of these providers good or outstanding in their overall effectiveness. We also carried out 102 short inspections of local authority (LA) maintained nursery schools, the vast majority of which remained good or outstanding.
Early years providers on the EYR continue to achieve high inspection outcomes. On 31 August 2017, 17% were judged outstanding and 76% good. Similarly, LA maintained nursery schools have exceptionally positive inspection outcomes, with 63% judged outstanding (Figure 1).
Overall effectiveness of early years providers at their most recent inspection, 31 August 2017
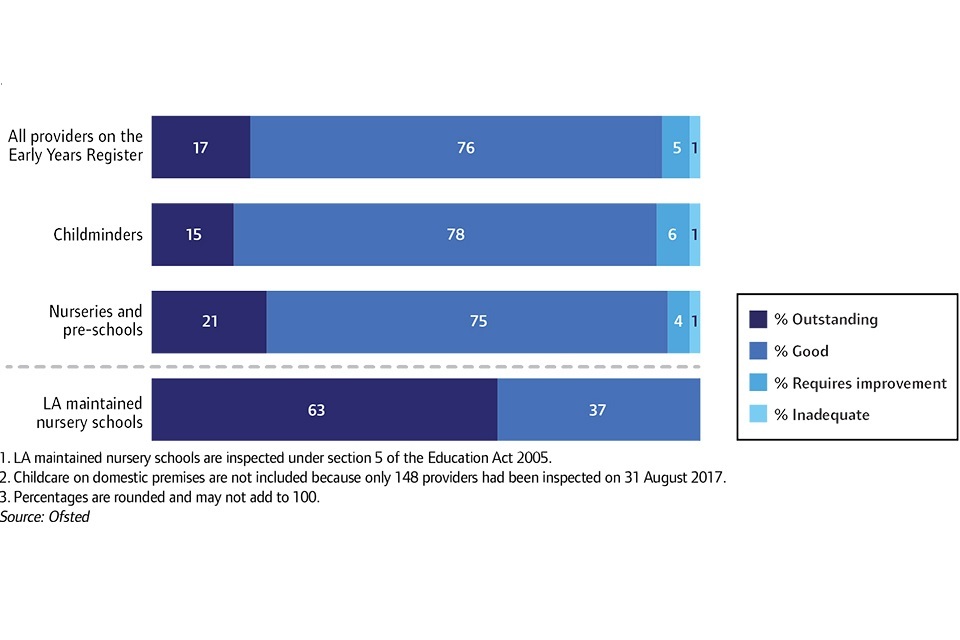
Overall effectiveness of early years providers at their most recent inspection, 31 August 2017
Early years as a whole has improved over time. In August 2012, 74% of providers were judged good or outstanding. By August 2017, this had increased to 94%.
This increase is mostly a growth in the proportions of providers judged good. The increase in the proportion of providers judged outstanding has been small.
There are several factors that have contributed to the rise in providers judged to be good. Find out why on page 22 in the Annual Report.
Getting to good in early years
There is a clear journey that providers must take to get to good, irrespective of whether they are childminders or nurseries and pre-schools.
Overwhelmingly, the LA maintained nursery schools we inspected this year that received a judgement of outstanding had exceptional leaders.
You can find out more about what good and outstanding early years providers do on page 24 of the Annual Report.
Providers and places
Overall, childcare provider numbers have decreased steadily since August 2012.
There has been a large decrease in childminders, a smaller decrease in nurseries and pre-schools, and no notable change in the number of home childcarers.
Despite decreasing numbers of providers, the number of childcare places has remained broadly stable since August 2012 (Figure 2). Between 1 September 2016 and 31 August 2017, childminder places decreased but there was a larger increase in the number of places offered by nurseries and pre-schools. This resulted in an overall increase of nearly 9,000 places. On 31 August 2017, there were almost 1.3 million childcare places offered by providers on the EYR.
Childcare providers and places on the Early Years Register over time, by provider type
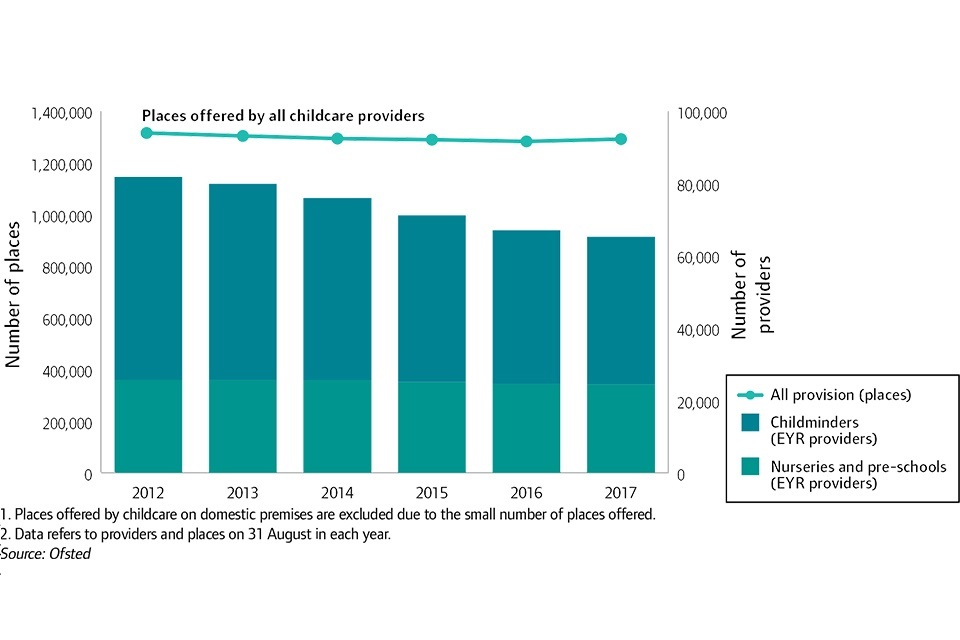
Childcare providers and places on the Early Years Register over time, by provider type
You can find out the full detail about this data on page 25 of the Annual Report.
Schools

Group of school children in a playground
Inspection outcomes
In the 2016 to 2017 academic year, we carried out over 5,400 full or short inspections of state-funded schools.
At the end of August 2017, 89% of schools were judged to be good or outstanding at their most recent inspection: the same proportion as at the end of the previous year. Grades remain higher for primary schools (90% good or outstanding) than for secondary schools (79% good or outstanding).
Overall effectiveness of state-funded schools at their most recent inspection, 31 August 2017
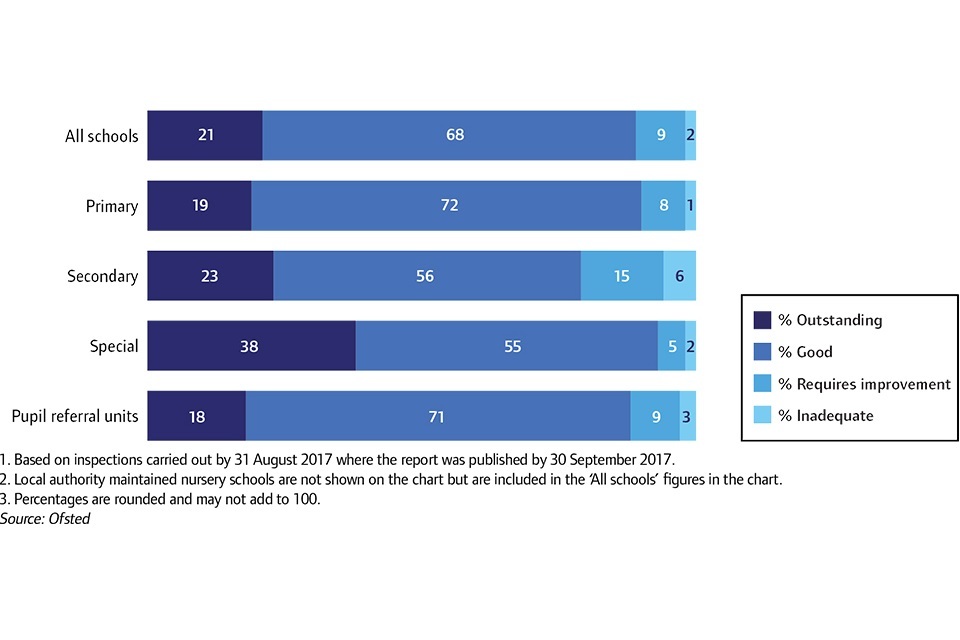
Overall effectiveness of state-funded schools at their most recent inspection, 31 August 2017
For some types of education, there have been small changes to the proportion of schools judged good or outstanding at their most recent inspection compared with August 2016:
- pupil referral units – 88% graded good or outstanding: an increase from 86% in 2016
- secondary schools – 79%: an increase from 78%
- special schools – 94%: an increase from 93%
- primary schools – 90%: the same proportion as in 2016
Between September 2016 and August 2017, around 1,200 schools closed. Of these, 94% then reopened as academies. As schools close and re-open, many lose their inspection history, depending on the reason for them closing. This can affect the national proportions of overall effectiveness grades. There are over 900 open schools with no inspection grade.
In November 2017, we consulted on changing our statistical methodology to take account of this. For more on this, see page 30 of the Annual Report.
Underperforming schools
At the end of August 2017, 9% of schools were judged to require improvement at their most recent inspection. This is a marked improvement from August 2012, when 28% of schools were judged ‘satisfactory’.
There are now around 1,900 schools that were judged to require improvement at their most recent inspection. Over 700 (38%) of these schools were also judged to require improvement or to be satisfactory at their previous inspection.
Many schools do improve from requires improvement to good or even to outstanding each year. However, a lower proportion of schools previously judged to require improvement improved at their inspection this year than in any other year. This trend is seen for both primary schools (33% did not improve this year) and secondary schools (58% did not improve). A higher proportion of schools also declined to inadequate this year.
Outcomes of inspections of schools that previously required improvement, 2013 to 2017
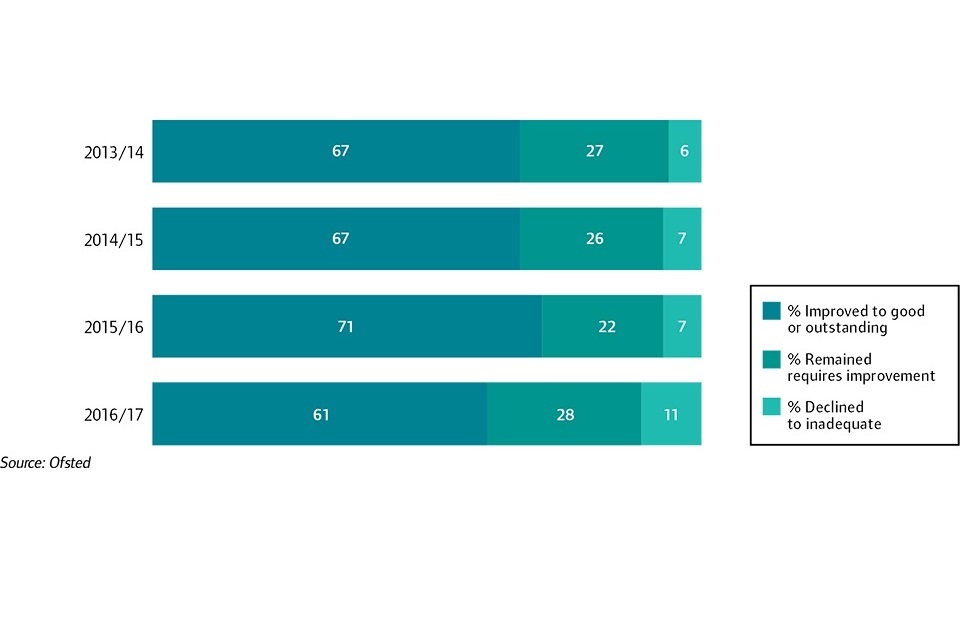
Outcomes of inspections of schools that previously required improvement, 2013 to 2017
Some of the schools that did not improve from requires improvement to good or outstanding this year have underperformed for a long time. Out of the 243 inspections of secondary schools that required improvement, 140 did not improve. Out of these 140, over a third (52) have been judged requires improvement, satisfactory or inadequate in every inspection they have had since 2005.
We analysed the inspection reports of these secondary schools that have been stuck at requires improvement or inadequate for a long time. The reports highlighted several common issues. You can read these in the full Annual Report on page 33.
Two per cent of schools were judged to be inadequate at their most recent inspection. Around two-fifths of these schools are academies and around three-fifths are maintained by local authorities.
Since the Education and Adoption Act came into force in April 2016, the DfE issues a directive academy order to any local authority maintained school judged to be inadequate. This requires the school to become an academy.
For more about inadequate schools, see page 38 in the Annual Report.
Deprivation
A common factor in the schools that do not improve to good or outstanding is that they have a higher proportion of deprived pupils. Fifty-five per cent of the schools that currently require improvement have high proportions of pupils from deprived areas.
Although these schools can face major challenges, great improvements can be, and are, made. Last year, 6 schools that had previously required improvement were judged to be outstanding at their latest inspection. Four of these were in the most deprived quintile of schools. You can find out more about how these schools have improved on page 31 of the Annual Report.
Having lots of children who are from deprived backgrounds may make improving a challenge, but it can be done.
Good and outstanding schools
In 2016 to 2017, we carried out over 3,500 short inspections of schools judged to be good at their previous inspection.
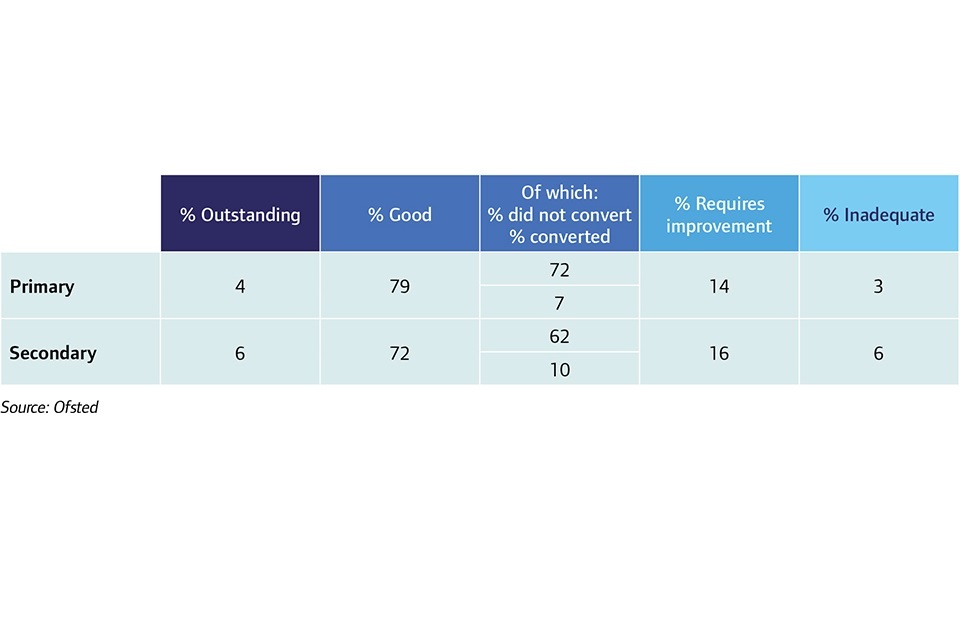
Primary schools were more likely to retain their good grade or improve to outstanding than secondary schools. Eighty-four per cent of primary schools stayed good or improved to outstanding, compared with 77% of secondary schools.
Outcomes of short inspections of previously good schools, 2016 to 2017 academic year
Outcomes of short inspections of previously good schools, 2016 to 2017 academic year
Twenty-one per cent of schools were judged to be outstanding at their most recent inspection. A slightly higher proportion of secondary schools than primary schools are outstanding (23% compared with 19%).
As part of the 2011 Education Act, the government made outstanding primary and secondary schools exempt from routine inspections. This means that we have been unable to carry out regular inspections of these schools. As a result, 8% of outstanding primary and secondary schools were last inspected as long ago as 2006 to 2007. However, more than half of outstanding primary and secondary schools have been inspected within the last 6 academic years.
Outstanding primary and secondary schools by the academic year of their most recent full inspection
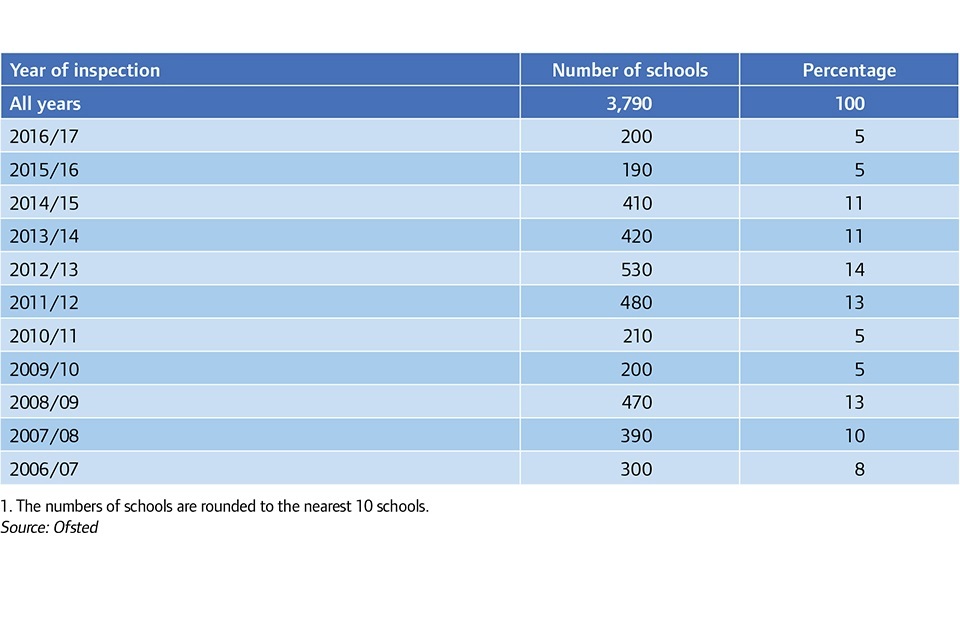
Outstanding primary and secondary schools by the academic year of their most recent full inspection
We are still able to inspect outstanding primary and secondary schools if their performance gives cause for concern. For more about this, see page 37 of the Annual Report.
Multi-academy trusts
Around 1,200 schools have closed this year and most have re-opened as academies. Nine out of 10 new academies now join a multi-academy trust (MAT) from the outset. In addition, the government encourages struggling academies to join a MAT.
As a result of these developments over the last few years, the number of MATs has grown.
For more about MATs, see page 39 of the Annual Report.
Independent schools
There are over 2,300 independent schools in England. We inspect almost 1,100 non-association independent schools. The other inspectorates inspect the schools that are members of associations, for example the associations that make up the Independent Schools Council. Around two-fifths of the schools that we inspect are special schools.
Overall effectiveness of non-association independent schools at their most recent inspection, 31 August 2017
Overall effectiveness of non-association independent schools at their most recent inspection, 31 August 2017
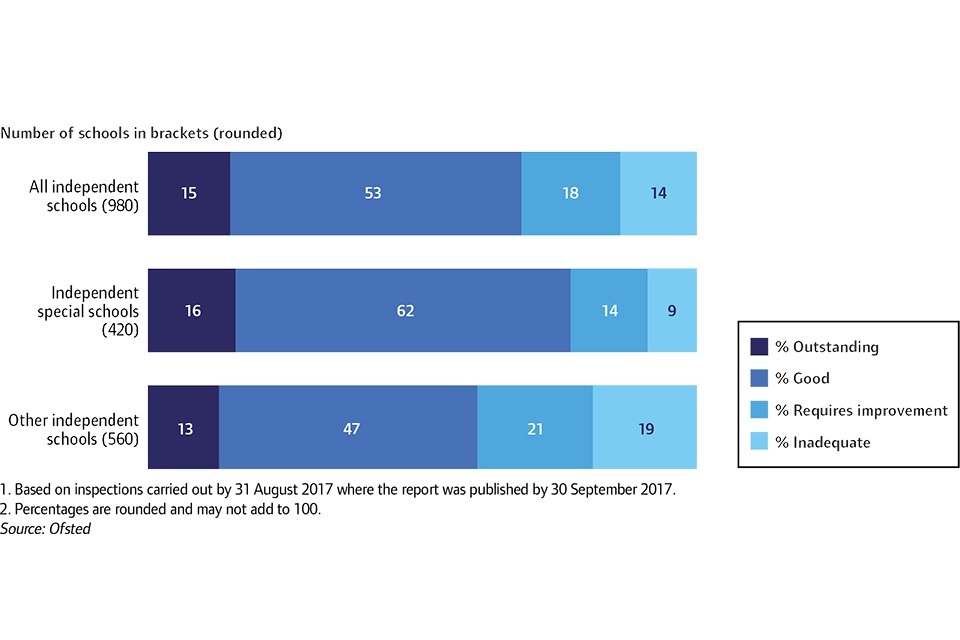
Over the last few years, the proportion of non-association schools judged good or outstanding at their most recent inspection has declined. This is driven by a decline in grades for the schools that are not special schools. The proportion of these schools that are good or outstanding at their most recent inspection has fallen from 79% in 2014 to 60% in 2017. Conversely, the outcomes for independent special schools have gradually improved during the same period, from 74% good or outstanding in 2014 to 78% in 2017.
Proportion of non-association independent schools judged good or outstanding at their most recent inspection, 31 August 2017
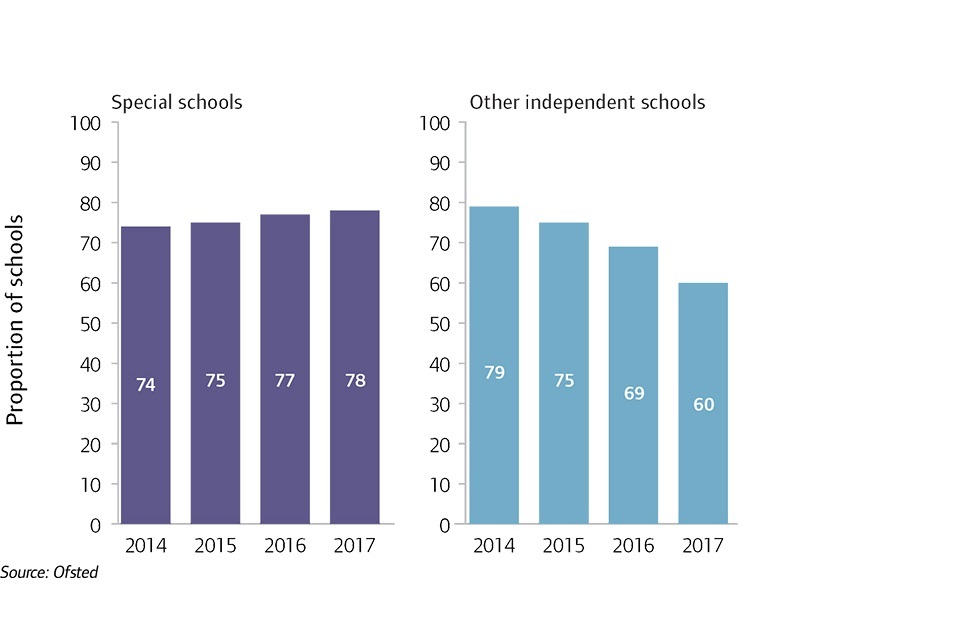
Proportion of non-association independent schools judged good or outstanding at their most recent inspection, 31 August 2017
There are several factors involved in the decline in the quality of independent schools:
- Ineffective safeguarding is of particular concern. We have found safeguarding to be ineffective in 17% of independent schools inspected since September 2015. Of the 124 independent schools judged inadequate for overall effectiveness since September 2015, 98 had ineffective safeguarding.
- There has been a sharp decline in inspection outcomes for independent faith schools. Almost half of these schools are judged less than good. Over a quarter are currently inadequate. However, there is a lot of variation within the different faith groups.
- Inadequate schools are taking too long to improve. Of the 141 non-association schools that are currently inadequate, over a quarter have been inadequate for over two years. Since September 2015, around three-fifths of action plans submitted to the DfE by schools were not considered to be good enough.
- Some non-association independent schools fail to improve because of ineffective and confused governance arrangements.
For more about the decline in the performance on independent schools, see pages 43 to 46 of the Annual Report.
Further education and skills
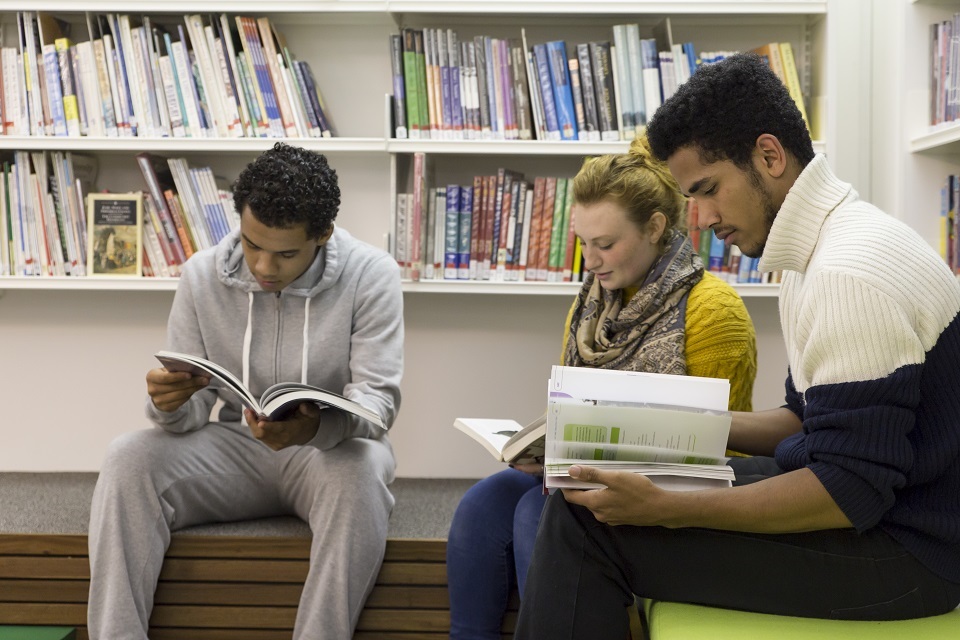
Three students looking at books in a library
The further education and skills sector is primarily made up of independent learning providers, colleges and community learning and skills providers.
This year, there has been an unusually high level of change in providers of further education and skills. This is because:
- providers delivering Advanced Learner Loans funded provision for adults have been included in scope for inspection
- several colleges have merged
- several sixth form colleges have become academies
This changeability is likely to accelerate in the 2017 to 2018 academic year as a consequence of changes to apprenticeship funding, further college mergers and more sixth form colleges becoming academies.
Inspection outcomes
Between 1 September 2016 and 31 August 2017, 392 further education and skills providers were inspected. This included 102 colleges, 159 independent learning providers (including employer providers) and 78 community learning and skills providers. Ofsted also contributed to the inspections of 41 prisons and young offender institutions, where the reports were published between 1 September 2016 and 31 August 2017.
On 31 August 2017, 8 out of 10 of the 1,052 further education and skills providers that had been inspected were judged to be good or outstanding at their most recent inspection. This is the same proportion at the end of last year.
Colleges
The proportion of general FE colleges judged to be good or outstanding at their most recent inspection declined by two percentage points, from 71% on 31 August 2016 to 69% on 31 August 2017.
The proportion of sixth form colleges judged to be good or outstanding declined by 8 percentage points, from 89% on 31 August 2016 to 81% on 31 August 2017. This decline can be attributed equally to a drop in performance at inspection this year and to a number of sixth form colleges converting to 16 to 19 academies or merging with other colleges, and hence being excluded from sixth form college official statistics.
For a detailed breakdown of these inspection outcomes, see page 52 of the Annual Report.
Independent learning providers
The proportion of independent learning providers (including employer providers) judged to be good or outstanding at their most recent inspection declined from 83% in 2016 to 80% this year. A higher proportion of providers previously judged good declined at inspection this year. Of the 159 providers inspected during the year, 57% were judged to be good or outstanding. This is 15 percentage points lower than last year.
For a detailed breakdown of these inspection outcomes, see page 56 of the Annual Report.
Apprenticeships
Inspection outcomes
In the 2016 to 2017 academic year, 189 providers were judged on the delivery of their apprenticeships:
- 6% were found to be outstanding
- 43% good
- 40% required improvement
- 11% were inadequate
At the point of inspection, these providers were delivering apprenticeships to 187,000 apprentices. Fifty-two per cent of the apprentices were in good or outstanding provision. This year, the proportion of apprentices training with inadequate providers was much higher compared with last year, at 20% (37,000 apprentices).
For a detailed breakdown of these inspection outcomes and their context, see page 57 of the Annual Report.
Social care

Young people playing pool
Local authorities
In the period since the last Ofsted social care annual report, 1 April 2016 onwards, we have inspected 57 LAs’ children’s services. Fifty-two LAs received a single inspection framework (SIF) inspection for the first time. Five received a SIF re-inspection, having previously been judged inadequate at their first. One hundred and forty-six of the 152 LAs have now received at least one SIF inspection.
Overall effectiveness of local authorities at their most recent SIF inspection, 31 August 2017
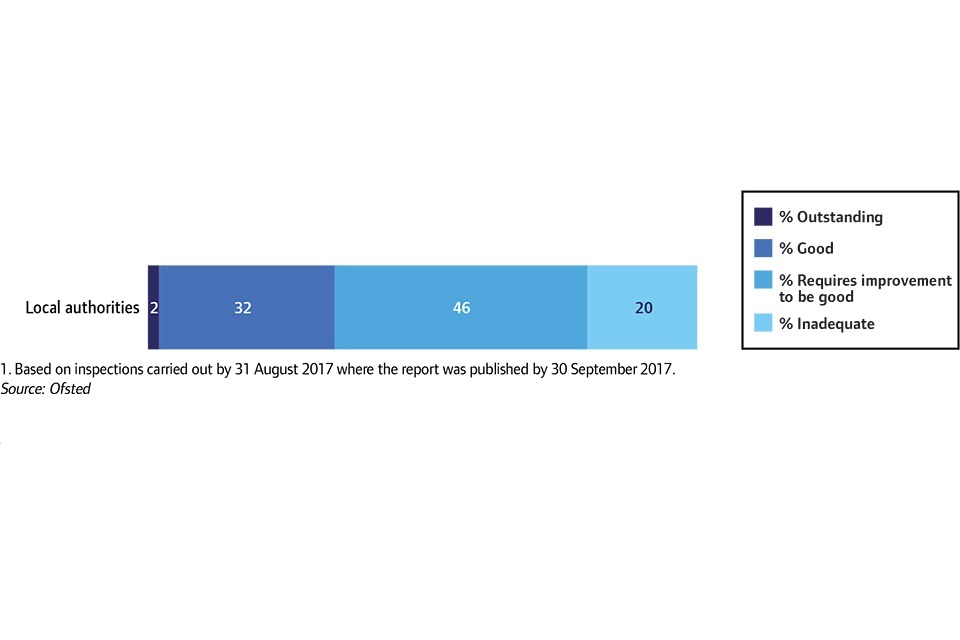
Overall effectiveness of local authorities at their most recent SIF inspection, 31 August 2017
Nationally, the overall effectiveness of LAs continues to improve. There is now a considerably higher proportion of LAs (34%) judged as either outstanding or good compared with at the time of the last social care annual report (26%).
A sample of LAs to show overall effectiveness judgements do not always tell the whole story of a LA
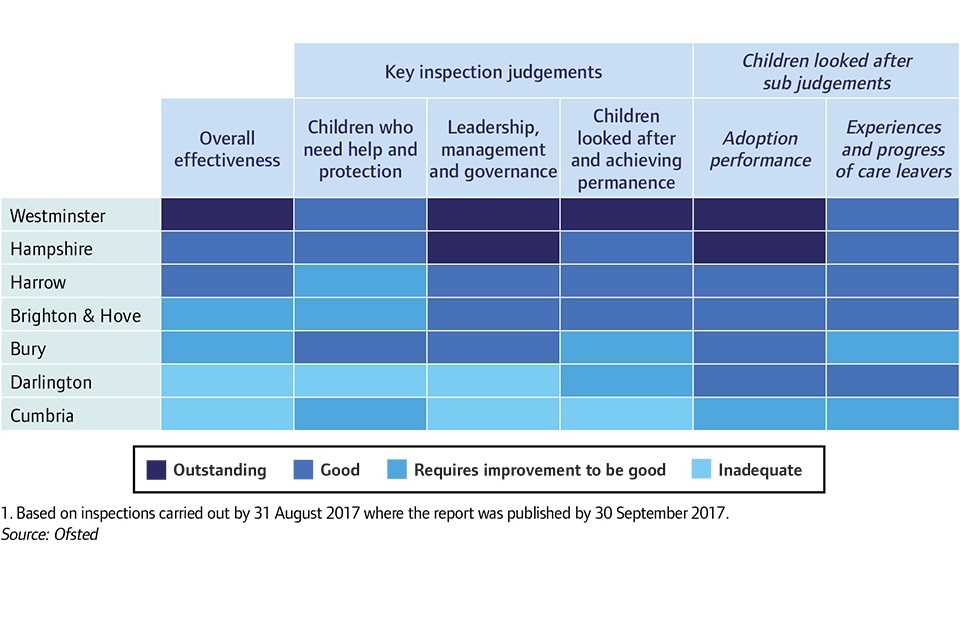
A sample of LAs to show overall effectiveness judgements do not always tell the whole story of a LA
To really understand what is happening for children in an LA, you need to look beyond the overall judgement. Very few LAs are inadequate in all areas of practice. For more on this, see page 68 of the Annual Report.
To support LAs in improving their services for children, we carry out quarterly monitoring visits to those judged inadequate. Since June 2016, we have carried out 82 of these monitoring visits to 26 inadequate LAs. These LAs had almost all been judged inadequate in the key area of children who need help and protection (23 LAs, 88%). Only 13 (50%) of the LAs had been judged inadequate for their support of children looked after.
For more detail about these monitoring visits, see page 68 of the Annual Report.
Local authority context
Recent research has suggested that the LAs with the lowest levels of deprivation get higher judgements. It also suggests that LAs that spend more money are more likely to receive a higher overall effectiveness judgement. We have begun looking at these findings and we found some correlation between the level of deprivation in the area and overall effectiveness. However, we found less correlation between spend and overall effectiveness.
For more about our findings, see page 70 of the Annual Report.
The future arrangements for inspecting local authorities
The new inspection of local authority children’s services (ILACS) will support the earlier identification of risk and success. For more about ILACS and other types of inspections in the future, see page 71 of the Annual Report.
Social care providers
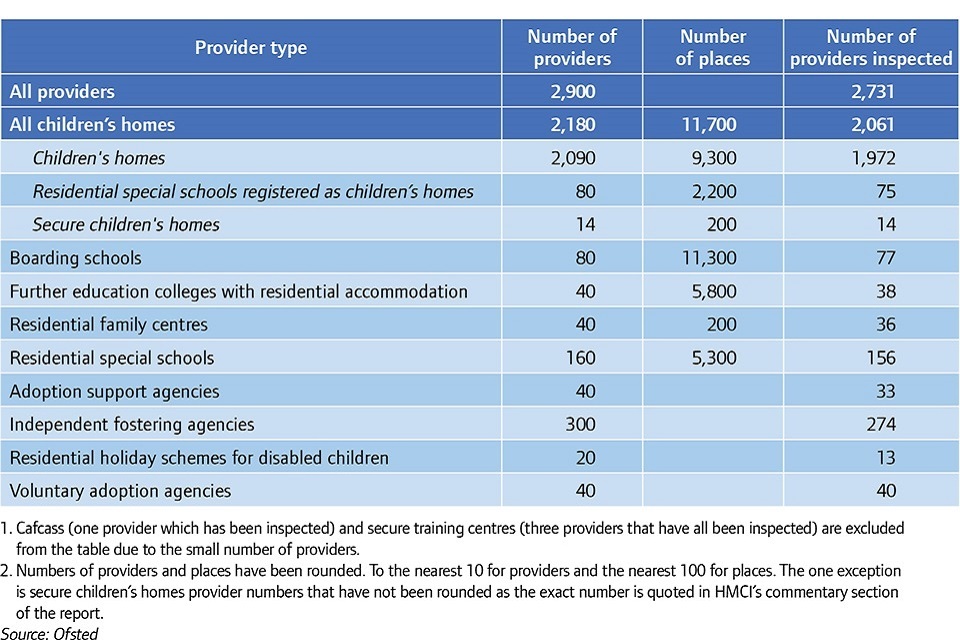
The following table summarises the size and shape of the social care providers we inspect.
Social care providers inspected by Ofsted, 31 August 2017
Social care providers inspected by Ofsted, 31 August 2017
Over two-thirds of social care providers are children’s homes. For details about children’s homes, see page 74 of the Annual Report.
For many years, the number of children’s homes in England stayed fairly static. However, since the 2016 social care annual report, the number of homes has increased at the fastest rate since we took over the responsibility of registering of homes. There has been an increase of more than 100 homes (5%) since March 2016.
Read more about the context, reasons and detail behind the change in the overall picture of children’s homes on page 75 of the Annual Report.
For changes and context for other types of social care providers, see page 77 of the Annual Report.
In brief:
- since March 2016, the number of residential special schools has decreased by 9 (5%)
- the latest fostering data from March 2016 shows that the number of fostering households across both independent fostering agencies (IFAs) and LA fostering agencies has changed very little, remaining at around 44,000
- the number of children placed through IFAs and LA fostering agencies in 2016 has remained the same, at around 52,000
Inspection outcomes
In April 2017, we introduced the social care common inspection framework. This covers all social care providers that we inspect. It brought all the former different inspection frameworks in line with each other.
For most types of social care provider, 80% or more of providers are judged good or outstanding. The exceptions to this are boarding schools and secure training centres.
Children’s homes that offer short-break care only are more often found to be good or outstanding than homes that offer long-term care only, or a combination of care. On 31 August 2017, 89% of short-break only homes were judged good or outstanding, compared with 82% of all other homes. However, the gap has continued its trend of narrowing by one percentage point each year.
Social care providers in England have continued to improve over the years. More providers are now judged good or outstanding than previously (84%). All but two of the individual provider types have also improved since the 2015 Annual Report. Only secure training centres have declined since our 2015 report. Currently, no secure training centres are judged good or outstanding.
There are a number of factors behind the improvements. Read more about these improvements and their context on page 79 of the Annual Report.
Secure children’s homes and secure training centres
There is a marked contrast between the inspection outcomes for secure children’s homes and secure training centres. While 86% of secure children’s homes have been judged good or outstanding, all of the secure training centres have been judged less than good.
For more about the context of secure children’s homes and secure training centres, see page 81 of the Annual Report.
Inspectors of secure children’s homes have noted strengths. You can read about this on the same page as above.
Our findings from inspections of secure training centres reflect the serious concerns held nationally about the experiences of children and young people in them. In particular, we are concerned about poor behaviour management and the safety of children and staff. For full details, see page 82 of the Annual Report.