National child measurement programme (NCMP): trends in child BMI
Published 4 June 2020

© Crown copyright 2020
This publication is licensed under the terms of the Open Government Licence v3.0 except where otherwise stated. To view this licence, visit nationalarchives.gov.uk/doc/open-government-licence/version/3 or write to the Information Policy Team, The National Archives, Kew, London TW9 4DU, or email: psi@nationalarchives.gov.uk.
Where we have identified any third party copyright information you will need to obtain permission from the copyright holders concerned.
This publication is available at https://www.gov.uk/government/statistics/national-child-measurement-programme-ncmp-trends-in-child-bmi-between-2006-to-2007-and-2018-to-2019/national-child-measurement-programme-ncmp-trends-in-child-bmi
1. Summary of key findings academic years 2006 to 2007 and 2018 to 2019
The key findings from this year’s child weight trends report are:
- obesity and excess weight prevalence is showing a downward trend in Reception boys which is driven by a decrease in prevalence for all pupils apart from those in the most deprived areas which showed no change
- Reception girls and Year 6 boys and girls are seeing an upward trend in the prevalence of obesity and excess weight which is driven by increases for pupils from the most deprived areas which is offsetting any decreases seen for pupils from the least deprived areas
- for Reception girls, the White British ethnic group was the only ethnic group showing an upward trend
- severe obesity is increasing among Reception girls and Year 6 boys and girls
- inequalities are widening in obesity, excess weight, and severe obesity across all age and sex groups
- this widening of inequalities is also seen when examining the slope index of inequality (SII) for obesity; the obesity inequalities gap is greater in Year 6 than in Reception, and is widening at a faster rate
A summary of obesity, excess weight and severe obesity trends for boys and girls in Reception and Year 6 are displayed in the table image below.
Table 1: Summary of trends in weight status by age and sex
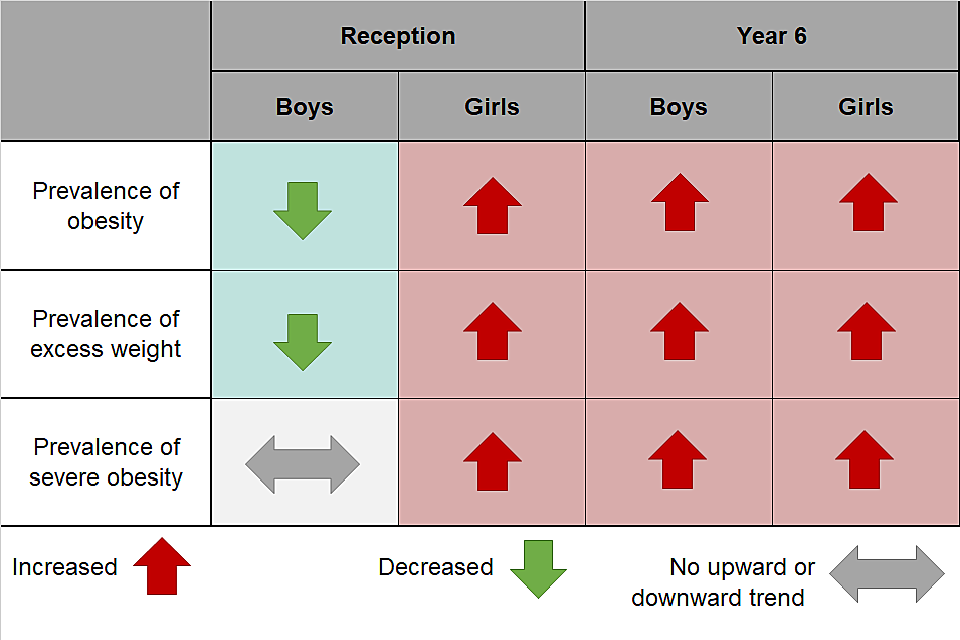
Table 1: Summary of trends in weight status by age and sex
2. Introduction
This report presents trends in children’s body mass index (BMI) from academic years 2006 to 2007 to 2018 to 2019 using National Child Measurement Programme (NCMP) data. The NCMP is an annual programme that measures the height and weight of over 1 million children in Reception (aged 4 to 5 years) and Year 6 (aged 10 to 11 years) in mainstream state-funded schools in England [footnote 1].
Although the NCMP only covers certain age groups, it includes most children in those year groups and around 95% of eligible pupils have taken part since 2014 to 2015. Low participation levels for Year 6 between 2006 to 2007 and 2008 to 2009 led to underestimation of obesity prevalence and these years are not included in the analysis for Year 6 when looking at prevalence trends over time.
The report depicts the trends in child BMI from the NCMP in clear, easy to understand charts and graphics. They display overall trends in obesity, excess weight, and severe obesity prevalence over time. The slope index of inequality (SII) for obesity provides an indication of whether existing health inequalities are widening or narrowing.
Throughout the report where an upward or downward trend is mentioned it is statistically significant.
The report will be a useful tool for practitioners and policy makers working on child weight and obesity at local, regional and national level.
The report is the latest in a series of analysis examining trends in child weight status overtime, and supersedes previous reports.
3. Trends in prevalence by weight category, age and sex
Figure 1 shows the prevalence of obesity, excess weight and severe obesity by school year and sex.
There are downward trends in:
- obesity and excess weight in Reception boys
There are upward trends in:
- obesity, severe obesity and excess weight in Reception girls and Year 6 boys and girls
Figure 1: Prevalence of obesity, severe obesity, and excess weight by school year and sex
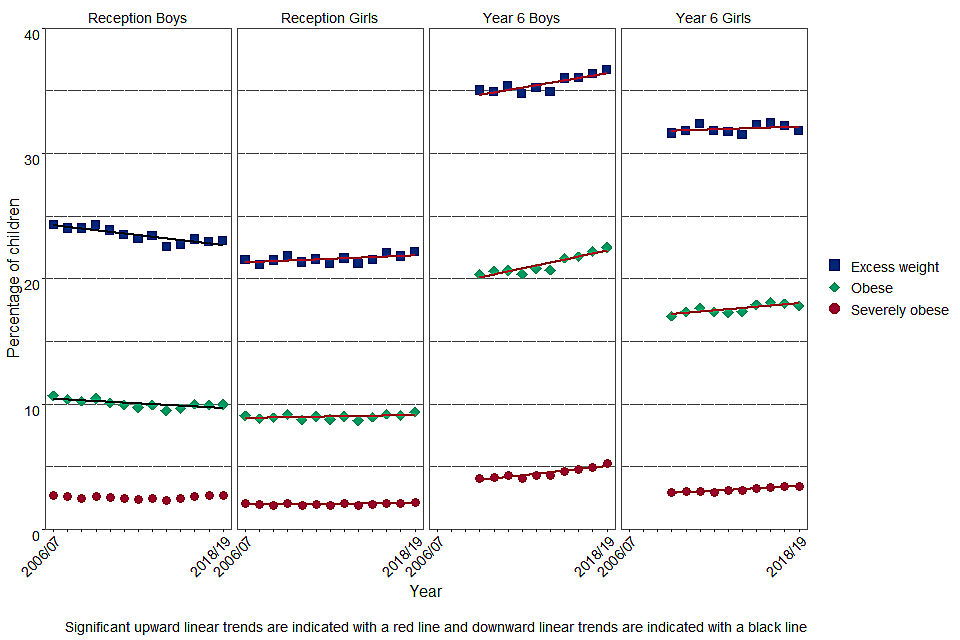
Figure 1: Prevalence of obesity, severe obesity, and excess weight by school year and sex
4. Trends in prevalence by weight category, age, sex and deprivation
There is a strong correlation between weight status and deprivation, with children living in the more deprived areas experiencing a higher prevalence of obesity. Data are presented using the Index of Multiple Deprivation (IMD)[footnote 2], a measure of relative deprivation for small areas. The small areas are divided according to their deprivation rank into 5 equal groups (quintiles), ranging from the most deprived (quintile 1) to the least deprived (quintile 5).
Figures 2a to 2d show prevalence by weight category and deprivation quintile for Reception boys (Figure 2a), Reception girls (Figure 2b), Year 6 boys (Figure 2c) and Year 6 girls (Figure 2d).
Inequalities are widening in obesity, excess weight, and severe obesity across all age and sex groups with the largest increases seen in the most deprived areas (quintile 1), however the pattern of change varies between these groups.
In Reception boys:
- prevalence of obesity and excess weight has decreased in all but the most deprived quintile
- those living in the most deprived quintile had an upward trend in severe obesity prevalence while those in the least deprived quintiles (4 and 5) had a downward trend
Figure 2a: Prevalence of obesity, severe obesity and excess weight in Reception boys by deprivation quintile
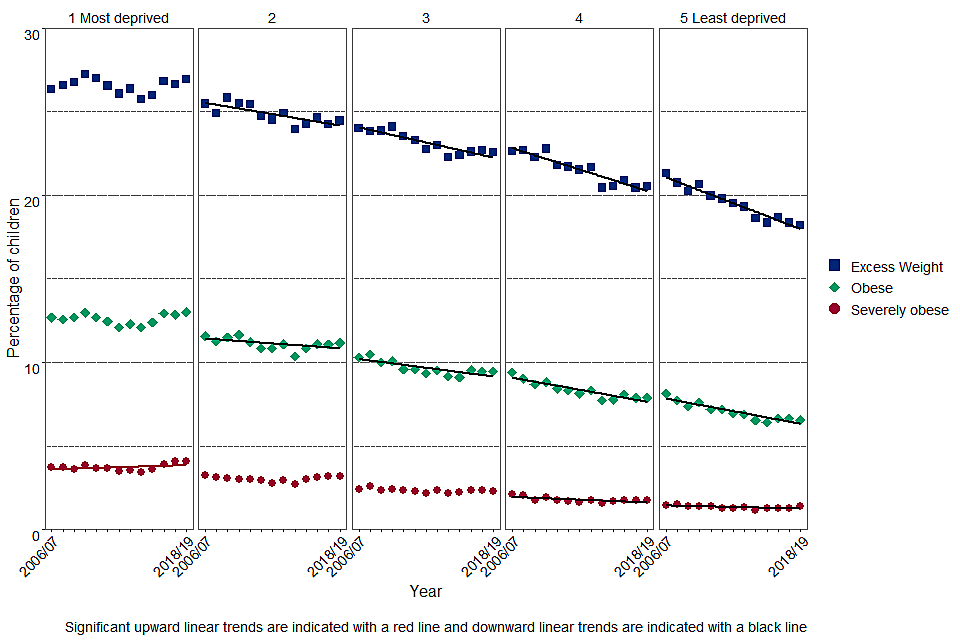
Figure 2a: Prevalence of obesity, severe obesity and excess weight in Reception boys by deprivation quintile
In Reception girls:
- in the most deprived quintile there has been an upward trend in obesity, excess weight, and severe obesity
- in the least deprived quintile, rates of obesity and excess weight are decreasing
Figure 2b: Prevalence of obesity, severe obesity and excess weight in Reception girls by deprivation quintile
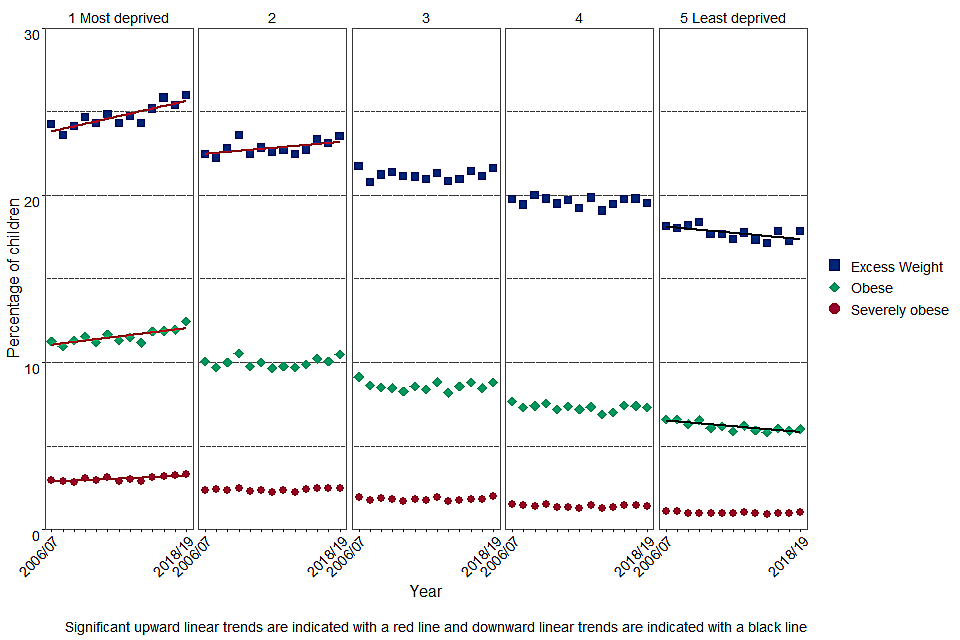
Figure 2b: Prevalence of obesity, severe obesity and excess weight in Reception girls by deprivation quintile
In Year 6 boys:
- prevalence of obesity, excess weight, and severe obesity is increasing across quintiles one to 3, with the most deprived quintile (one) showing the steepest increases
- in the least deprived quintile (5) we have seen a downward trend in obesity and excess weight
Figure 2c: Prevalence of obesity, severe obesity and excess weight in Year 6 boys by deprivation quintile
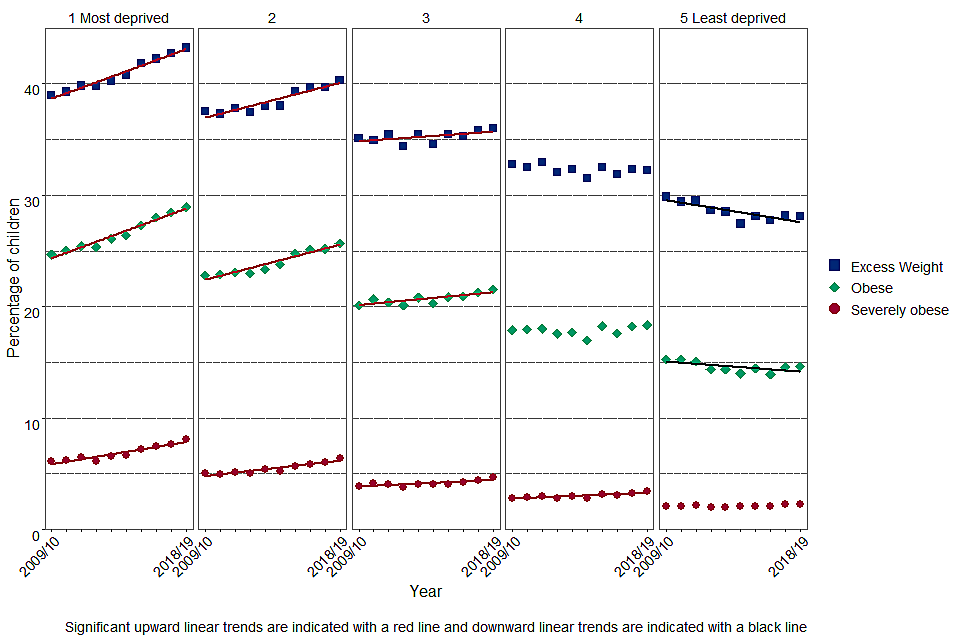
Figure 2c: Prevalence of obesity, severe obesity and excess weight in Year 6 boys by deprivation quintile
In Year 6 girls:
- there has been an increasing trend in obesity, excess weight, and severe obesity for those living in the most deprived quintile (one) and quintile 2
- we can see a downward trend in the prevalence of obesity and excess weight in the least deprived quintile, and prevalence of excess weight in quintile 4
Figure 2d: Prevalence of obesity, severe obesity and excess weight in Year 6 girls by deprivation quintile
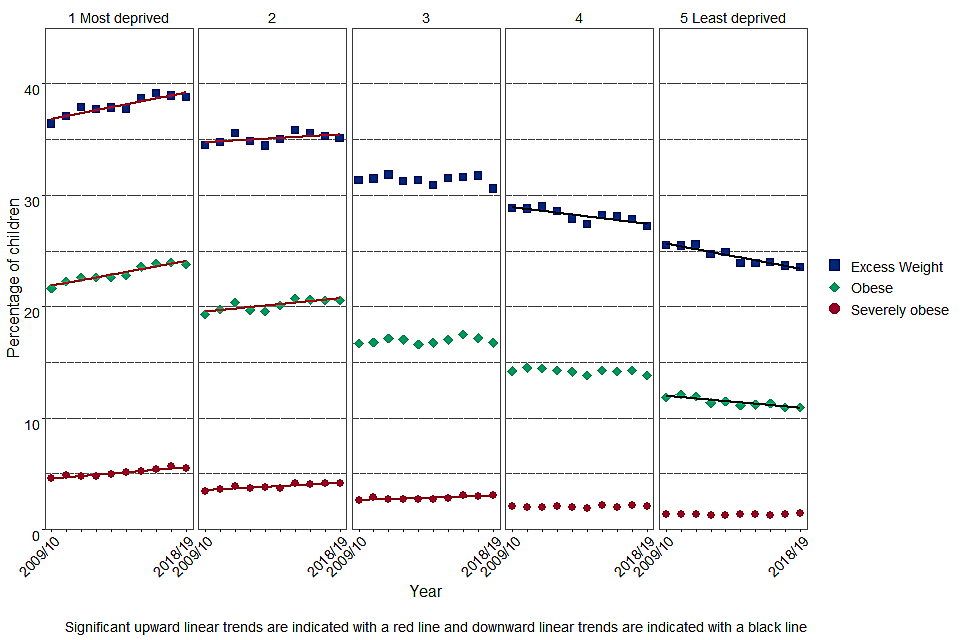
Figure 2d: Prevalence of obesity, severe obesity and excess weight in Year 6 girls by deprivation quintile
5. Trends in Slope Index of Inequality for obesity
The slope index of inequality (SII) for obesity presented in this report measures how obesity prevalence varies by levels of deprivation in communities of the population and summarises the level of inequality. Child obesity prevalence is calculated for each deprivation group (deciles representing approximately 10% of the population), then the SII is calculated based on these figures.
The SII takes account of health inequalities across the whole range of deprivation within England and summarises this in a single number[footnote 3]. The higher the value of the SII, the greater the inequality in obesity prevalence. Increasing SII over time indicates widening inequality.
Figure 3 shows the trend in SII for boys and girls in Reception and Year 6. The SII is greater in Year 6 boys and girls than in Reception boys and girls. This indicates there is greater inequality in Year 6 than in reception. The SII has been increasing at a faster rate in Year 6 than in Reception, illustrated by the steeper slope of the trend lines for Year 6.
Data between 2006 to 2007 and 2008 to 2009 for Year 6 is included in this analysis as the SII looks at the difference in prevalence between deprivation deciles in the same year, rather than changes in prevalence levels across years. The differences between deciles in the same year will be unaffected by the low participation rate assuming that each decile is affected in the same way.
Figure 3: Trend in Slope Index of Inequality for obesity, by school year and sex
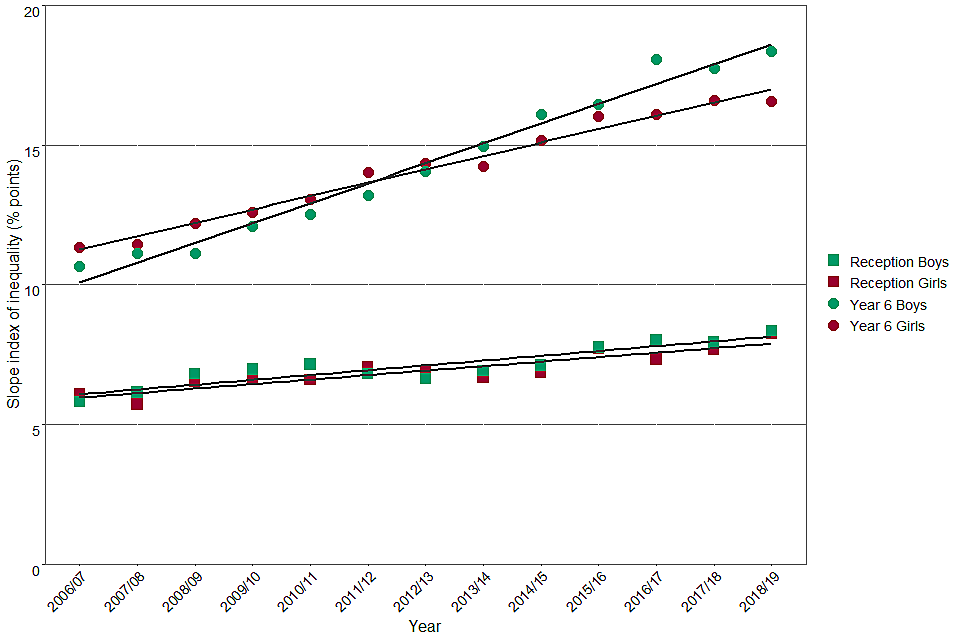
Figure 3: Trend in Slope Index of Inequality for obesity, by school year and sex
6. Trends in prevalence by weight category, age, sex and ethnicity
There are known inequalities between weight status and ethnicity. Figure 4a shows prevalence by weight category for boys in Reception by recorded ethnic group. In Reception boys:
- there was a downward trend for excess weight and obesity for White British boys, but an upward trend for severe obesity
- Indian, Bangladeshi, Black Caribbean and Black African boys also had downward trends for excess weight and obesity
- Indian boys showed a downward trend for severe obesity
Figure 4a: Prevalence of obesity, severe obesity and excess weight in Reception boys by ethnicity
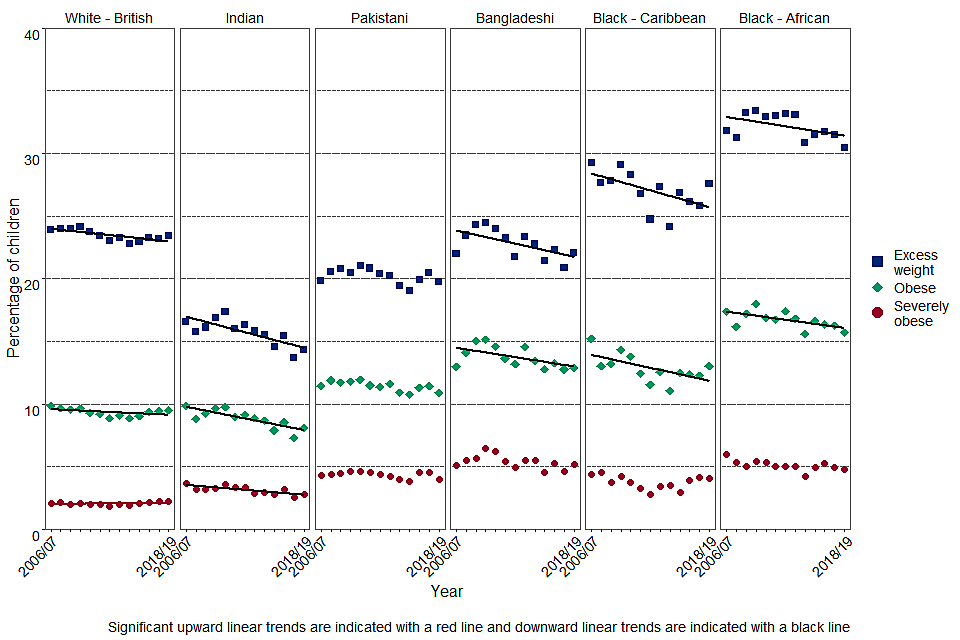
Figure 4a: Prevalence of obesity, severe obesity and excess weight in Reception boys by ethnicity
Figure 4b shows prevalence by weight category for girls in Reception by recorded ethnic group. In Reception girls:
- White British girls had upward trends in prevalence of obesity, excess weight, and severe obesity, whereas in Indian girls there were downward trends in all three weight categories
Figure 4b: Prevalence of obesity, severe obesity and excess weight in Reception girls by ethnicity
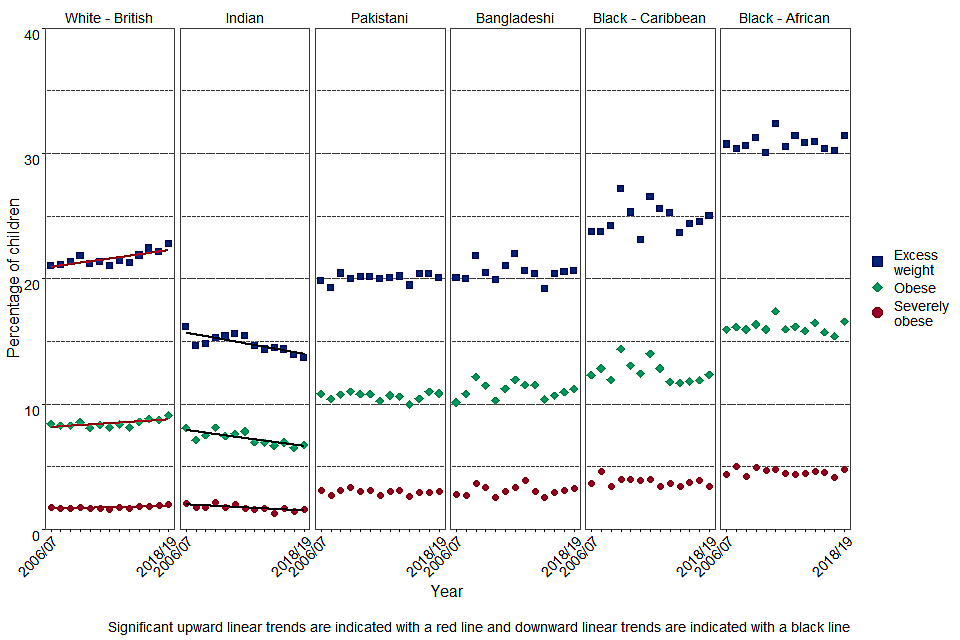
Figure 4b: Prevalence of obesity, severe obesity and excess weight in Reception girls by ethnicity
Figure 4c shows prevalence by weight category for boys in Year 6 by recorded ethnic group. In Year 6 boys:
- there was an upward trend for obesity and severe obesity in White British boys, along with Pakistani, Bangladeshi, Black Caribbean and Black African boys
- Indian, Pakistani, Bangladeshi and Black African boys also show upward trends for excess weight prevalence
- all groups except Indian boys had an increasing trend for severe obesity
Figure 4c: Prevalence of obesity, severe obesity and excess weight in Year 6 boys by ethnicity
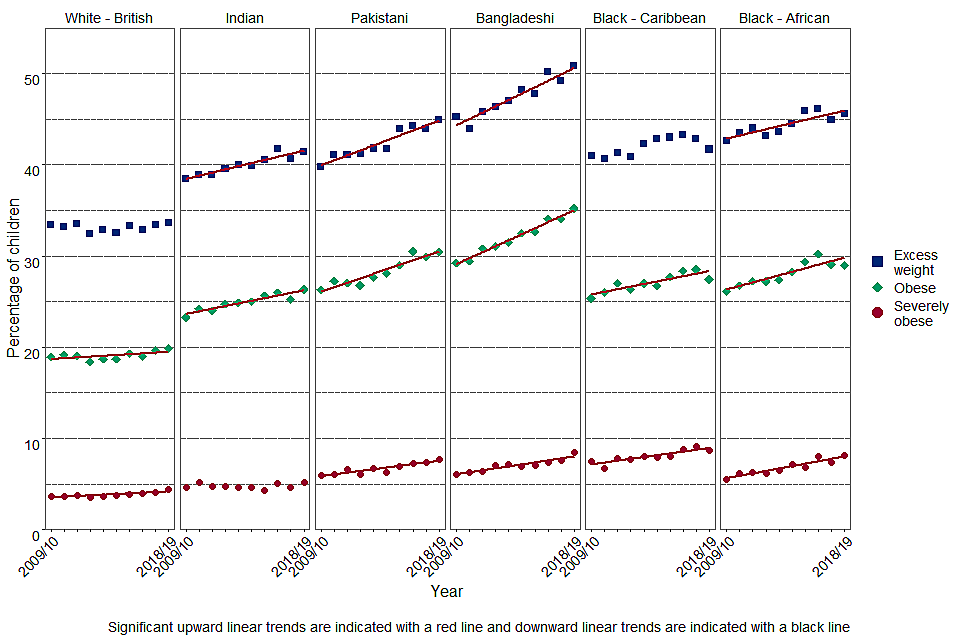
Figure 4c: Prevalence of obesity, severe obesity and excess weight in Year 6 boys by ethnicity
Figure 4d shows prevalence by weight category for girls in Year 6 by recorded ethnic group. In Year 6 girls:
- there was a downward trend for excess weight in White British girls, but an upward trend for severe obesity
- Pakistani, Black Caribbean and Black African girls also had an upward trend for severe obesity
- Pakistani, Bangladeshi and Black African girls showed upward trends for excess weight and obesity
- Indian girls also had an upward trend in obesity
Figure 4d: Prevalence of obesity, severe obesity and excess weight in Year 6 girls by ethnicity
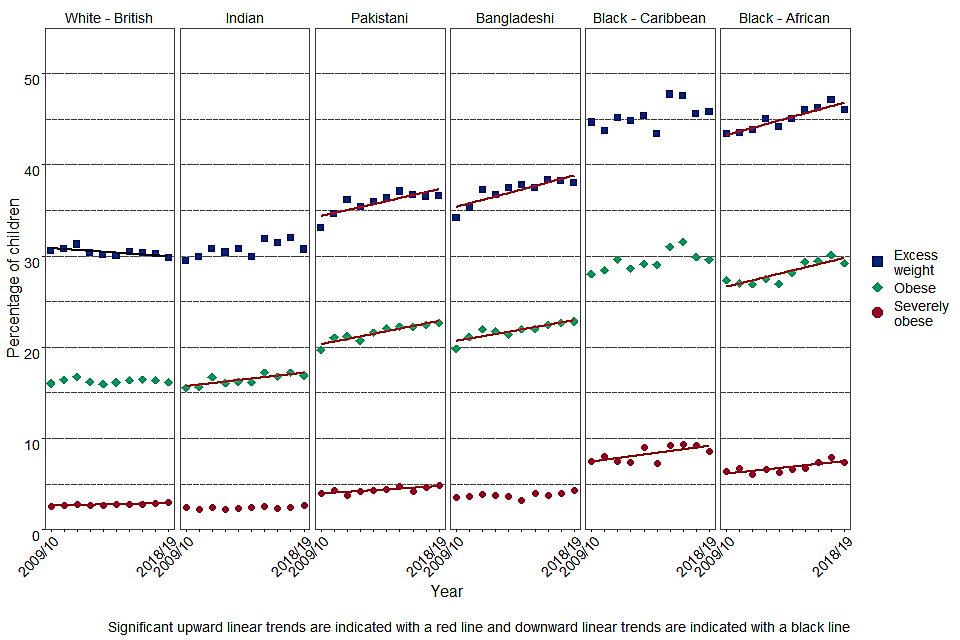
Figure 4d: Prevalence of obesity, severe obesity and excess weight in Year 6 girls by ethnicity
7. Methodology and further information
7.1 Methods
We used logistic regression models to assess the significance of the trends, using a Bonferroni correction for multiple hypothesis testing. A least squares trend line is depicted on the charts for illustrative purposes. For SII analysis, we used linear regression models to assess the significance of the trend. No Bonferroni correction was applied to SII analysis. R software was used to conduct the analyses and produce all the charts in this report.[footnote 4]
Trends in underweight and overweight are not examined in this report, unlike in previous reports in this series, to improve the readability of the charts. Prevalence of underweight, in children measured in the NCMP, is lower than that seen in the British 1990 reference population and is therefore not currently a public health concern. Trends in overweight prevalence need to be examined in the context of changes in prevalence of healthy weight and obesity. For example, increases in overweight prevalence will be a positive change if obesity prevalence is decreasing, but a negative change if healthy weight prevalence is decreasing.
The trends in weight category prevalence by ethnic group are restricted to groups with a sample size large enough to achieve meaningful results, therefore the Chinese ethnic group is not shown.
7.2 Body mass index classification definitions for population monitoring
Assessing the BMI of children is more complicated than for adults because a child’s BMI changes as they mature. Growth patterns differ between boys and girls, so both the age and sex of a child needs to be considered when estimating whether BMI is too high or too low. In England the British 1990 growth reference (UK90[footnote 5]) for BMI is recommended for use to determine weight status according to a child’s age and sex. Each child’s BMI is calculated and compared with the BMI distribution for children of their age and sex from the UK90 growth reference. For population monitoring purposes BMI is classified according to the following table using the UK90.
Figure 5: BMI classifications for population monitoring purposes
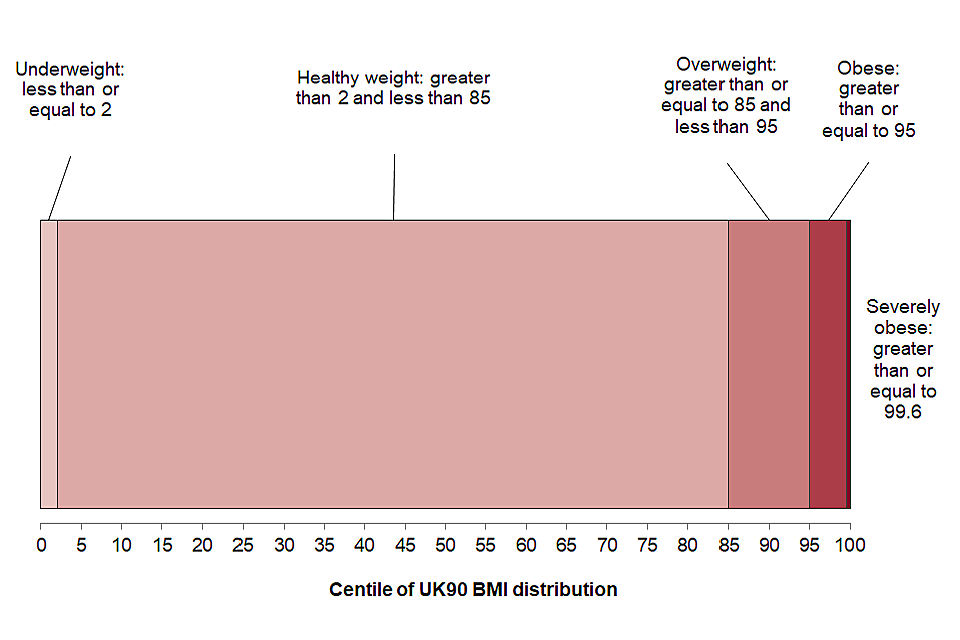
Figure 5: BMI classifications for population monitoring purposes
A list of Public Health England data and analysis tools on the topic of obesity can found on this website.
Further reports on obesity are available on the PHE Obesity Intelligence Knowledge Hub public library.
Responsible statisticians, product lead: Catherine Bray, Caroline Hancock
For queries relating to this document, please contact: ncmp@phe.gov.uk
-
Further information about the NCMP can be found on the NHS Digital website ↩
-
Public Health England, (2018). Methods, data and definitions ↩
-
R Core Team (2019). R: A language and environment for statistical computing. R Foundation for Statistical Computing, Vienna, Austria https://www.R-project.org/ ↩
-
Cole TJ, Freeman JV, Preece MA. Body mass index reference curves for the UK, 1990. Archives of Disease in Childhood 1995 73:25-29 ↩