Multiple sclerosis: prevalence, incidence and smoking status - data briefing
Published 4 February 2020

© Crown copyright 2020
This publication is licensed under the terms of the Open Government Licence v3.0 except where otherwise stated. To view this licence, visit nationalarchives.gov.uk/doc/open-government-licence/version/3 or write to the Information Policy Team, The National Archives, Kew, London TW9 4DU, or email: psi@nationalarchives.gov.uk.
Where we have identified any third party copyright information you will need to obtain permission from the copyright holders concerned.
This publication is available at https://www.gov.uk/government/publications/multiple-sclerosis-prevalence-incidence-and-smoking-status/multiple-sclerosis-prevalence-incidence-and-smoking-status-data-briefing
1. Purpose
This briefing shows findings from a study using a sample of anonymised primary care records in relation to the prevalence, incidence and demographic characteristics of patients with a diagnosis of multiple sclerosis (MS) in England.
The target audiences for this briefing are health commissioners and providers of services supporting patients with MS. These findings are available and presented at a national level with the intention that they are then interpreted to inform a local assessment of the needs of patients with MS and the provision of health and care services.
2. Main findings
-
MS estimated prevalence is 190 cases per 100,000 population, with 105,800 individuals in England
-
MS is more than twice as common in females than males, 272 versus 106 per 100,000 population
-
females in the 50 to 59 years age group are 3 times more likely than males of a similar age to have MS (578 and 184 per 100,000 population respectively)
-
highest prevalence for MS occurs in the 60 to 69 years age group for both sexes (females 598 and males 228 per 100,000 population)
-
75% of males and females with MS are aged between 40 and 74 years of age
-
MS estimated incidence of between 8 and 11 new cases diagnosed each year in England per 100,000 population
-
on average 4,950 new cases of MS are diagnosed each year in England
-
smoking rates among males with MS are likely to be higher than those in the general population
-
males and females with MS are more likely to be ex-smokers than males and females in the general population
3. Background
There is a lack of robust routine statistics on the prevalence, incidence and demography characteristics of individuals with MS in England. Knowledge of the frequency of diseases is an important requirement for understanding population health, commissioning and planning services, and understanding variation in health and care.
The Multiple Sclerosis Society estimate that around 110,000 people are living with MS in the UK, with 5,200 new cases diagnosed each year[footnote 1]. However, these estimates are based on data up to 2010 and so there is uncertainty as to the true size of the current MS population.
4. Methodology
4.1 Data source and cohort definition
Data source
This study uses a sample of anonymised primary care records provided by The Health Improvement Network (THIN)[footnote 2] dataset (version January 2018) to investigate cases of MS. The THIN population relates to all patients in the THIN dataset which:
- are permanently registered in the practice
- have no previous change of practice registration
- have acceptable medical data records
- are registered to a practice in England
This version of THIN dataset contains data covering 385 primary care practices in the UK, with over 3 million active patients. In England, 2% (129) of primary care practices participate in the network, accounting for 2% (1.2 million) of registered patients. In other parts of the UK participation by primary care practices in the network is higher. In Wales 19% of practices are part of THIN, while in Scotland the proportion is 14% and Northern Ireland is 12%.
Cohort definitions
The study cohort (patients with MS) are those patients of all ages that have primary care record in the THIN dataset with a diagnosis of MS recorded in the care record. MS diagnosis is defined as one of the 12 F20 Read code classifications recommended by the expert advisory group.
- F20..00 Multiple sclerosis
- F20..11 Disseminated sclerosis
- F200.00 Multiple sclerosis of the brain stem
- F201.00 Multiple sclerosis of the spinal cord
- F202.00 Generalised multiple sclerosis
- F203.00 Exacerbation of multiple sclerosis
- F204.00 Benign multiple sclerosis
- F205.00 Malignant multiple sclerosis
- F206.00 Primary progressive multiple sclerosis
- F207.00 Relapsing and remitting multiple sclerosis
- F208.00 Secondary progressive multiple sclerosis
- F20z.00 Multiple sclerosis NOS
In addition to the above clinical and age criteria, for a case to be eligible for inclusion, they also need to comply with operation criteria and have valid and complete activity dates associated with care and treatment of MS in the study period.
4.2 Algorithms for data calculations
Prevalence
The prevalence of MS in this study is calculated using the point prevalence method which is the number of eligible cases in the study cohort as a proportion of the eligible THIN population. The census date for the calculation is 31 January 2018, as this is the latest time point in the version of THIN dataset used.
The calculated rate is an estimate of the point prevalence of MS recorded in primary care records. For the remainder of this briefing the term prevalence will be used to describe the above recorded point prevalence calculation.
Incidence
The incidence of MS in this study is calculated using the one-year cumulative incidence rate methodology which is the number of new cases of MS diagnosed during a financial year (new cases of MS in the cohort data) divided by the number of people at risk in the population in that year. The population at risk per financial year is defined as THIN population at the beginning of that financial year that are not already diagnosed with MS. For this study the cumulative incidence was calculated for nine individual financial years up to March 2017.
The cumulative incidence methodology[footnote 3] is selected for this study due to limitations in calculating the MS-free periods precisely using THIN dataset. For the remainder of this briefing the term incidence will be used to describe the above recorded cumulative incidence calculation.
Estimates of MS for England
The number of diagnosed cases of MS in England is estimated by applying age and sex standardisation factors using an estimate of the England resident population[footnote 4] to the calculated prevalence. The derived value is an estimate of the number of people in England with a recorded diagnosis of MS on their primary care record.
The number of new diagnosed cases of MS in a financial year in England is estimated by applying standardisation factors using estimates of the England resident population[footnote 4] to the calculated incidence. The derived value is an estimate of the number of people in England with a new diagnosis of MS in the financial year, recorded in their primary care record.
4.3 Limitations of the study
The findings of this study are limited to analysis of the primary care records of those practices using the Vision[footnote 5]software and actively subscribing to the THIN data sharing protocols. In addition, the study relies on the practice of good quality and timely record keeping by primary care staff.
Known data issues exist around the format of activity dates and the use of default system values for month/day. An additional 187 MS cases were identified in the dataset that were excluded from the calculations due to incomplete data records. The inclusion of these cases increased the estimated prevalence to 205 per 100,000 population, equating to an estimated 114,200 cases in England.
In terms of age and sex of patients, THIN is a good representative of the population in England. However, the dataset is not a random sample and as such the dataset contains sampling bias in terms of geographical location and socioeconomic characteristics. This dataset does not include individuals that are in the prison system during the study period.
5. Epidemiology of Multiple Sclerosis
5.1 Estimated prevalence of MS in England
The findings of this study show that the prevalence of MS in England is estimated to be 190 people per 100,000 population. This estimate equates to 105,780 individuals as at the end of January 2018. MS in females is more than double that of the prevalence males, with 272 females per 100,000 population compared to 106 for males. Females accounted for over 72% of the recorded cases of MS in the cohort (Figure 1).
Figure 1: Multiple Sclerosis - estimated prevalence and estimated cases in England (January 2018, all ages, age and sex standardised prevalence)

Figure 1 Column chart of the estimated prevalence rate and number of cases of MS in England for all persons, males and females
The estimated prevalence of MS in females by age group is higher than for males in equivalent age groups, with the biggest variation of 3 times as many being in the 50 to 59-year age group. The rates being 578 and 184 per 100,000 population respectively. The variation remains more than 2 times the rate with all ages over 30 years, as shown in Figure 2.
Figure 2: Multiple Sclerosis - estimated prevalence by age group (age and sex standardised, per 100,000 population, England)
| Age band | Male | Female | Persons |
|---|---|---|---|
| 20 to 29 years | 42 | 65 | 54 |
| 30 to 39 years | 82 | 190 | 137 |
| 40 to 49 years | 143 | 358 | 249 |
| 50 to 59 years | 184 | 578 | 378 |
| 60 to 69 years | 228 | 598 | 414 |
| 70 to 79 years | 209 | 483 | 353 |
| 80 to 89 years | 89 | 203 | 155 |
Source: The PHE Neurology Dementia Intelligence team using The Health Improvement Network (THIN)
5.2 Estimated incidence of MS in England
The estimated incidence of MS was calculated for the 9 financial years 2008 to 2009 through to 2016 to 2017. Figure 3 shows that the incidence varies from 8 cases to 11 cases per 100,000 population each year in England during the period. The mean number of new cases of MS diagnosed each year, over the time period is estimated at 4,950.
Figure 3: Multiple Sclerosis – estimated incidence by financial year (England, all ages, crude rates)
| Financial year based on the first event date recorded | Incidence per 100,000 (95% Confidence Interval) | England extrapolated incidence |
|---|---|---|
| 2008 to 2009 | 9.5 (7.9 to 11.4) | 4,900 |
| 2009 to 2010 | 8.1 (6.6 to 9.9) | 4,300 |
| 2010 to 2011 | 8.3 (6.8 to 10.1) | 4,400 |
| 2011 to 2012 | 9.6 (8.0 to 11.5) | 5,100 |
| 2012 to 2013 | 9.7 (8.1 to 11.6) | 5,200 |
| 2013 to 2014 | 9.0 (7.5 to 10.9) | 4,900 |
| 2014 to 2015 | 8.7 (7.1 to 10.5) | 4,700 |
| 2015 to 2016 | 8.6 (7.1 to 10.4) | 4,800 |
| 2016 to 2017 | 11.0 (9.3 to 11.0) | 6,100 |
Source: The PHE Neurology Dementia Intelligence team using The Health Improvement Network (THIN)
Although there is a variation between the incidence for each financial year, the overlapping nature of the confidence intervals (CI) associated with rates suggests that there is no overall statistical change in the period.
5.3 Comparability of the MS findings of this study with other studies
The findings of this study show in 2018 that an estimated 105,800 people in England have a diagnosis of MS, with the prevalence estimated as 190 per 100,000 population. This study shows that on average 4,950 new cases of MS was diagnosed in England each year during the financial years ending 2009 to 2017, with a mean incidence rate of 9 per 100,000 population per year.
The only recent previous study published for England into MS was the IS Mackenzie study[footnote 6], published in 2013. This study, using data from 2010 and earlier, used an alternative sample dataset and methodology, by linking primary care records to hospital activity records. Mackenzie estimated that for England there were 104,450 people with MS, with a prevalence of 200 per 100,000 and 4,750 new cases diagnosed at a rate of 9 per 100,000 population.
Although the methodologies used in the 2 studies are different, the findings are very similar for the prevalence and are the same for the incidence. The numerical difference in the number of cases and new cases of MS in England between the studies will also be accounted for in part by the 6% increase in the England population between the study period of 2010 and 2018.
6. Living with Multiple Sclerosis
This section illustrates the findings of the analysis of the unadjusted data contained in the THIN database in relation to people with MS. The purpose is to describe the characteristics of people with MS in THIN dataset, however this may not be representative of all people with MS in England.
Annually there are around 100 new cases of MS diagnosed and reported in THIN dataset. For the presentation of the characteristics of new cases, data has been summed for the financial years April 2012 to March 2017.
6.1 People with MS recorded in THIN dataset
In the UK around 7,000 patients in THIN dataset have a diagnosis of MS. The largest proportion of people with MS, as shown in Figure 4, is 38% which have a registration in a primary care practice based in Scotland, 34% in England, 18% in Wales and 10% are registered in Northern Ireland. The number of MS cases reported by country in the UK reflects the coverage of the participating primary care practices in the THIN database. In THIN 40% of active patients are registered with practices in England, 29% in Scotland, 22% in Wales and 8% in Northern Ireland.
Figure 4: Multiple Sclerosis – number of patients in THIN dataset (UK and by country 2018)

Figure 4 Column chart of the number of patients with MS recorded in the THIN dataset for the UK, England, Northern Ireland, Scotland and Wales
Figure 5 shows that most of the cases of MS in the UK are in female patients, 72% with the number being approximately 1.5 times higher than that for male patients. The proportions of male and female cases are similar across the other countries of the UK.
Figure 5: Multiple Sclerosis – number of patients with MS in dataset (UK and country, sex, 2018)
| Males | Females | Total | |
|---|---|---|---|
| United Kingdom | 28% | 72% | 6,946 |
| England | 28% | 72% | 2,370 |
| Northern Ireland | 30% | 70% | 684 |
| Scotland | 27% | 73% | 2,668 |
| Wales | 30% | 70% | 1,224 |
Source: The PHE Neurology Dementia Intelligence team using The Health Improvement Network (THIN)
Age and sex characteristics of patients with MS
In England there are 1,705 females with a diagnosis of MS recorded in THIN dataset. In total 72% of females with MS are under 65 years of age, with 3% being under 30 years of age. 28% of females with MS are aged 65 years and older, with 9% being aged 75 years and older. The largest proportion of cases, as shown in Figure 6, occur in the 50 to 54 years and 55 to 59 years age groups, accounting for 29% of all females with MS. The median age of a female with MS is 55 to 59 years.
There are 665 males with a diagnosis of MS recorded in THIN dataset in England. 73% of males with MS are aged under 65 years, with 5% being under 30 years of age. In total 27% of males with MS are aged 65 years and older, 7% being 75 years and older. The largest proportion of the males with MS, 14%, occurs in the 50 to 54 years age group. The median age of a male with MS is 55 to 59 years.
Figure 6: Multiple Sclerosis - age distribution of patients with MS and GP registered population by sex (financial year April 2016 to March 2017 for MS cases, 2017 for registered population, England)

Figure 6 Column chart of proportion of patients in 5 year age bands by males and females of MS cases in THIN dataset and GP registered population
Age and sex characteristics of new cases of MS
Females accounted for 69% of all new cases of MS in THIN dataset in the period April 2012 to March 2017. In total 93% of new female cases are of working age (under 65 years of age), with 16% under 30 years of age. The highest proportion of new female cases occur in the 30 to 34 years and 40 to 44 years age groups, with 16% of new cases in each group, shown in Figure 7. The median age of females with a new diagnosis of MS is 40 to 44 years.
New cases of MS among males accounted for 31% of all new MS cases in the period. 93% of new male cases were of working age, 15% aged under 30 years. The highest proportion of new recorded diagnoses occurred in the 45 to 49 years age group (16%). The median age of males with a new diagnosis of MS is also 45 to 49 years of age.
Figure 7: Multiple Sclerosis – age distribution of new cases of MS and GP registered population by sex (financial years April 2012 to March 2017 for new cases, 2017 for registered population, England)
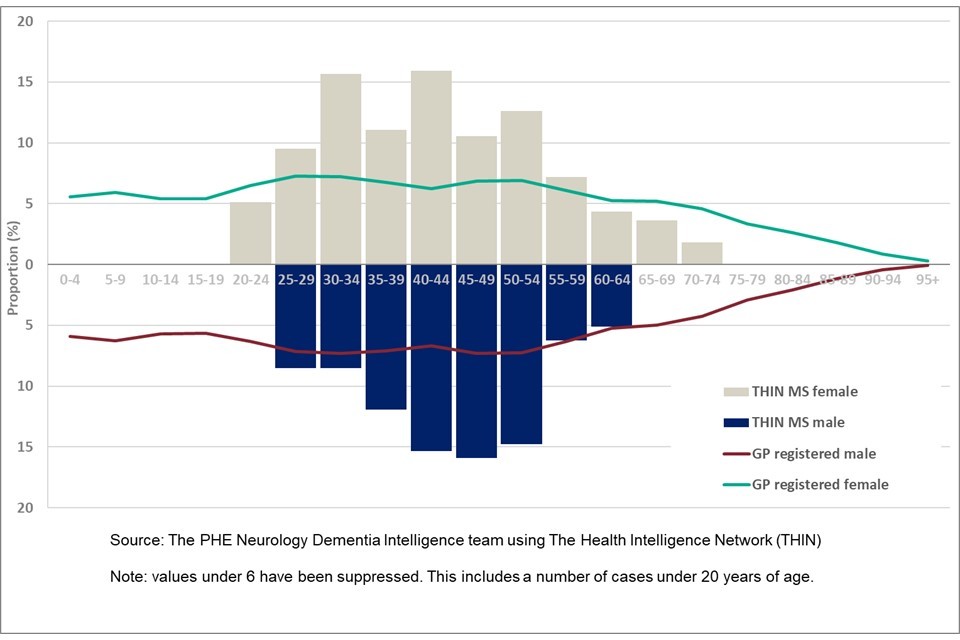
Figure 7 Column chart of proportion of patients in 5 year age bands by males and females of new MS cases in THIN dataset and GP registered population
6.2 Smoking status of patients with MS
Clinical Guidance 189[footnote 7] from The National Institute for Health and Care Excellence (NICE) recommends that following a diagnosis of MS, clinical staff should advise patients not to smoke as it may increase the progression of disability due to the condition. A view supported by the MS Society in their factsheet on MS and smoking[footnote 8]. Data on the smoking status of patients with MS and those without a diagnosis of MS was analysed using the latest recorded smoking status for each case, for those 18 years and older from the THIN dataset.
Figure 8: Smoking status of patients with MS and without MS by sex (2018, aged 18 years and over, England)

Figure 8 Stacked column chart of percentage by recorded smoking status of patients with and without a diagnosis of MS
Ex-smokers constitute the largest proportion of males with a diagnosis of MS, 41% (CI 37% to 45%), with this proportion larger than male ex-smokers without MS 30% (CI 30% to 30%), shown in Figure 8. The proportion of males with MS that are current smokers is also higher than those without a diagnosis, 23%(CI 20% to 26%) compared to 19% (19% to 19%).
In terms of non-smoker status, a smaller proportion of males with MS are classed as non-smokers 35% (CI 32% to 39%) compared to those without MS 45% (CI 45% to 45%).
For females with MS, the smoking status of the largest proportion of cases are non-smokers 47% (CI 45% to 50%), with the same status being the largest group without a diagnosis of MS, 55% (CI 55% to 55%). The proportions of females with MS that are current smokers is 15% (CI 13% to 17%), which is a similar proportion to those without diagnosis 14% (CI 14% to 14%). A larger proportion of females with MS are now ex-smokers 37% (CI 35% to 39%) compared to those without a diagnosis 28% (CI 28% to 28%).
It is noteworthy that the proportions of ex-smokers, among both males and females with MS, are larger than those without a diagnosis. Whether this is due to individuals listening to clinical advice and whether this behavioural change is being supported by PHE initiatives on stop smoking is unclear from the study findings. However, there are still 23% of males and 15% of females with MS that are classed as smokers, so there still remains opportunity to improve the public health messaging and support to individuals and clinical staff to achieve the published recommendations for the management of MS in adults.
7. Conclusions
The purpose of the current study was to provide insight into the characteristics of people with MS, working in collaboration with the MS Society and using the THIN dataset. The methodologies and approach used in this study reflect the capabilities and capacities within the Neurology Dementia Intelligence team at PHE.
The estimate for the prevalence of MS in England is 190 cases per 100,000 population, accounting for 105,800 cases. The prevalence rate for females is 2.5 times higher than for males, 272 and 106 cases per 100,000 population respectively. The largest variation in rates between the sexes is in the age group 50 to 59 years, with the rate for females in excess of 3 times the rate for males (578 and 184 respectively). The highest prevalence rates for MS in both sexes occurs in the 60 to 69 years age group (males 228 and females 598).
The incidence of MS in England has remained consistent across the study period, financial years ending 2009 through to 2017. Although the annual rates have varied between 8 and 11 new cases per 100,000 population each year, the changes are not statistically significant. Each year there are on average 4,950 new case of MS diagnosed and recorded in primary care records.
The clinical advice for those with a diagnosis of MS is to cease smoking. The study findings show that larger proportions of both males and females with MS were classed as ex-smokers, than those without MS. However, 23% of males and 15% females with MS were still classed as smokers.
Further research is required to better understand the smoking status of those with MS. Clearly there are smoking cession successes within this population group that should be evaluated. However, opportunities still exist to improve the public health messaging relating to smoking and the on-going management of MS. This could include improvements in communication between specialist neurological staff who support people with MS and the providers of local smoking cessation services.
8. Acknowledgements
The authors of this briefing are members of the neurology and dementia intelligence team at PHE – Marta Szczepaniak, Katie Dowden, Michael Jackson, Julia Verne and supported by Sue Foster and Simran Sandhu.
The authors would like to thank members of the Multiple Sclerosis Society for their support in this project and the access provided to the specialist clinical and academic expertise.
SRC Reference Number: 18THIN087. THIN is a registered trademark of Cegedim SA in the United Kingdom and other countries. Reference made to the THIN database is intended to be descriptive of the data asset licensed by IQVIA.
9. References
-
Multiple Sclerosis Society. MS in the UK 2018 (viewed August 2019) ↩
-
Vision Health. The Health Improvement Network (viewed August 2019) ↩
-
World Health Organisation. Basic Epidemiology (viewed March 2018) ↩
-
Office for National Statistics. Population estimates 2018 (viewed August 2019) ↩ ↩2
-
Mackenzie IS and others. Incidence and prevalence of multiple sclerosis in the UK 1990–2010: a descriptive study in the General Practice Research Database. Journal of Neurology, Neurosurgery and Psychiatry Online First, published on September 19, 2013 Volume 85 Issue 1 (viewed August 2019) ↩
-
National Institute for Health and Care Excellence: Multiple sclerosis in adults: management; Clinical guideline (CG186; 1.47) (viewed December 2019) ↩
-
Multiple Sclerosis Society: Smoking and MS (viewed August 2019) ↩