Environmental Monitoring For Health Protection (EMHP); wastewater monitoring of SARS-CoV-2 in England: 1 June to 23 August 2021
Published 30 September 2021
Applies to England

© Crown copyright 2021
This publication is licensed under the terms of the Open Government Licence v3.0 except where otherwise stated. To view this licence, visit nationalarchives.gov.uk/doc/open-government-licence/version/3 or write to the Information Policy Team, The National Archives, Kew, London TW9 4DU, or email: psi@nationalarchives.gov.uk.
Where we have identified any third party copyright information you will need to obtain permission from the copyright holders concerned.
This publication is available at https://www.gov.uk/government/publications/monitoring-of-sars-cov-2-rna-in-england-wastewater-monthly-statistics-1-june-to-23-august-2021/environmental-monitoring-for-health-protection-emhp-wastewater-monitoring-of-sars-cov-2-in-england-1-june-to-23-august-2021
Data showing the concentration of SARS-CoV-2 RNA detected in wastewater by the Environmental Monitoring for Health Protection (EMHP) wastewater monitoring programme.
Background on EMHP wastewater monitoring programme
People infected with COVID-19 shed the virus during daily activities such as going to the toilet and blowing noses. The virus enters the sewer system through sinks, drains and toilets. Fragments of the SARS-CoV-2 virus (the virus that causes COVID-19) can be detected in samples of wastewater (untreated sewage).
The EMHP programme, led by the Joint Biosecurity Centre (part of NHS Test and Trace and soon to be part of UKHSA), tests sewage for fragments of SARS-CoV-2 RNA. Untreated influent samples are taken from approximately 270 sewage treatment works (STWs) in England, 4 times a week (see figures 1 to 9 below). EMHP also sample from sewer network sites (manholes). Data from these sites are not included in this publication as sewer network sites fall within STW catchments. Further detail about EMHP wastewater coverage can be found in the publication Wastewater testing coverage data for the Environmental Monitoring for Health Protection (EMHP) programme.
The programme helps identify where the virus is circulating in England, detecting spikes in prevalence and presence of variants. Findings are reported to national decision makers and local stakeholders on a regular basis, helping to inform national strategy and localised action. Wastewater analysis has the benefit of detecting the virus regardless of whether people have symptoms or whether they have a test. Wastewater monitoring complements other testing programmes and public health actions to help protect against the threat of new variants.
As the threat of variants has emerged, the programme plays an important role in the detection of mutations of the virus, variants of concern (VOCs) and variants under investigation (VUIs). This is achieved through genomic sequencing of wastewater samples, to provide an indication of where VOCs and VUIs may be present across England. Insights from wastewater monitoring are shared with local and national decision makers, to help inform the action that they can take to stop further transmission.
The programme is led by the Joint Biosecurity Centre (JBC) and run in partnership with the Department for Environment, Food and Rural Affairs (DEFRA), the Environment Agency (EA), the Centre for Environment, Fisheries and Aquaculture Science, academia (Cefas) and water companies. It provides coverage of approximately 40 million people across England. The EMHP team coordinates with programmes in the devolved administrations to provide UK-wide wastewater monitoring.
EMHP sampling sites
EMHP sample at sewer network sites (manholes in the street which generally serve a local area) and sewage treatment works (STWs) (which generally serve wider areas such as a city or town). Associated with every STW and sewer network site is a catchment; the geographical area from which wastewater flows into the sampling location. This publication reports data from STWs. Data from sewer networks are not included because sewer network sites almost always fall within the catchment of a STW. In addition, EMHP change sampling strategy and locations of sewer network sites to meet epidemiological priorities (for example to support local public health response). Figures 1 to 9 show the location of STWs that EMHP sample at in each region.
Figure 1: map showing the location of STWs sampled in the East Midlands
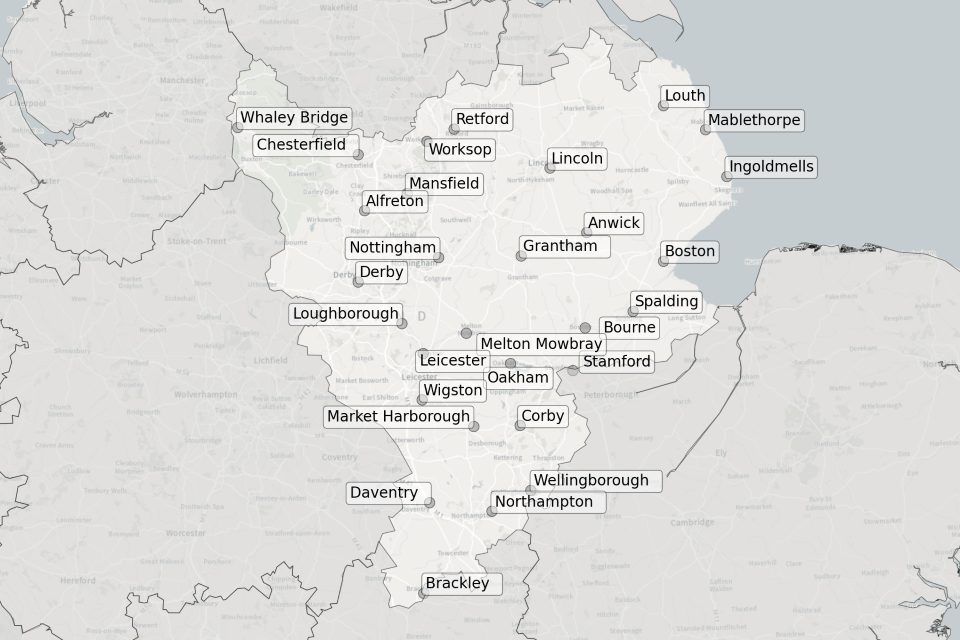
Figure 1 is a map showing the location of these sewage treatment works sampled in the East Midlands:
- Alfreton
- Anwick
- Boston
- Bourne
- Brackley
- Chesterfield
- Corby
- Daventry
- Derby
- Grantham
- Ingoldmells
- Leicester
- Lincoln
- Loughborough
- Louth
- Mablethorpe
- Market Harborough
- Mansfield
- Melton Mowbray
- Northampton
- Nottingham
- Oakham
- Retford
- Spalding
- Stamford
- Wellingborough
- Whaley Bridge
- Wigston
- Worksop
Figure 2: map showing the location of STWs sampled in the East of England
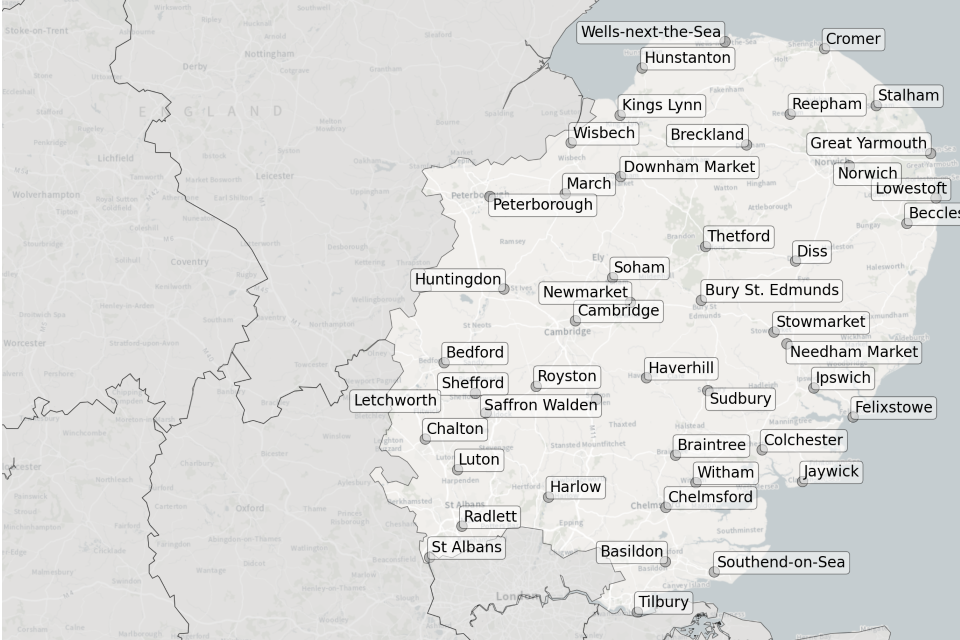
Figure 2 is a map showing the location of these sewage treatment works sampled in the East of England:
- Basildon
- Beccles
- Bedford
- Braintree
- Breckland
- Bury St Edmunds
- Cambridge
- Chalton
- Chelmsford
- Colchester
- Cromer
- Diss
- Downham Market
- Felixstowe
- Great Yarmouth
- Harlow
- Haverhill
- Hunstanton
- Huntingdon
- Ipswich
- Jaywick
- Kings Lynn
- Letchworth
- Lowestoft
- Luton
- March
- Needham Market
- Newmarket
- Norwich
- Peterborough
- Radlett
- Reepham
- Royston
- Saffron Walden
- Shefford
- Soham
- St Albans
- Stalham
- Stowmarket
- Sudbury
- Southend-on-Sea
- Thetford
- Tilbury
- Wells-next-the-Sea
- Wisbech
- Witham
Figure 3: map showing the location of STWs sampled in London
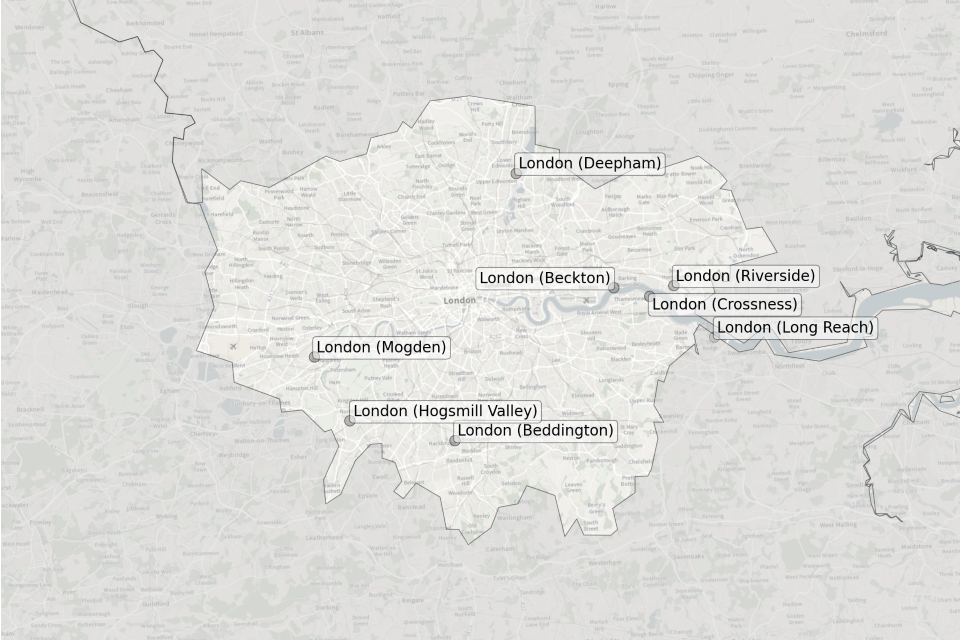
Figure 3 is a map showing the location of these sewage treatment works sampled in London:
- Beckton
- Beddington
- Crossness
- Deepham
- Hogsmill Valley
- Long Reach
- Mogden
- Riverside
Figure 4: map showing the location of STWs sampled in the North East
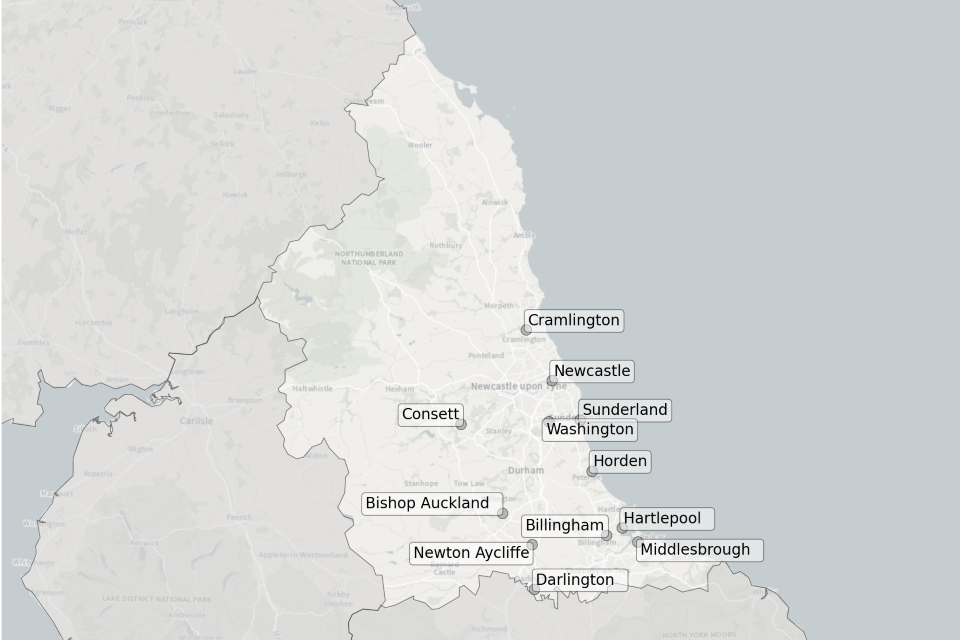
Figure 4 is a map showing the location of these sewage treatment works sampled in the North East:
- Billingham
- Bishop Auckland
- Consett
- Cramlington
- Darlington
- Hartlepool
- Horden
- Middlesbrough
- Newcastle
- Newton Aycliffe
- Sunderland
- Washington
Figure 5: map showing the location of STWs sampled in the North West
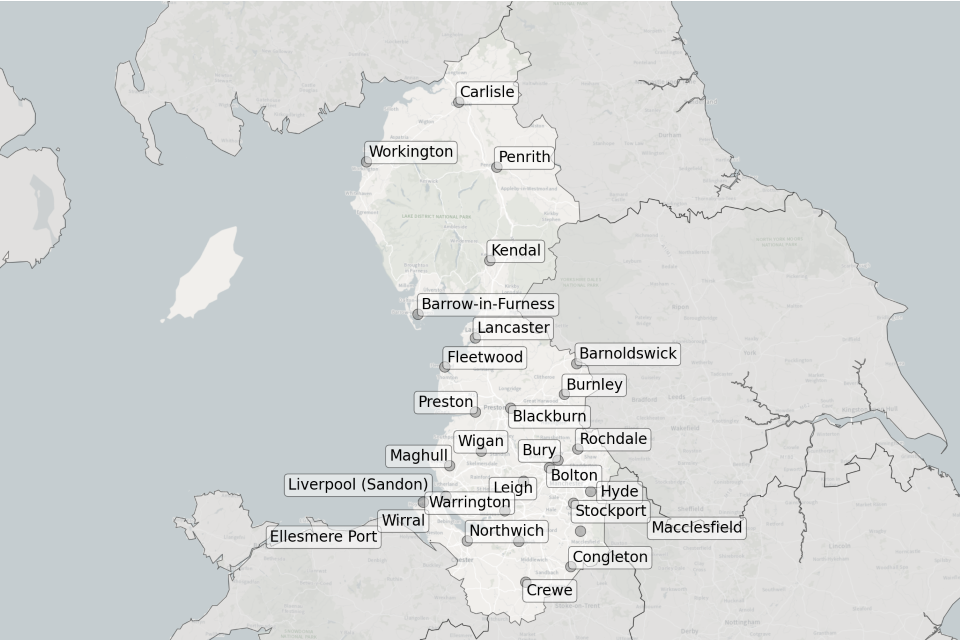
Figure 5 is a map showing the location of these sewage treatment works sampled in the North West:
- Barnoldswick
- Barrow-in-Furness
- Blackburn
- Bolton
- Burnley
- Bury
- Carlisle
- Congleton
- Crewe
- Ellesmere Port
- Fleetwood
- Hyde
- Kendal
- Lancaster
- Leigh
- Liverpool (Sandon)
- Macclesfield
- Maghull
- Northwich
- Penrith
- Preston
- Rochdale
- Stockport
- Warrington
- Wigan
- Wirral
- Workington
Figure 6: map showing the location of STWs sampled in the South East
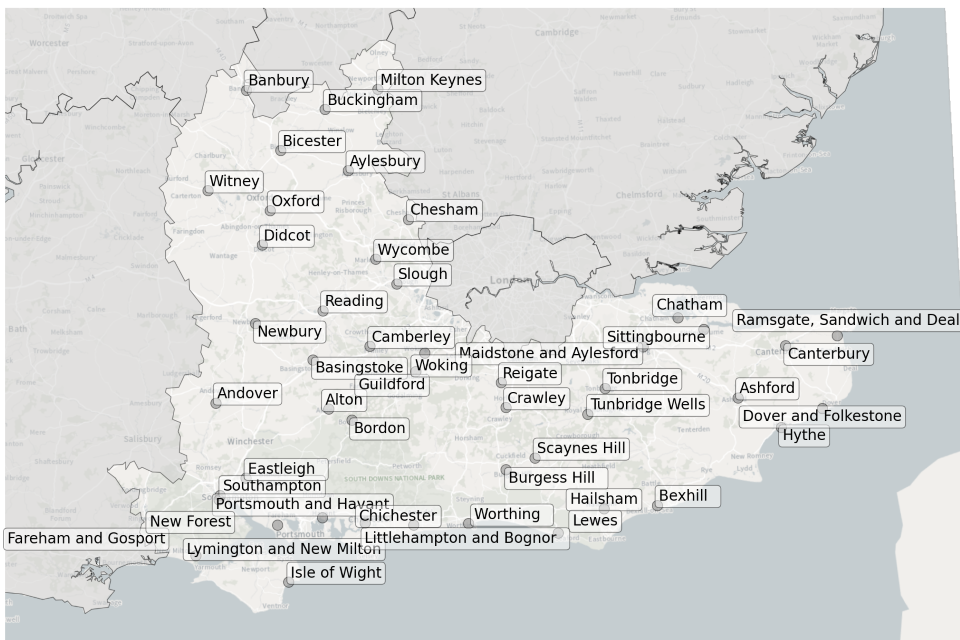
Figure 6 is a map showing the location of these sewage treatment works sampled in the South East:
- Andover
- Alton
- Ashford
- Aylesbury
- Banbury
- Basingstoke
- Bexhill
- Bicester
- Bordon
- Buckingham
- Burgess Hill
- Camberley
- Canterbury
- Chatham
- Chesham
- Chichester
- Crawley
- Didcot
- Dover and Folkestone
- Eastleigh
- Fareham and Gosport
- Guildford
- Hailsham
- Hythe
- Isle of Wight
- Lewes
- Littlehampton and Bognor
- Lymington and New Milton
- Maidstone and Aylesford
- Milton Keynes
- Newbury
- New Forest
- Oxford
- Portsmouth and Havant
- Ramsgate, Sandwich and Deal
- Reading
- Reigate
- Scaynes Hill
- Sittingbourne
- Slough
- Southampton
- Tonbridge
- Tunbridge Wells
- Witney
- Woking
- Worthing
- Wycombe
Figure 7: map showing the location of STWs sampled in the South West
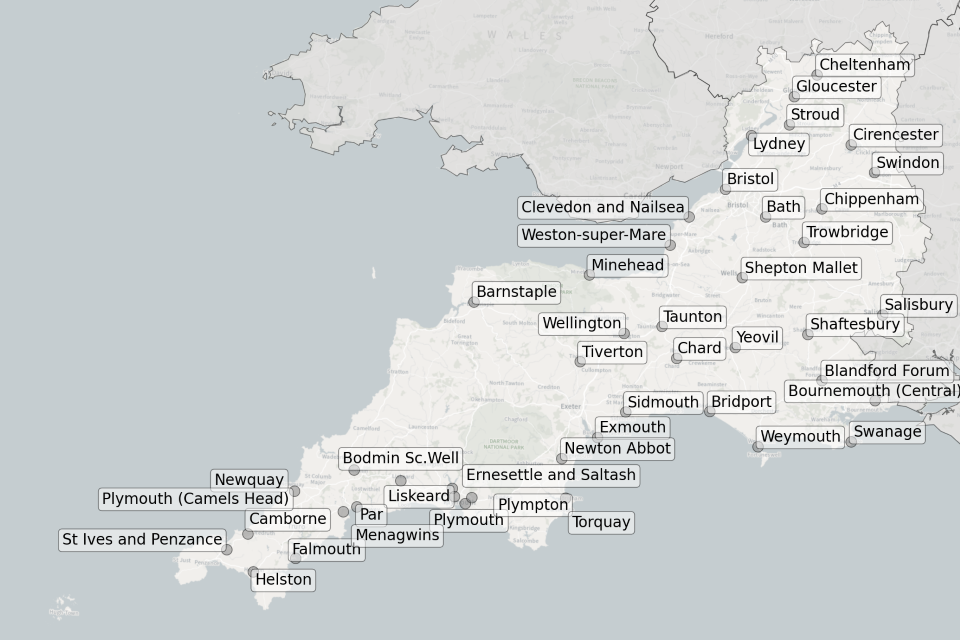
Figure 7 is a map showing the location of these sewage treatment works sampled in the South West:
- Barnstaple
- Bath
- Blandford Forum
- Bodmin Sc Well
- Bournemouth (Central)
- Bridport
- Bristol
- Camborne
- Chard
- Cheltenham
- Chippenham
- Cirencester
- Clevedon and Nailsea
- Ernesettle and Saltash
- Exmouth
- Falmouth
- Gloucester
- Helston
- Liskeard
- Lydney
- Menagwins
- Minehead
- Newquay
- Newton Abbot
- Par
- Plymouth (Camels Head)
- Plymouth
- Plympton
- Salisbury
- Shaftesbury
- Shepton Mallet
- Sidmouth
- St Ives and Penzance
- Stroud
- Swanage
- Swindon
- Taunton
- Tiverton
- Torquay
- Trowbridge
- Wellington
- Weston-super-Mare
- Weymouth
- Yeovil
Figure 8: map showing the location of STWs sampled in the West Midlands
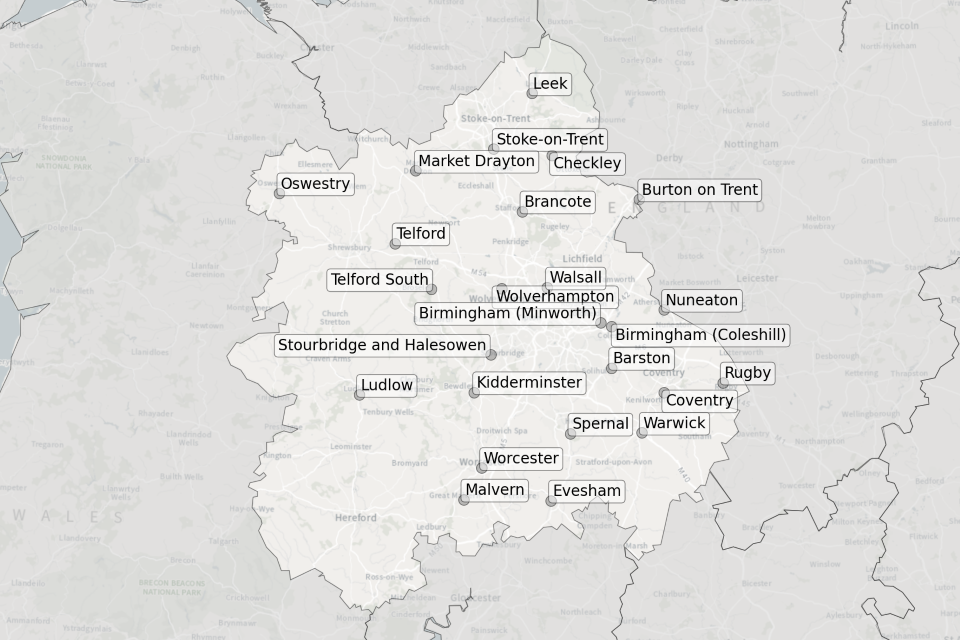
Figure 8 is a map showing the location of these sewage treatment works sampled in the West Midlands:
- Barston
- Brancote
- Checkley
- Birmingham (Coleshill)
- Birmingham (Minworth)
- Burton on Trent
- Coventry
- Evesham
- Kidderminster
- Leek
- Ludlow
- Malvern
- Market Drayton
- Nuneaton
- Oswestry
- Rugby
- Spernal
- Stoke-on-Trent
- Stourbridge and Halesowen
- Telford
- Telford South
- Walsall
- Warwick
- Wolverhampton
- Worcester
Figure 9: map showing the location of STWs sampled in Yorkshire and the Humber
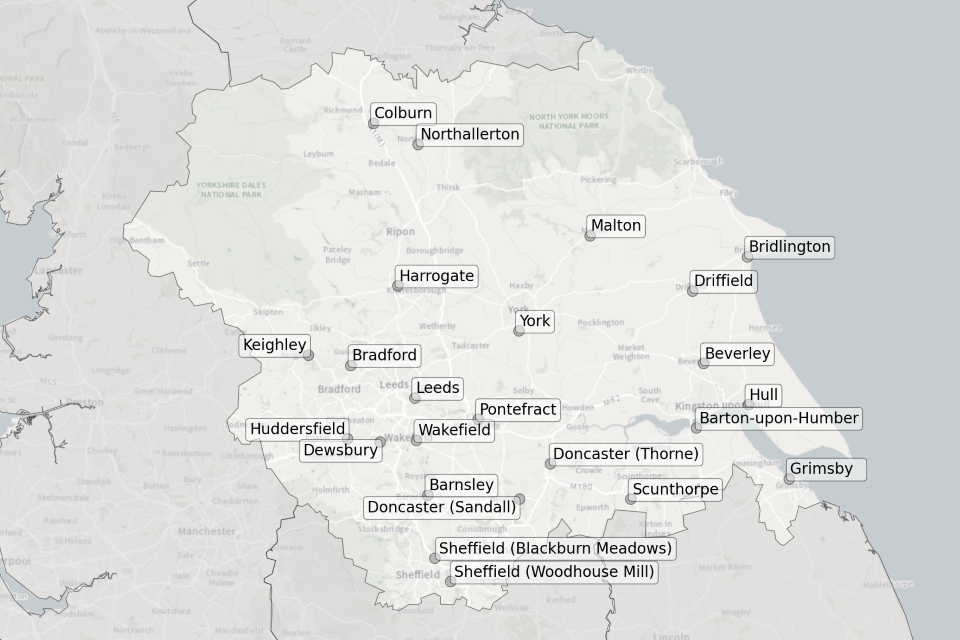
Figure 9 is a map showing the location of these sewage treatment works sampled in Yorkshire and the Humber:
- Barnsley
- Barton-upon-Humber
- Beverley
- Bradford
- Bridlington
- Colburn
- Dewsbury
- Doncaster (Thorne)
- Doncaster (Sandall)
- Driffield
- Grimsby
- Harrogate
- Huddersfield
- Hull
- Keighley
- Leeds
- Malton
- Northallerton
- Pontefract
- Scunthorpe
- Sheffield (Blackburn Meadows)
- Sheffield (Woodhouse Mill)
- Wakefield
- York
Concentration of SARS-CoV-2 RNA in wastewater samples
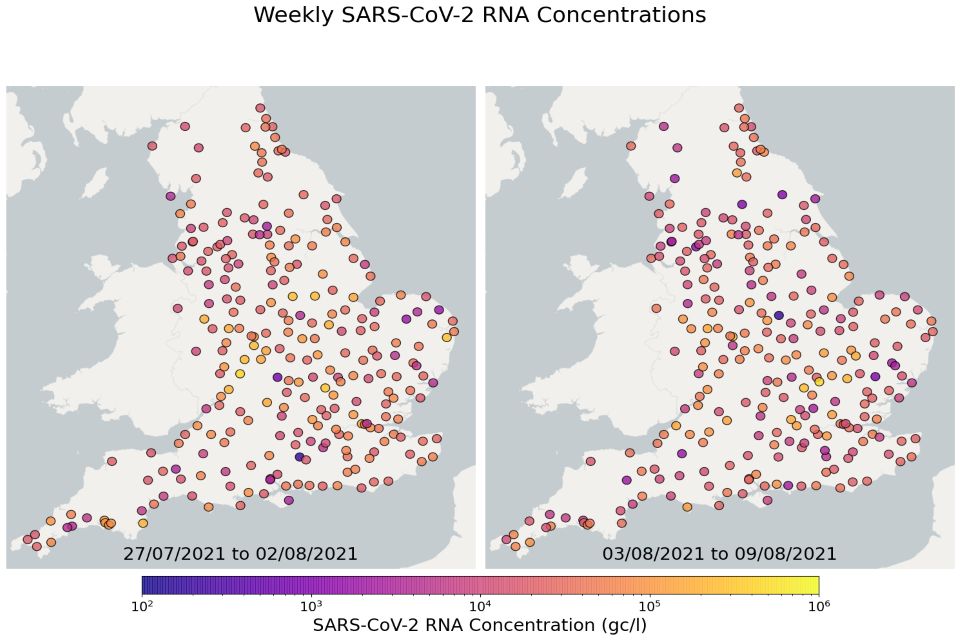
EMHP wastewater concentration data from 1 June 2021 to 23 August 2021 is available in the accompanying spreadsheet. The spreadsheet includes data from previous months’ publications, along with the latest August data. The most recent 4 weeks of data is visualised in figures 10 and 11; England concentration map. Note that STWs are omitted from figures 10 and 11 if no samples were taken during the week.
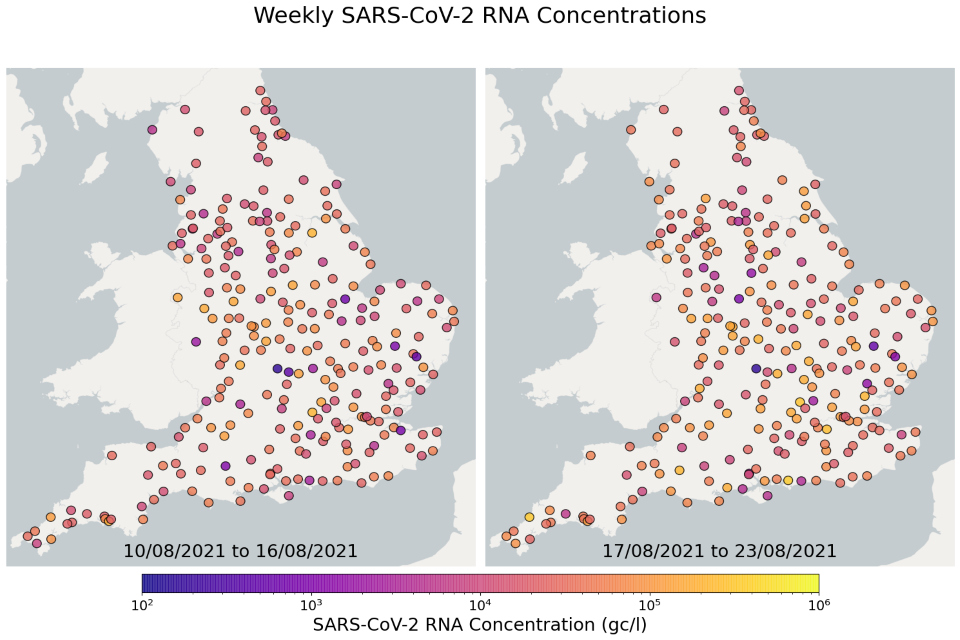
In the first week of August, 155 of 262 STWs (59%) showed a decrease in weekly average concentration compared to the previous week. In the second week of August, 161 of 260 STWs (62%) had a decrease in the average concentration relative to previous week. In the third week of August, there was generally an increase in concentration, with 142 of 260 STWs (55%) showing higher weekly average compared to the previous week. In the fourth week of August, 163 of 263 STWs (62%) showed an increase in average concentration compared to the previous week. Furthermore, any interpretation should be made with careful consideration of the points in the ‘Uncertainty, data quality and revisions’ section below.
Figures 10 and 11: England concentration map – map showing the location of SWTs sampled
Colour indicates the weekly-average SARS-CoV-2 RNA concentration (gene copies per litre) in the last 4 weeks. See regional maps for the names of each SWT.
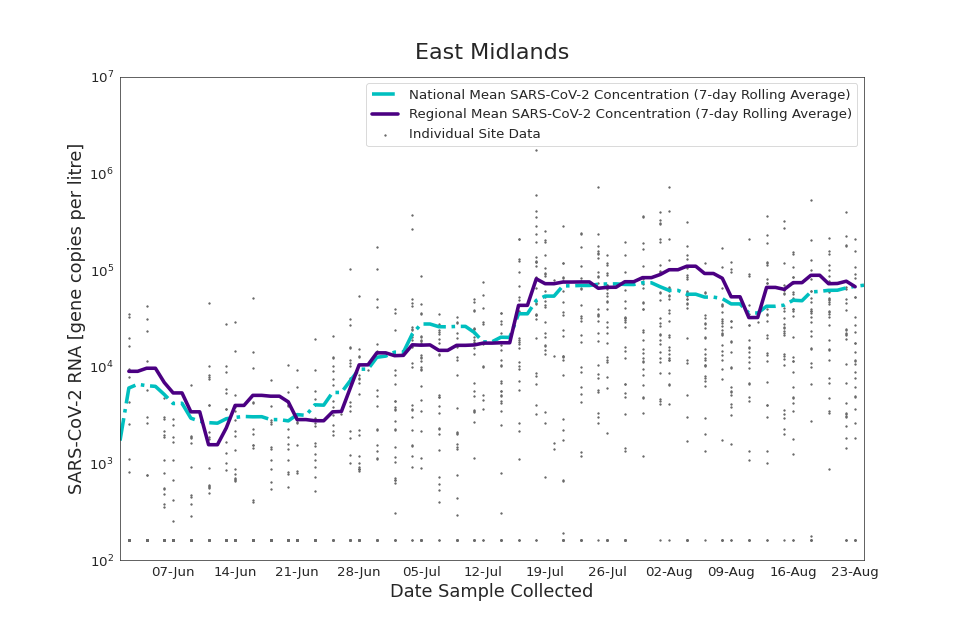
Regional average concentration of SARS-CoV-2 RNA in wastewater
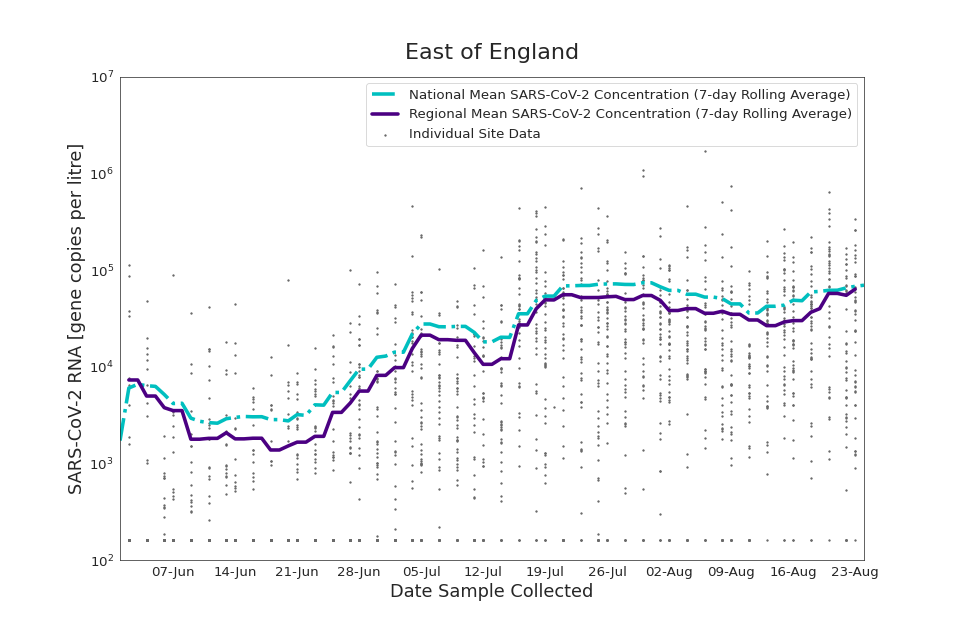
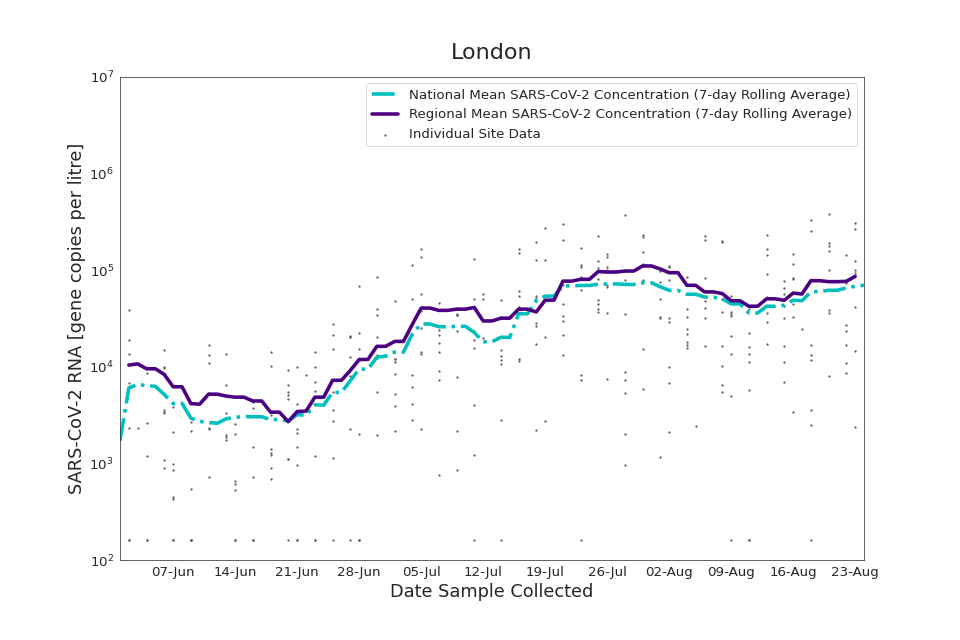
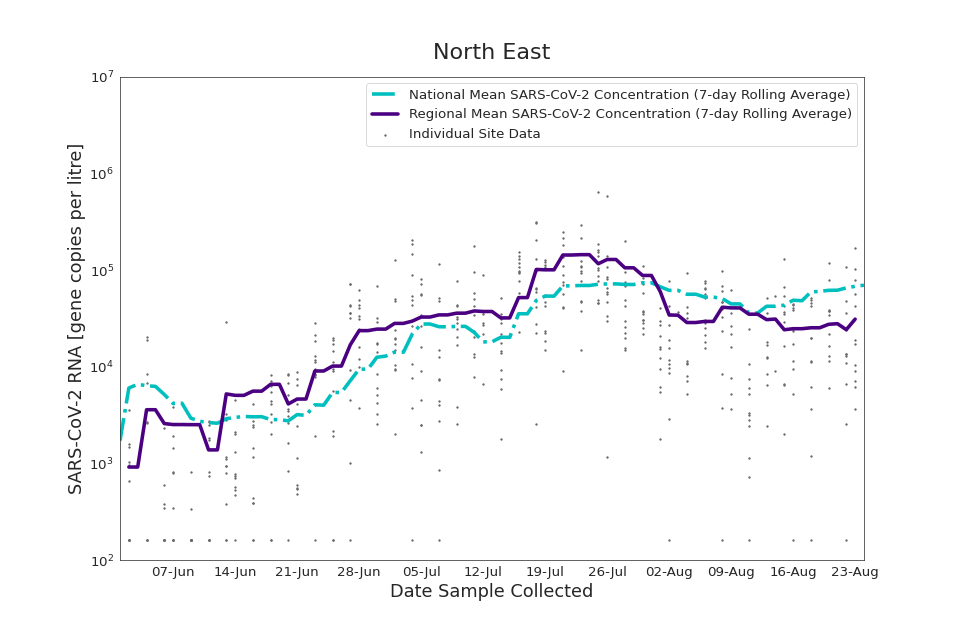
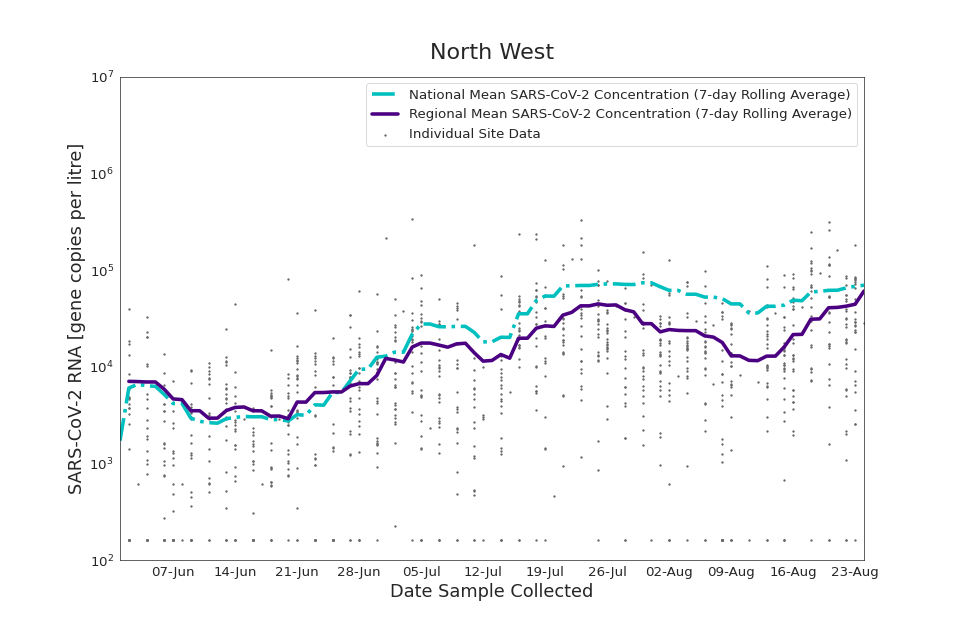
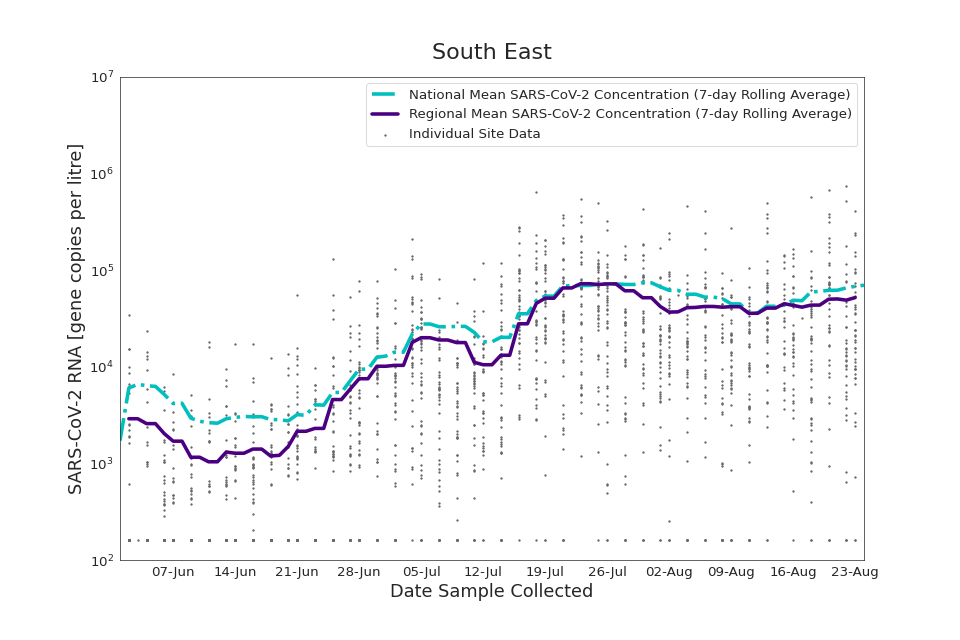
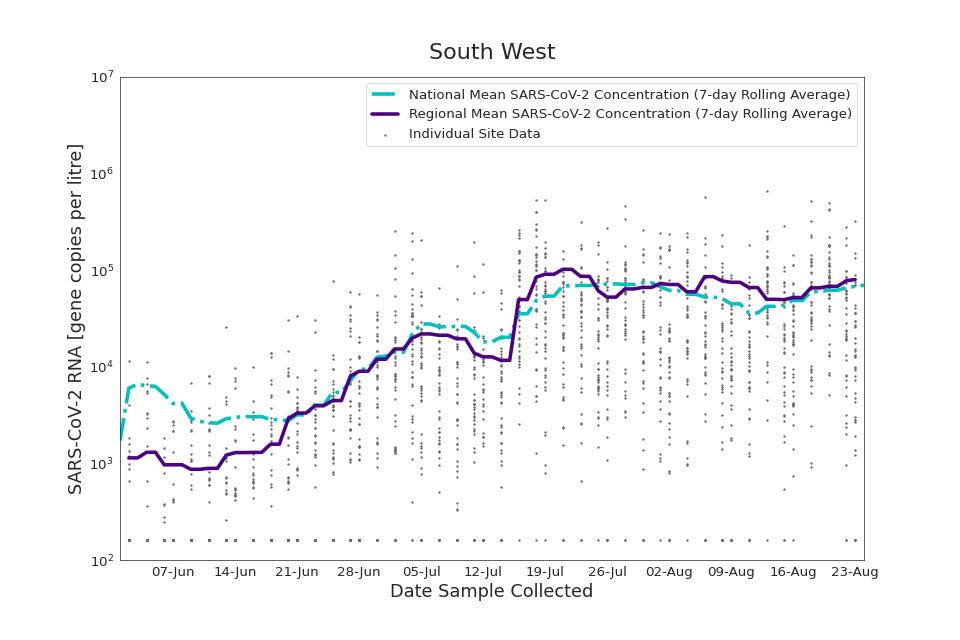
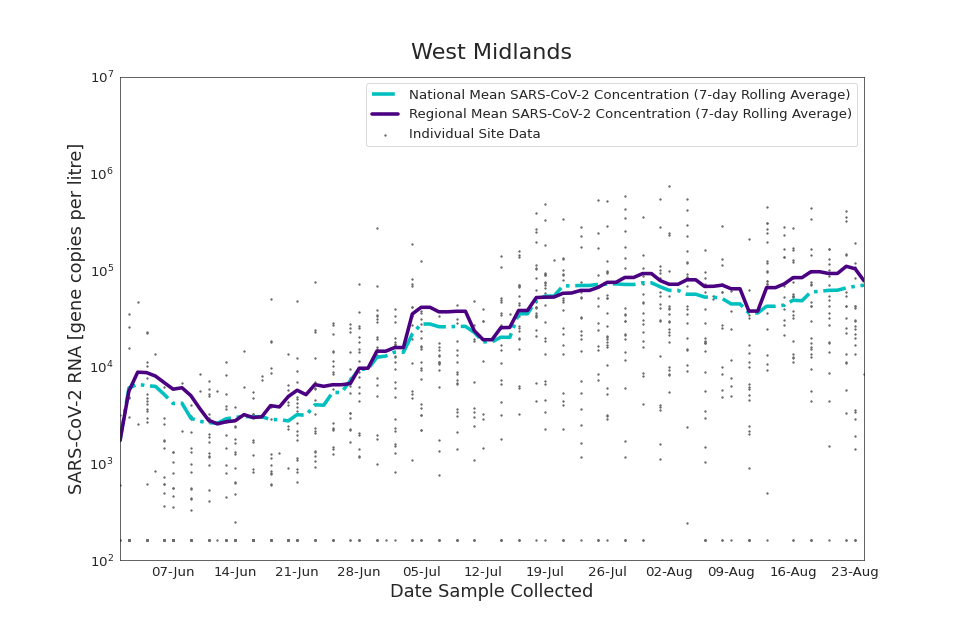
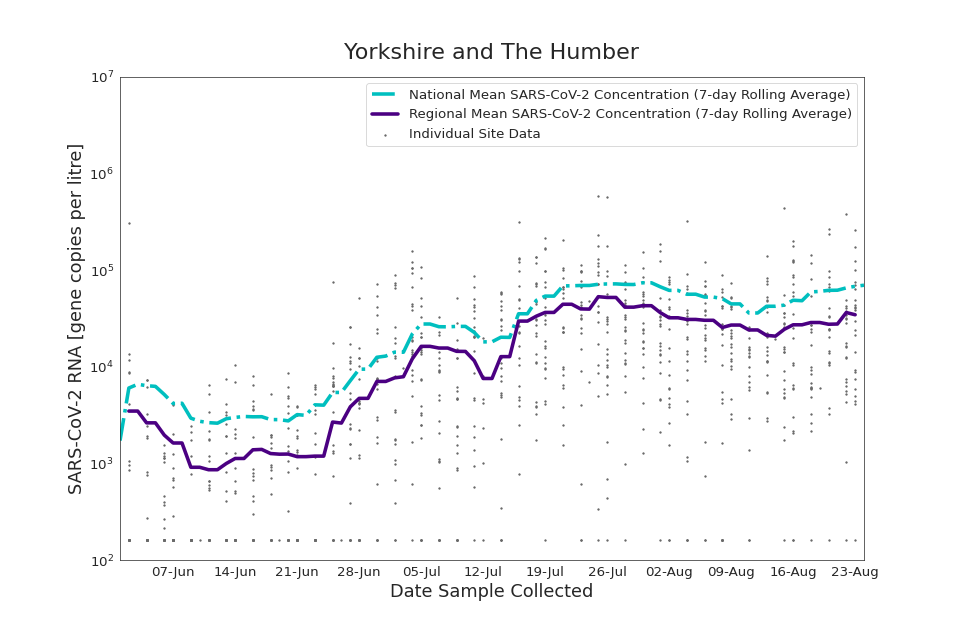
The concentration of SARS-Cov-2 RNA in wastewater increased in every region from late June to late August. This is indicative of increasing prevalence. However, there is high variability in concentration between individual STWs. Interpretation should be made with careful consideration of the points in the ‘Uncertainty, data quality and revisions’ section below.
Figures 12 to 20 show the 7-day rolling average SARS-CoV-2 concentrations detected in wastewater for each region in England, together with the national average of SARS-CoV-2 Concentrations detected in wastewater and individual site data over the 12-week period. Samples where no SARS-CoV-2 was detected are assigned the value 160 (gc/l) which is the theoretical limit of detection. Data is weighted by catchment population to account for varying catchment sizes. For further information, see ‘Methodology’ section below.
Figures 12: East Midlands 7-day rolling average SARS-CoV-2 RNA concentration
Figures 13: East of England 7-day rolling average SARS-CoV-2 RNA concentration
Figures 14: London 7-day rolling average SARS-CoV-2 RNA concentration
Figures 15: North East 7-day rolling average SARS-CoV-2 RNA concentration
Figures 16: North West 7-day rolling average SARS-CoV-2 RNA concentration
Figures 17: South East7-day rolling average SARS-CoV-2 RNA concentration
Figures 18: South West 7-day rolling average SARS-CoV-2 RNA concentration
Figures 19: West Midlands 7-day rolling average SARS-CoV-2 RNA concentration
Figures 20: Yorkshire and the Humber 7-day rolling average SARS-CoV-2 RNA concentration
Methodology
About this data
EMHP sample wastewater from STWs throughout England. Samples are analysed for the concentration of SARS-CoV-2 by quantifying the number of copies of the nucleocapsid gene (N1). Samples are transported to Environment Agency laboratory for quantification of the N1 gene using a process called reverse transcriptase polymerase chain reaction. The data reported here are the number of SARS-CoV-2 N1 gene copies per litre of wastewater (shortened to gene copies per litre throughout this document). Generally, the more people with COVID-19 in the community the more viral RNA will be shed into wastewater. Therefore, the concentration in wastewater is indicative of the prevalence of COVID-19 in the community.
Samples are analysed for the concentration of SARS-CoV-2 RNA and concentration is adjusted for flow (see the ‘Uncertainty, data quality and revisions’ section below). Typically, 4 samples per week are analysed from each STW. However, occasionally fewer samples will be collected and/or analysed. This can be due to several reasons such as EMHP altering sampling strategy because of testing capacity constraints, changing epidemiological priorities and current local response activities.
Weekly concentration table and daily concentration table show the concentration of SARS-CoV-2 RNA in wastewater samples (gene copies per litre). Note that there is sensitivity associated with the analysis of wastewater; the limit of detection (LOD) is the minimum concentration of SARS-CoV-2 RNA that can be reliably detected. Data tables contain the values ‘tLOD’ where analysis of the sample did not detect presence of SARS-CoV-2 RNA. For the purposes of averaging data to produce weekly averages in the weekly concentration table and figures 10 and 11, EMHP assign a concentration of 160 gene copies per litre to all ‘tLOD’ samples. This concentration is the theoretical limit of detection and is calculated by the Environment Agency. Note that there is uncertainty in this calculation and continuing work to refine it, please see the ‘Uncertainty, data quality and revisions’ section below for further information.
To calculate region averages, data from each STW was weighted by catchment population. To estimate the population of STWs, the catchment areas of STWs are matched to lower layer super output areas (LSOAs). Catchment areas were provided by the nine water companies serving England. See the EMHP publication wastewater testing coverage data for the EMHP programme for a detailed description of this method. Regional and national averages were calculated by taking the 7-day rolling arithmetic mean. Figures are displayed on a logarithmic scale for ease of interpretation.
We are exploring the feasibility of adding more data in future releases, such as detection of variants.
Data sources
Wastewater samples are collected by water companies and transported to an Environment Agency Laboratory. Concentration data are from Environment Agency analysis of wastewater samples.
Figures in this publication show the location of STWs. These locations were obtained from the European Commission urban wastewater website. Note that names differ between those used in this document and the European Commission urban wastewater website, sites can be linked using the ‘STW site code’ in the attached data tables.
The figures and analysis presented will evolve over time to ensure the most relevant information is included and the needs of stakeholders are met. These figures will initially be published monthly, from June 2021, and we will continuously evaluate the frequency and date-range based on need and public interest.
How these figures can be used
These figures and data can be used to view the concentration of SARS-CoV-2 RNA in wastewater, which is indicative of prevalence in the community. Due to factors relating to data uncertainty, EMHP recommend interpretation of this data with other data sources such Weekly Statistics for NHS Test and Trace (England).
Uncertainty, data quality and revisions
The figures here are compiled by professional analysts and have been quality assured. However, the analytical pipeline to produce this data should still be considered experimental; it is subject to an ongoing quality assurance process. Any revisions to past publications will be in line with DHSC’s revision policy and highlighted in future publications accordingly. The sites from which EMHP sample can change on a regular basis depending on testing capacity, epidemiological priorities and current local response activities. This can result in changes to specific STWs covered. This means the STW included in subsequent publications may change.
This publication shows STWs as single points. Every STW has an associated geographical catchment area (area from which wastewater flows into the sampling location). These catchments are not yet presented in these statistics publications. There is uncertainty surrounding catchment geography, as catchments vary in size and population covered, and in some cases an STW may not be located within the catchment it serves (for example, if wastewater is pumped to the STW). Therefore, the location of STW should be used as a general guide only.
Wastewater is an inherently variable material and can change greatly within and between days (foodstuffs being consumed; when washing machines are switched on and many other factors), the physical infrastructure and the type and levels of industrial wastes. It is generally more useful to consider trends over medium- and long-term periods of time, rather than between individual days.
There are several factors that can impact the quality of the signal recorded from wastewater and introduce uncertainty.
-
the concentration of SARS-CoV-2 RNA in wastewater may be impacted by weather, for example heavy rainfall wastewater may cause dilution. EMHP mitigate this by adjusting concentration to consider flow
-
whether samples are ‘composite’ or ‘grab’. Composite samples are where an autosampler (a machine which gathers wastewater at regular intervals over a set time period) gathers wastewater throughout the day. Grab samples are where a single sample is taken at one point in the day and are subject to greater variability; they are influenced by flow characteristics, time of day, and are more susceptible to outliers in the sewage. EMHP aim to mitigate this by sampling during times of peak load and ensuring the sample is collected mid-stream rather than close to the edges or bottom of the pipe
Calculating the limit of detection (LOD), the minimum concentration of SARS-CoV-2 RNA that can be reliably detected in a wastewater sample) can be achieved by several methods. In this data we have used the theoretical LOD as calculated by the Environment Agency. The theoretical LOD uses several assumptions. Laboratory data is required to inform the more realistic practical LOD. The practical LOD for this analysis is not yet reported here. It is likely that the LOD used in producing these statistics will change in future publications. EMHP will clearly state when this occurs.
Although the exact value of the LOD is uncertain, it is unlikely to have a noticeable impact on the interpretation of this data. This is because the difference between theoretical and practical LOD is relatively small, with most impact at low levels of the target being measured.
As explained in the ‘About this data’ section above, typically 4 wastewater samples are taken at each STW per week. The average of all samples within the week is presented in the weekly concentration table. Uncertainty occurs where fewer samples are taken. For example, if only one sample is taken during a week, that one sample defines the week average. This means weeks with fewer samples are more susceptible to variability and outliers. The sample count table shows how many samples were taken at an STW for each week in this release.
For the above reasons EMHP advise caution when directly comparing data between STWs.
If you would like to give user feedback please email testandtrace.statistics@dhsc.gov.uk.