
Monitoring and evidence gathering: operations note 50
Updated 12 August 2025
Applies to England

© Crown copyright 2025
This publication is licensed under the terms of the Open Government Licence v3.0 except where otherwise stated. To view this licence, visit nationalarchives.gov.uk/doc/open-government-licence/version/3 or write to the Information Policy Team, The National Archives, Kew, London TW9 4DU, or email: psi@nationalarchives.gov.uk.
Where we have identified any third party copyright information you will need to obtain permission from the copyright holders concerned.
This publication is available at https://www.gov.uk/government/publications/monitoring-and-evidence-gathering-operations-note-50/monitoring-and-evidence-gathering-operations-note-50
Purpose
This guidance will help you complete the (optional) CS Monitoring Report Spreadsheet and Photographic Monitoring Report templates to monitor and report on progress within a Countryside Stewardship (CS) agreement.
You can find these templates on Monitoring and evidence gathering: operations note 50.
This guidance is only relevant for agreements starting before February 2024.
The documents have been created by the Forestry Commission with some input from the private forestry sector and are intended to enable agents and landowners to keep track of and report on the work they have agreed to carry out in a CS agreement. As data is added to the spreadsheet and photographic report this builds the evidence needed for the monitoring reports, that agreement holders need to hold and which the Rural Payments Agency (RPA) may require at years 3 and 5 of WD2 agreements, in a format which will be accepted by the RPA, who will need reports when auditing CS agreements.
Context and background
Land managers must supply evidence of all works undertaken in the area of their agreement to the RPA. To assist with this requirement we have developed a spreadsheet and photographic evidence and map, etc. for you to use, if you desire. You can create your own, if required. This will provide the minimal requirement needed by the organisations listed above.
CS Monitoring Report spreadsheet
The CS Monitoring Report spreadsheet (Monitoring Schedule) was developed to allow you to take compartment and work programme data directly from the agreed Annex 2 or Negotiation Schedule (for post 2016 applications) and monitor progress against the overall agreed programme over the 5 years of the agreement. The correct copy to use is the final version agreed by the Forestry Commission, which was used to construct the CS agreement. From the CS Monitoring Report spreadsheet you will keep track of what you need to do, in each compartment, each year.
The spreadsheet is made up of several sheets referred to as ‘tabs’ which appear along the bottom left of the excel file window. They consist of the Annex 2 tab (where the data will be first added from your original spreadsheet), Years 1 to 5 tabs (where data can be added each year as you complete work) and the Years 3 and 5 Monitoring Report tabs (which amalgamate the data from the Year 1 to 3 tabs and Year 1 to 5 tabs, respectively).
This spreadsheet is designed to allow quantitative data to be collected each year when work is complete or when a claim is made. For example, how many metres of rides have been managed in the year or how many hectares of thinning completed in the year. It is important to gather and store this information somewhere as this may be required at any time during the life of the agreement and will be what is inspected when an agreement is selected for formal inspection. Having this data to hand in an easy-to-read format is a helpful tool to have at your disposal.
CS Photo Monitoring Report
The Photographic Monitoring Report template allows you to supply photographic evidence required at years 3 and 5 of a WD2 agreement or whenever claiming capital works each year. With WD2 given the size of some woodlands receiving WD2 and the amount of work being carried out to support this grant, putting in photos of all the work done every year will be impractical. Therefore, for the purpose of this template you should only insert one or two photos per work item but you must still retain further geo-referenced photos for all other areas worked or claimed and supply these if requested by the RPA.
This form will allow you to insert as many photos as you want to for the years’ worked and then describe what the photos show and where they have been taken from. Geo- referencing the photos has the added benefit of allowing you to return to the same place in later years to photograph the same location and show the progress of the work for later reports compiled.
CS Monitoring Schedule: how to use
This section will show you how to set up the CS Monitoring Schedule spreadsheet (monitoring sheet) using the data from your agreed Annex 2 or Negotiation Schedule Spreadsheet, referred to from now on as the Annex 2.
If you do not have the agreed sheet saved on your computer, contact us or Technical Services: Natural England (TS) who can supply you with a copy.
To import data into the CS Monitoring Report Spreadsheet, open the CS Higher Tier Annex 2 for the application in question and select the sheet called ‘Annex 2b Option WD2’. You will see that this has the same structure and format as the sheet called ‘Annex 2’ on the Monitoring Report. All data can be copy and pasted, apart from the grey cells which will need typing manually:
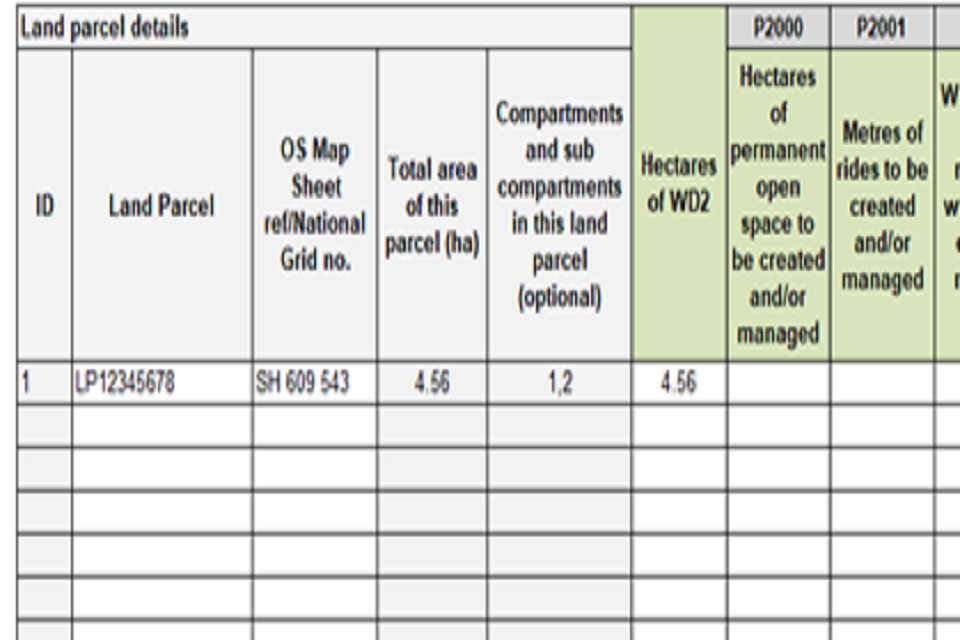
A screenshot of the spreadsheet.
Manipulating the Annex 2 data before completing the year tabs
Where RPA Land Parcels overlap a group of woodland compartments and you prefer to work to compartments rather than field parcels you can split the land parcel lines to have one compartment per row – this is entirely optional. Here is the best way to do this.
You must only do this on the Annex 2 tab of the Monitoring sheet.
- Copy the complete row you need to split to the first available unused row at the bottom of the Annex 2 table of data.
- If there are more than 2 compartments to split apart copy the data into the required number of extra rows. Example: 4 compartments in a single field parcel you need the original row of data copied into another 3 rows at the bottom of the Annex 2 table.
- Manually work through each of the duplicate rows to separate out the information so it shows the work at a sub-compartment level rather than the field parcel level. E.g. Felling in the parcel – 4.0ha - split out to show the actual net amounts between 3 compartments.
- Once complete for all grouped parcels, highlight all the rows in the sheet with data starting at row 12.
- Sort A to Z on the OS Map Sheet ref/National Grid No. column to place the additional rows in their correct places within the sheet so they then appear in field parcel number order. Do not worry that you have several rows with the same ID number.
- If you have a lot of rows to split this will take quite a bit of time. Always make sure you keep the original Annex 2 to hand to help you with these changes and you are advised to regularly save the sheet when you complete a set of duplicate rows.
If you find you need to split out work to individual compartments after you have already started adding data into the Year tabs do not use this method. Under these circumstances just add extra notes to the existing group to explain what has happened in each compartment within that group. Making changes later in the process will undermine the effectiveness of any reporting this sheet provides.
Always make these changes on the Annex 2 tab and not within the year tabs. That way the changes will be applied to all year tabs equally.
Do not remove land parcel numbers from monitoring reports because the RPA will only use parcel numbers when auditing claims. Removing them will result in more work for you to put them back into evidence required for RPA.
The year tabs have been set up with 500 rows of calculations. If this is not enough then copy down the formatting and calculations from the last row to as many extra rows that you need to include all the data within the Annex 2 sheet on each year tab.
Completing the tabs in the Monitoring Schedule
One of the main purposes of the monitoring spreadsheet is to be able to compile data from the Years 1 to 5 tabs and display it as a report which you will then need to submit to TS at the end of Years 3 and 5 when claiming the grants.
In the monitoring spreadsheet the reports are labelled ‘Year 3 Monitoring’ and ‘Year 5 Monitoring’ and are shaded in red. These tabs contain a summary of the work areas (e.g. open space, metres of rides, etc.) with the quantities completed for each year listed in the header as well as the overall total compiled from years 1-3 or years 1-5 depending on the report. Below the header is a text box where, as the automatic text explains, you can add comments to show how the progress is meeting the WD2 prescriptions within the agreement. This box can be expanded vertically as much as is necessary to explain the work that has been undertaken.
To enter your text click on the text box and press delete to remove the standard text that is already present. Then type in what you want to say.
Please add in the Agreement Name and Number at the top of the report to link this report to your case.
Creating Monitoring Reports for Years 3 and 5 using the Monitoring Schedule
The ‘Year 3 Monitoring’ and ‘Year 5 Monitoring’ are to be used to create the reports which are required for Years 3 and 5 during your CS agreement.
These tabs will automatically collate the figures supplied by you from the previous yearly tabs and display them in a A4 page-layout within the monitoring tabs, displayed under work areas such as coppicing, deer management, veteran tree management, etc.
Below the headers of these tables are text boxes where you can write a summary detailing the progress of the work completed so far, compared to the overall amount required by the end of the agreement in Year 5. This box can also be expanded as much as is necessary to add in sufficient detail.
These monitoring tabs can then be selected and converted into PDF documents which can more easily be submitted to RPA via email.
To convert the spreadsheet report:
- Make sure that you are viewing the monitoring tab that you want to convert to a pdf and then select File, and - Option a) Save & Send or Option b) Save As.
- Option a) click on Create PDF/XPS Document which will take you to a new window. Then click Create PDF/XPS.
- A Windows Explorer window should open with the heading ‘Publish as PDF or XPS’. The PDF file type should be selected automatically, if it is not, please use the drop down menu to select it.
- Option b) click on the drop down and select pdf from the list.
- In both cases the File Name chosen should include the name of the agreement, the CRM number of the agreement and which Monitoring Report it refers to (either Year 3 or Year 5).
- Save the pdf in a folder created on your computer for this agreement where you store all related documents for the case and can more easily find them in the future.
Once the PDF has been created, it should be submitted with the relevant annual claim which you are required to return to TS no later than 15 May of the year of claim.
Report any problems with this spreadsheet to the Forestry Commission.
CS Photo Monitoring Report: how to use
Use this template to allow quick insertion of photos to display clear evidence for your monitoring reports required at years 3 and 5 for WD2 agreements and as a good visual record of the work you have carried out in any given year of the agreement.
It can also be used to provide evidence required with capital claims or older agreements under the English Woodland Grant Scheme or Farm Woodland Scheme.
The photo report has been designed to allow the transfer of images with the click of a button for ease and time saving. You should have all the photos you want to copy ready in a single folder on your computer.
1). Open the Photo report template and enable the macros to run.
2). In Word 2010 and later versions you will see a Security Warning at the top. Click ‘Enable Content’ (or ‘enable editing’) to allow the Photo report to work as intended. In other versions, you will have to enable the macros by trusting them when asked.
3). At the top of the form there are 2 tables, the first one includes the woodland name, the main people involved, the scheme name, number and monitoring year. This is for ease of identification later on when you may have several such forms.
4). The second table is for you to summarise the activity that has taken place in the woodland over the course of the year as well as any other noteworthy comments (such as why a particular work item was not completed, e.g. poor ground conditions).
5). Once these tables have been completed, click on the ‘Push to add photos to the report’ between the tables and follow a series of messages.
6). Assuming this is the first time you have used the form, click ‘Yes’ and a new window will open (see next image) that gives you detailed instructions on how to add new photos to the form:
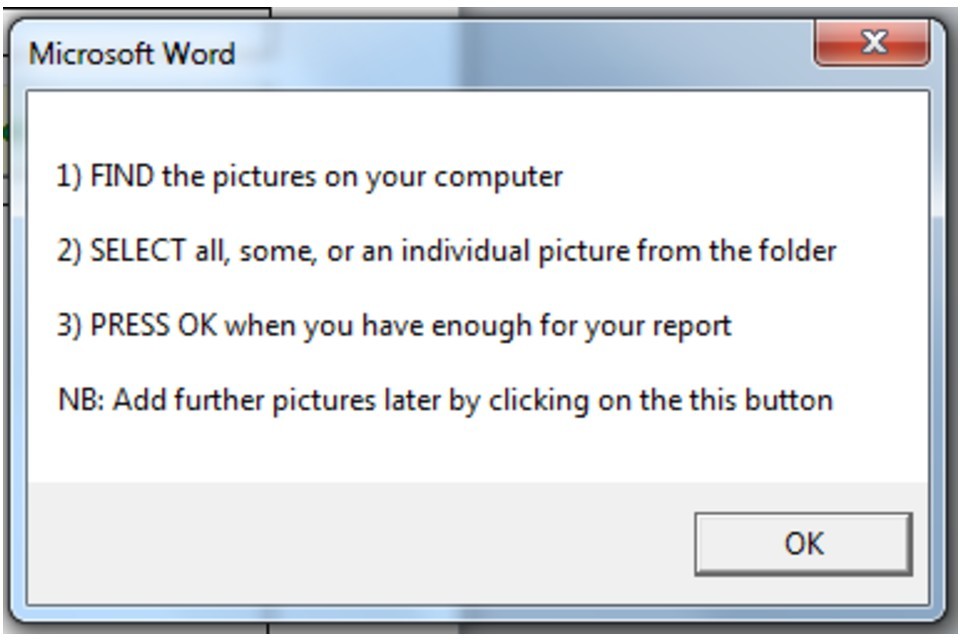
Example pop-up message providing instructions on how to add new photos to the form.
7). By clicking OK another window will open on your desktop (example below) which will allow you to navigate to the folder where your photos are stored. To make it easy to find the photos, you can move the folder you need to your Desktop before starting this process. Once you have opened the folder, you can either highlight a single photo, all photos in the folder or specific selected photos at random from within the folder. Hold down the ‘Ctrl’ key whilst clicking the photos in the folder to select them with the left hand mouse button.
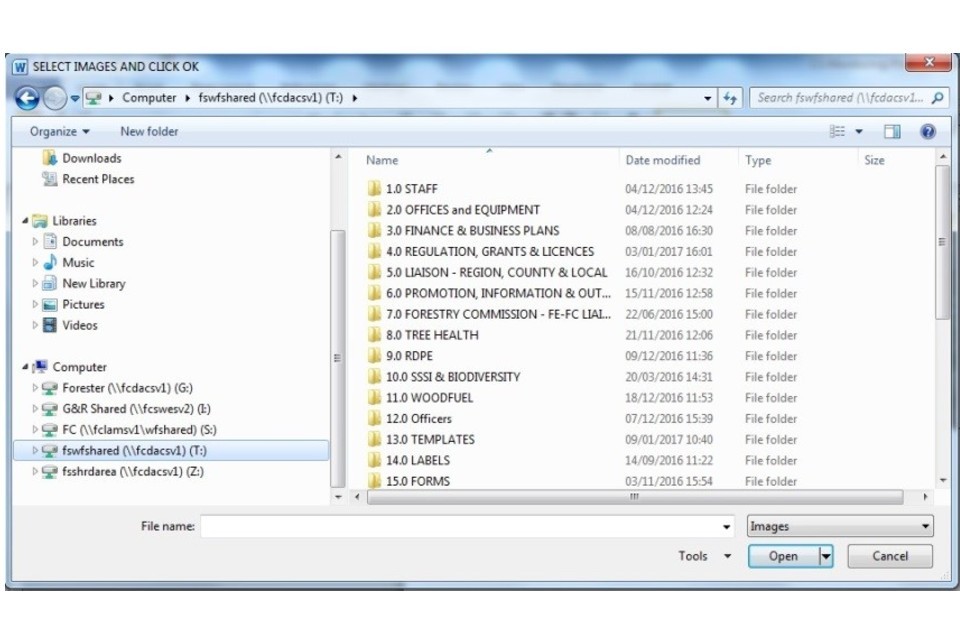
Example pop-up image of a new window.
8). Once selected, click ‘OK’. When the photos are loaded into the document which may take a minute or so depending on the number and size of the photographs being added, you will see notes appear in each text box below each photograph asking for specific detail. Please complete this detail for each as it will be helpful in the future when referring back to these photos, especially for the Monitoring Reports in Years 3 and 5. Then add any free text to explain what evidence the picture is displaying.
Geo-referenced photos are a requirement of the scheme which can either be achieved through a camera using GPS or an annotated map of where the photos were taken from. By putting this information below each photo you will be able to return to the site in later years and take further photos from the same location showing the progress of the work item (e.g. ride maintenance).
The Photo Report has code to help you quickly transfer groups or a random selection of photographs into the table in the document. If it does not run make sure you enabled macros in the document and then click the button called Add Photos and follow the instructions that should then appear.
You can add additional photographs to your report at any time by re-opening the saved document and clicking the Add Photos button provided.
Resizing pictures to reduce file sizes with Microsoft Office 2010
To keep the file size of the document to a minimum, you should make sure the pictures you use are no larger than 800x600 pixels. You can set your camera to this before taking the pictures or resize them.
If you have Microsoft Office 2010 resize the photos using the following steps:
- Right-click on the photo you want to resize and ‘Open with’ Microsoft Office 2010.
- Once open, on the toolbar click ‘Edit Pictures’ and a sidebar will appear on the right-hand side of the screen. Then click on ‘Resize’ below the heading ‘Change picture size’.
- Under the ‘Resize settings’ click ‘Predefined width x height’ and choose ‘Document – Small (800 x 600 px)’ and click OK. This will then have resized your picture to the correct dimensions.
- Save this picture using the ‘Save As’ option (the new photo can be saved with ‘V2’ added after the file name). You will then be able to add them in to the Photo Report.
If you have another program installed on your computer that you usually use to manage your pictures then use what you know best to reduce the pixels.
Using the non-macro version of the Photo Report
Use this form if you are using a Mac or are unable to enable macros on your computer or the macro fails to work.
The only difference is how you insert photos into the photo report. Since there is no macro, there is no button to press to start the process and no messages appear.
- Open the photo form.
- To show each photo on a separate line in the table use the ‘Insert’ menu and the Picture symbol. This method only allows you to insert a single picture at a time.
- Alternatively you can add more than one photo at a time to a single line in the table. From the folder you have created for the photographs select and copy all the photos you want to add to the photo report and paste them into the photo report.
- If you want to then separate them out select and drag the photo to a new part of the table.
- Creating new boxes to add photos into is easy. Move to the last available box in the table and press the tab key on your keyboard. Doing this creates a new line in the table. This can be done as often as is needed.
- Add in whatever explanatory notes you feel are required.
- Please include the location (in a 6-figure grid reference), the number of the photo (referenced on the map) along with a description of what the photo is evidencing.
Creating a map to be used with the Photographic Monitoring Report
To help illustrate where your photos have been taken create a map. This will then be attached and kept with your yearly photo report, to be submitted if required by the RPA.
The map can be created how you want but should contain several common elements including:
- an Ordnance Survey background
- a clearly defined boundary of the area under the CS agreement
- various cartographical standards including a North Arrow, Scale Bar, Legend and National Grid Coordinates
- the numbered point on the map where the phot was taken which relates to its number in the report
- an arrow showing the direction it was taken
- the boundary of the work area that the photos are showing. For example: a map needs to show the extent of the thinning where the picture has been taken
You can create your map on your own GIS software or on a paper map, it must be available to be sent in an electronic format, preferably a PDF or JPEG.
Further advice
The Countryside Stewardship higher tier manual contains additional information on evidence gathering and the format in which it is to be provided.
A PDF version of this guide is available on the National Archives website.
Contact us
For additional support, contact your local Forestry Commission woodland officer.