Lower benefit cap: quantitative analysis of outcomes of capped households
Updated 11 May 2023

© Crown copyright 2023
This publication is licensed under the terms of the Open Government Licence v3.0 except where otherwise stated. To view this licence, visit nationalarchives.gov.uk/doc/open-government-licence/version/3 or write to the Information Policy Team, The National Archives, Kew, London TW9 4DU, or email: psi@nationalarchives.gov.uk.
Where we have identified any third party copyright information you will need to obtain permission from the copyright holders concerned.
This publication is available at https://www.gov.uk/government/publications/lower-benefit-cap-quantitative-analysis-of-outcomes-of-capped-households/lower-benefit-cap-quantitative-analysis-of-outcomes-of-capped-households
DWP research report no: 1027
Crown copyright 2020.
You may re-use this information (not including logos) free of charge in any format or medium, under the terms of the Open Government Licence. To view this licence, visit http://www.nationalarchives.gov.uk/doc/open-government-licence/ or write to the Information Policy Team, The National Archives, Kew, London TW9 4DU, or email psi@nationalarchives.gov.uk.
This document/publication is also available on our website at:
If you would like to know more about DWP research, email socialresearch@dwp.gov.uk
First published Month 2020.
ISBN: 9781786595195
Views expressed in this report are not necessarily those of the Department for Work
and Pensions or any other government department.
Voluntary statement of compliance with the Code of Practice for Statistics
The Code of Practice for Statistics (‘the Code’) is built around three main concepts, or pillars, of trustworthiness, quality and value[footnote 1]:
- trustworthiness – is about having confidence in the people and organisations that publish statistics
- quality – is about using data and methods that produce assured statistics
- value – is about publishing statistics that support society’s needs for information
The following explains how we have applied the pillars of the Code in a proportionate way.
Trustworthiness
- the analysis presented in this report has been scrutinised internally by DWP analysts, and externally peer-reviewed by the Institute for Fiscal Studies (IFS)
- The Department commissioned the IFS to provide an independent peer review of methodology, approach and interpretation of the results. This is similar to the contracted arrangement with the IFS during the previous evaluation of the original benefit cap[footnote 2], published in 2014
- the detailed methodology, data sources and econometric approach taken in this research are set out in this report alongside the findings. The cohort-based, econometric methodology used builds on the methodology used in the previous quantitative evaluation of the benefit cap
- the figures presented in this report are based on analysis of DWP and HMRC administrative datasets, and the figures used to produce the charts in this report are published in an Excel file alongside this report
Quality
- the process to produce the analysis in this report was conducted by professional analysts taking account of the latest administrative data and applying methods using their professional judgement. The analysis has been through a rigorous quality-assurance process by other DWP analysts and external peer review by the IFS. The statistical methodology used in this report builds on the methodology used in the previous evaluation of the benefit cap
- this research is part of the mixed method evaluation of the lower benefit cap by the Department, which includes a longitudinal quantitative survey of capped claimants and qualitative case studies of local authority, Jobcentre Plus and local support representatives[footnote 3] within six sampled local authorities, conducted by the National Centre for Social Research (NatCen), an independent research institute. The findings in this report are consistent with the findings from the NatCen strands of the evaluation
Value
- this research provides important new evidence for Ministers, policy makers and external stakeholders on the operation and impacts of the lower cap policy (see Section 1.5 on key research questions in the main report)
- this evaluation sits alongside the benefit cap official statistics published by the Department on a quarterly basis which show the benefit cap caseload and off-flows under Housing Benefit and Universal Credit and allows the Department to monitor the impacts of the lower benefit cap policy
Executive summary
The benefit cap was introduced in April 2013 across Great Britain, as part of the Coalition Government’s strategy to reform the welfare system and incentivise work. It limits the total amount of benefit income that working-age households can receive. Between November 2016 to January 2017 the benefit cap was reduced from previous levels, and tiered according to where households were located. The benefit cap levels were reduced from £26,000 a year in Great Britain, for couples and lone parents (or £18,200 for single adults with no dependent children), to:
- £23,000 a year (or £15,410 for single adults with no dependent children) in Greater London
- £20,000 a year (or £13,400 for single adults with no dependent children) in the rest of Great Britain
This report assesses the quantitative impact of the lower benefit cap on household’s employment, exempting benefit and housing outcomes after twelve months. An exempting benefit includes receipt of certain disability and carer’s benefits and provides a household with exemption from the benefit cap (See Annex A).
The lower benefit cap has a positive impact on employment; households in scope for the cap are 5.1 percentage points more likely to move into paid work compared to similar households not affected by the cap. The employment impact is larger for households in scope for both the original and lower benefit caps, compared to households only in scope for the lower cap (8.4 vs. 4.1 percentage points more likely to be in work, respectively). Employment impacts of the cap also vary by household characteristics, for example, family type and location, and by cap amount.
The lower benefit cap leads to an estimated increase of 2.6 percentage points in the likelihood of being in receipt of an exempting benefit compared to similar households not affected by the cap. The impact is larger for households affected by both cap levels than those in scope for the lower cap levels only (3.8 vs. 2.2 percentage points, respectively). The impact of the lower benefit cap on receipt of an exempting benefit also varies by household characteristics and cap amount.
Results also show that the lower benefit cap increases the probability of moving property at Census Output Area (COA) level by 1.8 percentage points but there is no evidence to suggest that the lower cap leads to a statistically significant increase in moves between Local Authorities (LAs).
Acknowledgements, Authors and Contacts
Acknowledgements
The Department for Work and Pensions (DWP) commissioned the Institute for Fiscal Studies (IFS) to provide an independent peer review of this analysis, and we thank Carl Emmerson and Robert Joyce of the IFS for the helpful methodological advice that they provided over the duration of this project.
We also thank Rhys Cockerell, Oliver Barrett, Katie Riley, Andrew Parfitt, James Oswald, David Ryan-Mills and Ashley Kershaw (all DWP) for their contributions to this research.
Authors
Richard Ward
Stephanie Astley
Laura Gonzalez Alonso
Mark Griffiths
Hjalte Sorensen
Benefit Cap Analysis Team, Department for Work and Pensions (DWP)
Contacts
Press enquiries should be directed to the Department for Work and Pensions Press Office: Media enquiries: 0203 267 5144; Out of hours: 0203 267 5144; Website: www.dwp.gov.uk
Follow us on Twitter: www.twitter.com/dwppressoffice
For any general queries about this document please contact the benefit cap evaluation project team at ask.benefitcapevaluation@dwp.gov.uk
Summary
Background
Following the Welfare Reform Act 2012, the benefit cap was introduced in April 2013 across Great Britain, as part of the Coalition Government’s strategy to reform the welfare system and incentivise work. It limited the total amount of benefit income that most working-age households could receive. In the Welfare Reform and Work Act 2016, the benefit cap was reduced from its previous levels, and tiered according to where households are located. It reduced benefit cap levels from £26,000 a year, for couples and lone parents (or £18,200 for single adults with no dependent children), to:
- £23,000 a year (or £15,410 for single adults with no dependent children) in Greater London
- £20,000 a year (or £13,400 for single adults with no dependent children) in the Rest of Great Britain[footnote 4]
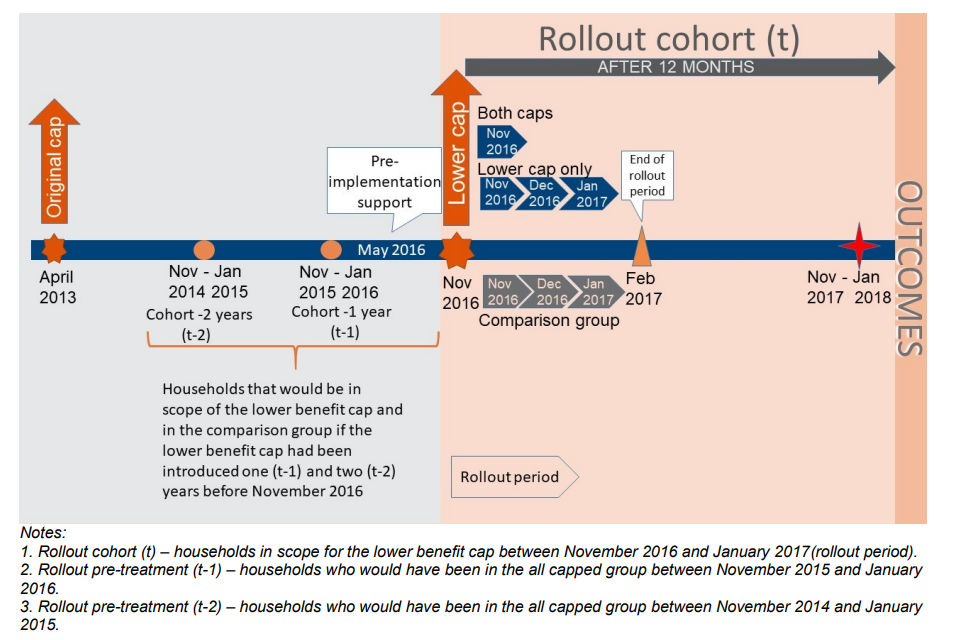
The rollout period across local authorities took place from November 2016 to January 2017 and was completed by February 2017.
Purpose of this report
This report explores the quantitative impact of the lower benefit cap. Specifically, it assesses whether one of the main aims of the policy is achieved: to increase the number of households moving into work[footnote 5]. In addition, it investigates whether households in scope for the cap are more likely to receive an exempting benefit (which excludes them from the cap) or to move home.
The report provides a quantitative analysis on a range of outcomes for households twelve months after they become in scope for the cap and to what extent these are as a direct result of the lower benefit cap.
This report is published alongside qualitative research on the impacts of the benefit cap, commissioned by the Department for Work and Pensions (DWP) from the National Centre for Social Research (NatCen).
Data and Methodology
The dataset used in this analysis is extracted from DWP and Her Majesty’s Revenue and Customs (HMRC) administrative data for the period November 2016 to January 2018. The analysis tracks and compares outcomes of a) a group of households who were in scope for the cap (‘capped households’) when the lower cap began to roll out to b) a similar group of households but with total weekly benefit income just below the lower cap levels (‘comparison group’); the two groups are referred to as the ‘rollout cohort’.
The outcomes are tracked over twelve months, from the month when the lower benefit cap starts to roll out in a specific Local Authority. Therefore, results from this analysis reflect only the outcomes during this period; outcomes may subsequently change.
The analysis considers only households capped at rollout under Housing Benefit (HB), as very few households were capped under Universal Credit (UC) at this time and were disproportionately located in Greater London due to the UC full service rollout schedule.
As mentioned above, the ‘rollout’ cohort is divided into two main groups:
- capped households, also referred to as the ‘All capped group’: households with a total benefit income above the lower cap levels. This group can be sub-divided into two different groups
- both caps: households with a total weekly benefit income above both the original cap levels and the new lower levels
- lower cap only: households with a total weekly benefit income below the original cap levels but above the new lower levels
- comparison group: households whose total weekly benefit income is below the lower cap levels by £25 or less per week
This report first presents a descriptive analysis on a range of outcomes for households in scope for the lower benefit cap. The main outcomes assessed are those which:
- exempt households from being capped (i.e. moving into work, or moving into receipt of an exempting benefit)
- involve a change in housing circumstances but do not necessarily prevent application of the cap
The econometric analysis, which follows the descriptive analysis, assesses the extent to which outcomes can (under certain assumptions) be directly attributed to the lower benefit cap. It consists of a regression analysis based on a linear ‘difference-in-difference’ methodology, which controls for differences in observed characteristics between the all capped and comparison groups and allows for any additional time-invariant difference between these groups. This analysis estimates the impact of the lower benefit cap compared with what may have happened in the absence of the cap.
Descriptive analysis results
Results from the descriptive analysis represent the change in circumstances for households from the month that they become in scope for the lower benefit cap and twelve months later. These results are presented by cap group (lower cap only and both caps group) and household characteristics.
Outcomes that exempt households from being capped
Of all capped households, more than half (53 per cent) are no longer capped twelve months later. The main outcomes are:
- 23 per cent are exempt from the cap because they move into work, either claiming Working Tax Credit (WTC) or earning enough to meet the work exemption under UC
- 10 per cent are in receipt of an exempting benefit (but are not in work)[footnote 6]
- 9 per cent have a different change of circumstances that leads them to reduce their benefit income below the cap levels
- 11 per cent are no longer claiming HB and not in scope for the cap under UC
The proportion of households within each outcome varies depending on their characteristics and whether they are in scope for both caps or the lower cap only:
Households in the both caps group are more likely to move into work or to receive an exempting benefit than those in the lower cap only group.
Of all capped households, the most likely to move into work are[footnote 7]:
- living in Greater London
- couples with children
- households with the youngest child aged 3 or 4
- Jobseeker’s Allowance (JSA) claimants
The most likely to begin receiving an exempting benefit are:
- living in the rest of Great Britain
- couples without children and single claimants
- households with the youngest child aged 5 or older
- Employment and Support Allowance (ESA) claimants in the work-related activity group (WRAG)
Outcomes that do not prevent the application of the cap but involve a change in housing circumstances
In principle, capped households could experience one or more of the following:
- move property
- a change to their rent level
- a change to their housing tenure; for example, moving to the Social Rented Sector (SRS), where rents are usually lower than in the Private Rented Sector (PRS)
The housing-related changes assessed within this report are:
- moves between geographical areas, either at Census Output Area (COA)[footnote 8] or Local Authority (LA) level
- rent level
- housing tenure
Descriptive analysis on housing status for capped households shows that, after twelve months, the majority (80 per cent) stay in the same COA, 14 per cent stay within the same LA but change COA and 6 per cent move LA (and therefore also COA).
Analysis on moving property is limited by the administrative data used for this analysis, which allows for identification of moves between COAs but not within the same COA. If a household were to move to another property on the same street, for example, then this might not be captured in the administrative data.
Whilst 80 per cent of capped households remain in the same COA, 38 per cent of capped households experience a reduction in their rent. For those capped households who move property, 40 per cent are associated with a reduction in their rent. Of the capped households who do not move, 37 per cent are associated with a reduction in their rent.
Generally, capped households tend to stay in the same tenure type twelve months after rollout. Eighty-seven per cent of households in the Social Rented Sector (SRS) and 77 per cent in the Private Rented Sector (PRS) stay in the same tenure, although there is some movement from the PRS into the SRS (6 per cent). Households in Temporary Accommodation (TA) in Greater London tend to remain within this tenure type (78 per cent) but the figure is somewhat lower in the Rest of Great Britain (49 per cent).
Econometric analysis results
The econometric analysis estimates the impact of the lower benefit cap on a) movement into employment, b) receipt of an exempting benefit and c) changing housing circumstances. Results from this analysis are significant at the 1 per cent level, unless otherwise stated.
Impact on employment
For the purposes of this analysis, a household is defined as moving into work if a member of the household has an open Working Tax Credit (WTC) claim twelve months after becoming capped.
Results from the econometric analysis suggest that twelve months after the rollout of the cap:
Capped households are 5.1 percentage points more likely to move into work compared to otherwise similar uncapped households. This is a relative increase of 28 per cent compared to the comparison group, which is an increased employment rate to 23 per cent from 18 per cent (the ‘counterfactual’ estimate of the proportion of households who move into work in the absence of the cap).
This means that out of 100 capped households:
- 23 households move into work, of which 18 would have moved into work in the absence of the cap
- an additional 5 households move into work, which is attributable to the lower benefit cap policy
The positive impact on employment is similar in magnitude to that found by the original benefit cap policy evaluation[footnote 9], which showed an increase of 4.7 percentage points in the capped household’s employment rate[footnote 10], and a relative increase of 41 per cent compared to the comparison group. Although it should be noted that results are not directly comparable due to differences in methodology, time period, comparison group[footnote 11] and benefit incomes.
The employment impact of the lower benefit cap varies depending on whether a household is in scope for both caps or the lower cap only at rollout:
- households in the lower cap only group are 4.1 percentage points more likely to be in work after twelve months, with a relative increase in the employment rate of 23 per cent compared to the comparison group
- households in the both caps group are 8.4 percentage points more likely to be in work after twelve months, which represents a relative increase in the employment rate of 43 per cent compared to the comparison group. This shows that the lower cap levels have an additional work impact above the original levels for this group
The impact of the lower benefit cap on employment differs depending on the main benefit claimed in addition to HB, at rollout i.e. benefit type. Although the lower benefit cap has a positive impact on employment across all benefit types, households in receipt of Income Support (IS) or Jobseeker’s Allowance (JSA) are more likely to be in employment after twelve months than households claiming Employment and Support Allowance (ESA) within the work-related activity group (WRAG).
The lower benefit cap increases the employment rate for households with a youngest child aged under 2 by more than for households whose youngest child is older. However, households with a youngest child aged under 2 are less likely to be in employment in the absence of the cap (the counterfactual employment rate) than households whose youngest child is aged over 2.
At relatively small cap amounts (up to £25 per week), the lower benefit cap has a negligible effect on employment rates. However, as cap amounts increase, the estimated impact of the lower cap on employment also increases up to cap amounts of £150 per week. At amounts greater than £150 per week it starts to diminish, especially outside of Greater London.
There is no statistically significant impact of the lower benefit cap on employment for single person households compared to otherwise similar uncapped households.
Impact on exempting benefits
Exempting benefits provide additional support for caring or for severe disability or health conditions, and include Disability Living Allowance (DLA), Personal Independence Payment (PIP) and Carer’s Allowance (CA). Being in receipt of any exempting benefit excludes households from the application of the benefit cap which ensures protection for claimants of exempting benefits for whom work may not be a viable option. Moving on to an exempting benefit represents around 18 per cent of all HB off-flows from the benefit cap[footnote 12] (between April 2013 and February 2020); the second most common reason after moving into work.
Results from the econometric analysis suggest that twelve months after the rollout of the cap:
- 10 per cent of capped households are in receipt of an exempting benefit, compared to a counterfactual estimate of 7 per cent. This means that capped households are 2.6 percentage points more likely to be in receipt of an exempting benefit than the comparison group, implying that the lower benefit cap policy may lead to an additional 3 out of 100 households moving into receipt of an exempting benefit. As a result, capped households experience a relative increase of 34 per cent in their likelihood of being in receipt of an exempting benefit compared to the comparison group
- households in the both caps group are 3.8 percentage points more likely to be in receipt of an exempting benefit than the comparison group, a relative increase of 46 per cent
- households in the lower cap only group are 2.2 percentage points more likely to be in receipt of an exempting benefit than the comparison group, a relative increase of 30 per cent
- the impact of the cap on receipt of exempting benefits is greater for households living outside of Greater London, particularly for lone parent households in the both caps group and with a child aged under two
- the impact of the cap on being in receipt of an exempting benefit is greatest for households initially claiming Employment and Support Allowance (ESA) within the work-related activity group (WRAG), who are 4.6 percentage points more likely to be in receipt of an exempting benefit than the comparison group, followed by households initially claiming Income Support (IS) and Jobseeker’s Allowance (JSA), with increases of 2.6 and 0.8 percentage points[footnote 13] compared to the comparison group, respectively
- in Greater London, at cap amounts below £100 per week, the lower benefit cap has a negligible effect on being in receipt of an exempting benefit. But at cap amounts above £100 per week, it is increasingly likely to result in households receiving an exempting benefit
- in the Rest of Great Britain, households are more likely to receive an exempting benefit as cap amount increases, up to £150 per week; above this, further increases in cap amount do not increase the likelihood of receiving an exempting benefit
- single person households are 5.6 percentage points more likely to receive an exempting benefit than similar uncapped households, a relative increase of 47 per cent. This impact is larger than for households with children, with increases of 2.9 and 2.4 percentage points for couples with children and lone parents compared to the comparison group, respectively
Impact on housing outcomes
The lower benefit cap increases the probability of moving property to a different COA[footnote 14]. Overall, there is no statistically significant evidence to suggest that the lower cap leads to an increase in moves between LAs at a National level, however there is some evidence of a slight impact of the cap for some of the subgroups.
Results from the econometric analysis on moving house suggest that twelve months after the rollout of the cap:
- capped households are 1.8 percentage points more likely to move COA than the comparison group. This is a 10 per cent relative increase in the moves rate, from a counterfactual of 18 per cent to 19 per cent[footnote 15], and suggests that the lower benefit cap leads to almost 2 out of 100 households moving house at COA level
- households in the both caps group are more likely to move COA, than the lower cap only group. This is consistent for Greater London, the Rest of Great Britain and all family types and tenure types
- capped households in Greater London are 3.2 percentage points more likely to move COA than the comparison group, whereas in the Rest of Great Britain, they are 1.4 percentage points more likely to move COA
- lone parent households are more likely to move COA than couples with dependent children[footnote 16]
- the larger the cap amount the larger the impact on COA moves, particularly in Greater London
- households in the both caps group are 0.5 percentage points more likely to move LA than the comparison group
- only households in Greater London are more likely to move LA; those in the both caps group are 1.7 percentage points more likely to move LA than the comparison group, and those in the lower cap only group are 1.2 percentage points[footnote 17] more likely to move LA
In summary, of all capped households 53 per cent were no longer capped twelve months later, including 23 per cent with an open WTC claim and 10 per cent in receipt of an exempting benefit. Some of these changes were a direct result of the cap, whereas others would have happened anyway. Results from the econometric analysis suggest that twelve months after the rollout of the cap, capped households were 5.1 percentage points more likely to move into work compared to otherwise similar uncapped households. Households were also 2.6 percentage points more likely to receive an exempting benefit compared to the comparison group. For the remaining 47 per cent of households who are still capped after twelve months, any adjustments this group may have made in response to the cap are not analysed, however some may be included in those that have moved COA or LA but remain capped. Chapter 7 of the NatCen integrated evaluation report includes examining how these 47 per cent of households have responded to the Cap.
1. Introduction
The benefit cap is a policy introduced by the Coalition Government as part of its strategy to reform the system of benefits for working-age households. The benefit cap limits the total amount of benefit income that households can receive, which can be achieved by reducing either the award of Housing Benefit or Universal Credit.
1.1 Policy overview
The Welfare Reform Act 2012 set out the key principle of the benefit cap, to limit the total benefit income that working-age households[footnote 18] could receive to £500 per week (or £26,000 per year), for families and couples, or £350 per week for single people without dependent children (or £18,200 per year). The policy was introduced from April 2013. The aims of this policy, as set out in the ‘Benefit cap: a review of the first year’,[footnote 19] were to:
- increase incentives to work by limiting the amount of benefit that households on out-of-work benefits can receive so that they will be financially better off on entering work
- introduce greater fairness in the welfare system between those receiving out-of-work benefits and taxpayers in employment by preventing households on out-of-work benefits from receiving a greater income from benefits than the average weekly wage
- make financial savings where the benefit cap applies and, more broadly, help make the system more affordable by incentivising behaviours that reduce long-term dependency on benefits
The 2014 impact evaluation of the original benefit cap[footnote 20] found that:
- capped households were 41 per cent more likely to move into work than comparable households not affected by the benefit cap after a year; an increase in the employment rate of 4.7 percentage points from 11 per cent to 16 per cent
- the greater the amount benefits were reduced by the cap, the greater the rate at which households moved into employment
- almost half of the households impacted by the original benefit cap were based in Greater London
1.2 Aims of the lower benefit cap
In the 2016 Welfare Reform and Work Act, the benefit cap levels were lowered and tiered according to where a household is located. The two original benefit cap levels were replaced by four new levels. The ‘Welfare Reform and Work Act: Impact Assessment for the benefit cap’ document[footnote 21], published in August 2016, stated that the lower benefit cap policy aims to:
- Further improve work incentives for those on benefits
- Promote even greater fairness between those on out-of-work benefits and tax payers in employment (who largely support the current benefit cap), whilst providing support to the most vulnerable
- Further reduce benefit expenditure and continue to help tackle the financial deficit
The lower cap levels, introduced from November 2016, are:
- in Greater London (the 32 London boroughs and the City of London)
- £23,000 per year for families and couples
- £15,410 per year for single people without dependent children
- in the Rest of Great Britain
- £20,000 per year, for families and couples
- £13,400 per year, for single people without dependent children
A summary of the cap levels is given in Table 1.1.
Table 1.1 Original and lower benefit cap levels by region and family type.
| Pre 7 November 2016 weekly cap (£) | Current weekly cap (£) | Difference (£) | |
|---|---|---|---|
| London couples / lone parents | 500 | 442 | 58 |
| London single without children | 350 | 296 | 54 |
| Rest of Great Britain couples / lone parents | 500 | 385 | 115 |
| Rest of Great Britain single without children | 350 | 258 | 92 |
The new lower, tiered, cap was rolled out across local authorities from November 2016 to January 2017, being fully rolled out in February 2017.
The 2016 Impact Assessment outlined that the lower, tiered, benefit cap aims to ensure that the benefit cap affects households more evenly across geographies; rather than disproportionately affecting households in Greater London, as the original benefit cap did.
According to the official statistics[footnote 22], published in May 2020, 79,000 households had their benefits capped in February 2020, of which 33,000 had their Housing Benefit capped and 46,000 had their Universal Credit award capped. Since April 2013, a total of 310,000 households have been capped at some point: 220,000 under Housing Benefit and (since October 2016) 92,000 under Universal Credit. See Figure 1.1, below.
Figure 1.1 Official statistics of capped households at each month, from April 2013 to February 2020.
| Month | Housing Benefit | Universal Credit | Total |
|---|---|---|---|
| Apr-13 | .. | .. | .. |
| May-13 | 396 | .. | 396 |
| Jun-13 | 2,432 | .. | 2,432 |
| Jul-13 | 2,755 | .. | 2,755 |
| Aug-13 | 7,843 | .. | 7,843 |
| Sep-13 | 18,024 | .. | 18,024 |
| Oct-13 | 25,508 | .. | 25,508 |
| Nov-13 | 27,352 | .. | 27,352 |
| Dec-13 | 28,434 | .. | 28,434 |
| Jan-14 | 27,743 | .. | 27,743 |
| Feb-14 | 27,735 | .. | 27,735 |
| Mar-14 | 27,720 | .. | 27,720 |
| Apr-14 | 26,792 | .. | 26,792 |
| May-14 | 27,019 | .. | 27,019 |
| Jun-14 | 26,458 | .. | 26,458 |
| Jul-14 | 26,472 | .. | 26,472 |
| Aug-14 | 27,241 | .. | 27,241 |
| Sep-14 | 26,473 | .. | 26,473 |
| Oct-14 | 24,978 | .. | 24,978 |
| Nov-14 | 24,264 | .. | 24,264 |
| Dec-14 | 23,756 | .. | 23,756 |
| Jan-15 | 23,728 | .. | 23,728 |
| Feb-15 | 23,093 | .. | 23,093 |
| Mar-15 | 22,537 | .. | 22,537 |
| Apr-15 | 22,281 | .. | 22,281 |
| May-15 | 22,456 | .. | 22,456 |
| Jun-15 | 22,270 | .. | 22,270 |
| Jul-15 | 22,866 | .. | 22,866 |
| Aug-15 | 23,379 | .. | 23,379 |
| Sep-15 | 23,173 | .. | 23,173 |
| Oct-15 | 22,005 | .. | 22,005 |
| Nov-15 | 20,999 | .. | 20,999 |
| Dec-15 | 20,417 | .. | 20,417 |
| Jan-16 | 19,881 | .. | 19,881 |
| Feb-16 | 20,189 | .. | 20,189 |
| Mar-16 | 20,346 | .. | 20,346 |
| Apr-16 | 19,521 | .. | 19,521 |
| May-16 | 20,124 | .. | 20,124 |
| Jun-16 | 19,995 | .. | 19,995 |
| Jul-16 | 19,931 | .. | 19,931 |
| Aug-16 | 20,041 | .. | 20,041 |
| Sep-16 | 20,187 | .. | 20,187 |
| Oct-16 | 19,095 | 350 | 19,445 |
| Nov-16 | 20,096 | 490 | 20,586 |
| Dec-16 | 32,962 | 1,320 | 34,282 |
| Jan-17 | 51,007 | 1,890 | 52,897 |
| Feb-17 | 66,135 | 2,300 | 68,435 |
| Mar-17 | 68,587 | 2,670 | 71,257 |
| Apr-17 | 66,928 | 3,110 | 70,038 |
| May-17 | 68,079 | 3,250 | 71,329 |
| Jun-17 | 68,891 | 3,360 | 72,251 |
| Jul-17 | 69,303 | 3,470 | 72,773 |
| Aug-17 | 68,265 | 3,620 | 71,885 |
| Sep-17 | 66,756 | 3,740 | 70,496 |
| Oct-17 | 64,503 | 3,850 | 68,353 |
| Nov-17 | 62,644 | 3,890 | 66,534 |
| Dec-17 | 60,870 | 4,060 | 64,930 |
| Jan-18 | 59,338 | 4,380 | 63,718 |
| Feb-18 | 60,075 | 4,720 | 64,795 |
| Mar-18 | 58,366 | 4,990 | 63,356 |
| Apr-18 | 58,384 | 5,260 | 63,644 |
| May-18 | 60,378 | 5,830 | 66,208 |
| Jun-18 | 60,537 | 6,350 | 66,887 |
| Jul-18 | 58,367 | 7,080 | 65,447 |
| Aug-18 | 57,755 | 7,950 | 65,705 |
| Sep-18 | 56,814 | 8,590 | 65,404 |
| Oct-18 | 54,867 | 9,170 | 64,037 |
| Nov-18 | 52,645 | 9,930 | 62,575 |
| Dec-18 | 49,855 | 10,970 | 60,825 |
| Jan-19 | 50,073 | 12,330 | 62,403 |
| Feb-19 | 52,289 | 14,950 | 67,239 |
| Mar-19 | 50,930 | 18,530 | 69,460 |
| Apr-19 | 50,533 | 22,050 | 72,583 |
| May-19 | 49,700 | 26,630 | 76,330 |
| Jun-19 | 47,754 | 29,880 | 77,634 |
| Jul-19 | 45,300 | 33,480 | 78,780 |
| Aug-19 | 43,131 | 35,840 | 78,971 |
| Sep-19 | 41,140 | 37,530 | 78,670 |
| Oct-19 | 38,718 | 38,940 | 77,658 |
| Nov-19 | 36,508 | 41,160 | 77,668 |
| Dec-19 | 35,462 | 43,040 | 78,502 |
| Jan-20 | 32,887 | 45,550 | 78,437 |
| Feb-20 | 32,589 | 46,230 | 78,819 |
Further information on the benefit cap policy, including the benefits taken into account in the cap calculation is set out in Annex A.
1.3 Pre-implementation support
Six months before the introduction of the lower benefit cap, pre-implementation support was offered to households (identified using a scan of DWP and HMRC administrative records) that might potentially be capped. Around 120,000 households received a letter, where they were informed about their potentially capped status and the range of support available for them, including JCP work coach support. Claimants were also strongly encouraged to contact the benefit cap helpline to get assistance with the practical implications of the lower benefit cap policy. A second ‘reminder’ letter was issued closer to the implementation date.
Alongside these two letters, wider communications across DWP and LAs were put in place to enable work coaches to target employment support effectively and to provide information on the type of housing support whenever needed[footnote 23].
The pre-implementation support offered was on a voluntary basis with no additional conditionality requirements (apart from the existing benefit conditionality) to engage with this support.
1.4 Housing policy changes in 2016 Welfare Reform and Work Act
Most working-age benefits and tax credit elements were subject to a four-year freeze, covering the period 2016/17 to 2019/20. This followed a three-year period (2013/14-2015/16) when increases were limited to 1 per cent. The four-year freeze was announced in the 2015 Summer Budget and legislated for by the Welfare Reform and Work Act[footnote 24] 2016. This freeze covered the various allowances, premiums and Local Housing Allowance (LHA) rates (for claimants renting in the PRS) for HB claimants and the UC equivalents.
The Welfare Reform and Work Act (2016) also introduced rules around the levels of rent charged by registered providers of social housing (Local Authorities and Housing Associations) in England from 1 April 2016. This required registered providers to reduce the majority of social rents by 1 per cent per annum during four years. A maximum rent was set for new tenancies, up to the social rent rate defined in the Act. Exemptions from the social rent reduction rules were also provided for certain types of providers such as those designated as specialised supported housing or temporary social housing. In addition, different rent setting policies were applied in Scotland and Wales[footnote 25].
1.5 Key research questions
This evaluation seeks to answer the following questions:
What are the most common outcomes observed for capped households?
We analyse household outcomes twelve months after rollout of the lower benefit cap. Specifically, we focus on households’ employment status, exempting benefit status and any housing-related changes that have taken place (i.e. geographical moves, changes in rent level and tenure type).
What is the impact of the lower benefit cap on encouraging movement into work thereby providing an exemption from the cap?
We assess the impact of the lower benefit cap on households’ employment by comparing the rate at which capped households move into work with a similar comparison group (with a total benefit income just below the cap levels therefore are uncapped).
What is the impact of the lower benefit cap on receipt of benefits that provide an exemption from the cap?
We assess the impact of the lower benefit cap on the receipt of exempting benefits by comparing the move-into-exempt-benefit rate of those capped and a similar comparison group with total benefit income just below the cap levels.
What is the impact of the lower benefit cap on housing moves?
We assess whether capped households are more likely to move to another Local Authority (LA) or Census Output Area (COA), in response to the lower benefit cap, and if by moving their rent reduces, compared to a similar comparison group with total benefit income just below the cap levels. We also analyse moves by tenure type e.g. Private Rented Sector (PRS), Social Rented Sector (SRS) and Temporary Accommodation (TA).
Results are presented by geography (Greater London vs Rest of Great Britain), family type (i.e. lone parents, couples with children, single), age of youngest child, cap amount and benefit type (i.e. Income Support (IS), Jobseeker’s Allowance (JSA), Employment and Support Allowance (ESA)).
This report is part of a broader evaluation of the lower benefit cap, published alongside independent research commissioned by the Department for Work and Pensions, undertaken by the National Centre for Social Research (NatCen). Details of this research can be found in Annex B.
1.6 Structure of this report
The report is structured in the following chapters:
Chapter 2: sets out the data and cohort methodology used in this report.
Chapter 3: provides descriptive analysis on the different outcomes observed for capped households twelve months after rollout, including outcomes which exempt them from the application of the cap, such as moving into work or being in receipt of an exempting benefit. See Annex A for information on exemptions from the benefit cap.
Chapter 4: sets out the methodology and results from the econometric analysis on the impact of the lower cap on employment, including sub-group analysis by demographic characteristics.
Chapter 5: examines the impact of the lower cap on receipt of exempting benefits, based on the same econometric analysis methodology set out in the previous chapter. It also includes sub-group analysis by household characteristics.
Chapter 6: examines housing-related changes twelve months after households become capped and the impact of the lower cap on these outcomes, based on the same econometric analysis methodology followed in previous chapters, and including sub-group analysis by household characteristics.
Chapter 7: summarises the key findings of this report.
In addition, a number of annexes are included to support the information provided in the report:
- Annex A: Benefit cap policy overview
- Annex B: Wider lower cap evaluation strategy
- Annex C: Data sources
- Annex D: Measuring employment outcomes under Universal Credit for households in receipt of Housing Benefit at rollout
- Annex E: Econometric analysis technical annex
- Annex F: Analysis of single person households
All tables and chart data can be found in a separate spreadsheet published alongside the report (Tables : Lower benefit cap: quantitative analysis of outcomes of capped households).
2. Data and Methodology
This section sets out the data sources and cohort methodology used in this evaluation, including the selection criteria for the cohorts of households analysed. It also presents descriptive statistics for the cohort groups and a description of the main outcomes observed for potentially capped households.
2.1 Data sources
The analysis presented in this report has been performed using bespoke datasets created for the purpose of the benefit cap evaluation, from a range of administrative benefit datasets held by the Department for Work and Pensions, Her Majesty’s Revenue and Customs (HMRC) and Local Authorities (LAs). A full list of the data sources used can be found in Annex C.
2.2 Cohort groups
We use a cohort analysis approach to assess the changes in households’ circumstances that can be attributed to the introduction of the lower benefit cap policy. This methodology allows monitoring households’ behavioural changes by tracking a group of households and comparing their outcomes over a fixed period of time.
The tracking period covers twelve months from the introduction of the lower benefit cap policy. This varies by LA and so a household’s start month is dependent on the LA they reside in. This is referred to as the ‘rollout month’. There were three reasons for the selection of twelve months for the tracking period:
- consistency with the longitudinal claimant survey: In the NatCen survey capped households were interviewed at two stages: seven months and thirteen months after first being capped[footnote 26]; more details are found in Annex B
- consistency with the tracking period used in the previous evaluation of the benefit cap
- it is considered as the minimum time required to observe any behavioural change in households’ circumstances as a result of the lower benefit cap policy
We refer to our main cohort throughout the report as the ‘rollout cohort’ and within this we identify capped households as being in scope for the lower benefit cap levels, including those also in scope for the original benefit cap levels (referred to throughout the report as ‘capped’ households), and a comparison group, with a total weekly benefit income up to £25 per week below the lower cap level, and thus, out of scope of the policy. Therefore, the cohort of households can be divided into two main groups:
All capped group:
Households that meet the lower benefit cap eligibility criteria (i.e. are working-age[footnote 27] and not receiving an exempting benefit or claiming WTC) and have a total benefit award above the lower cap levels (£23,000 in Greater London or £20,000 for the Rest of Great Britain, or single person equivalents) at the rollout month. This group can be sub-divided into two different groups:
Lower cap only group:
Households with a total weekly benefit income below £26,000 (or £18,200 for single adults with no dependent children) and above £23,000 a year (or £15,410 for single adults with no dependent children), in Greater London, or £20,000 a year (or £13,400 for single adults with no dependent children), for the Rest of Great Britain.
Both caps group:
Households which have a total weekly benefit income above the previous levels of the original cap, £26,000 levels for families (or £18,200 for single adults with no dependent children), and above the lower benefit cap levels, introduced in November 2016.
Comparison group:
Households that meet the lower benefit cap eligibility criteria (i.e. working-age and not receiving an exempting benefit), whose total weekly benefit income is similar to the all capped group, but just below the cap levels by £25 or less per week.
For households in the lower cap only group and those in the comparison group, the rollout month is set to the month when the lower cap began to roll out in the household’s LA (November 2016, December 2016 or January 2017). For the both caps group, it is set to November 2016, when the lower benefit cap was introduced. Table 2.1 shows the number of households in each group by rollout month.
Table 2.1 Number of households in the rollout cohort during the rollout phase (November 2016 to January 2017).
| Rollout Month | Total | Proportion of rollout cohort (%) | Lower cap only | Both caps | All capped | Comparison |
|---|---|---|---|---|---|---|
| Nov-16 | 55,040 | 39 | 20,360 | 23,740 | 44,100 | 10,940 |
| Dec-16 | 42,760 | 30 | 28,040 | .. | 28,040 | 14,720 |
| Jan-17 | 44,070 | 31 | 28,990 | .. | 28,990 | 15,080 |
| Total | 141,860 | 100 | 77,380 | 23,740 | 101,120 | 40,740 |
The cohort groups include only households claiming Housing Benefit (HB) and exclude those claiming Universal Credit (UC), at rollout. This is because the proportion of households affected by the lower benefit cap under UC full service at rollout is very small and disproportionately located in Greater London. For instance, in November 2016, only 490 households had their Universal Credit capped (Table 2.2 and Figure 2.1), which is around 2 per cent of the total number of capped households in November 2016 (20,590); 380 or 78 per cent of these households were located in Greater London. In February 2017, when the lower cap was fully rolled out, only 2,300 households were capped under UC full service (3.2 per cent of the total benefit cap caseload)[footnote 28]. This implies that evaluating the benefit cap under UC at this stage would not provide a good indication of the likely effects of the cap under UC across Great Britain and therefore, we exclude these households from the analysis.
Households in Supported Exempt/Specified Accommodation (SEA) [footnote 29] are also excluded from our cohort groups, as their housing costs are disregarded from the cap calculation (see Annex A for reference) which means that very few of these households would be capped in practice.
Table 2.2 Number of households that had their Universal Credit capped, by month.
| Nov-16 | Dec-16 | Jan-17 | Feb-17 | Mar-17 | … | Nov-17 | Dec-17 | Jan-18 | |
|---|---|---|---|---|---|---|---|---|---|
| Great Britain | 490 | 1,320 | 1,890 | 2,300 | 2,670 | … | 3,890 | 4,060 | 4,380 |
| Greater London | 380 | 820 | 1,110 | 1,280 | 1,420 | … | 2,100 | 2,160 | 2,250 |
| Rest of Great Britain | 110 | 500 | 780 | 1,020 | 1,250 | … | 1,790 | 1,900 | 2,130 |
Figure 2.1 Number of households capped under Housing Benefit and Universal Credit since October 2016.
| Month | Housing Benefit | Universal Credit |
|---|---|---|
| Oct-16 | 19,095 | 350 |
| Nov-16 | 20,096 | 490 |
| Dec-16 | 32,962 | 1,320 |
| Jan-17 | 51,007 | 1,890 |
| Feb-17 | 66,135 | 2,300 |
| Mar-17 | 68,587 | 2,670 |
| Apr-17 | 66,928 | 3,110 |
| May-17 | 68,079 | 3,250 |
| Jun-17 | 68,891 | 3,360 |
| Jul-17 | 69,303 | 3,470 |
| Aug-17 | 68,265 | 3,620 |
| Sep-17 | 66,756 | 3,740 |
| Oct-17 | 64,503 | 3,850 |
| Nov-17 | 62,644 | 3,890 |
| Dec-17 | 60,870 | 4,060 |
| Jan-18 | 59,338 | 4,380 |
| Feb-18 | 60,075 | 4,720 |
| Mar-18 | 58,366 | 4,990 |
| Apr-18 | 58,384 | 5,260 |
| May-18 | 60,378 | 5,830 |
| Jun-18 | 60,537 | 6,350 |
| Jul-18 | 58,367 | 7,080 |
| Aug-18 | 57,755 | 7,950 |
| Sep-18 | 56,814 | 8,590 |
| Oct-18 | 54,867 | 9,170 |
| Nov-18 | 52,645 | 9,930 |
| Dec-18 | 49,855 | 10,970 |
| Jan-19 | 50,073 | 12,330 |
| Feb-19 | 52,289 | 14,950 |
| Mar-19 | 50,930 | 18,530 |
| Apr-19 | 50,533 | 22,050 |
| May-19 | 49,700 | 26,630 |
| Jun-19 | 47,754 | 29,880 |
| Jul-19 | 45,300 | 33,480 |
| Aug-19 | 43,131 | 35,840 |
| Sep-19 | 41,140 | 37,530 |
| Oct-19 | 38,718 | 38,940 |
| Nov-19 | 36,508 | 41,160 |
| Dec-19 | 35,462 | 43,040 |
| Jan-20 | 32,887 | 45,550 |
| Feb-20 | 32,589 | 46,230 |
Alongside the rollout cohort, we also define two comparison or ‘pre-treatment’ cohort groups (cohort t-1 and cohort t-2), which include households that would be in either the all capped group or the comparison group if the lower benefit cap had been introduced one (t-1) and two (t-2) years before November 2016. These additional cohort groups allow us to track – and compare – outcomes of potentially capped households for the two years prior to the introduction of the lower benefit cap levels. Households in the pre-treatment groups may also be included in the rollout cohort, although would not necessarily be capped at rollout. Table 2.3 shows the number of households for each cohort group, in Great Britain and subdivided by ‘geography’, i.e. between Greater London and the Rest of Great Britain and Figure 2.2 shows the timeline of the key milestones in the lower benefit cap policy with cohort groups.
Table 2.3 Composition of the cohort groups: rollout, t-1 and t-2.
| Cohort | Geography | Lower cap only | Both caps | All capped | Comparison | Total |
|---|---|---|---|---|---|---|
| Rollout | Great Britain | 77,380 | 23,740 | 101,120 | 40,740 | 141,860 |
| Greater London | 12,950 | 9,620 | 22,560 | 8,470 | 31,040 | |
| Rest of Great Britain | 64,430 | 14,120 | 78,550 | 32,270 | 110,820 | |
| Cohort t-1 | Great Britain | 82,550 | 26,300 | 108,850 | 40,500 | 149,350 |
| Greater London | 14,320 | 10,930 | 25,250 | 8,650 | 33,910 | |
| Rest of Great Britain | 68,230 | 15,370 | 83,600 | 31,840 | 115,440 | |
| Cohort t-2 | Great Britain | 96,410 | 31,380 | 127,790 | 50,280 | 178,070 |
| Greater London | 17,800 | 13,500 | 31,290 | 9,770 | 41,070 | |
| Rest of Great Britain | 78,620 | 17,880 | 96,490 | 40,500 | 137,000 |
Figure 2.2 Lower benefit cap timeline and cohort groups.
As in the 2014 impact evaluation of the benefit cap, we include households in the cohorts when they have a total weekly benefit award above the lower benefit cap levels and are in scope for the lower benefit cap and we refer to these as capped households. This is different to the Official statistics measure for the number of households recorded as having the benefit cap reduction applied to the HB or UC award. The differences are due to a time interval between a household first being identified as being in scope for the cap at rollout by DWP and the benefit cap actually being applied to the HB award by local authorities, who administer HB. The period taken to administer the benefit cap between DWP and LA can take between a few weeks and up to 1-2 months, and this can vary for a number of operational reasons. Although there may be slight differences between the number of households actually capped and in scope for the lower cap, the two groups are similar, as demonstrated in Chapter 3 of the 2014 impact evaluation and therefore we use the term capped households irrespectively. In addition, in-scope households, even if they do not have their benefit income actually capped will likely have a strengthened incentive to change their circumstances; this methodology allows us to record behaviour responses for this group.
2.3 Methodology overview
As mentioned in the previous section, we use a cohort analysis approach that follows the analysis undertaken in the 2014 impact evaluation[footnote 30], which tracks outcomes for the cohort groups. However, there are some important differences compared to the previous evaluation:
- unlike the evaluation of the original benefit cap, the lower benefit cap evaluation does not have an easily identifiable group of households who are not affected by any benefit cap policy, as the original benefit cap was already implemented, from April 2013. This means that the cohort groups, particularly the both caps group (see below), are already affected by the original cap
- the number of households, either capped or in the comparison group is significantly increased compared to the previous evaluation. This is largely due to the lower levels, which affect more households. Eligibility criteria remain largely unchanged with the exception of the new exemption for households in receipt of Carer’s Allowance and Guardian’s Allowance, coinciding with the introduction of the lower benefit cap (see Annex A)
- within the group of capped households at rollout, there is a subgroup who are capped under the original cap levels and who would lose more benefit income than before (both caps group). In this evaluation, we analyse separately the impacts of the lower cap on the both caps group and those in scope for the lower levels only; the lower cap only group
- as the new lower cap introduces new tiered levels across different geographies, this motivates new subgroup analysis by geography (Greater London/Rest of Great Britain) in addition to the different cap groups (i.e. lower cap only and both caps group)
In this evaluation, first, we compare household outcomes or circumstances at the introduction of the lower benefit cap with those twelve months later and assess the outcomes by different characteristics i.e. family type, benefit type. Then, we determine the magnitude of the change for capped households that might be attributed directly to the lower benefit cap policy. We use the comparison group to identify what would happen to those affected by the lower benefit cap if the cap had not been introduced (known as their ‘counterfactual’ outcomes). A full technical description of the econometric methodology can be found in Annex E.
2.4 Composition of the rollout cohort
Figure 2.3 illustrates the distribution of households in each group across the rollout cohort groups and geography (Greater London and Rest of Great Britain) and Table 2.4 presents the detailed composition of the rollout cohort groups by different characteristics, i.e. geography, family type, benefit type, age of youngest children and tenure type. Throughout this report where we refer to households with children, these are dependent children aged up to 19 years old.
Figure 2.3 Diagram of the distribution of households in each group across the rollout cohort groups and geography
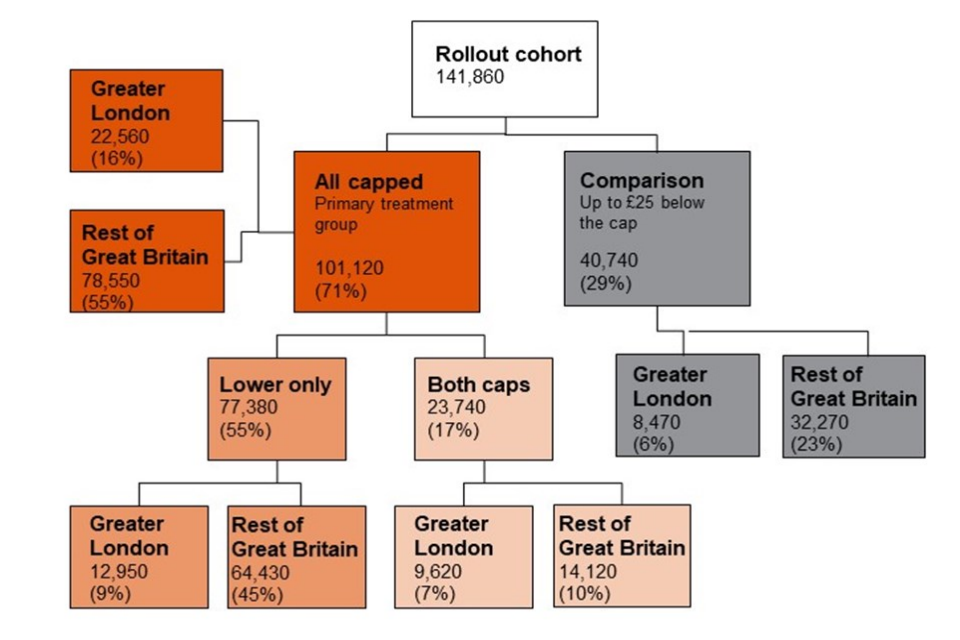
The rollout cohort includes 141,860 households of which:
- 29 per cent are in the comparison group
- 71 per cent are in the all capped group, of which:
- 55 per cent are in the lower cap only group
- 17 per cent are in the both caps group
We present below the composition of the rollout cohort, as well as the criteria to identify and analyse the comparison group and its robustness.
Table 2.4: Composition of the rollout cohort by household characteristics and cap group at rollout
| Lower cap only | Both caps | All capped | Comparison | |
|---|---|---|---|---|
| Totals | 77,380 | 23,740 | 101,120 | 40,740 |
| Family type | ||||
| Lone parents | 68 | 63 | 67 | 66 |
| Couples with children | 20 | 29 | 22 | 15 |
| Couples w/o children | <0.5 | <0.5 | <0.5 | <0.5 |
| Singles | 12 | 8 | 11 | 19 |
| Benefit type | ||||
| IS | 52 | 49 | 51 | 49 |
| JSA | 20 | 20 | 20 | 19 |
| ESA WRAG | 19 | 19 | 19 | 21 |
| Other | 9 | 12 | 10 | 11 |
| Age of youngest child | ||||
|---|---|---|---|---|
| Under 2 | 32 | 38 | 33 | 28 |
| Aged 2 | 13 | 13 | 13 | 12 |
| Aged 3-4 | 21 | 20 | 21 | 19 |
| Aged 5-19 | 22 | 20 | 21 | 21 |
| Tenure type | ||||
| SRS | 50 | 40 | 48 | 59 |
| PRS | 44 | 42 | 43 | 34 |
| TA | 1 | 9 | 3 | 1 |
| Other | 5 | 8 | 6 | 6 |
| Geography | ||||
|---|---|---|---|---|
| Greater London | 17 | 41 | 22 | 21 |
| Rest of Great Britain | 83 | 59 | 78 | 79 |
| Region | ||||
| Inner London | 7 | 16 | 9 | 9 |
| Outer London | 9 | 25 | 13 | 12 |
| North East | 4 | 3 | 4 | 4 |
| North West | 10 | 7 | 9 | 9 |
| Yorkshire and the Humber | 8 | 6 | 8 | 9 |
| East Midlands | 7 | 4 | 6 | 6 |
| West Midlands | 12 | 9 | 11 | 9 |
| East of England | 10 | 7 | 9 | 8 |
| South East | 14 | 11 | 13 | 15 |
| South West | 6 | 5 | 6 | 7 |
| Scotland | 6 | 5 | 6 | 7 |
| Wales | 5 | 3 | 5 | 6 |
2.4.1 All capped group
At rollout, the all capped group is mainly formed[footnote 31] by (Table 2.4):
- lone parent households (67 per cent)
- income Support claimants (51 per cent)
- households with a youngest child aged under 2 years (33 per cent)
- households in either the Social Rented Sector (48 per cent) or Private Rented Sector (43 per cent)
- living outside Greater London (Rest of Great Britain) (78 per cent)
2.4.2 Comparison group
The comparison group characteristics are similar to the all capped group. As such, this group is mostly composed of (Table 2.4):
- lone parent households (66 per cent)
- income Support claimants (49 per cent)
- households with a youngest child aged under 2 years (28 per cent)
- households in either the Social Rented Sector (59 per cent) or Private Rented Sector (34 per cent)
- living outside of Greater London (Rest of Great Britain) (79 per cent)
2.4.3 Choice of the comparison group
To assess the impact of the lower benefit cap, we compare outcomes of capped households with the outcomes of a similar group of households not affected by the benefit cap policy called the ‘comparison group’. The comparison group provides information on what would have happened to households affected by the lower cap, in the absence of the cap, or the ‘counterfactual’ estimate.
In the 2014 impact evaluation, the comparison group was formed by households with a total weekly benefit income of £0-£50 below the cap. For the purposes of this evaluation, households who have a total weekly benefit income £0-£25 below the cap provide a good representation, in terms of sample size (larger than the comparison group in the previous evaluation) for robust statistical evaluation, and a closer comparator to the lower cap group, in terms of observed characteristics, as well as total weekly benefit income.
Table 2.4 shows that the comparison group is very similar in characteristics to the lower cap only group, although less similar to the both caps group. The characteristics of the both caps group are somewhat different to the other groups, reflecting their higher level of benefit entitlement in the absence of the cap. This is a difference that must be considered throughout the impact assessment and is the reason behind the choice of our empirical methodology design (see Annex E). For this reason, the analysis presented throughout this report includes regression models for both groups (lower cap only and both caps), to account not only for the overall impact of the lower benefit cap but also for the additional impact of the previous higher cap levels.
In addition to sharing similar characteristics in terms of composition, the comparison group should ideally have similar outcomes pre-implementation of the cap, i.e. similar employment rates. We observe that twelve months before the implementation of the benefit cap the proportion of households in the comparison group who are in work is 12 per cent, similar to households in the lower cap only (13 per cent) and in the both caps group (14 per cent).
Taking into account the above considerations, we consider it reasonable to conclude that the comparison and capped groups are affected similarly by factors other than the benefit cap policy. Therefore, we are confident that the comparison group provides an appropriate basis for assessing the impact of the lower benefit cap.
2.5 Household outcomes
We assess in detail, in Chapter 3, a range of different outcomes observed for households claiming HB twelve months after rollout of the lower benefit cap. The main outcomes considered, consistent with the benefit cap official statistics[footnote 32] are (see Annex A for reference):
- claiming Working Tax Credits, which exempts households from the application of the cap to their HB award
- being in receipt of an exempting benefit
- having a total weekly benefit income below the benefit cap threshold, which means the household is uncapped or ‘out of scope’ of the cap levels
- no longer claiming HB and without a Universal Credit (UC) claim
- migrating from HB to UC with earnings above the cap threshold, which results in the household becoming out of scope for the cap. This is explained in Annex D
- migrating from HB to UC with earnings below the threshold, still capped
- still claiming HB and with a total weekly household benefit income above the cap threshold, still capped
In addition, we also assess a range of outcomes related to housing status, in Chapter 6. These outcomes include:
- moves between geographical areas, either at Census Output Area (COA) or Local Authority (LA) level
- rent level
- housing tenure e.g. moving from the Private to the Social Rented Sector or vice versa
2.6 Measures for working and exempting benefit outcomes
In this section, we explain in detail some of the measures used to determine movement into work and into an exempting benefit, as outlined in Section 2.5.
2.6.1 Movement into work
For the purposes of this report, movement into employment is defined as households who have an open Working Tax Credit (WTC) claim. The methodology is consistent with the official statistics and based on that followed in the 2014 impact evaluation, which assessed the likelihood of households to be in receipt of WTC, twelve months after they become capped, compared to the comparison group. The WTC measure is especially appropriate for this evaluation, where changes in employment status before and after the application of the cap are more important than defining the exact level of employment.
Households’ WTC entitlement is extracted from two DWP administrative scans, the Work and Pensions Longitudinal Study dataset (WPLS) and the General Matching Service (GMS) data. The two data sources are merged to create 25 single binary indicator variable (i.e. a variable that can take one of only two values) which measure whether a household is in receipt of WTC over a 25-month period, tracked twelve months before and twelve months after the rollout of the lower benefit cap.
According to the latest official statistics, of the 220,000 households that have had their Housing Benefit capped since the introduction of the cap, in April 2013, 186,000 households are no longer capped, in February 2020. Moving into paid work (proxied by an open WTC claim) is the primary reason to no longer be in scope for the benefit cap, representing 61,000 households and 33 per cent of the total off-flows under HB since the introduction of the benefit cap.
Although this methodology captures a large proportion of those who move into work, it does not count the following outcomes as ‘in-work’:
- households not working enough to be entitled to WTC (at least 16 hours per week but depends on individual circumstances)[footnote 33]
- households who become eligible for WTC during the tracking period but do not claim it. We are not able to quantify exactly the size of this group, but we observe that the number of households affected is small
- movements into work where earnings exceed WTC limits (and so a WTC payment cannot be processed). This could include households whose earnings are high enough that they have been awarded a “nil award” as a result of the WTC means test The proportion of nil awards in the treatment and comparison groups is similar across the tracking period for the rollout cohort and pre-treatment cohorts at around 2-3 per cent; this shows there has not been an increase in those registering for a nil award. These findings are consistent with the those in the 2014 impact evaluation
- households who migrate from HB to UC and start to work (see Annex D for analysis on this group and the extent to which the WTC measure is under-estimating employment flows)
Using WTC awards to measure work outcomes also includes households who were already in employment, but were not previously taking up their WTC entitlement but subsequently claim WTC (perhaps due to the benefit cap policy).
These limitations mean that the WTC measure may either over or under-estimate the impact of the cap on employment. However, we believe that this is the best measure available to measure movement into work for capped households using the available data sources. In addition, analysis in Annex D demonstrates that the number of flows into work for households in the rollout cohort who claimed UC rather than WTC during the twelve-month tracking period is very small and has a negligible effect on the overall estimate of the employment impact of the policy. Annex C includes a discussion of alternative measures based on the HMRC Real Time Information (RTI) on earnings.
2.6.2 Receipt of exempting benefit
Exempting benefits are generally health, disability or carer-related that exempt households from the application of the cap, which ensures protection for those claimants for whom work may not be a viable option. A full list of the exempting benefits is provided in Annex A.
We assess the percentage of households in receipt of any exempting benefit after twelve months of being capped and the degree at which the lower benefit cap increases the likelihood to be in receipt of an exempting benefit, twelve months after rollout compared to the comparison group.
3. Descriptive analysis of outcomes of capped households twelve months after rollout
This chapter consists of a descriptive analysis of a range of different outcomes, defined to be mutually exclusive, and observed for households twelve months after becoming capped. This chapter does not attempt to relate these outcomes to how the same households would have responded in the absence of the cap and, therefore, does not estimate the causal impact of the cap. That is presented in later chapters in the econometric analysis.
3.1 Outcomes overview
As explained in Section 2.5, there are multiple ways in which households’ circumstances can change in the twelve months after they become capped. For the purposes of this chapter, we assign each household a single mutually exclusive outcome, following the hierarchy below. This means that once a household is assigned an outcome, it will not be counted in any lower ranked outcome. The outcomes considered are, in ranking order:
- If a household has an open WTC claim, it is assigned to be ‘In Work’
- If a household is no longer capped under HB and has a UC earnings exemption, it is assigned to be ‘In Work’[footnote 34]
- If a household is in receipt of an exempting benefit, it is assigned to be ‘Exempt’
- If a household is still capped under HB, it is assigned to be ‘Capped’
- If a household is no longer capped under HB but is capped under UC it is assigned to be ‘Capped’
- If a household still has a benefit income above the cap levels and is in scope but is yet to have their benefits capped, it is assigned to be ‘Capped’
- If a household has benefit income below the cap, but is still claiming HB, it is assigned ‘Out of Scope’
- If a household is no longer claiming HB and is not in scope for the cap under UC, it is assigned ‘Off HB
For example, a household that starts work and claims WTC but also has a reduction in benefit income to below the cap, is assigned as ‘In work’.
Outcomes are assessed for every cohort group and for each of the following subgroups: geography, family type, benefit type, age of youngest child and cap amount.
It should be noted that the analysis presented in this chapter represents a point in time or ‘snapshot’ of households’ circumstances twelve months after becoming capped. It does not reflect changes in circumstances that may occur for households before or after this point.
3.2 Status of capped households after twelve months
Table 3.1 shows the proportion of households for each outcome assessed, twelve months after they become capped sub-divided into the three cap groups: the lower cap only, both caps and all capped group. Single person households are included for context; however, they are excluded from the econometric analysis and presented separately in Annex F due to this group exhibiting different characteristics to lone parents and couples with children. As mentioned previously, outcomes are mutually exclusive and the figures in each row of the table sum up to 100 per cent.
Of all capped households at rollout, just over half are no longer capped after twelve months (53 per cent), and just under half are still capped (47 per cent; Figure 3.1). In addition, we observe that:
- 23 per cent are exempt from the cap because they move into work (either claiming WTC or earning enough to meet the work exemption under UC)
- 10 per cent are not in work, but in receipt of an exempting benefit, such as Carer’s Allowance, Employment and Support Allowance (Support Group), Personal Independence Payment (PIP) or Disability Living Allowance (DLA)
- 9 per cent have total benefit income below the cap levels
- 11 per cent are no longer claiming HB
- 47 per cent are still capped, either under HB or UC
Table 3.1 Status of capped households after twelve months, by household characteristics and cap group at rollout. For each cap group, rows add to 100%
| Twelve month outcome | Number of Households | Proportion in Both caps (%) | Lower cap only | Both caps | All capped | ||||||||||||
|---|---|---|---|---|---|---|---|---|---|---|---|---|---|---|---|---|---|
| In work (%) | Exempt (%) | Out of scope (%) | Off HB (%) | Capped (%) | In work (%) | Exempt (%) | Out of scope (%) | Off HB (%) | Capped (%) | In work (%) | Exempt (%) | Out of scope (%) | Off HB (%) | Capped (%) | |||
| Great Britain | 90,030 | 24 | 22 | 9 | 10 | 11 | 48 | 28 | 11 | 5 | 12 | 44 | 23 | 10 | 9 | 11 | 47 |
| Including Singles | 101,120 | 23 | 20 | 10 | 12 | 13 | 45 | 26 | 12 | 6 | 14 | 42 | 21 | 11 | 11 | 13 | 45 |
| Geography | |||||||||||||||||
| Greater London | 17,030 | 50 | 22 | 7 | 13 | 9 | 50 | 31 | 9 | 5 | 10 | 45 | 27 | 8 | 9 | 9 | 48 |
| Rest of Great Britain | 72,990 | 18 | 22 | 9 | 9 | 11 | 48 | 26 | 13 | 4 | 14 | 43 | 23 | 10 | 8 | 12 | 47 |
| Family type | |||||||||||||||||
| Lone parents | 67,610 | 22 | 21 | 8 | 10 | 9 | 52 | 26 | 10 | 5 | 11 | 48 | 22 | 9 | 9 | 10 | 51 |
| Couples with children | 22,360 | 31 | 26 | 12 | 10 | 17 | 36 | 33 | 13 | 3 | 16 | 34 | 28 | 12 | 8 | 16 | 36 |
| Couples w/o children | 60 | 28 | 9 | 21 | 19 | 35 | 16 | 6 | 0 | 47 | 29 | 18 | 8 | 15 | 27 | 33 | 17 |
| Singles | 11,090 | 17 | 1 | 17 | 29 | 27 | 26 | 2 | 21 | 25 | 28 | 25 | 1 | 17 | 28 | 27 | 26 |
| Benefit type | |||||||||||||||||
| IS | 50,960 | 23 | 20 | 7 | 8 | 9 | 55 | 25 | 10 | 4 | 11 | 50 | 21 | 8 | 8 | 10 | 54 |
| JSA | 16,200 | 26 | 31 | 7 | 12 | 13 | 37 | 36 | 7 | 5 | 15 | 37 | 32 | 7 | 10 | 14 | 37 |
| ESA WRAG | 13,560 | 25 | 14 | 24 | 12 | 13 | 37 | 19 | 28 | 5 | 13 | 35 | 15 | 25 | 10 | 13 | 37 |
| Other | 9,310 | 29 | 29 | 4 | 12 | 13 | 42 | 42 | 5 | 4 | 14 | 36 | 33 | 4 | 10 | 13 | 40 |
| Age of youngest child | |||||||||||||||||
| Under 2 years | 33,430 | 27 | 19 | 7 | 8 | 11 | 54 | 26 | 10 | 4 | 13 | 47 | 21 | 8 | 7 | 12 | 52 |
| Aged 2 | 13,620 | 23 | 20 | 8 | 8 | 10 | 54 | 27 | 10 | 4 | 12 | 46 | 22 | 8 | 7 | 11 | 52 |
| Aged 3-4 | 20,750 | 23 | 27 | 9 | 9 | 11 | 45 | 31 | 11 | 4 | 12 | 42 | 28 | 9 | 8 | 11 | 44 |
| Aged 5-19 | 21,320 | 22 | 24 | 13 | 14 | 11 | 39 | 30 | 14 | 7 | 12 | 37 | 25 | 13 | 12 | 11 | 39 |
Figure 3.1 Status of capped households twelve months after rollout of the lower benefit cap.
| Status | Number of households |
|---|---|
| Still Capped | 47 |
| Off HB | 11 |
| Benefit award below the cap | 9 |
| Movement onto an exempting benefit | 10 |
| Movement into Work | 23 |
The rate at which households move into work varies by whether the household is affected by the original benefit cap or the lower benefit cap only:
- households in the both caps group have a higher propensity to move into work (28 per cent) than those in the lower cap only group (22 per cent)
- households in the both caps group are slightly more likely to be in receipt of an exempting benefit (11 per cent) than those in the lower cap only group (9 per cent)
Work outcomes also differ depending on other characteristics, i.e. geography, family type, benefit type and age of youngest child.
- households in Greater London, couples with children, families with youngest children aged three or four and households that initially claim JSA are more likely to be in work after twelve months
- households in the Rest of Great Britain, couples without children and single households, families with children aged five to nineteen and households that were initially ESA (WRAG) claimants are more likely to be in receipt of an exempting benefit after twelve months
The percentage of households who are still capped twelve months after rollout in the both caps group, is slightly lower than for the lower cap only group (44 per cent vs 48 per cent). Lone parents, households receiving Income Support, and those with a youngest child aged two or under are more likely to still be capped after twelve months.
Table 3.2 shows the outcomes for households twelve months after rollout, by cap amount and geographical area. We observe that:
- increasing cap amounts below £150 per week are associated with increasing proportions of households moving into work. The maximum proportion in work in Great Britain is for households capped by £100-£150 per week (29 per cent). As cap amounts increase above £150 per week the percentage in work starts to decrease. The exception is in Greater London where the proportion of household in work continues to increase at increasing cap amounts
- the proportion of households in receipt of an exempting benefit increases gradually with cap amount, independently of the geography
- the proportion of households still capped is higher at lower cap amount
Our findings on work outcomes by cap amount differs from the descriptive analysis of the 2014 impact evaluation[footnote 35] of the original benefit cap, which found that the greater the cap amount, the greater the proportion of households in work.
The administrative data does not provide the scope for further analysis on how households change their circumstances in response to the cap. The quantitative and qualitative analysis on the impact of the cap, by NatCen, provides some detailed information on how this group did actually respond to the cap; specifically, Section 3.4 “Whether still affected by the cap”.
Table 3.2 Status of capped households after twelve months by cap amount and geography at rollout. Rows add to 100% for each geography
| Cap amount | Number of Households | Proportion in Greater London (%) | Greater London | Rest of Great Britain | Great Britain | ||||||||||||
|---|---|---|---|---|---|---|---|---|---|---|---|---|---|---|---|---|---|
| In work (%) | Exempt (%) | Out of scope (%) | Off HB (%) | Capped (%) | In work (%) | Exempt (%) | Out of scope (%) | Off HB (%) | Capped (%) | In work (%) | Exempt (%) | Out of scope (%) | Off HB (%) | Capped (%) | |||
| Up to £25 | 25,700 | 16 | 20 | 6 | 15 | 9 | 50 | 19 | 8 | 13 | 10 | 51 | 19 | 7 | 13 | 10 | 51 |
| £25-£50 | 17,440 | 21 | 23 | 7 | 10 | 9 | 52 | 22 | 9 | 10 | 12 | 47 | 22 | 9 | 10 | 11 | 48 |
| £50-£100 | 25,710 | 19 | 29 | 7 | 8 | 8 | 48 | 24 | 11 | 7 | 12 | 46 | 25 | 10 | 7 | 11 | 47 |
| £100-£150 | 11,780 | 19 | 32 | 10 | 4 | 10 | 44 | 28 | 13 | 4 | 13 | 42 | 29 | 12 | 4 | 12 | 42 |
| £150-£200 | 5,200 | 21 | 32 | 10 | 4 | 11 | 43 | 27 | 13 | 4 | 14 | 43 | 28 | 12 | 4 | 13 | 43 |
| £200 or more | 4,200 | 27 | 37 | 12 | 2 | 12 | 37 | 23 | 13 | 5 | 16 | 43 | 27 | 13 | 4 | 15 | 41 |
3.2.1 Status by type of exempting benefit.
Moving into receipt of an exempting benefit is the second most frequent reason for becoming exempt from the application of the cap. Annex A gives a full list of the exempting benefits.
Table 3.3 shows the most common combinations of exempting benefits and the percentage of capped households in receipt of these twelve months after the lower benefit cap rollout, sub-divided by geography, family type, benefit type and cap group. We observe for households moving on to an exempting benefit:
- the most common benefits received are ESA Support Group (SG), DLA/PIP, and a combination of Carer’s Allowance and Child DLA, with 2 per cent of the rollout cohort in receipt of each of these benefit combinations twelve months later
- the proportion of households moving into receipt of an exempting benefit, related to health conditions or disability, is higher for couples with children (3, 2 and 1 per cent respectively for ESA SG, DLA/PIP and DLA/PIP & ESA SG), than for lone parents (1, 2 and <0.5 per cent, respectively), whilst the opposite is true for exempting benefits for carers; lone parents are more likely to move into receipt of Carer’s Allowance with/without Child DLA, compared to couples with children (4 per cent vs. 3 per cent, respectively)
- households receiving ESA Work Related Activity Group (WRAG) at rollout are the most likely to move on to an exempting benefit, most commonly to ESA SG (9 per cent) and DLA/PIP (7 per cent)
Table 3.3 Exempting benefit status of all capped households twelve months after rollout, by household characteristics at rollout.
| Exempting benefit | ESA SG only (%) | DLA/PIP only (%) | DLA/PIP & ESA SG (%) | Child DLA only (%) | Carer’s Allowance only (%) | Carer’s Allowance and Child DLA (%) | Other (%) |
|---|---|---|---|---|---|---|---|
| Great Britain | 2 | 2 | 1 | 1 | 1 | 2 | 1 |
| Geography | |||||||
| Greater London | 3 | 3 | 1 | 1 | 1 | 1 | <0.5 |
| Rest of Great Britain | 2 | 2 | 1 | 1 | 1 | 2 | 1 |
| Family type | |||||||
| Lone parents | 1 | 2 | <0.5 | 2 | 1 | 3 | <0.5 |
| Couples with children | 3 | 2 | 1 | 1 | 1 | 2 | 3 |
| Benefit type | |||||||
| IS | <0.5 | 1 | <0.5 | 2 | 1 | 3 | <0.5 |
| JSA | 1 | 1 | <0.5 | 1 | 1 | 1 | 1 |
| ESA WRAG | 9 | 7 | 4 | 1 | 1 | 1 | 3 |
| Cap group | |||||||
| Lower only | 2 | 2 | 1 | 1 | 1 | 2 | 1 |
| Both caps | 2 | 3 | 1 | 2 | 1 | 3 | 1 |
Changes in cap amount
As shown in Table 3.1, capped households experience a reduction in their total weekly benefit income from the moment they become capped to twelve months after. We assess here the change in cap amount during the tracking period. Note that the number of households at rollout is larger (Table 3.4) than twelve months after rollout (Table 3.5). This is because after twelve months, some of these households are no longer capped (53 per cent) and are not subject to any cap amount. We are only able to observe the cap amount twelve months after rollout for those who are still capped (47 per cent of households).
Figure 3.2 shows the cap amount distribution at rollout and twelve months later. We observe an increase (6 percentage points) in the proportion of households with smaller cap amounts (up to £25 per week), and corresponding reductions in the proportion of households capped by larger amounts. This is observed across the different geographies, types of families, benefit types and age of youngest child as presented in Table 3.4 and Table 3.5.
Figure 3.2 Proportion of capped households by cap amount at rollout of the lower benefit cap and twelve months after rollout
| £0-£25 (%) | £25-£50 (%) | £50-£100 (%) | £100-£150 (%) | £150-£200 (%) | £200 or more (%) | |
|---|---|---|---|---|---|---|
| Cap amount at rollout | 29 | 19 | 29 | 13 | 6 | 5 |
| Cap amount at twelve months | 35 | 19 | 26 | 11 | 5 | 4 |
The mean weekly cap amount for capped households at rollout is £69 (a median of £53); 76 per cent of the households have cap amounts of £100 or less per week. Twelve months after they become capped, the mean cap amount reduces to £63 a week (median of £46); the percentage of capped households with cap amounts below £100 per week increases to 82 per cent.
The average reduction in cap amount is similar in Greater London and the Rest of Great Britain. The weekly amount falls from a mean of £77 (median of £57) to £70 (median of £51) in Greater London and from £68 (median of £52) to £62 (median of £44) in the Rest of Great Britain.
Table 3.4 Number and proportion of capped households, by cap amount at rollout
| Initial cap amount | Number of households | Up to £25 (%) | £25-£50 (%) | £50-£100 (%) | £100-£150 (%) | £150-£200 (%) | £200 or more (%) |
|---|---|---|---|---|---|---|---|
| All capped | |||||||
| Great Britain | 90,030 | 29 | 19 | 29 | 13 | 6 | 5 |
| Including singles | 101,120 | 30 | 21 | 28 | 12 | 5 | 4 |
| Geography | |||||||
| Greater London | 17,030 | 24 | 21 | 29 | 13 | 7 | 7 |
| Rest of Great Britain | 72,990 | 30 | 19 | 29 | 13 | 6 | 4 |
| Family type | |||||||
| Lone parents | 67,610 | 31 | 19 | 29 | 12 | 5 | 4 |
| Couples with children | 22,360 | 21 | 20 | 28 | 17 | 8 | 7 |
| Couples w/o children | 60 | 33 | 27 | 18 | 8 | 8 | 5 |
| Singles | 11,090 | 41 | 31 | 19 | 5 | 2 | 1 |
| Benefit type | |||||||
| IS | 50,960 | 30 | 19 | 30 | 12 | 5 | 4 |
| JSA | 16,200 | 24 | 22 | 27 | 15 | 6 | 6 |
| ESA WRAG | 13,560 | 25 | 20 | 28 | 14 | 7 | 5 |
| Other | 9,310 | 32 | 18 | 26 | 12 | 6 | 5 |
| Age of youngest child | |||||||
| Under 2 | 33,430 | 26 | 18 | 29 | 14 | 7 | 6 |
| Aged 2 | 13,620 | 29 | 19 | 29 | 13 | 6 | 5 |
| Aged 3-4 | 20,750 | 29 | 19 | 29 | 13 | 5 | 4 |
| Aged 5-19 | 21,320 | 31 | 21 | 28 | 12 | 5 | 4 |
Table 3.5 Number and proportion of capped households, by cap amount twelve months after rollout
| Final cap amount (£ per week) | Number of Households | Up to £25 (%) | £25-£50 (%) | £50-£100 (%) | £100-£150 (%) | £150-£200 (%) | £200 or more (%) |
|---|---|---|---|---|---|---|---|
| All capped | |||||||
| Great Britain | 42,310 | 35 | 19 | 26 | 11 | 5 | 4 |
| Including singles | 45,190 | 36 | 20 | 26 | 10 | 5 | 4 |
| Geography | |||||||
| Greater London | 8,120 | 32 | 21 | 26 | 12 | 5 | 5 |
| Rest of Great Britain | 34,190 | 36 | 18 | 26 | 11 | 5 | 4 |
| Family type | |||||||
| Lone parents | 34,340 | 37 | 19 | 26 | 10 | 4 | 3 |
| Couples with children | 7,970 | 27 | 20 | 25 | 13 | 7 | 7 |
| Couples without children | 10 | 60 | 20 | 0 | 0 | 10 | 10 |
| Singles | 2,880 | 44 | 36 | 15 | 3 | 1 | 1 |
| Benefit type | |||||||
| IS | 27,580 | 36 | 18 | 27 | 10 | 4 | 3 |
| JSA | 6,040 | 32 | 22 | 24 | 12 | 5 | 5 |
| ESA WRAG | 4,950 | 34 | 20 | 25 | 11 | 5 | 5 |
| Other | 3,740 | 35 | 17 | 25 | 11 | 6 | 6 |
| Age of youngest child | |||||||
| Under 2 | 17,480 | 32 | 18 | 28 | 12 | 5 | 5 |
| Aged 2 | 7,130 | 35 | 19 | 26 | 11 | 5 | 4 |
| Aged 3-4 | 9,190 | 38 | 18 | 25 | 10 | 5 | 3 |
| Aged 5-19 | 8,260 | 39 | 21 | 24 | 10 | 4 | 3 |
Receipt of Discretionary Housing Payments
A Discretionary Housing Payment (DHP) may be awarded when a LA considers that a claimant requires further financial assistance towards housing costs and is entitled to either Housing Benefit (HB) or UC with housing cost element towards rental liability[footnote 36]. DHP is a discretionary scheme managed by LAs in England and Wales (with funding devolved to the Scottish Government from April 2017).
As part of the welfare reforms package introduced from 2011, the Government increased its contribution towards DHPs to help LAs support those affected by some of the key changes to HB:
- the introduction of the benefit cap, which is administered through HB and UC
- the removal of the spare room subsidy (RSRS) in the Social Rented Sector
- the local housing allowance (LHA) reforms
DHPs may help households reduce the financial impact of a deduction in their HB award due to the cap, and thus, being in receipt of a DHP may affect households’ response to the cap[footnote 37].
The previous evaluation of the benefit cap analysed capped households in receipt of DHPs using HB administrative data (SHBE) but noted limitations in the data. As LAs are not required to record DHPs for each household’s HB claim or the frequency or duration of DHP awards in the Single Housing Benefit Extract (SHBE) administrative dataset, DHP awards are under-reported in the dataset used in this evaluation. This limits the scope for analysis and thus DHPs related to the lower benefit cap policy are not assessed in this report.
Further information on the allocation of DHPs to benefit cap households can be found in Chapter 6, “Discretionary Housing Payments (DHPs)” of the NatCen report.
4. Econometric analysis into employment impacts
This chapter first presents, in Section 4.1, some descriptive analysis on the work status of households pre- and post-introduction of the lower benefit cap policy. It then presents econometric analysis to determine the causal impact of the lower benefit cap on employment i.e. whether the benefit cap results in increased movement into work twelve months after rollout[footnote 38]. Subgroup analysis on the work impacts is provided for geography, family type, benefit type, age of youngest child and cap amount.
Single person households are excluded throughout and are presented separately in Annex F. In addition, work outcomes for households who migrate from HB to Universal Credit are described in Annex D.
4.1 Descriptive analysis on work status and total weekly benefit income
This section contains descriptive analysis on households’ work status, measured over the 25-month tracking period, and total weekly benefit income during the twelve months after rollout. The purpose of this section is to assess whether there is any difference between the work status of the all capped group and the comparison group before the lower benefit cap rolled out and subsequently. This sets the scene for the econometric analysis presented in Section 4.2 onwards.
Figure 4.1 presents the difference in employment status between capped households and the comparison group. That is the proportion of capped households with an open Working Tax Credit (WTC) claim compared to the comparison group, tracked twelve months before (-12 to -1) and twelve months after (1 to 12) the rollout of the lower benefit cap. Month 0 represents the month in which the lower benefit cap starts to roll out and is dependent on the LA where a household resides. By definition, no households that are subject to the benefit cap could be claiming WTC at the time of rollout; so the lines tend to zero for all groups in the months before rollout.
Twelve months before the lower cap rollout, 13 per cent of the lower cap only group, 15 per cent of the both caps group and 12 per cent of the comparison group are claiming WTC. Therefore, the employment rates for the capped groups are only 1 and 3 percentage points above the comparison group. Twelve months after rollout, the proportion of households claiming WTC increases for all groups, reaching 22 and 28 per cent, respectively for the lower cap only and the both caps groups, 5 and 11 percentage points above the comparison group (17 per cent).
Figure 4.1 Percentage of households with an open WTC claim in Great Britain, twelve months before and twelve months after the lower benefit cap rollout.
| Group | -12 (%) | -11 (%) | -10 (%) | -9 (%) | -8 (%) | -7 (%) | -6 (%) | -5 (%) | -4 (%) | -3 (%) | -2 (%) | -1 (%) | 0 (%) | 1 (%) | 2 (%) | 3 (%) | 4 (%) | 5 (%) | 6 (%) | 7 (%) | 8 (%) | 9 (%) | 10 (%) | 11 (%) | 12 (%) |
|---|---|---|---|---|---|---|---|---|---|---|---|---|---|---|---|---|---|---|---|---|---|---|---|---|---|
| Lower only | 13 | 12 | 11 | 10 | 9 | 8 | 7 | 6 | 5 | 3 | 2 | 1 | 0 | 3 | 5 | 8 | 10 | 13 | 14 | 16 | 17 | 19 | 20 | 21 | 22 |
| Both caps | 14 | 14 | 13 | 12 | 12 | 10 | 9 | 8 | 7 | 5 | 3 | 1 | 0 | 4 | 8 | 11 | 13 | 16 | 18 | 21 | 22 | 23 | 25 | 26 | 28 |
| Comparison group | 12 | 12 | 11 | 10 | 9 | 8 | 7 | 6 | 5 | 3 | 2 | 1 | 0 | 2 | 4 | 5 | 7 | 9 | 10 | 12 | 13 | 14 | 16 | 17 | 17 |
Larger cap amounts have been associated with a greater proportion of households moving into work after twelve months, as stated in the 2014 impact evaluation of the benefit cap[footnote 39]. However, in the current evaluation the relationship between the rate of movement into work and cap amount is more complex, as discussed in Section 3.2.
Figures 4.2 and 4.3 show the total household weekly benefit income at the start of the cohort tracking period (before the cap is applied and rounded to the nearest £5) against the proportion of in-work households, twelve months later, for the rollout cohort (t) and two pre-treatment groups (t-1 and t-2), in Greater London and the Rest of Great Britain, respectively. We apply a weighted four-point moving average[footnote 40] to visualise the trend in the proportion of in-work households and vertical lines to mark the original, and lower benefit cap levels. The secondary axis (on the right) relates to the bars which represent the number of households claiming WTC in the rollout cohort (t). Note the relatively small number of households receiving the largest amounts of total weekly benefit income. Results for this group are therefore more volatile and less reliable.
The two pre-treatment cohorts t-1 and t-2 allow us to compare and track work outcomes for potentially capped households up to two years prior to the introduction of the lower benefit cap levels. Around half of the households in the rollout cohort were also in the t-1 cohort; so they may have been offered pre-implementation support six months before the introduction of the lower cap (details of the pre-implementation support is in Section 1.3) and this may be reflected in their employment. The t-2 group did not receive any pre-implementation support during their cohort tracking period. Therefore, the t-2 group is considered the main comparison group, as their behaviour is less likely to be influenced by the policy. It is, of course, still possible that some of this group will have been aware of the policy change, particularly those that remain in scope for a longer duration.
Figure 4.2 shows the percentage of households claiming WTC by total weekly benefit income in Greater London. For the t-2 cohort, we observe a relatively flat line below the original cap level of total benefit income (£500 per week), when households would have been in scope for the original cap. However, above this, we observe an increased likelihood of moving into work as total weekly benefit income increases. The proportion of in-work households in the t-1 cohort increases at an earlier point, possibly as a result of the pre-implementation support offered to these households. At benefit income levels above the original cap, we also observe an increasing employment rate with increasing benefit income. This is consistent with the results of the 2014 impact evaluation, as the t-1 and t-2 cohorts with total benefit income above £500 a week would have been in scope for the original benefit cap.
For the rollout cohort, the increased proportion of households moving into work as a direct result of the cap is apparent from the point where the total weekly benefit income levels are equal to the lower cap (£442), with a clear increasing trend between the two cap levels. It appears that the larger the amount of benefit income capped, the more likely it may be that households move into work, although as mentioned above, this relationship is complex and the number of households capped by higher amounts is small which results in less reliable findings for these households.
Figure 4.2 The proportion of households in work after twelve months, by total weekly benefit income, in Greater London.
| Total weekly benefit income (£) | Rollout cohort (%) | Rollout cohort t-1 (%) | Rollout cohort t-2 (%) | Number of households in the rollout cohort in receipt of WTC |
|---|---|---|---|---|
| 390 | 19 | 13 | 20 | 19 |
| 395 | 19 | 19 | 20 | 199 |
| 400 | 20 | 18 | 21 | 273 |
| 405 | 17 | 19 | 20 | 216 |
| 410 | 19 | 19 | 20 | 208 |
| 415 | 17 | 18 | 22 | 334 |
| 420 | 18 | 17 | 19 | 180 |
| 425 | 16 | 17 | 22 | 233 |
| 430 | 19 | 18 | 19 | 187 |
| 435 | 16 | 19 | 21 | 155 |
| 440 | 21 | 20 | 20 | 189 |
| 445 | 16 | 19 | 19 | 111 |
| 450 | 19 | 19 | 22 | 160 |
| 455 | 20 | 24 | 21 | 164 |
| 460 | 21 | 22 | 21 | 239 |
| 465 | 21 | 22 | 19 | 156 |
| 470 | 21 | 17 | 20 | 126 |
| 475 | 22 | 22 | 20 | 150 |
| 480 | 22 | 23 | 22 | 227 |
| 485 | 20 | 19 | 21 | 102 |
| 490 | 24 | 22 | 21 | 152 |
| 495 | 27 | 20 | 26 | 145 |
| 500 | 27 | 22 | 20 | 157 |
| 505 | 28 | 22 | 21 | 148 |
| 510 | 25 | 23 | 24 | 107 |
| 515 | 26 | 23 | 24 | 97 |
| 520 | 30 | 23 | 22 | 151 |
| 525 | 29 | 25 | 28 | 194 |
| 530 | 31 | 22 | 22 | 104 |
| 535 | 32 | 29 | 23 | 171 |
| 540 | 29 | 28 | 30 | 109 |
| 545 | 31 | 25 | 20 | 98 |
| 550 | 30 | 25 | 25 | 83 |
| 555 | 27 | 31 | 25 | 65 |
| 560 | 26 | 30 | 27 | 52 |
| 565 | 28 | 27 | 31 | 61 |
| 570 | 34 | 26 | 31 | 90 |
| 575 | 35 | 37 | 29 | 60 |
| 580 | 38 | 26 | 24 | 81 |
| 585 | 39 | 27 | 34 | 52 |
| 590 | 36 | 27 | 29 | 55 |
| 595 | 32 | 39 | 27 | 47 |
| 600 | 32 | 36 | 24 | 66 |
| 605 | 40 | 42 | 31 | 62 |
| 610 | 31 | 28 | 31 | 33 |
| 615 | 35 | 26 | 26 | 45 |
| 620 | 21 | 31 | 26 | 19 |
| 625 | 25 | 33 | 32 | 17 |
| 630 | 30 | 33 | 39 | 25 |
| 635 | 29 | 27 | 28 | 18 |
| 640 | 36 | 41 | 30 | 24 |
| 645 | 39 | 41 | 33 | 37 |
| 650 | 38 | 36 | 42 | 23 |
| 655 | 39 | 38 | 29 | 23 |
| 660 | 35 | 36 | 40 | 24 |
| 665 | 33 | 30 | 33 | 15 |
| 670 | 37 | 33 | 26 | 30 |
| 675 | 25 | 47 | 36 | 14 |
| 680 | 32 | 34 | 40 | 11 |
| 685 | 39 | 33 | 28 | 13 |
| 690 | 38 | 31 | 33 | 13 |
| 695 | 33 | 26 | 39 | 7 |
| 700 | 58 | 45 | 31 | 14 |
| 705 | 25 | 39 | 32 | 4 |
| 710 | 43 | 38 | 27 | 10 |
| 715 | 40 | 37 | 32 | 12 |
| 720 | 38 | 37 | 43 | 11 |
| 725 | 28 | 34 | 24 | 9 |
| 730 | 38 | 40 | 31 | 10 |
| 735 | 18 | 33 | 38 | 9 |
| 740 | 54 | 29 | 25 | 7 |
| 745 | 39 | 27 | 27 | 11 |
| 750 | 50 | 36 | 23 | 3 |
| 755 | 32 | 39 | 29 | 6 |
| 760 | 33 | 23 | 15 | 3 |
| 765 | 20 | 38 | 32 | 2 |
| 770 | 40 | 45 | 28 | 4 |
| 775 | 40 | 40 | 20 | 6 |
| 780 | 75 | 31 | 7 | 6 |
| 785 | 44 | 43 | 22 | 4 |
| 790 | 17 | 35 | 21 | 1 |
| 795 | 30 | 42 | 32 | 3 |
| 800 | 50 | 48 | 26 | 5 |
In the Rest of Great Britain (Figure 4.3), the relationship between household’s total weekly benefit income subject to the cap and movement into work shows a similar trend to that in Greater London (Figure 4.2) below the original cap level of £500 per week. For the t-1 and t-2 cohorts, the proportion of households in employment follows a relatively flat trend, above the original cap level of £500 of total weekly benefit income, when households would have been in scope for the original cap. There is a clear increase in the proportion of in-work households for the rollout cohort, from the lower cap level of £385 per week until the original benefit cap level. Thereafter it starts to level off and remains above the proportions seen in the t-1 and t-2 cohorts (except for the highest weekly benefit incomes above £595 per week).
Figure 4.3 The proportion of households in work after twelve months, by total weekly benefit income, in the Rest of Great Britain.
| Total weekly benefit income (£) | Rollout cohort (%) | Rollout cohort t-1 (%) | Rollout cohort t-2 (%) | Number of households in the rollout cohort in receipt of WTC |
|---|---|---|---|---|
| 335 | 17 | 19 | 22 | 482 |
| 340 | 18 | 20 | 21 | 1,216 |
| 345 | 18 | 20 | 22 | 1,249 |
| 350 | 18 | 20 | 22 | 916 |
| 355 | 19 | 21 | 22 | 812 |
| 360 | 18 | 19 | 21 | 644 |
| 365 | 17 | 19 | 20 | 765 |
| 370 | 18 | 19 | 20 | 979 |
| 375 | 17 | 18 | 20 | 1,112 |
| 380 | 17 | 18 | 19 | 1,094 |
| 385 | 18 | 17 | 19 | 960 |
| 390 | 17 | 18 | 19 | 844 |
| 395 | 19 | 18 | 18 | 831 |
| 400 | 19 | 18 | 21 | 740 |
| 405 | 19 | 20 | 20 | 846 |
| 410 | 19 | 19 | 20 | 656 |
| 415 | 21 | 22 | 20 | 637 |
| 420 | 23 | 22 | 22 | 772 |
| 425 | 23 | 22 | 20 | 553 |
| 430 | 21 | 20 | 20 | 453 |
| 435 | 24 | 21 | 21 | 534 |
| 440 | 23 | 19 | 18 | 556 |
| 445 | 24 | 21 | 19 | 677 |
| 450 | 21 | 20 | 19 | 553 |
| 455 | 22 | 21 | 20 | 501 |
| 460 | 25 | 20 | 18 | 512 |
| 465 | 26 | 21 | 19 | 466 |
| 470 | 25 | 19 | 17 | 401 |
| 475 | 25 | 21 | 20 | 426 |
| 480 | 28 | 21 | 20 | 455 |
| 485 | 26 | 22 | 19 | 357 |
| 490 | 30 | 23 | 22 | 361 |
| 495 | 31 | 23 | 20 | 309 |
| 500 | 29 | 22 | 19 | 230 |
| 505 | 27 | 22 | 19 | 242 |
| 510 | 26 | 21 | 20 | 291 |
| 515 | 25 | 23 | 19 | 254 |
| 520 | 27 | 20 | 17 | 259 |
| 525 | 26 | 20 | 21 | 205 |
| 530 | 27 | 21 | 17 | 197 |
| 535 | 26 | 20 | 21 | 159 |
| 540 | 25 | 20 | 22 | 141 |
| 545 | 32 | 27 | 25 | 163 |
| 550 | 26 | 18 | 20 | 116 |
| 555 | 28 | 24 | 19 | 129 |
| 560 | 25 | 23 | 21 | 105 |
| 565 | 24 | 21 | 21 | 80 |
| 570 | 31 | 27 | 20 | 92 |
| 575 | 29 | 18 | 22 | 94 |
| 580 | 25 | 26 | 18 | 73 |
| 585 | 25 | 23 | 20 | 68 |
| 590 | 23 | 21 | 26 | 53 |
| 595 | 20 | 26 | 23 | 57 |
| 600 | 24 | 19 | 26 | 40 |
| 605 | 25 | 27 | 23 | 46 |
| 610 | 25 | 29 | 22 | 40 |
| 615 | 28 | 28 | 17 | 39 |
| 620 | 19 | 22 | 21 | 29 |
| 625 | 29 | 20 | 19 | 34 |
| 630 | 18 | 20 | 16 | 21 |
| 635 | 25 | 20 | 24 | 29 |
| 640 | 23 | 28 | 22 | 22 |
| 645 | 22 | 22 | 37 | 21 |
| 650 | 17 | 22 | 23 | 13 |
| 655 | 28 | 23 | 24 | 22 |
| 660 | 28 | 10 | 18 | 21 |
| 665 | 18 | 29 | 20 | 11 |
| 670 | 28 | 35 | 21 | 14 |
| 675 | 23 | 18 | 26 | 16 |
| 680 | 23 | 33 | 26 | 10 |
| 685 | 26 | 19 | 29 | 12 |
| 690 | 17 | 13 | 28 | 6 |
| 695 | 24 | 17 | 31 | 11 |
| 700 | 17 | 38 | 24 | 7 |
| 705 | 9 | 35 | 29 | 2 |
| 710 | 9 | 21 | 37 | 3 |
| 715 | 19 | 24 | 33 | 5 |
| 720 | 13 | 20 | 15 | 4 |
| 725 | 13 | 15 | 33 | 3 |
| 730 | 34 | 24 | 36 | 10 |
| 735 | 16 | 21 | 35 | 3 |
| 740 | 38 | 20 | 15 | 13 |
| 745 | 27 | 18 | 23 | 4 |
| 750 | 24 | 21 | 27 | 4 |
| 755 | 20 | 0 | 36 | 3 |
| 760 | 30 | 38 | 14 | 3 |
| 765 | 38 | 27 | 31 | 3 |
| 770 | 20 | 25 | 13 | 2 |
| 775 | 0 | 10 | 31 | 0 |
| 780 | 17 | 27 | 7 | 1 |
| 785 | 0 | 44 | 20 | 0 |
| 790 | 31 | 18 | 44 | 4 |
| 795 | 27 | 22 | 0 | 3 |
Econometric methodology overview
To assess whether the increased movement into employment for capped households can be attributed to the introduction of the lower, tiered, benefit cap, we carry out a regression analysis. This allows us to control for any differences in observed characteristics between the comparison group and the capped groups, as well as to control for any pre-existing time trends between them.
We use a linear difference-in-difference model methodology and apply it to the rollout cohort groups. This methodology uses a binary dependent variable of whether the household is claiming WTC or not, twelve months after rollout, to identify the differences in employment rates for capped households, compared to similar uncapped households, controlling for observed factors that may affect the likelihood of claiming WTC (e.g. number of children). A full technical description of the econometric methodology can be found in Annex E and the composition of the rollout cohort by cap group and demographic characteristics can be found in Chapter 2.
In Chapters 4, 5 and 6, we present the econometric headline findings and subgroup analysis using three main statistics to describe the impacts of the lower benefit cap policy on employment:
- counterfactual baseline estimate – This is the proportion of households in employment twelve months after rollout in the absence of the lower benefit cap policy
- percentage point increase (ppt) – The absolute difference in the proportion of households in employment between the lower benefit cap and the counterfactual baseline estimate
- percentage increase – The percentage difference in the proportion of households in employment between the lower benefit cap and the counterfactual baseline estimate[footnote 41]
The results presented in this analysis represent employment outcomes for capped households twelve months after rollout. Clearly, households may continue to move in and out of work after this time. The observed employment impacts are all statistically significant at the 1 per cent level.
4.3 National results
At a national level (Great Britain), twelve months after rollout, 23 per cent of capped households are in employment, compared to an estimated counterfactual of 18 per cent, which represents what would happen independently of the lower cap. After controlling for other factors, capped households are 5.1 percentage points more likely to move into work than the comparison group. This is a relative increase in the employment rate of 28 per cent, from 18 to 23 per cent.
Figure 4.4 illustrates the estimated employment impact of the lower cap after controlling for other factors that may influence the likelihood of households moving into work. Expressed another way, out of 100 capped households, we observe that after twelve months:
- 23 households move into work, of which 18 would have moved into work in the absence of the cap; this suggests an additional 5 households moving into work due to the lower benefit cap policy
The overall impact of the lower benefit cap on work outcomes varies depending on whether the household is in the both caps or the lower cap only group. Households in the former are more likely to move into work although both groups are significantly more likely to move into work compared to the comparison group.
Figure 4.4 Econometric analysis of work outcomes for all capped households, twelve months after rollout, Great Britain.
| Status | Number of households |
|---|---|
| Do not move into work | 77 |
| Would have moved into work regardless of the cap | 18 |
| Impact of the cap | 5 |
- lower cap only group: 22 per cent of the lower cap only group are in work after twelve months, compared to 18 per cent of the comparison group; a difference of 4.1 percentage points or a relative increase in the employment rate of 23 per cent
- both caps group: 28 per cent of the both caps group are in work after twelve months, compared to 19 per cent of the comparison group; a difference of 8.4 percentage points or a relative increase in the employment rate of 43 per cent
Subgroup analysis
From Chapter 2, we recall that the all capped group is predominantly made up of lone parent households, households claiming Income Support (IS) and those with young children[footnote 42].
Here we estimate the twelve-month impact of the lower benefit cap on employment for the subgroups assessed, shown in Table 4.1 and we subsequently discuss the results in more detail.
Table 4.1 Twelve-month impact of the lower benefit cap on employment, by household characteristics and cap group.
| Group | Lower cap only | Both caps | All capped | ||||||
|---|---|---|---|---|---|---|---|---|---|
| Counter-factual baseline (%) | Increase | Counter-factual baseline (%) | Increase | Counter-factual baseline (%) | Increase | ||||
| PPT | % | PPT | % | PPT | % | ||||
| Great Britain | 18 | 4.1*** | 23 | 19 | 8.4*** | 43 | 18 | 5.1*** | 28 |
| Geography | |||||||||
| Greater London | 18 | 2.8*** | 15 | 22 | 8.9*** | 41 | 20 | 5.8*** | 29 |
| Rest of Great Britain | 17 | 4.3*** | 25 | 18 | 7.7*** | 42 | 18 | 5.0*** | 28 |
| Family Type | |||||||||
| Lone parents | 16 | 4.2*** | 25 | 17 | 8.4*** | 50 | 17 | 5.1*** | 31 |
| Couples with children | 22 | 3.9*** | 18 | 24 | 8.8*** | 36 | 22 | 5.4*** | 24 |
| Benefit type | |||||||||
| IS | 16 | 4.4*** | 28 | 15 | 8.9*** | 58 | 16 | 5.4*** | 35 |
| JSA | 26 | 4.1*** | 15 | 28 | 7.6*** | 27 | 27 | 5.0*** | 19 |
| ESA WRAG | 11 | 2.9*** | 27 | 12 | 7.4*** | 63 | 11 | 4.0*** | 36 |
| Youngest child | |||||||||
| Under 2 | 14 | 4.3*** | 29 | 15 | 10.6*** | 70 | 15 | 6.0*** | 41 |
| Aged 2 | 15 | 4.8*** | 32 | 17 | 9.8*** | 56 | 16 | 6.0*** | 38 |
| Aged 3-4 | 22 | 4.2*** | 19 | 24 | 5.9*** | 25 | 23 | 4.6*** | 21 |
| Aged 5-19 | 20 | 3.5*** | 17 | 23 | 7.4*** | 33 | 20 | 4.3*** | 21 |
Figure 4.5 gives a visual representation of the relative impact of the lower benefit cap on employment for the all capped group, drawing on the information in Table 4.1. The Jobseeker’s Allowance (JSA) group has the largest employment rate twelve months after rollout of the lower benefit cap (32 per cent, comprising a baseline rate of 27 per cent and an increase from the benefit cap of 5 percentage points) and households with a youngest child aged two or under have the greatest percentage point increase in movement into work attributable to the lower benefit cap policy.
Figure 4.5 Econometric analysis of work outcomes for all capped households (in percentage points) by household characteristics at rollout.
| Employment rate in the absence of the benefit cap | Change in employment rate due to the benefit cap | |
|---|---|---|
| Great Britain | 18.1 | 5.1 |
| Geography: | 0.0 | 0.0 |
| Greater London | 20.2 | 5.8 |
| Rest of Great Britain | 17.6 | 5.0 |
| Family Type: | 0.0 | 0.0 |
| Lone parents | 16.6 | 5.1 |
| Couples with children | 22.4 | 5.4 |
| Main Benefit: | 0.0 | 0.0 |
| IS | 15.5 | 5.4 |
| JSA | 26.8 | 5.0 |
| ESA WRAG | 11.1 | 4.0 |
| Youngest child: | 0.0 | 0.0 |
| Under 2 | 14.7 | 6.0 |
| Aged 2 | 15.6 | 6.0 |
| Aged 3-4 | 22.6 | 4.6 |
| Aged 5-19 | 20.4 | 4.3 |
By Geography
- households in Greater London are more likely to move into work compared to those in the Rest of Great Britain; 5.8 percentage points versus 5.0 percentage points but the relative increase in employment is similar for the two geographies
- the impact of the cap is particularly apparent for those households in the both caps group living in Greater London, who are 8.9 percentage points more likely to be in work, after twelve months, than the comparison group
- of those households in the lower cap only group, the impact of the cap is larger for those living in the Rest of Great Britain than for Greater London, who are 4.3 percentage points more likely to be in work than the comparison group
By family type
The subgroup analysis by family type focuses only on lone parents and couples with children, due to the small sample size for couples without children (couples without children are included in the national regression model)[footnote 43].
- the percentage point impact of the lower benefit cap on employment is broadly the same for couples with children and for lone parent households, who are 5.4 and 5.1 percentage points, respectively, more likely to move into employment than the comparison group
- as the counterfactual estimate is 22 per cent for couples with children in work compared to 17 per cent of lone parents, the percentage point increase is larger for lone parents
- the impact of the cap on lone parents and couples with children is greater for households who are in scope for both caps than the lower cap only
- the cap has a similar impact on employment outcomes for lone parents and couples with children when they are in scope for the lower cap only (around 4 percentage points) and both caps (8-9 percentage points)
4.4.3 By benefit type
We also assess the twelve-month impact of the lower benefit cap on employment by the main benefit a household receives in addition to HB i.e. their benefit type.
In Table 4.1 we observe that:
- there is a positive impact of the lower benefit cap on employment compared to the comparison group for all benefit types; this is greater for households claiming IS, followed by JSA and ESA WRAG, with an increase in their likelihood to move into work by 5.4, 5.0 and 4.0 percentage points, respectively
- relative to the counterfactual baseline, the percentage increase is greater for IS and ESA WRAG than for JSA
- the impact of the lower benefit cap on employment is particularly marked for those in the both caps group, with the largest impact seen for capped households in receipt of IS who are 8.9 percentage points more likely to move into work than the comparison group
Further analysis of the impacts of the lower benefit cap on employment by benefit type can be found in Section 3.5 Changes in Benefit Type of the NatCen survey.
4.4.4 By age of youngest child:
We assess the impact of the lower benefit cap on employment by the age of youngest child; the analysis is divided into four sub-groups: households with a youngest child aged under two, youngest child aged two, youngest child aged three to four and a youngest child aged five to nineteen.
- the largest impact of the lower benefit cap on movement into work is observed for those households with a youngest child aged two and under two, who are both 6.0 percentage points more likely to move into work than the comparison group. We also find a positive work impact for households with a youngest child aged three to four and aged five to nineteen
- in the absence of the lower benefit cap, employment rates generally increase as the age of the youngest child increases. The counterfactual estimate rises from 15 per cent for households with a youngest child aged under two to 20 per cent where the youngest child is aged five to nineteen
- the relative increases in employment rates due to the benefit cap is larger for those with younger children; a 41 per cent increase is observed for households with a youngest child aged under two compared to a 21 per cent increase for households with a youngest child aged five to nineteen
Section 4.4 Barriers to employment of the NatCen survey provides further context on some of the barriers encountered by households with children in searching for work.
In addition, we present the interactions between family type and age of youngest child on the employment impact of the lower benefit cap in Table 4.2 and Figure 4.6. We observe that:
- for lone parent households, the largest impact of the lower cap is seen for households with younger children. Those with a youngest child aged two or under are between 5.7 and 5.8 percentage points more likely to move into work than the comparison group. For households with a youngest child aged three to four and five to nineteen, the impacts are around 1 percentage point lower. The relative increase in employment for lone parents with a youngest child aged two or under is the largest we see for any combination of household type and age of youngest child
- the lower benefit cap also has a larger work impact for couples with younger children. Couples with a youngest child aged under five are between 5.6 and 6.9 percentage points more likely to move into work than the comparison group; for those with a youngest child aged five to nineteen the impact is only 4.1 percentage points
- in the counterfactual baseline, lone parent households with a youngest child aged two or under are considerably less likely to be in work than lone parent households with a youngest child aged five to nineteen; 12 per cent compared to 20 per cent. This differs to couples with children, where the proportion in work is similar regardless of the age of youngest child (around 22 per cent across all groups)
- in addition, and similar to previous findings, we also observe that the impact of the benefit cap on employment is higher for those households in scope for both cap levels than the lower cap only
Table 4.2 Twelve-month impact of the lower benefit cap on employment for lone parents and couples with children, by age of youngest child and cap group.
| Group | Lower only | Both caps | All capped | ||||||
|---|---|---|---|---|---|---|---|---|---|
| Counter-factual baseline (%) | Increase | Counter-factual baseline (%) | Increase | Counter-factual baseline (%) | Increase | ||||
| PPT | % | PPT | % | PPT | % | ||||
| Lone parents | 16 | 4.2*** | 25 | 17 | 8.4*** | 50 | 17 | 5.1*** | 31 |
| Youngest child: | |||||||||
| Under 2 | 12 | 4.0*** | 33 | 12 | 10.8*** | 89 | 12 | 5.7*** | 46 |
| Aged 2 | 14 | 4.7*** | 34 | 14 | 10.0*** | 69 | 14 | 5.8*** | 42 |
| Aged 3-4 | 22 | 4.5*** | 20 | 22 | 6.1*** | 28 | 22 | 4.8*** | 22 |
| Aged 5-19 | 19 | 3.9*** | 20 | 22 | 7.2*** | 33 | 20 | 4.6*** | 23 |
| Couples with children | 22 | 3.9*** | 18 | 24 | 8.8*** | 36 | 22 | 5.4*** | 24 |
| Youngest child: | |||||||||
| Under 2 | 23 | 4.1*** | 18 | 24 | 8.5*** | 35 | 23 | 5.6*** | 24 |
| Aged 2 | 21 | 5.5*** | 27 | 24 | 9.9*** | 42 | 22 | 6.9*** | 32 |
| Aged 3-4 | 22 | 4.8*** | 22 | 26 | 9.2*** | 36 | 23 | 6.2*** | 27 |
| Aged 5-19 | 21 | 2.6** | 13 | 24 | 8.3*** | 35 | 21 | 4.1*** | 19 |
Figure 4.6 Econometric analysis of work outcomes for lone parents and couples with children (in percentage points) by age of youngest child.
| Employment rate in the absence of the benefit cap | Change in employment rate due to benefit cap | |
|---|---|---|
| Lone parents | 16.6 | 5.1 |
| Youngest child: | 0.0 | 0.0 |
| Under 2 | 12.2 | 5.7 |
| Aged 2 | 13.8 | 5.8 |
| Aged 3-4 | 21.9 | 4.8 |
| Aged 5-19 | 19.8 | 4.6 |
| Couples with children | 22.4 | 5.4 |
| Youngest child: | 0.0 | 0.0 |
| Under 2 | 23.5 | 5.6 |
| Aged 2 | 21.6 | 6.9 |
| Aged 3-4 | 22.9 | 6.2 |
| Aged 5-19 | 21.4 | 4.1 |
By cap amount
Results from the econometric analysis show that impact of the lower benefit cap on employment rates differs depending on the size of the cap amount (Table 4.3):
- at relatively small cap amounts (up to £25 per week), the lower benefit cap has a negligible effect on employment
- as the cap amount increases, the estimated impact of the lower cap on employment also increases, up to a maximum level for the £100-£150 per week, where we observe that households are up to 9.9 percentage points more likely to be in work than the comparison group
- above £150 per week, further increases in cap amount do not result in an increased likelihood of households moving into work. Households capped by £200 or more are 5.3 percentage points more likely to be in work than the comparison group; The reduction in the employment impact is driven by the Rest of Great Britain, where the employment impact is 4.0 percentage points higher compared to the comparison group for those capped by £200 a week or more; whilst households capped by the lower amount of £100-£150 per week are 9.9 percentage points more likely to move into work compared to the comparison group. In contrast there is no evidence that the impact of the cap declines with capped amount in London
- the impact of the lower benefit cap on employment by cap amount is slightly different by geography, with larger impacts on movement into employment for cap amounts of £200 or more per week in Greater London compared to the Rest of Great Britain
- overall, the relationship between cap amount and employment is non-linear and having a larger reduction in benefit income does not necessarily result in households being more likely to move into work
Table 4.3 Twelve-month impact of the benefit cap on employment, by cap amount and geographical area.
| Cap amount | Greater London | Rest of Great Britain | Great Britain | ||||||
|---|---|---|---|---|---|---|---|---|---|
| Counter-factual baseline (%) | Increase | Counter-factual baseline (%) | Increase | Counter-factual baseline (%) | Increase | ||||
| PPT | % | PPT | % | PPT | % | ||||
| Up to £25 | 19 | 0.4 | 2 | 17 | 1.2*** | 7 | 17 | 1.1*** | 6 |
| £25-£50 | 18 | 4.4*** | 25 | 18 | 3.7*** | 20 | 18 | 3.9*** | 22 |
| £50-£100 | 20 | 8.6*** | 44 | 17 | 6.8*** | 39 | 18 | 7.2*** | 41 |
| £100-£150 | 22 | 9.7*** | 44 | 18 | 9.9*** | 56 | 19 | 9.9*** | 53 |
| £150-£200 | 23 | 8.3*** | 35 | 18 | 8.5*** | 46 | 19 | 8.5*** | 44 |
| £200 or more | 28 | 8.3*** | 30 | 19 | 4.0*** | 21 | 21 | 5.3*** | 25 |
Figure 4.6 shows the relationship, described above, between cap amount and the estimated employment impact for Greater London and the Rest of Great Britain. We include the confidence intervals to depict the level of uncertainty around each estimate, as the sample sizes are considerably reduced by sub-dividing the outcomes in six cap amount ranges[footnote 44].
Similar findings have been reported in Section 7.2: Multiple Impacts in the qualitative analysis of the NatCen survey.
Figure 4.7 Twelve-month impact of the lower cap on WTC claims, by cap amount for the Rest of Great Britain and Greater London.
| Weekly cap amount at rollout | |||||||
|---|---|---|---|---|---|---|---|
| Impact on WTC (PPT) | £0-£25 | £25 to £50 | £50 to £100 | £100 to £150 | £150 to £200 | More than £200 | |
| Greater London | Lower CI | -1.4 | 2.3 | 6.2 | 6.5 | 4.9 | 5.2 |
| Mean | 0.4 | 4.4 | 8.6 | 9.7 | 8.3 | 8.3 | |
| Higher CI | 2.1 | 6.6 | 11.0 | 13.0 | 11.7 | 11.4 | |
| Rest of Great Britain | Lower CI | 0.4 | 2.8 | 5.9 | 8.7 | 6.9 | 2.3 |
| Mean | 1.2 | 3.7 | 6.8 | 9.9 | 8.5 | 4.0 | |
| Higher CI | 2.0 | 4.6 | 7.7 | 11.0 | 10.1 | 5.7 |
5. Econometric analysis into exempting benefits receipt
This chapter first presents, in Section 5.1, some descriptive analysis on households’ receipt of exempting benefits pre- and post-introduction of the lower benefit cap policy. It then presents econometric analysis to determine the causal impact of the lower benefit cap on the receipt of any benefit which exempts a household from the cap i.e. whether the lower cap increases the likelihood of being in receipt of an exempting benefit twelve months after rollout[footnote 45]. Subgroup analysis on the impact of the cap on exempting benefit receipt is provided for geography, family type, benefit type, age of youngest child and cap amount.
In addition, this chapter describes the most common exempting benefit combinations that households receive after twelve months; this includes Carer’s Allowance, an exemption introduced in November 2016 at the same time as the lower cap policy was rolled out.
Single person households are excluded throughout and are presented separately in Annex F.
5.1 Descriptive analysis on exempting benefit status and total weekly benefit income
Being in receipt of an exempting benefit[footnote 46] is the second most common reason for households no longer having their benefit capped, according to official statistics[footnote 47].
Capped households may apply for an exempting benefit after rollout because a) they may have had an underlying entitlement to the benefit before the introduction of the lower benefit cap but only make an application for the benefit after rollout and b) they may become eligible for an exempting benefit after rollout e.g. they become a carer for a friend or relative, develop a health condition or they have a pre-existing health condition which worsens. This is the first time that being in receipt of an exempting benefit is analysed as part of a benefit cap impact assessment.
This section contains descriptive analysis on households’ exempting benefit status and provides insight into whether there is any difference between the benefit status of the all capped group and the comparison groups which sets the scene for the econometric analysis, in Section 5.3 onwards.
We present in Figure 5.1 the percentage of households in receipt of any exempting benefit twelve months before and after rollout; for the lower cap only, the both caps and the comparison groups. In the twelve months before the introduction of the lower benefit cap, the lower only and comparison groups have similar proportions of households in receipt of an exempting benefit (around 3 per cent) whereas the both caps group has a slightly higher proportion of households in receipt of an exempting benefit (4 per cent). It is possible that some of the households in the both caps group may have been subject to the original benefit cap levels during this time. Twelve months after rollout, the proportion of households who are in receipt of an exempting benefit increases for all groups; up to 9 per cent for the lower cap only and 12 per cent for the both caps groups, 2 and 5 percentage points above the comparison group (7 per cent), respectively.
Figure 5.1 Percentage of households in receipt of an exempting benefit in Great Britain, twelve months before and twelve months after rollout of the lower benefit cap
| Group | -12 (%) | -11 (%) | -10 (%) | -9 (%) | -8 (%) | -7 (%) | -6 (%) | -5 (%) | -4 (%) | -3 (%) | -2 (%) | -1 (%) | 0 (%) | 1 (%) | 2 (%) | 3 (%) | 4 (%) | 5 (%) | 6 (%) | 7 (%) | 8 (%) | 9 (%) | 10 (%) | 11 (%) | 12 (%) |
|---|---|---|---|---|---|---|---|---|---|---|---|---|---|---|---|---|---|---|---|---|---|---|---|---|---|
| Lower only | 3 | 3 | 3 | 3 | 3 | 3 | 3 | 2 | 2 | 2 | 1 | 1 | 0 | 1 | 3 | 4 | 4 | 5 | 6 | 7 | 7 | 8 | 8 | 9 | 9 |
| Both caps | 4 | 4 | 4 | 4 | 4 | 4 | 4 | 3 | 3 | 2 | 2 | 1 | 0 | 3 | 4 | 6 | 7 | 7 | 8 | 9 | 10 | 10 | 11 | 11 | 12 |
| Comparison group | 3 | 3 | 3 | 3 | 3 | 3 | 2 | 2 | 2 | 1 | 1 | 1 | 0 | 1 | 2 | 2 | 3 | 3 | 4 | 5 | 5 | 6 | 6 | 7 | 7 |
Figures 5.2 and 5.3 show the total household weekly benefit income at the start of the cohort tracking period (before the cap is applied and rounded to the nearest £5) against the proportion of households in receipt of an exempting benefit twelve months after rollout, for the rollout cohort (t) and two pre-treatment cohorts (t-1 and t-2), in Greater London and the Rest of Great Britain, respectively. As in the previous chapter, we apply a weighted four-point moving average to visualise the trend in the proportion of households in receipt of an exempting benefit and vertical lines mark the original, and the lower benefit cap levels. The secondary axis (on the right) relates to the bars which represent the number of households in receipt of an exempting benefit in the rollout cohort (t).
The number of benefits which provide an exemption from the application of the cap increased in November 2016 (coinciding with the implementation of the lower benefit cap), with the addition of exemptions for households receiving Carer’s and Guardian’s Allowances. For comparison purposes, the charts include the additional exempting benefits for all cohort groups.
Figure 5.2 The proportion of households in receipt of an exempting benefit after twelve months, by total weekly benefit income, in Greater London.
| Total weekly benefit income (£) | Rollout cohort (%) | Rollout cohort t-1 (%) | Rollout cohort t-2 (%) | Number of households in the rollout cohort receiving an exempting benefit |
|---|---|---|---|---|
| 390 | 4 | 11 | 6 | 4 |
| 395 | 5 | 5 | 6 | 48 |
| 400 | 4 | 6 | 7 | 61 |
| 405 | 5 | 5 | 6 | 70 |
| 410 | 6 | 7 | 8 | 67 |
| 415 | 6 | 5 | 7 | 114 |
| 420 | 5 | 6 | 7 | 53 |
| 425 | 5 | 6 | 7 | 73 |
| 430 | 7 | 6 | 9 | 71 |
| 435 | 6 | 5 | 7 | 57 |
| 440 | 6 | 5 | 6 | 56 |
| 445 | 7 | 6 | 10 | 49 |
| 450 | 5 | 6 | 7 | 44 |
| 455 | 6 | 6 | 7 | 53 |
| 460 | 7 | 4 | 7 | 85 |
| 465 | 5 | 7 | 7 | 40 |
| 470 | 7 | 6 | 6 | 39 |
| 475 | 7 | 6 | 8 | 47 |
| 480 | 7 | 6 | 9 | 71 |
| 485 | 9 | 8 | 9 | 45 |
| 490 | 9 | 7 | 9 | 54 |
| 495 | 9 | 5 | 8 | 48 |
| 500 | 9 | 8 | 6 | 52 |
| 505 | 6 | 7 | 8 | 31 |
| 510 | 8 | 8 | 9 | 34 |
| 515 | 8 | 8 | 8 | 28 |
| 520 | 7 | 5 | 7 | 35 |
| 525 | 6 | 7 | 11 | 41 |
| 530 | 8 | 9 | 9 | 27 |
| 535 | 7 | 7 | 10 | 38 |
| 540 | 9 | 8 | 11 | 35 |
| 545 | 10 | 8 | 11 | 32 |
| 550 | 8 | 7 | 11 | 21 |
| 555 | 9 | 9 | 9 | 21 |
| 560 | 8 | 11 | 10 | 16 |
| 565 | 14 | 7 | 9 | 31 |
| 570 | 11 | 6 | 13 | 28 |
| 575 | 9 | 7 | 11 | 15 |
| 580 | 13 | 8 | 12 | 28 |
| 585 | 9 | 9 | 9 | 12 |
| 590 | 11 | 7 | 10 | 17 |
| 595 | 10 | 10 | 14 | 15 |
| 600 | 8 | 8 | 10 | 16 |
| 605 | 6 | 6 | 15 | 10 |
| 610 | 19 | 10 | 12 | 21 |
| 615 | 9 | 5 | 13 | 11 |
| 620 | 19 | 13 | 16 | 17 |
| 625 | 4 | 10 | 11 | 3 |
| 630 | 16 | 13 | 17 | 13 |
| 635 | 14 | 15 | 15 | 9 |
| 640 | 14 | 13 | 11 | 9 |
| 645 | 9 | 8 | 9 | 9 |
| 650 | 8 | 15 | 10 | 5 |
| 655 | 19 | 9 | 14 | 11 |
| 660 | 9 | 9 | 21 | 6 |
| 665 | 16 | 16 | 12 | 7 |
| 670 | 13 | 9 | 18 | 11 |
| 675 | 19 | 7 | 15 | 11 |
| 680 | 12 | 9 | 18 | 4 |
| 685 | 9 | 12 | 10 | 3 |
| 690 | 12 | 8 | 15 | 4 |
| 695 | 5 | 9 | 16 | 1 |
| 700 | 8 | 3 | 34 | 2 |
| 705 | 13 | 6 | 16 | 2 |
| 710 | 9 | 16 | 17 | 2 |
| 715 | 13 | 11 | 24 | 4 |
| 720 | 24 | 11 | 19 | 7 |
| 725 | 16 | 6 | 13 | 5 |
| 730 | 15 | 15 | 17 | 4 |
| 735 | 12 | 17 | 9 | 6 |
| 740 | 8 | 10 | 16 | 1 |
| 745 | 14 | 17 | 18 | 4 |
| 750 | 17 | 5 | 8 | 1 |
| 755 | 16 | 13 | 12 | 3 |
| 760 | 0 | 0 | 23 | 0 |
| 765 | 40 | 31 | 16 | 4 |
| 770 | 20 | 14 | 22 | 2 |
| 775 | 13 | 20 | 20 | 2 |
| 780 | 13 | 31 | 21 | 1 |
| 785 | 0 | 5 | 17 | 0 |
| 790 | 17 | 10 | 17 | 1 |
| 795 | 30 | 25 | 16 | 3 |
| 800 | 20 | 16 | 4 | 2 |
Figure 5.3 The proportion of households in receipt of an exempting benefit after twelve months, by total weekly benefit income, in the Rest of Great Britain.
| Total weekly benefit income (£) | Rollout cohort (%) | Rollout cohort t-1 (%) | Rollout cohort t-2 (%) | Number of households in the rollout cohort receiving an exempting benefit |
|---|---|---|---|---|
| 335 | 7 | 8 | 9 | 203 |
| 340 | 7 | 7 | 8 | 479 |
| 345 | 7 | 6 | 8 | 453 |
| 350 | 8 | 7 | 9 | 384 |
| 355 | 7 | 8 | 10 | 314 |
| 360 | 9 | 8 | 9 | 334 |
| 365 | 8 | 7 | 9 | 348 |
| 370 | 7 | 7 | 9 | 405 |
| 375 | 7 | 7 | 8 | 475 |
| 380 | 7 | 8 | 9 | 447 |
| 385 | 8 | 7 | 9 | 410 |
| 390 | 8 | 7 | 9 | 392 |
| 395 | 7 | 7 | 8 | 301 |
| 400 | 8 | 8 | 9 | 314 |
| 405 | 8 | 7 | 8 | 360 |
| 410 | 9 | 7 | 10 | 302 |
| 415 | 9 | 9 | 9 | 253 |
| 420 | 9 | 9 | 10 | 295 |
| 425 | 9 | 8 | 9 | 225 |
| 430 | 11 | 9 | 12 | 237 |
| 435 | 12 | 9 | 10 | 266 |
| 440 | 11 | 9 | 10 | 261 |
| 445 | 10 | 8 | 11 | 282 |
| 450 | 12 | 9 | 9 | 306 |
| 455 | 13 | 9 | 10 | 288 |
| 460 | 11 | 10 | 10 | 222 |
| 465 | 11 | 9 | 10 | 194 |
| 470 | 12 | 9 | 9 | 195 |
| 475 | 12 | 10 | 10 | 209 |
| 480 | 12 | 9 | 11 | 200 |
| 485 | 14 | 11 | 12 | 188 |
| 490 | 12 | 11 | 12 | 151 |
| 495 | 13 | 11 | 11 | 129 |
| 500 | 17 | 10 | 11 | 131 |
| 505 | 15 | 10 | 10 | 130 |
| 510 | 12 | 11 | 11 | 135 |
| 515 | 14 | 10 | 12 | 143 |
| 520 | 13 | 10 | 12 | 127 |
| 525 | 14 | 11 | 11 | 110 |
| 530 | 14 | 11 | 10 | 103 |
| 535 | 12 | 11 | 11 | 70 |
| 540 | 16 | 11 | 13 | 87 |
| 545 | 12 | 13 | 12 | 64 |
| 550 | 13 | 10 | 14 | 57 |
| 555 | 11 | 11 | 14 | 52 |
| 560 | 17 | 11 | 12 | 73 |
| 565 | 15 | 16 | 15 | 50 |
| 570 | 13 | 12 | 14 | 38 |
| 575 | 10 | 11 | 15 | 32 |
| 580 | 16 | 11 | 14 | 46 |
| 585 | 14 | 10 | 16 | 38 |
| 590 | 6 | 12 | 11 | 15 |
| 595 | 12 | 17 | 15 | 35 |
| 600 | 16 | 13 | 12 | 27 |
| 605 | 15 | 6 | 13 | 27 |
| 610 | 18 | 11 | 20 | 29 |
| 615 | 12 | 21 | 14 | 17 |
| 620 | 10 | 12 | 15 | 15 |
| 625 | 14 | 10 | 16 | 16 |
| 630 | 8 | 17 | 21 | 9 |
| 635 | 17 | 19 | 17 | 19 |
| 640 | 13 | 16 | 11 | 12 |
| 645 | 10 | 6 | 13 | 9 |
| 650 | 13 | 17 | 13 | 10 |
| 655 | 25 | 4 | 15 | 20 |
| 660 | 7 | 10 | 14 | 5 |
| 665 | 16 | 10 | 11 | 10 |
| 670 | 12 | 4 | 11 | 6 |
| 675 | 10 | 26 | 19 | 7 |
| 680 | 11 | 20 | 19 | 5 |
| 685 | 17 | 15 | 10 | 8 |
| 690 | 20 | 19 | 23 | 7 |
| 695 | 16 | 8 | 14 | 7 |
| 700 | 17 | 14 | 19 | 7 |
| 705 | 18 | 20 | 6 | 4 |
| 710 | 15 | 32 | 22 | 5 |
| 715 | 27 | 10 | 19 | 7 |
| 720 | 27 | 7 | 15 | 8 |
| 725 | 38 | 20 | 48 | 9 |
| 730 | 10 | 18 | 14 | 3 |
| 735 | 21 | 16 | 12 | 4 |
| 740 | 12 | 7 | 15 | 4 |
| 745 | 0 | 27 | 19 | 0 |
| 750 | 12 | 0 | 23 | 2 |
| 755 | 20 | 24 | 7 | 3 |
| 760 | 0 | 8 | 50 | 0 |
| 765 | 0 | 27 | 15 | 0 |
| 770 | 0 | 0 | 27 | 0 |
| 775 | 15 | 20 | 23 | 2 |
| 780 | 33 | 27 | 40 | 2 |
| 785 | 17 | 11 | 13 | 1 |
| 790 | 23 | 27 | 11 | 3 |
| 795 | 18 | 0 | 17 | 2 |
| 800 | 0 | 0 | 25 | 0 |
Figure 5.2 and Figure 5.3 show:
- in Greater London, there is some increase in the proportion of households in receipt of any exempting benefit as benefit income increases above the lower cap level (£442 per week) for the rollout cohort. However, an upwards trend between total weekly benefit income and receipt of an exempting benefit is also observed in the pre-treatment cohorts (t-1 and t-2) and so any potential effects of the lower cap are difficult to disentangle here
- in the Rest of Great Britain, the trend is more pronounced. As total weekly benefit income increases, households are more likely to be in receipt of an exempting benefit and this is particularly noticeable for the rollout cohort between the lower cap and original cap levels (i.e. from £385 per week to £500 per week)
5.2 Econometric methodology overview
To assess whether the increased movement on to exempting benefits for capped households can be attributed to the introduction of the lower benefit cap, we carry out a regression analysis. As in Chapter 4, the regression analysis uses a linear difference-in-difference methodology, which allows us to control for any differences in observed characteristics between the comparison group and cap groups, as well as to control for any pre-existing trends between the groups. A full technical description of the methodology and the composition of the rollout cohort by cap group and geography can be found in Annex E and Chapter 2, respectively.
It is important to note that the results presented in this analysis represent the outcomes of capped households twelve months after rollout of the lower cap but outcomes may continue to change after this time. Unless otherwise stated, exempting benefit impacts are statistically significant at the 1 per cent level.
5.3 National Results
At a national level (Great Britain), twelve months after rollout, 10 per cent of capped households are in receipt of an exempting benefit, compared to a counterfactual estimate of 7 per cent. After controlling for other factors, capped households are 2.6 percentage points more likely to be in receipt of an exempting benefit than the comparison group. This is equivalent to a relative increase of 34 per cent compared to the comparison group (from 7 per cent to 10 per cent).
Figure 5.4 illustrates the estimated impact of the lower cap on being in receipt of an exempting benefit after controlling for other factors that may influence the likelihood of being in receipt of an exempting benefit. Of 100 capped households, we observe that after twelve months:
- 10 are in receipt of an exempting benefit, of which 7 would be in receipt of an exempting benefit in the absence of the cap and 3 are receiving an exempting benefit as a direct result of the lower cap
Similar to the impact of the cap on employment, households in the both caps group are more likely to be in receipt of an exempting benefit after twelve months than those in the lower cap only group, although the magnitude of the impact is lower than in the case of movement into employment.
- lower cap only group: 10 per cent of households in the lower only group are in receipt of an exempting benefit after twelve months, compared to 7 per cent in the comparison group; a difference of 2.2 percentage points or a relative increase in the exempting benefit uptake rate of 30 per cent
- both caps group: 12 per cent of households in the both caps group are in receipt of an exempting benefit after twelve months, compared to 8 per cent in the comparison group; a difference of 3.8 percentage points or a relative increase in the exempting benefit uptake rate of 46 per cent
Figure 5.4 Econometric analysis of exempting benefit outcomes for all capped households, twelve months after rollout, Great Britain.
| Status | Number of households |
|---|---|
| Not in receipt of an exempting benefit | 90 |
| Would be in receipt of exempting benefit anyway | 7 |
| Impact of the cap | 3 |
Subgroup analysis by household characteristics
The impact of the lower benefit cap is presented for the following household characteristics: geography, family type, benefit type and age of youngest child[footnote 48].
Table 5.1 shows the estimated impact of the lower benefit cap on receipt of an exempting benefit twelve months after rollout (in percentage points), the estimated counterfactual percentage of households in receipt of an exempting benefit and the relative increase in the percentage of households in receipt of an exempting benefit compared to the comparison group, by cap group (i.e. lower cap only, both caps and the all capped group).
Table 5.1 Twelve-month impact of the lower benefit cap on receipt of an exempting benefit, by household characteristics and cap group.
| Group | Lower cap only | Both caps | All capped | ||||||
|---|---|---|---|---|---|---|---|---|---|
| Counter-factual baseline (%) | Increase | Counter-factual baseline (%) | Increase | Counter-factual baseline (%) | Increase | ||||
| PPT | % | PPT | % | PPT | % | ||||
| Great Britain | 7 | 2.2*** | 30 | 8 | 3.8*** | 46 | 7 | 2.6*** | 34 |
| Geography | |||||||||
| Greater London | 6 | 1.3*** | 23 | 7 | 2.5*** | 37 | 6 | 1.9*** | 31 |
| Rest of Great Britain | 8 | 2.3*** | 30 | 9 | 4.9*** | 56 | 8 | 2.8*** | 36 |
| Family type | |||||||||
| Lone parents | 7 | 2.0*** | 30 | 7 | 3.7*** | 52 | 7 | 2.4*** | 35 |
| Couples with children | 10 | 2.7** | 28 | 11 | 3.4*** | 31 | 10 | 2.9*** | 29 |
| Benefit type | |||||||||
| IS | 5 | 2.1*** | 41 | 6 | 4.2*** | 71 | 5 | 2.6*** | 49 |
| JSA | 6 | 0.7*** | 12 | 7 | 1.1* | 16 | 6 | 0.8** | 13 |
| ESA WRAG | 20 | 3.9*** | 19 | 22 | 6.7*** | 31 | 21 | 4.6*** | 22 |
| Youngest child | |||||||||
| Under 2 | 5 | 2.7*** | 53 | 6 | 5.2*** | 91 | 5 | 3.4*** | 64 |
| Aged 2 | 6 | 2.2*** | 37 | 7 | 4.1*** | 60 | 6 | 2.6*** | 43 |
| Aged 3-4 | 7 | 2.5*** | 36 | 8 | 3.6*** | 44 | 7 | 2.7*** | 38 |
| Aged 5-19 | 11 | 1.6*** | 14 | 13 | 2.0*** | 16 | 12 | 1.7*** | 14 |
Figure 5.5 provides a visual representation of the overall impact, in percentage points, of the lower benefit cap on receipt of an exempting benefit for the all capped group by household characteristics. We discuss the results in more detail below.
Figure 5.5 Twelve-month impact of the lower benefit cap on receipt of an exempting benefit, by household characteristics.
| Employment rate in the absence of the benefit cap | Change in employment rate due to the benefit cap | |
|---|---|---|
| Great Britain | 7.5 | 2.6 |
| Geography: | 0.0 | 0.0 |
| Greater London | 6.3 | 1.9 |
| Rest of Great Britain | 7.7 | 2.8 |
| Family Type: | 0.0 | 0.0 |
| Lone parents | 6.7 | 2.4 |
| Couples with children | 10.0 | 2.9 |
| Main Benefit: | 0.0 | 0.0 |
| IS | 5.3 | 2.6 |
| JSA | 6.4 | 0.8 |
| ESA WRAG | 20.8 | 4.6 |
| Youngest child: | 0.0 | 0.0 |
| Under 2 | 5.2 | 3.4 |
| Aged 2 | 6.1 | 2.6 |
| Aged 3 to 4 | 7.1 | 2.7 |
| Aged 5 to 19 | 11.8 | 1.7 |
By Geography
- the impact of the cap on receipt of exempting benefits is greater for households in the Rest of Great Britain than Greater London
- households in the both caps group are more likely to be on an exempting benefit; in the Rest of Great Britain the impact of the cap on receipt of exempting benefits for this group is nearly double that for households in Greater London
- households in the Rest of Great Britain are slightly more likely to be in receipt of an exempting benefit in the absence of the cap, compared to those living in Greater London (6 per cent vs. 8 per cent)
- of those households in the lower cap only group, the impact of the benefit cap on receipt of an exempting benefit is 1 percentage point higher for those living in the Rest of Great Britain compared to Greater London
5.4.2 By family type
Subgroup analysis by family type focuses only on the impact for lone parents and couples with children due to the sample size; however, couples without children are included in the overall analysis[footnote 49].
- couples with children and lone parents in capped households show an increased likelihood to be in receipt of an exempting benefit of 2.9 and 2.4 percentage points, respectively, compared to the comparison group
- as the counterfactual estimate is for 10 per cent of couples with children to be on an exempting benefit compared to 7 per cent of lone parents, the percentage increase is larger for lone parents (35 per cent vs. 29 per cent)
- the impact of the cap on receipt of an exempting benefit is larger for the both caps group; lone parents see a slightly larger increase in their likelihood of being in receipt of an exempting benefit than couples with children compared to the comparison group (3.7 and 3.4 percentage points respectively)
5.4.3 By benefit type
We assess the impact of the lower benefit cap on receipt of an exempting benefit twelve months after rollout by the main benefit a household receives in addition to HB at rollout, i.e. Employment and Support Allowance (work-related activity group) (ESA WRAG), Jobseeker’s Allowance (JSA) and Income Support (IS).
We observe in Table 5.1 that:
- the overall impact of the lower benefit cap on being in receipt of an exempting benefit twelve months after rollout is greater for households in the ESA WRAG at rollout, who are 4.6 percentage points more likely to be in receipt of an exempting benefit than the comparison group, Income Support claimants are 2.6 percentage points more likely and JSA claimants only 0.8 percentage points[footnote 50] more likely
- the impact is more marked for those in the both caps group. Households in ESA WRAG in scope for both caps are 6.7 percentage points more likely to be in receipt of an exempting benefit than the comparison group and this is the largest impact across all of the subgroups
- households in receipt of ESA WRAG are also considerably more likely to be in receipt of an exempting benefit in the absence of the cap (21 per cent), compared to households in receipt of Income Support (5 per cent) and JSA (6 per cent). As a result, IS households show the greatest relative increase in the receipt of exempting benefits twelve months later
5.4.4 By Age of youngest child
Table 5.1 shows the impact of the lower cap on receipt of an exempting benefit varies depending on the age of the youngest child:
- the largest impact of the lower benefit cap on receipt of an exempting benefit is observed for those households with a child aged under two, who are 3.4 percentage points more likely to be in receipt of an exempting benefit than the comparison group twelve months after rollout
- capped households with a youngest child aged between two and four are 2.6 to 2.7 percentage points more likely to be in receipt of an exempting benefit twelve months after rollout than the comparison group
- the smallest impact observed is for capped households with a youngest child aged five to nineteen who are 1.7 percentage points more likely to be in receipt of an exempting benefit than the comparison group, twelve months after rollout
- in the counterfactual baseline estimate, the percentage of households in receipt of an exempting benefit increases gradually as the age of the youngest child increases, from 5 per cent, for those households with children under two, to 12 per cent, for households with a youngest child aged five to nineteen
Table 5.2 and Figure 5.6 present the impact of the lower benefit cap on the receipt of an exempting benefit by family type and age of youngest child.
Table 5.2 Twelve-month impact of the lower benefit cap on the receipt of an exempting benefit for lone parents and couples with children by age of youngest child.
| Group | Lower only | Both caps | All capped | ||||||
|---|---|---|---|---|---|---|---|---|---|
| Counter-factual baseline (%) | Increase | Counter-factual baseline (%) | Increase | Counter-factual baseline (%) | Increase | ||||
| PPT | % | PPT | % | PPT | % | ||||
| Lone parents | 7 | 2.0*** | 30 | 7 | 3.7*** | 52 | 7 | 2.4*** | 35 |
| Youngest child: | |||||||||
| Under 2 | 4 | 2.5*** | 56 | 5 | 5.3*** | 111 | 5 | 3.2*** | 70 |
| Aged 2 | 5 | 1.8*** | 34 | 6 | 4.2*** | 73 | 5 | 2.3*** | 43 |
| Aged 3 to 4 | 6 | 2.5*** | 40 | 7 | 3.1*** | 43 | 6 | 2.6*** | 41 |
| Aged 5 to 19 | 11 | 1.1** | 10 | 12 | 1.6** | 13 | 11 | 1.2*** | 11 |
| Couples with children | 10 | 2.7** | 28 | 11 | 3.4*** | 31 | 10 | 2.9*** | 29 |
| Youngest child: | |||||||||
| Under 2 | 7 | 3.1*** | 43 | 8 | 4.5*** | 54 | 8 | 3.6*** | 47 |
| Aged 2 | 8 | 3.6*** | 43 | 10 | 3.3** | 34 | 9 | 3.5*** | 40 |
| Aged 3 to 4 | 10 | 2.2* | 22 | 11 | 3.9*** | 34 | 10 | 2.7** | 26 |
| Aged 5 to 19 | 12 | 2.4*** | 20 | 14 | 2.5** | 18 | 13 | 2.4*** | 19 |
Figure 5.6 Twelve-month impact of the lower benefit cap on receipt of an exempting benefit for lone parents and couples with children, by age of youngest child.
| Employment rate in the absence of the benefit cap | Change in employment rate due to the benefit cap | |
|---|---|---|
| Lone Parents | 6.7 | 2.4 |
| Youngest child: | 0.0 | 0.0 |
| Under 2 | 4.5 | 3.2 |
| Aged 2 | 5.4 | 2.3 |
| Aged 3 to 4 | 6.4 | 2.6 |
| Aged 5 to 19 | 11.4 | 1.2 |
| Couples with Children | 10.0 | 2.9 |
| Youngest child: | 0.0 | 0.0 |
| Under 2 | 7.7 | 3.6 |
| Aged 2 | 8.8 | 3.5 |
| Aged 3 to 4 | 10.5 | 2.7 |
| Aged 5 to 19 | 12.6 | 2.4 |
We observe that twelve months after rollout:
- the lower benefit cap has a positive impact on receipt of an exempting benefit across all groups. The biggest percentage point increase is for couples with a youngest child aged under two, who have a 3.6 percentage point increase in exempting benefit receipt compared to the comparison group; this is equivalent to a relative increase of 47 per cent
- for lone parents, the impact of the lower benefit cap on being in receipt of an exempting benefit is greatest for those with a youngest child aged under two who have a 3.2 percentage point increase compared to the comparison group; this is a relative increase of 70 per cent
- for couples with children, the impact of the lower benefit cap on receipt of exempting benefits for households with a youngest child aged two is 3.5 percentage points; this is similar to that observed for households with a youngest child aged under two. However, for lone parent households with a youngest child aged two, the impact of the lower cap is 2.3 percentage points, which is considerably smaller than for those with a youngest child under two (3.2 percentage points)
- in the counterfactual baseline estimate, couples with children are considerably more likely to be in receipt of an exempting benefit than lone parent households and the percentage of households receiving exempting benefits generally increases with the age of the youngest child, from 8 to 13 per cent, in the case of couples with children, and from 5 to 11 per cent, in the case of lone parents
5.4.5 By cap amount
We observed in Section 5.1 that larger cap amounts are somewhat associated with a larger proportion of households in receipt of an exempting benefit twelve months after rollout. However, this relationship is complex and not as clear as in the case of employment outcomes (Section 4.1).
Table 5.3 shows the estimated impact of the lower benefit cap on the receipt of an exempting benefit in percentage points compared to the comparison group by cap amount; sub-divided by geography (i.e. Greater London/Rest of Great Britain).
Table 5.3 Twelve-month impact of the benefit cap on being in receipt of an exempting benefit, by cap amount and geographical area.
| Greater London | Rest of Great Britain | Great Britain | |||||||
|---|---|---|---|---|---|---|---|---|---|
| Counter-factual baseline (%) | Increase | Counter-factual baseline (%) | Increase | Counter-factual baseline (%) | Increase | ||||
| PPT | % | PPT | % | PPT | % | ||||
| Up to £25 | 6 | 1.0* | 18 | 7 | 0.5** | 7 | 7 | 0.6*** | 9 |
| £25 to £50 | 6 | 1.4** | 23 | 8 | 1.6*** | 21 | 7 | 1.5*** | 21 |
| £50 to £100 | 6 | 1.4** | 23 | 7 | 4.0*** | 53 | 7 | 3.5*** | 48 |
| £100 to £150 | 7 | 3.5*** | 52 | 8 | 5.5*** | 68 | 8 | 5.1*** | 65 |
| £150 to £200 | 8 | 3.6*** | 48 | 9 | 4.9*** | 57 | 8 | 4.6*** | 54 |
| £200 or more | 9 | 4.3*** | 49 | 10 | 3.7*** | 38 | 10 | 3.8*** | 40 |
The regression analysis shows:
- in the Rest of Great Britain, at relatively small cap amounts (up to £25 per week), the likelihood of being in receipt of an exempting benefit as a result of the lower benefit cap is small (0.5 percentage points above the comparison group, statistically significant at the 5 per cent level). However, as the cap amount increases the estimated impact increases, until a cap amount of £100-£150 per week, where households are 5.5 percentage points more likely to be in receipt of an exempting benefit than the comparison group. At larger cap amounts (greater than £150 per week) the impact of the cap reduces gradually to 3.7 percentage points above the comparison group
- in Greater London, the estimated impact of the lower benefit cap on being in receipt of an exempting benefit is small and fairly consistent for deductions of up to £100 per week (from 1.0 to 1.4 percentage point increase compared to the comparison group, statistically significant at the 10 per cent and 5 per cent levels, respectively), but for cap amounts greater than £100 per week the impact increases gradually, up to a maximum of 4.3 percentage points compared to the comparison group, for cap amounts of £200 per week or more
Figure 5.7 shows the relationship between the estimated impact of the lower benefit cap on the receipt of an exempting benefit and cap amount in Greater London and the Rest of Great Britain. We include the confidence intervals here to demonstrate the level of uncertainty we have around each estimate as we have divided the lower cap independent variable into six separate groups, resulting in smaller sample sizes[51^] with results for Greater London more variable than for the Rest of Great Britain.
The relationship between cap amount and receipt of an exempting benefit differs by geography. Larger reductions in total weekly benefit income do not necessarily mean that households are more likely to move on to an exempting benefit in the Rest of Great Britain. In Greater London, the larger the reduction in households’ total weekly benefit income, the larger the movement on to an exempting benefit, although the proportion of households in receipt of an exempting benefit in the counterfactual baseline is slightly lower in Greater London.
Figure 5.7 Twelve-month impact on receipt of an exempting benefit, by cap amount for the Rest of Great Britain and Greater London.
| Impact on receipt of an exempting benefit (PPT) | £0-£25 | £25-£50 | £50-£100 | £100-£150 | £150-£200 | >£200 | |
|---|---|---|---|---|---|---|---|
| Greater London | Lower CI | -0.1 | 0.2 | 0.2 | 2.0 | 1.4 | 2.2 |
| Mean | 1.0 | 1.4 | 1.4 | 3.5 | 3.6 | 4.3 | |
| Higher CI | 2.2 | 2.5 | 2.6 | 5.0 | 5.8 | 6.4 | |
| Rest of Great Britain | Lower CI | 0.0 | 1.0 | 3.4 | 4.6 | 3.8 | 2.2 |
| Mean | 0.5 | 1.6 | 4.0 | 5.5 | 4.9 | 3.7 | |
| Higher CI | 1.1 | 2.3 | 4.5 | 6.4 | 6.0 | 5.2 |
5.4.6 By exempting benefit type awarded
We assess the impact of the lower benefit cap on receipt of an exempting benefit by the most common combinations of exempting benefits received.
Table 5.4 shows for each of the exempting benefits or combination of exempting benefits assessed, the estimated impact of the lower benefit cap, in percentage points, and the estimated counterfactual percentage, twelve months after rollout, by geography, family type, benefit type and cap group. We observe that:
- the largest impact of the lower benefit cap is on receipt of Carer’s Allowance and Child DLA, with households 0.9 percentage points more likely to be in receipt of this exempting benefit than the comparison group, at a national level (Great Britain). This increase is larger for the Rest of Great Britain compared to Greater London, for lone parent households than couples with children, for households receiving Income Support and for the both caps group above the lower cap only group
- the exempting benefit combination with the second largest percentage point increase as a result of the lower benefit cap policy is receipt of ‘DLA/PIP only’ with capped households 0.5 percentage points more likely to be in receipt of this benefit than the comparison group. The estimated impact for the DLA/PIP group is more apparent in Greater London, for lone parents, for households receiving ESA WRAG as a main benefit type and for the both caps group
- in the counterfactual baseline estimate, households in receipt of an exempting benefit at twelve months are most likely to be in the ESA Support Group or in receipt of “DLA or PIP only” (2 per cent)
Table 5.4 Twelve-month impact of the lower benefit cap on receipt of exempting benefits, by households characteristics and exempting benefit combinations.
| Specific exempting benefit outcome | ESA SG only | DLA/PIP only | DLA/PIP & ESA SG | Child DLA only | Carer’s Allowance only | Carer’s Allowance and Child DLA | Other | |||||||
|---|---|---|---|---|---|---|---|---|---|---|---|---|---|---|
| Counter-factual baseline (%) | PPT Increase | Counter-factual baseline (%) | PPT Increase | Counter-factual baseline (%) | PPT Increase | Counter-factual baseline (%) | PPT Increase | Counter-factual baseline (%) | PPT Increase | Counter-factual baseline (%) | PPT Increase | Counter-factual baseline (%) | PPT Increase | |
| Great Britain | 2 | 0.1 | 2 | 0.5*** | 1 | 0.1** | 1 | 0.2** | 1 | 0.4*** | 1 | 0.9*** | 1 | 0.0*** |
| Geography | ||||||||||||||
| Greater London | 3 | 0.1 | 2 | 0.6*** | 1 | 0.2 | 1 | 0.1 | 1 | 0.6*** | 1 | 0.1 | <0.5 | 0.0 |
| Rest of Great Britain | 2 | 0.1 | 2 | 0.5*** | 1 | 0.1 | 1 | 0.2** | 1 | 0.4*** | 1 | 1.0*** | 1 | 0.1*** |
| Family type | ||||||||||||||
| Lone parents | 1 | 0.0 | 1 | 0.6*** | <0.5 | 0.1 | 1 | 0.1 | 1 | 0.5*** | 2 | 1.0*** | <0.5 | 0.1*** |
| Couples with children | 3 | 0.2 | 2 | 0.3* | 1 | 0.1 | 1 | 0.3** | 1 | 0.1 | 1 | 0.8*** | 3 | 0.0 |
| Benefit type | ||||||||||||||
| IS | <0.5 | 0.1 | 1 | 0.5*** | <0.5 | 0 | 1 | 0.2* | 1 | 0.6*** | 2 | 1.2*** | <0.5 | 0.0 |
| JSA | 2 | -0.2 | 1 | 0.3 | 1 | -0.2 | 1 | 0.1 | 1 | 0.0 | 1 | 0.4* | 1 | 0.1* |
| ESA WRAG | 9 | -0.3 | 6 | 1.0** | 3 | 0.5 | 1 | 0.1 | <0.5 | 0.5*** | 1 | 0.9*** | 3 | 0.1 |
| Cap group | ||||||||||||||
| Lower only | 2 | 0.1 | 2 | 0.4*** | 1 | 0.1 | 1 | 0.1 | 1 | 0.4*** | 1 | 0.7*** | 1 | 0.1*** |
| Both caps | 2 | 0.0 | 2 | 0.8*** | 1 | 0.2** | 1 | 0.3** | 1 | 0.6*** | 1 | 1.3*** | 1 | 0.0 |
6. Changes in housing outcomes
This chapter analyses the extent to which households have changed their housing status twelve months after rollout of the lower benefit cap policy. Section 6.2 first presents descriptive analysis on housing-related changes at geography level, rent level and tenure, pre- and post-introduction of the lower benefit cap policy. It then presents econometric analysis to determine the causal impact of the lower benefit cap on changes in geographical location i.e. whether the lower cap increases the likelihood of geographical moves at Census Output Area level and Local Authority level twelve months after rollout[footnote 52].
Subgroup analysis on geographical moves is provided for geography, family type and tenure. The descriptive analysis on housing-related changes also includes subgroup analysis by benefit type and age of youngest child. Econometric analysis for single person households is presented separately in Annex F.
6.1 Housing policy context
Capped households may change their housing status which leads them to receive a lower HB award, which in turn, may result in no longer being capped or a reduction in cap amount. There are different ways this may be possible in principle:
- moving to a cheaper property; for example, moving to different geographical area or a smaller property
- change of tenure; for example, moving to the Social Rented Sector (SRS), where rents are usually lower than in the Private Rented Sector (PRS)
The analysis in this chapter tracks capped households housing outcomes for twelve months after they become capped. In Section 1.4, we set out a number of welfare and housing policy changes which may have impacted on the outcomes during this time.
Numerous interrelated factors contribute to changes in housing status, which make it complex to attribute them directly to the lower benefit cap policy; the econometric analysis in Section 6.3 attempts to quantify the impact of the lower benefit cap on housing status. Chapter 5 of the NatCen Quantitative Claimant Survey explores how HB and UC claimants change their housing status in response to the lower benefit cap; Specifically, Section 5.2.5 examines a number of potential barriers that households face when trying to move house or reduce their rent.
The 2014 impact evaluation[footnote 53] explored housing moves at a Local Authority level but did not find any significant overall increase in the proportion of capped households moving property, although households were more likely to move if capped by larger amounts or located in Greater London. This chapter extends the 2014 analysis to moves at a smaller geographical level and incorporates the econometric analysis, which determines the extent to which the lower benefit cap led to more housing moves.
6.2 Descriptive analysis on housing status and total weekly benefit income
This section contains a descriptive analysis on the changes in housing status for capped households twelve months after they become capped. The housing-related changes assessed are:
-
moves between geographical areas at Census Output Area (COA)[footnote 54] and Local Authority (LA) level
- rent level
- Housing Tenure
COA is defined as the smallest geographical unit that we can identify in the administrative data; it generally consists of a few hundred households[footnote 55] and does not cross Local Authorities (LA) boundaries. Therefore, a COA move is defined as a change of COA without changing LA; an LA move is a move between LAs and always involves a change in COA. Moves within COAs are not captured i.e. If a household were to move to another property on the same street, for example, then this move will not be captured in the administrative data.
6.2.1 Move geography
The proportion of capped households who move geography, twelve months after the rollout of the lower benefit cap is shown in Figure 6.1. Overall, 20 per cent of capped households move location whilst 80 per cent remain in the same area; Of those who move, they tend to do it at COA level (within the same LA); 14 per cent move COA and 6 per cent move LA and thus, also COA.
Figure 6.1 Housing move status for all capped households twelve months after rollout, in Great Britain.
| Status | Number of households |
|---|---|
| No move | 80 |
| LA move | 6 |
| COA move only | 14 |
Rent level and geography
Table 6.1 shows the combined proportion of households for each cap group, by rent level (i.e. whether they had rent reduction or not) and geography (i.e. whether they move LA, COA or do not move), twelve months after being capped. The table is subdivided by location, family type, benefit type, age of youngest child and tenure type. Figure 6.2 shows the same breakdowns for just the all capped group.
Of all capped households:
- 50 per cent stay in the same geography and have either the same rent or an increased rent (in cash terms)
- 30 per cent have a rent reduction and stay in the same location
- 4 per cent move LA and have the same or higher rent
- 2 per cent move LA and have lower rent
- 8 per cent move COA have the same or higher rent
- 6 per cent move COA and have lower rent
Most capped households stay in the same geography (80 per cent) and 37 per cent[footnote 56] of them have a reduction in their rent; 42 per cent of those who move COA and 35 per cent of those who move LA have a reduction in their rent.
Figure 6.2 Housing move status for all capped households by whether they had a rent reduction twelve months after rollout, in Great Britain.
| Status | Number of households |
|---|---|
| No move | 50 |
| No move with lower rent | 30 |
| LA move | 4 |
| LA move with lower rent | 2 |
| COA move only | 8 |
| COA move only, with lower rent | 6 |
Table 6.1 Capped households by household characteristics, rent change and geographical moves for each cap group. (Each row sums to 100% for each cap group).
| No Move (%) | COA move (%) | LA move (%) | No Move (%) | COA move (%) | LA move (%) | No Move (%) | COA move (%) | LA move (%) | No Move (%) | COA move (%) | LA move (%) | No Move (%) | COA move (%) | LA move (%) | No Move (%) | COA move (%) | LA move (%) | |
|---|---|---|---|---|---|---|---|---|---|---|---|---|---|---|---|---|---|---|
| Great Britain | 51 | 8 | 3 | 31 | 5 | 2 | 50 | 8 | 5 | 27 | 7 | 3 | 50 | 8 | 4 | 30 | 6 | 2 |
| Including singles | 51 | 9 | 4 | 28 | 6 | 2 | 50 | 8 | 5 | 26 | 8 | 4 | 50 | 9 | 4 | 28 | 6 | 2 |
| Geography | ||||||||||||||||||
| Greater London | 56 | 6 | 5 | 25 | 4 | 4 | 55 | 6 | 7 | 22 | 5 | 6 | 56 | 6 | 6 | 23 | 4 | 5 |
| Rest of Great Britain | 50 | 8 | 3 | 32 | 6 | 1 | 46 | 9 | 4 | 31 | 8 | 2 | 49 | 8 | 3 | 32 | 6 | 1 |
| Family type | ||||||||||||||||||
| Lone parents | 50 | 8 | 3 | 32 | 6 | 2 | 48 | 8 | 5 | 27 | 7 | 4 | 49 | 8 | 4 | 31 | 6 | 2 |
| Couples with children | 54 | 8 | 3 | 30 | 4 | 1 | 53 | 8 | 4 | 27 | 5 | 2 | 54 | 8 | 3 | 29 | 4 | 1 |
| Couples w/o children | 47 | 19 | 9 | 9 | 9 | 7 | 12 | 18 | 18 | 12 | 24 | 18 | 37 | 18 | 12 | 10 | 13 | 10 |
| Singles | 51 | 14 | 9 | 9 | 12 | 4 | 46 | 15 | 9 | 7 | 17 | 7 | 50 | 15 | 9 | 9 | 13 | 5 |
| Benefit type | ||||||||||||||||||
| IS | 49 | 8 | 4 | 32 | 6 | 2 | 47 | 8 | 5 | 29 | 7 | 4 | 48 | 8 | 4 | 31 | 6 | 2 |
| JSA | 53 | 8 | 3 | 30 | 4 | 1 | 53 | 8 | 4 | 26 | 6 | 3 | 53 | 8 | 3 | 29 | 5 | 2 |
| ESA WRAG | 48 | 7 | 3 | 35 | 5 | 1 | 48 | 8 | 4 | 31 | 7 | 3 | 48 | 7 | 3 | 34 | 6 | 2 |
| Other | 61 | 8 | 3 | 22 | 4 | 1 | 61 | 8 | 6 | 18 | 5 | 2 | 61 | 8 | 4 | 21 | 4 | 2 |
| Age of youngest child | ||||||||||||||||||
| Under 2 | 48 | 10 | 4 | 30 | 6 | 2 | 47 | 8 | 5 | 29 | 7 | 3 | 48 | 9 | 4 | 30 | 6 | 2 |
| Aged 2 | 50 | 7 | 3 | 32 | 5 | 2 | 48 | 8 | 5 | 29 | 6 | 4 | 50 | 7 | 4 | 31 | 5 | 2 |
| Aged 3 to 4 | 52 | 7 | 3 | 32 | 5 | 1 | 51 | 7 | 5 | 28 | 6 | 3 | 52 | 7 | 3 | 31 | 5 | 2 |
| Aged 5 to 19 | 53 | 6 | 3 | 32 | 5 | 1 | 55 | 7 | 4 | 24 | 7 | 3 | 53 | 7 | 3 | 30 | 5 | 2 |
| Tenure | ||||||||||||||||||
| SRS | 32 | 5 | 2 | 58 | 3 | 1 | 32 | 4 | 2 | 57 | 3 | 1 | 32 | 5 | 2 | 57 | 3 | 1 |
| PRS | ||||||||||||||||||
| 74 | 11 | 5 | 2 | 7 | 2 | 72 | 11 | 6 | 2 | 6 | 3 | 74 | 11 | 5 | 2 | 7 | 2 | |
| TA | 39 | 13 | 4 | 13 | 28 | 4 | 51 | 11 | 5 | 7 | 23 | 4 | 44 | 12 | 4 | 10 | 26 | 4 |
| Unknown | 33 | 11 | 9 | 17 | 22 | 9 | 37 | 9 | 9 | 19 | 16 | 10 | 35 | 10 | 9 | 18 | 19 | 10 |
Subgroup analysis on households rent and move status in Table 6.1 shows that:
- households in the both caps group are slightly more likely to move than the lower only capped group; 23 per cent compared to 18 per cent in the lower only group
- families with children tend to move less than couples without dependants and single person households, but if they do, they are more likely to move to a property with the same or higher rent and within the same LA
- there is little difference in the household move rates by the age of youngest child, although those with a youngest child aged under 2 have a slightly higher move rate compared to households with older children
- in general, households in the SRS have a lower tendency to move than those in the PRS (11 per cent compared to 25 per cent, respectively) and only 4 per cent of households in the SRS who move have a lower rent
- more than half of the households in the SRS have a rent reduction without moving, compared to only 2 per cent in the PRS. This is likely associated with the reduction applied to the English SRS Households via the Welfare Reform and Work Act 2016 (see Section 6.1)
- the proportion of households outside Greater London (in the Rest of Great Britain) who move COA and have their rent reduced is larger than for Greater London. In contrast the proportion of households who move LA and have their rent reduced is larger in Greater London than elsewhere in GB
Table 6.2 shows the same changes in housing status as Table 6.1 but by cap amount and geography. We observe that an increasing proportion of households move at increasing cap amount, independent of geography. The moves rate for households with a weekly cap amount up to £25 is 18 per cent, whereas the moves rate for households with a weekly cap amount of £200 or more is 29 per cent.
Table 6.2 Capped households by cap amount, rent change and geographical moves for each geography (Each row sums to 100% for each region).
| No Move (%) | COA move (%) | LA move (%) | No Move (%) | COA move (%) | LA move (%) | No Move (%) | COA move (%) | LA move (%) | No Move (%) | COA move (%) | LA move (%) | No Move (%) | COA move (%) | LA move (%) | No Move (%) | COA move (%) | LA move (%) | |
| Up to £25 | 59 | 7 | 5 | 23 | 4 | 4 | 49 | 8 | 3 | 33 | 5 | 1 | 51 | 8 | 3 | 31 | 5 | 2 |
|---|---|---|---|---|---|---|---|---|---|---|---|---|---|---|---|---|---|---|
| £25 to £50 | 55 | 5 | 6 | 27 | 4 | 4 | 54 | 8 | 3 | 27 | 6 | 1 | 54 | 8 | 4 | 27 | 5 | 2 |
| £50 to £100 | 55 | 5 | 6 | 25 | 5 | 5 | 47 | 8 | 3 | 35 | 6 | 1 | 49 | 7 | 4 | 33 | 5 | 2 |
| £100 to £150 | 55 | 7 | 6 | 23 | 4 | 5 | 49 | 8 | 3 | 31 | 7 | 1 | 50 | 8 | 4 | 29 | 6 | 2 |
| £150 to £200 | 54 | 6 | 8 | 18 | 6 | 7 | 48 | 9 | 4 | 29 | 8 | 2 | 50 | 9 | 5 | 27 | 8 | 3 |
| £200 or more | 52 | 6 | 10 | 17 | 6 | 9 | 44 | 11 | 4 | 28 | 11 | 3 | 46 | 10 | 6 | 25 | 9 | 4 |
Housing tenure
We also assess, in Table 6.3, the proportion of capped households who change housing tenure, twelve months after rollout, by cap group and geography. The tenure types considered are SRS, PRS, Temporary Accommodation (TA)[footnote 57] and Other. The shaded diagonal represents the proportion of households that stay in the same tenure[footnote 58], and the rest, except for the last row in each category, the proportion who change tenure type. The last row represents the proportion of households still receiving HB after twelve months. For example, the first cell of the table shows that 89 per cent of households who are in the lower cap only group, in Greater London and in the SRS at rollout, remain in the SRS twelve months after rollout. The cells to the right show that 1 per cent of this group change to the PRS, 1 per cent to TA and the remaining 9 per cent to an unknown type.
The ‘Other’ category is predominantly but not exclusively comprised of households that have left HB, but also includes households where the tenure type is not recorded or where it is recorded and we are unable to classify as SRS or PRS given the available information.
Table 6.3 Changes in tenure for the rollout cohort after twelve months.
| Group | Tenure at rollout | Greater London | Rest of Great Britain | Great Britain | |||||||||
|---|---|---|---|---|---|---|---|---|---|---|---|---|---|
| SRS | PRS | TA | Other | SRS | PRS | TA | Other | SRS | PRS | TA | Other | ||
| Lower cap only | SRS | 89 | 1 | 1 | 9 | 87 | 1 | <0.5 | 12 | 87 | 1 | <0.5 | 11 |
| PRS | 2 | 84 | 1 | 12 | 7 | 77 | 1 | 15 | 7 | 78 | 1 | 14 | |
| TA | 14 | 2 | 47 | 36 | 32 | 6 | 39 | 23 | 26 | 5 | 42 | 27 | |
| Other | 14 | 4 | 35 | 47 | 42 | 8 | 10 | 40 | 29 | 6 | 22 | 43 | |
| On HB | 95 | 95 | 97 | 41 | 91 | 92 | 91 | 9 | 92 | 92 | 94 | 14 | |
| Both caps | SRS | 88 | 1 | 1 | 11 | 84 | 1 | <0.5 | 14 | 85 | 1 | <0.5 | 13 |
| PRS | 2 | 79 | <0.5 | 18 | 8 | 72 | <0.5 | 19 | 6 | 75 | <0.5 | 19 | |
| TA | 12 | 4 | 83 | 1 | 31 | 6 | 60 | 3 | 17 | 4 | 78 | 1 | |
| Other | 10 | 5 | <0.5 | 85 | 43 | 8 | 1 | 48 | 24 | 6 | 1 | 69 | |
| On HB | 94 | 93 | 84 | 54 | 90 | 89 | 75 | 17 | 91 | 91 | 82 | 33 | |
| All capped | SRS | 88 | 1 | 1 | 10 | 87 | 1 | <0.5 | 12 | 87 | 1 | <0.5 | 12 |
| PRS | 2 | 82 | 1 | 15 | 7 | 76 | 1 | 16 | 6 | 77 | 1 | 16 | |
| TA | 13 | 4 | 78 | 6 | 31 | 6 | 49 | 13 | 19 | 5 | 68 | 8 | |
| Other | 12 | 5 | 20 | 63 | 42 | 8 | 7 | 42 | 27 | 6 | 14 | 53 | |
| On HB | 95 | 94 | 88 | 48 | 91 | 91 | 85 | 11 | 91 | 92 | 87 | 20 |
Figure 6.1 represents the change in tenure for capped households in Greater London and the Rest of Great Britain between the rollout of the lower benefit cap and twelve months later:
- in Greater London, 46 per cent (7,750), of capped households are in the PRS whilst in the Rest of Great Britain, 53 per cent (38,590) of households are in the SRS, at rollout
- households who are in the SRS (87 per cent in the Rest of Great Britain) and PRS (82 per cent in Greater London) tend to remain in the same sector, although a small proportion change tenure after twelve months
- nationally, only 1 per cent of households move from the SRS into the PRS but 6 per cent of PRS households move to the SRS
- the number of households in TA is higher in Greater London than in the Rest of Great Britain. In Greater London, 78 per cent of households who were in TA at rollout were also in that tenure twelve months later compared to 49 per cent in the Rest of Great Britain
Additional analysis on housing tenure of capped households can be found in Section 5.1.1: “Housing tenure” of the NatCen survey.
Figure 6.3 Change in tenure type for all capped households, from rollout to twelve months later for Greater London and the Rest of Great Britain, respectively.
| London | ||||
|---|---|---|---|---|
| SRS | PRS | TA | NA | |
| SRS | 4,760 | 40 | 40 | 550 |
| PRS | 170 | 6,330 | 60 | 1,190 |
| TA | 230 | 70 | 1,400 | 100 |
| NA | 260 | 100 | 410 | 1,320 |
| Out of London | ||||
| SRS | PRS | TA | NA | |
| SRS | 33,470 | 470 | 40 | 4,610 |
| PRS | 2,320 | 24,020 | 190 | 4,900 |
| TA | 300 | 60 | 470 | 130 |
| NA | 850 | 170 | 140 | 850 |
Moves by total weekly benefit income
Figures 6.4 and 6.5 show the total household weekly benefit income at the start of the cohort tracking period (before the cap is applied and rounded to the nearest £5) against the proportion of households in Greater London and the Rest of Great Britain who move COA, twelve months later, for the rollout cohort group (t) and the two pre-treatment cohorts (t-1 and t-2). As in previous chapters, the weighted four-point moving average is applied to visualise the trend and the vertical lines mark the original and lower benefit cap levels. The secondary axis (on the right) relates to the bars which represent the number of households who move COA in the rollout cohort (t). Note the relatively small number of households receiving the largest amounts of total weekly benefit income. Results for this group are therefore more volatile and less reliable.
There is some visual evidence of the rollout cohort being more likely to move COA than the pre-implementation cohorts (t-1 and t-2) at benefit incomes below the original cap level in Greater London. Above the original cap level, there is no clear difference between the rollout cohort (t) and the pre-treatment cohorts (t-1 and t-2).
In the Rest of Great Britain there is no clear difference between the rollout cohort (t) and the pre-treatment cohorts (t-1 and t-2).
Similar trends are found for LA moves both in Greater London and the Rest of Great Britain (not shown), although move rates at LA level are lower overall.
Figure 6.4 COA moves for all capped households in Greater London after twelve months, by total weekly benefit income.
| Total weekly benefit income (£) | Rollout cohort (%) | Rollout cohort t-1 (%) | Rollout cohort t-2 (%) | Number of households in the rollout cohort who have moved COA |
|---|---|---|---|---|
| 390 | 8 | 15 | 19 | 8 |
| 395 | 14 | 17 | 16 | 153 |
| 400 | 18 | 17 | 18 | 256 |
| 405 | 17 | 18 | 16 | 221 |
| 410 | 14 | 14 | 18 | 160 |
| 415 | 20 | 20 | 16 | 381 |
| 420 | 14 | 16 | 17 | 137 |
| 425 | 18 | 18 | 20 | 266 |
| 430 | 19 | 18 | 20 | 189 |
| 435 | 19 | 17 | 19 | 182 |
| 440 | 14 | 18 | 20 | 121 |
| 445 | 15 | 18 | 18 | 104 |
| 450 | 21 | 17 | 16 | 176 |
| 455 | 17 | 17 | 19 | 146 |
| 460 | 21 | 19 | 15 | 244 |
| 465 | 19 | 18 | 18 | 137 |
| 470 | 20 | 22 | 19 | 115 |
| 475 | 19 | 14 | 13 | 131 |
| 480 | 17 | 15 | 18 | 178 |
| 485 | 16 | 14 | 18 | 82 |
| 490 | 18 | 16 | 22 | 110 |
| 495 | 22 | 19 | 19 | 120 |
| 500 | 22 | 18 | 20 | 128 |
| 505 | 21 | 21 | 20 | 110 |
| 510 | 19 | 20 | 16 | 79 |
| 515 | 15 | 17 | 20 | 56 |
| 520 | 19 | 20 | 21 | 96 |
| 525 | 23 | 21 | 19 | 153 |
| 530 | 21 | 20 | 20 | 69 |
| 535 | 20 | 24 | 27 | 107 |
| 540 | 19 | 23 | 19 | 71 |
| 545 | 24 | 21 | 24 | 77 |
| 550 | 18 | 20 | 22 | 49 |
| 555 | 21 | 16 | 27 | 49 |
| 560 | 24 | 19 | 20 | 48 |
| 565 | 20 | 22 | 19 | 43 |
| 570 | 23 | 24 | 31 | 61 |
| 575 | 22 | 29 | 22 | 38 |
| 580 | 23 | 19 | 21 | 48 |
| 585 | 23 | 23 | 19 | 31 |
| 590 | 23 | 26 | 22 | 35 |
| 595 | 30 | 20 | 29 | 45 |
| 600 | 29 | 28 | 31 | 60 |
| 605 | 30 | 24 | 19 | 47 |
| 610 | 24 | 24 | 26 | 26 |
| 615 | 29 | 25 | 26 | 38 |
| 620 | 24 | 28 | 31 | 22 |
| 625 | 21 | 32 | 28 | 14 |
| 630 | 25 | 20 | 30 | 21 |
| 635 | 25 | 32 | 34 | 16 |
| 640 | 21 | 25 | 29 | 14 |
| 645 | 32 | 30 | 27 | 31 |
| 650 | 26 | 35 | 23 | 16 |
| 655 | 29 | 35 | 21 | 17 |
| 660 | 22 | 36 | 26 | 15 |
| 665 | 36 | 34 | 28 | 16 |
| 670 | 32 | 34 | 26 | 26 |
| 675 | 28 | 31 | 34 | 16 |
| 680 | 24 | 29 | 30 | 8 |
| 685 | 33 | 33 | 20 | 11 |
| 690 | 35 | 23 | 30 | 12 |
| 695 | 38 | 32 | 34 | 8 |
| 700 | 21 | 31 | 21 | 5 |
| 705 | 38 | 17 | 32 | 6 |
| 710 | 30 | 41 | 46 | 7 |
| 715 | 33 | 22 | 29 | 10 |
| 720 | 31 | 34 | 24 | 9 |
| 725 | 31 | 36 | 36 | 10 |
| 730 | 31 | 25 | 24 | 8 |
| 735 | 35 | 27 | 26 | 17 |
| 740 | 31 | 33 | 22 | 4 |
| 745 | 29 | 43 | 50 | 8 |
| 750 | 50 | 23 | 42 | 3 |
| 755 | 26 | 35 | 29 | 5 |
| 760 | 33 | 62 | 31 | 3 |
| 765 | 30 | 38 | 44 | 3 |
| 770 | 20 | 36 | 33 | 2 |
| 775 | 40 | 30 | 47 | 6 |
| 780 | 63 | 31 | 43 | 5 |
| 785 | 22 | 19 | 28 | 2 |
| 790 | 17 | 40 | 14 | 1 |
| 795 | 30 | 25 | 32 | 3 |
| 800 | 20 | 28 | 39 | 2 |
Figure 6.5 COA moves for all capped households in the Rest of Great Britain after twelve months, by total weekly benefit income.
| Total weekly benefit income (£) | Rollout cohort (%) | Rollout cohort t-1 (%) | Rollout cohort t-2 (%) | Number of households in the rollout cohort who have moved COA |
|---|---|---|---|---|
| 335 | 16 | 16 | 19 | 443 |
| 340 | 19 | 19 | 20 | 1244 |
| 345 | 19 | 19 | 20 | 1300 |
| 350 | 17 | 18 | 21 | 887 |
| 355 | 19 | 20 | 20 | 806 |
| 360 | 18 | 17 | 21 | 665 |
| 365 | 17 | 18 | 17 | 748 |
| 370 | 16 | 16 | 17 | 880 |
| 375 | 15 | 17 | 17 | 962 |
| 380 | 16 | 15 | 16 | 1012 |
| 385 | 15 | 14 | 18 | 844 |
| 390 | 16 | 16 | 17 | 766 |
| 395 | 17 | 17 | 19 | 762 |
| 400 | 18 | 17 | 20 | 705 |
| 405 | 20 | 21 | 21 | 859 |
| 410 | 19 | 19 | 19 | 646 |
| 415 | 20 | 17 | 20 | 585 |
| 420 | 19 | 19 | 18 | 660 |
| 425 | 19 | 17 | 19 | 457 |
| 430 | 18 | 18 | 17 | 380 |
| 435 | 19 | 16 | 18 | 430 |
| 440 | 16 | 16 | 17 | 389 |
| 445 | 16 | 15 | 15 | 457 |
| 450 | 16 | 14 | 15 | 402 |
| 455 | 15 | 15 | 17 | 348 |
| 460 | 19 | 17 | 18 | 382 |
| 465 | 18 | 16 | 20 | 329 |
| 470 | 20 | 18 | 22 | 321 |
| 475 | 22 | 19 | 19 | 390 |
| 480 | 21 | 18 | 20 | 342 |
| 485 | 20 | 21 | 19 | 277 |
| 490 | 20 | 18 | 19 | 241 |
| 495 | 20 | 16 | 16 | 202 |
| 500 | 20 | 18 | 20 | 157 |
| 505 | 19 | 15 | 20 | 174 |
| 510 | 20 | 17 | 17 | 226 |
| 515 | 21 | 17 | 18 | 214 |
| 520 | 20 | 17 | 18 | 187 |
| 525 | 19 | 15 | 20 | 149 |
| 530 | 20 | 19 | 22 | 143 |
| 535 | 22 | 15 | 22 | 132 |
| 540 | 22 | 18 | 24 | 123 |
| 545 | 23 | 24 | 24 | 120 |
| 550 | 24 | 20 | 22 | 108 |
| 555 | 21 | 20 | 24 | 95 |
| 560 | 22 | 21 | 24 | 95 |
| 565 | 23 | 21 | 25 | 76 |
| 570 | 22 | 23 | 25 | 67 |
| 575 | 24 | 19 | 24 | 78 |
| 580 | 22 | 26 | 24 | 62 |
| 585 | 22 | 22 | 25 | 60 |
| 590 | 23 | 23 | 24 | 54 |
| 595 | 27 | 24 | 22 | 77 |
| 600 | 28 | 20 | 26 | 48 |
| 605 | 27 | 28 | 30 | 49 |
| 610 | 19 | 26 | 28 | 30 |
| 615 | 28 | 23 | 29 | 39 |
| 620 | 32 | 23 | 26 | 47 |
| 625 | 25 | 28 | 26 | 29 |
| 630 | 29 | 21 | 30 | 34 |
| 635 | 27 | 30 | 29 | 31 |
| 640 | 27 | 31 | 35 | 25 |
| 645 | 17 | 16 | 25 | 16 |
| 650 | 26 | 25 | 39 | 20 |
| 655 | 28 | 19 | 29 | 22 |
| 660 | 28 | 23 | 23 | 21 |
| 665 | 25 | 22 | 20 | 15 |
| 670 | 38 | 39 | 44 | 19 |
| 675 | 38 | 26 | 40 | 27 |
| 680 | 34 | 30 | 35 | 15 |
| 685 | 34 | 26 | 31 | 16 |
| 690 | 29 | 26 | 35 | 10 |
| 695 | 42 | 38 | 26 | 19 |
| 700 | 34 | 22 | 41 | 14 |
| 705 | 27 | 25 | 45 | 6 |
| 710 | 35 | 36 | 30 | 12 |
| 715 | 19 | 29 | 33 | 5 |
| 720 | 23 | 40 | 44 | 7 |
| 725 | 29 | 25 | 33 | 7 |
| 730 | 41 | 24 | 36 | 12 |
| 735 | 16 | 26 | 47 | 3 |
| 740 | 26 | 43 | 31 | 9 |
| 745 | 27 | 23 | 42 | 4 |
| 750 | 41 | 36 | 41 | 7 |
| 755 | 40 | 33 | 36 | 6 |
| 760 | 10 | 23 | 50 | 1 |
| 765 | 50 | 27 | 31 | 4 |
| 770 | 30 | 25 | 27 | 3 |
| 775 | 54 | 20 | 31 | 7 |
| 780 | 17 | 45 | 20 | 1 |
| 785 | 33 | 22 | 60 | 2 |
| 790 | 38 | 45 | 56 | 5 |
| 795 | 36 | 67 | 50 | 4 |
| 800 | 50 | 20 | 38 | 2 |
Econometric methodology overview
To estimate the impact of the lower benefit cap on the moves rate for capped households, we carry out the same type of regression analysis as in previous Chapters 4 and 5, using a linear difference-in-difference methodology (see Annex E for a technical description) applied to the rollout cohort groups. Results from the regression analysis reflect households’ responses twelve months after rollout, however households may continue to change their housing status after this time period. Unless otherwise stated, the results quoted for the impact of the cap on moves are statistically significant at the 1 per cent level.
The regression model requires a binary dependent variable to model whether the household moves or not and thus, we set up two separate models; one for COA and one for LA moves. There is overlap between these definitions, as an LA move always includes a COA move; for the purposes of the econometric analysis, households with an LA move are a subset of those with a COA move. This definition differs from the descriptive analysis above where outcomes are mutually exclusive. Full technical description of the econometric methodology can be found in Annex E.
Benefit cap impact on COA moves
At a national level (Great Britain), capped households are 1.8 percentage points more likely to move COA compared to similar uncapped households. This is a 10 per cent relative increase in the moves rate (from 18 to 19 per cent) compared to the comparison group. Therefore, almost 2 out of 100 households move property at COA level as a result of the lower cap. Figure 6.6 represents the COA moves rate for the all capped group twelve months after they become capped. Of 100 capped households, orange squares show the impact of the lower benefit cap on COA moves and blue squares households who would have moved in the absence of the lower benefit cap policy.
Figure 6.6 Econometric analysis of COA moves for all capped households, twelve months after rollout, Great Britain.
| Status | Number of households |
|---|---|
| No COA move | 80 |
| Would have moved COA anyway | 18 |
| Impact of the cap | 2 |
Table 6.4 shows the estimated impact of the lower benefit cap on moving COA, the counterfactual percentage of COA moves and the relative increase in COA moves compared to the comparison group, twelve months after rollout. Results are subdivided by cap group (i.e. the lower cap only, the both caps and the all capped groups), by geography, family type (only those with children)[footnote 59] and tenure (SRS and PRS only). Below we discuss these results in more detail.
- households in the both caps group are more likely to move than the other cap groups. This is true for all of the subgroups
- COA moves rate increases by 3.2 percentage points compared to the comparison group in Greater London but only by 1.4 percentage points in the Rest of Great Britain
- lone parent households tend to move more than couples with children with a 2.0 percentage point increase and 1.1 percentage points[footnote 60], respectively, compared to the comparison group. The impact of the cap on COA moves is statistically insignificant for couples with children in the lower cap only group
- the impact of the lower cap on COA moves between tenure type is driven by the PRS, with capped households 2.7 percentage points (or 12 per cent relative increase) more likely to move COA than the comparison group. We find some evidence of a negative impact on COA moves for the SRS, where households in this sector in the lower cap only group are less likely to move house as a result of the lower cap than the comparison group, however results show no statistically significant impact on COA moves for SRS households in the all capped group or the both caps group
Table 6.4 Twelve-month impact of the lower benefit cap on COA moves, by household characteristics and cap group.
| Group | Lower cap only | Both caps | All capped | ||||||
|---|---|---|---|---|---|---|---|---|---|
| Counter-factual baseline (%) | Increase | Counter-factual baseline (%) | Increase | Counter-factual baseline (%) | Increase | ||||
| PPT | % | PPT | % | PPT | % | ||||
| Great Britain | 17 | 1.3*** | 8 | 20 | 3.2*** | 16 | 18 | 1.8*** | 10 |
| Geography: | |||||||||
| Greater London | 16 | 2.6** | 16 | 19 | 3.8*** | 20 | 18 | 3.2*** | 18 |
| Rest of Great Britain | 17 | 1.1*** | 6 | 20 | 3.0*** | 15 | 18 | 1.4*** | 8 |
| Family Type: | |||||||||
| Lone parents | 17 | 1.5*** | 8 | 20 | 4.1*** | 20 | 18 | 2.0*** | 11 |
| Couples with children | 15 | 0.9 | 6 | 18 | 1.6** | 9 | 16 | 1.1* | 7 |
| Tenure: | |||||||||
| PRS | 22 | 2.4*** | 11 | 22 | 3.7*** | 17 | 22 | 2.7*** | 12 |
| SRS | 12 | -1.4*** | -12 | 11 | -0.1 | -1 | 12 | -1.1 | -9 |
- the impact of the lower benefit cap on COA moves is greater at higher cap amounts and this is observed for Greater London and the Rest of Great Britain
- households in Greater London are more likely to move COA than those in the Rest of Great Britain, compared to a comparison group. Households capped by £200 per week or more, are 5.9 percentage points more likely to move COA than the comparison group in Greater London
Table 6.5 Twelve-month impact of the lower benefit cap on COA moves, by cap amount and geography.
| Cap amount | Greater London | Rest of Great Britain | Great Britain | ||||||
|---|---|---|---|---|---|---|---|---|---|
| Counter-factual baseline (%) | Increase | Counter-factual baseline (%) | Increase | Counter-factual baseline (%) | Increase | ||||
| PPT | % | PPT | % | PPT | % | ||||
| Up to £25 | 16 | 2.4** | 14 | 17 | 0.4 | 2 | 17 | 0.7* | 4 |
| £25 to £50 | 15 | 3.0** | 20 | 18 | 1.4*** | 8 | 17 | 1.7*** | 10 |
| £50 to £100 | 18 | 2.5*** | 14 | 17 | 1.2*** | 7 | 17 | 1.5*** | 9 |
| £100 to £150 | 18 | 4.0*** | 23 | 17 | 2.6*** | 15 | 18 | 2.9*** | 16 |
| £150 to £200 | 22 | 5.2*** | 24 | 19 | 3.4*** | 17 | 20 | 3.7*** | 19 |
| £200 or more | 25 | 5.9*** | 23 | 24 | 3.9*** | 16 | 25 | 4.4*** | 18 |
Benefit cap impacts on LA moves
The estimated impact of the lower benefit cap on households’ LA moves is shown in Tables 6.6 and 6.7 for the same subgroups presented in Table 6.4 and 6.5. Only a few results are statistically significant which is likely due to the small point impact estimates of households who move LA.
- households in the both caps group are 0.5 percentage points more likely to move LA as a result of the cap in Great Britain and 1.7 percentage points more likely in Greater London. However, we do not observe this in the Rest of Great Britain
- the impact of the lower cap on LA moves in Greater London is particularly apparent for cap amounts of £200 or more per week
Qualitative analysis on housing changes for capped households is also presented in Section 5.2: “Housing-related changes” of the NatCen survey.
Table 6.6 Twelve-month impact of the lower benefit cap on LA moves, by household characteristics and cap group.
| Group | Lower cap only | Both caps | All capped | ||||||
|---|---|---|---|---|---|---|---|---|---|
| Counter-factual baseline (%) | Increase | Counter-factual baseline (%) | Increase | Counter-factual baseline (%) | Increase | ||||
| PPT | % | PPT | % | PPT | % | ||||
| Great Britain | 5 | 0.1 | 1 | 8 | 0.5** | 6 | 6 | 0.2 | 3 |
| Geography: | |||||||||
| Greater London | 8 | 1.2* | 16 | 11 | 1.7*** | 16 | 9 | 1.5 | 16 |
| Rest of Great Britain | 5 | -0.1 | -2 | 6 | -0.5** | -8 | 5 | -0.2 | -3 |
| Family Type: | |||||||||
| Lone parents | 5 | 0.0 | 0 | 8 | 0.9*** | 11 | 6 | 0.2 | 3 |
| Couples with children | 4 | 0.4 | 11 | 6 | 0.1 | 1 | 4 | 0.3 | 7 |
| Tenure: | |||||||||
| PRS | 6 | -0.2 | -3 | 8 | 0.5 | 6 | 7 | 0.0 | 0 |
| SRS | 3 | 0.0 | 1 | 3 | 0.1 | 2 | 3 | 0.0 | 1 |
Table 6.7 Twelve-month impact of the lower benefit cap on LA moves, by cap amount and geography.
| Cap amount | Greater London | Rest of Great Britain | Great Britain | ||||||
|---|---|---|---|---|---|---|---|---|---|
| Counter-factual baseline (%) | Increase | Counter-factual baseline (%) | Increase | Counter-factual baseline (%) | Increase | ||||
| PPT | % | PPT | % | PPT | % | ||||
| Up to £25 | 8 | 0.7 | 8 | 4 | -0.2 | -4 | 5 | -0.1 | -1 |
| £25 to £50 | 7 | 2.1** | 28 | 5 | 0.1 | 2 | 5 | 0.5** | 10 |
| £50 to £100 | 9 | 1 | 11 | 5 | -0.1 | -2 | 5 | 0.1 | 2 |
| £100 to £150 | 9 | 1.3 | 14 | 5 | -0.1 | -2 | 6 | 0.2 | 3 |
| £150 to £200 | 14 | 1.9 | 14 | 6 | -0.7 | -11 | 8 | 0 | 0 |
| £200 or more | 15 | 3.8*** | 26 | 8 | -1.1** | -13 | 10 | 0.3 | 3 |
7. Key messages
1. Twelve months after the lower benefit cap, more than half of capped households (53 per cent) are no longer capped.
Descriptive analysis shows that more than a half of the total capped households (53 per cent) are no longer capped twelve months after they become in scope for the policy. The main reasons for households no longer being capped are that they a) move into paid work, either claiming Working Tax Credit or earning enough to meet the work exemption under Universal Credit (UC) (23 per cent), b) stop claiming Housing Benefit (HB) and not capped under Universal Credit (11 per cent), c) receive an exempting benefit (10 per cent) or d) reduce their total benefit income to below the cap levels (9 per cent).
However, there are some differences in the proportion of households that are no longer capped depending on whether they are also in scope for the original benefit cap (“both caps”) or in scope for the lower cap only. Households in the both caps group are more likely to move into work and to receive an exempting benefit than those in the lower cap only group. Just under half of households (47 per cent) remain capped twelve months after rollout, either under HB or UC. These are not the focus of analysis in this report, but Chapter 7 of the NatCen integrated evaluation report includes examining how these households have responded to the Cap.
2. The lower benefit cap increases employment rates for capped households by 5.1 percentage points compared to similar uncapped households twelve months after rollout; a relative increase of 28 per cent.
The econometric analysis found that the lower benefit cap policy increased movement into work among capped households, compared to similar uncapped households. Capped households are 5.1 percentage points more likely to move into work compared to similar uncapped households twelve months after rollout; this is a relative increase of 28 per cent compared to the comparison group.
This means that out of 100 capped households; 23 households move into work, of which 18 would have moved into work in the absence of the cap (counterfactual baseline estimate); so 5 additional households move into work, which can be attributable to the lower benefit cap policy.
The impact of the lower benefit cap on the employment rate is more than twice the size for households who are in scope for both caps, and with higher total benefit income of over £500 per week, compared to households in scope for the lower cap only. These groups are 8.4 and 4.1 percentage points, respectively, more likely to move into work than similar uncapped households. This finding suggests that the lower cap levels have an additional work impact for those capped households who would have been in scope for the original cap.
3. Employment impacts are positive for all capped groups but varied across sub-groups and by cap amount.
For households with a youngest child aged under two the lower benefit cap has proportionately larger increases in their employment rates compared to households whose youngest child is older than two. Although, households with a youngest child aged under two are overall still less likely to be in employment than other age groups.
At relatively small cap amounts (up to £25 per week), the lower benefit cap has a negligible effect on employment rates. However, as cap amounts increase, the estimated impact of the lower cap on employment also increases up to cap amounts of £150 per week. At cap amounts greater than £150 per week the incremental impact is still positive but it starts to diminish, especially in the Rest of Great Britain.
4. Capped households are 2.6 percentage points more likely to start receiving an exempting benefit compared to similar uncapped households; a relative increase of 34 per cent.
Econometric analysis shows that out of 100 capped households; 10 households move into receipt of an exempting benefit[footnote 61], of which 7 would have moved into receipt of an exempting benefit in the absence of the cap (‘counterfactual estimate’); so 3 additional households move into receipt of an exempting benefit, which can be attributable to the lower benefit cap policy.
The impact of the lower benefit cap on being in receipt of an exempting benefit is larger for households in the both caps group than the lower cap only group, who are 3.8 percentage points more likely to be in receipt of an exempting benefit compared to the comparison group, a relative increase of 46 per cent. This is compared to households in the lower cap only group, who are 2.2 percentage points more likely to be in receipt of an exempting benefit compared to the comparison group, a relative increase of 30 per cent.
The impact of the cap on being in receipt of an exempting benefit is greatest for households in the work-related activity group of Employment and Support Allowance (ESA WRAG); who are 4.6 percentage points more likely to be in receipt of an exempting benefit compared to the comparison group.
In Greater London, at cap amounts below £100 per week, the lower benefit cap has a negligible effect on being in receipt of an exempting benefit, but at cap amounts above £100 per week, households are increasingly likely to be in receipt of an exempting benefit. In the Rest of Great Britain, households are more likely to be in receipt of an exempting benefit as cap amount increases, up to £150 per week; above this level further increases in cap amount do not increase the likelihood of being in receipt of an exempting benefit.
5. Capped households are 1.8 percentage points more likely to move house at Census Output Area (COA) level than similar uncapped households.
The lower benefit cap increases the probability of moving house at COA level[footnote 62]. Capped households are 1.8 percentage points more likely to move COA compared to the comparison group twelve months after rollout; this is a 10 per cent relative increase and an increase in the moves rate from a counterfactual baseline estimate of 18 per cent to 19 per cent[footnote 63]; the lower benefit cap leads to almost 2 out of 100 households moving at a COA level.
The impact of the lower benefit cap on moving house at COA level is considerably larger for households in scope for both caps, compared to households in scope only for the lower cap, who are respectively 3.2 and 1.3 percentage points more likely to move COA than similar uncapped households. This is particularly true for households in Greater London. Furthermore, the impact of the cap on COA moves is greater at larger cap amounts.
At LA level, there is no statistically significant impact of the cap on moves in GB, except for households in the both caps group where the impact is small at 0.5 percentage points.
Annex A: Benefits taken into account
Benefits and Tax Credits (with the exception of Working Tax Credits) that provide social security support for working-age claimants are taken into account for purposes of applying the cap under Housing Benefit (HB) or Universal Credit (UC). Households with one partner above State Pension Age and one below that receive a working-age benefit (HB or UC) are not exempt from the application of the benefit cap. The cap applies to the combined income from:
- Bereavement Allowance
- Child Benefit
- Child Tax Credit
- Employment and Support Allowance (except where the Support Component has been awarded)
- Housing Benefit (except when paid for supported accommodation)[footnote 64]
- Incapacity Benefit
- Income Support
- Jobseeker’s Allowance
- Maternity Allowance
- Severe Disablement Allowance
- Widowed Parent’s Allowance (or Widowed Mother’s Allowance or Widow’s Pension if you started getting it before 9 April 2001)
- Universal Credit (except childcare costs and where the Limited Capability for Work and Work-Related Activity, or Carer’s element has been awarded)
Application of the cap
The application of the cap operates differently under Housing Benefit and Universal Credit:
- if the total amount of welfare benefits of a household exceeds the level of the cap, the Local Authority will reduce its Housing Benefit award by the excess amount. The HB award cannot be reduced below £0.50 per week, which enables households to access Discretionary Housing Payments if additional support for housing costs is needed
- under Universal Credit, the benefit cap deduction applies to the full Universal Credit award
Universal Credit has been gradually introduced since 2013 and combines in and out- of-work benefits whilst supporting in-work claimants with childcare and housing costs. Universal Credit is available across Great Britain and replaces:
- Income Support
- Income-based Jobseeker’s Allowance
- Income-related Employment and Support Allowance
- Housing Benefit
- Working Tax Credit
- Child Tax Credit
If a claimant has a change of circumstances that involves a new claim to one of the above benefits, it will not be possible to do so. Instead, claimants must make a claim for Universal Credit. Further information can be found here: https://www.understandinguniversalcredit.gov.uk/
The following benefits are not taken into account in the cap calculation:
- Housing Benefit paid for refuges, hostels and other supported accommodation. (This also applies to Universal Credit claimants who receive financial support for this type of accommodation and for Temporary Accommodation, through Housing Benefit)
- Universal Credit childcare costs
- Special Guardian’s Allowance which supports the long term placement for children (for example, those often known as kinship carers)
Exemptions from the application of the benefit cap
- entitlement to Working Tax Credit or earnings above £604 per month (in 20/21), in Universal Credit. The above amount increases in line with the National Living Wage (NLW) hourly rate for adults aged 25 or older each April. In previous years this threshold was; 16/17 - £430 (not based on NLW); 17/18 - £520; 18/19 - £542; 19/20 - £569
- a ‘grace period’ of 39 weeks in Housing Benefit or 9 months in Universal Credit applies to households with 12-month work history. This period is meant to allow claimants to adapt to their new circumstances before the cap is applied
- entitlement to certain disability benefits; Personal Independence Payment, Disability Living Allowance, Attendance Allowance or an Industrial Injury Benefit
- entitlement to the support component of Employment and Support Allowance or the Universal Credit Limited Capability for Work Related Activity element
- War Widows and Widowers receiving a pension paid under the relevant parts of the War Pension Scheme, Armed Forces Compensation Scheme or analogous schemes are exempt
- entitlement to Carer’s Allowance or the carer’s element of Universal Credit.
- Receipt of Guardian’s Allowance
Annex B: Lower cap evaluation strategy
This report forms part of the lower benefit cap evaluation strategy, published alongside a lower benefit cap evaluation synthesis report, produced by the National Centre for Social Research (NatCen).
The publication can be found here: xxx
The Department for Work and Pensions commissioned NatCen, an independent research institute, to conduct research into the lower benefit cap. NatCen’s research has two strands:
- a quantitative, longitudinal telephone survey with a representative sample of claimants affected by the cap
- qualitative case studies in a sample of local authorities, including interviews with local authority, job centre and local support agency staff within six sampled local authorities
The survey was delivered over two waves, to explore how claimant responses to the cap had changed over time. Wave one was conducted approximately seven months after implementation of the new cap, with 1,900 claimants interviewed. The sample included claimants affected by the cap under both legacy benefit and Universal Credit, across Great Britain. Wave two was conducted approximately six months later, with over 800 of those same claimants interviewed. The survey included questions on the following topics:
- awareness of the cap and current cap status
- impact of the cap on employment and employment related behaviour
- impact of the cap on claimants housing and housing related behaviour
- awareness and use of Discretionary Housing Payments (DHPs)
- barriers faced by claimants regarding employment and housing changes
- broader impacts of the cap (including upon health, relationships and finances)
- use of available advice and support services
For the qualitative strand, Natcen also invited people working in a range of supporting organisations, i.e. Local Authorities, Jobcentre Plus and local advice and support organisations, to take part in the interviews. Local organisations included family support charities, financial charities and credit unions, housing and homelessness support organisations, housing associations, information and advice providing services, women’s charities, food banks and legal charities. The focus of these interviews was focused on experiences of the introduction of the lower benefit cap and the impacts on the services delivered, and upon claimants affected by the cap. Forty-two interviews were conducted across the six case study areas.
Aims of the research:
The aim of the study was to evaluate the effects of the lower benefit cap on affected claimants’ behaviours towards employment, its wider impacts (for example, on housing choices) and to better understand the driving forces behind different responses to the cap. Particularly, the aims were to:
- assess the effectiveness of the policy in meeting its aims as an increased work incentive
- explore how the policy is operating
- understand what effects the policy has had on local authorities (LAs) and local support agencies
Annex C: Data sources
C.1 Data sources used in the evaluation
The analysis in this report has been developed using bespoke datasets, created for the purpose of evaluating the benefit cap, and extracted from a range of administrative benefit datasets held by the Department for Work and Pensions, Her Majesty’s Revenue and Customs (HMRC) and Local Authorities (LAs).
Single Housing Benefit Extract (SHBE)
SHBE is a monthly electronic record of data at claimant level compiled from scans directly taken from Local Authority Housing Benefit administration systems. It is the main source of data on Housing Benefit, which Local Authorities (LAs) send to DWP each month. These datasets contain the best information on Housing Benefit payments in that month. It provides contextual information such as the current claim amount, postcode and tenure type. Where a record is not found, for example due to a non-return, the most recent return is used instead. The vast majority of returns are received every month so this is not a widespread flaw in the data. Claim information across all data sources are linked to the HB lead claimant (as specified on SHBE) and, where applicable, their partner.
Work and Pensions Longitudinal Study (WPLS)
The WPLS links DWP claimant benefit records to benefit and employment records administered by HMRC. This provides information on weekly Child Tax Credit and Working Tax Credit entitlement (including nil entitlements), ‘legacy’ (non-UC) benefit income data, and demographic details about claimants.
General Matching Service (GMS) scans
GMS scans provide snapshots of live claims for some DWP legacy benefits at a particular point in time; the records are held at claimant level, and cover the following benefits:
- Jobseeker’s Allowance (JSA)
- Employment and Support Allowance (ESA)
- Income Support (IS)
- Incapacity Benefit (IB)
- Severe Disablement Allowance (SDA)
- Pension Credit (PC)
- State Pension (RP)
- Carer’s Allowance (ICA)
- Disability Living Allowance (DLA)
- Bereavement Benefit (BB)
- Widow’s Benefit (WB)
The data scans are produced fortnightly and contain details about a claim, including the current amount of benefit in payment and any changes of circumstances. This allows us to calculate the total weekly benefit income for claimants across a number of benefits. This information is aggregated at a household level and used to assess whether or not households are in scope for the lower benefit cap.
Other data sources have been used to extract information about other benefit types not covered by the GMS data scans. These include:
- Personal Independence Payments held in the Central Payments System (CPS)
- Child Benefit data, used to determine the number of child dependants per household and the age of their youngest child
Benefit Cap (BC) datasets
The bespoke benefit cap datasets used in this evaluation represent the best information we have on the households’ total benefit income in a specific month from a range of administrative data sources. For example, for the November 2016 benefit cap dataset, data was extracted from:
- the November 2016 SHBE scan
- the December 2016 WPLS and Child Benefit data (5-6 weeks later than the SHBE data)
- November 2016 GMS benefit data
For the cohort analysis these bespoke monthly datasets have been linked via an encrypted unique identifier for each household. The datasets also contain information of households in receipt of exempting and non-exempting benefits. This allows to track movements across the welfare system, including moves into work by claiming in-work benefits, such as Working Tax Credits (WTC).
The methodology followed to identify capped households in this evaluation is different to that used for the Benefit Cap Official Statistics[footnote 65]. Official Statistics are the definitive source for the number of households actually capped, and the numbers are quality assured in accordance with the Code of Practice for Statistics[footnote 66]set out by the UK Statistics Authority.
The analysis methodology used in the evaluation has been developed with the advice of the Institute for Fiscal Studies to select a cohort of households in scope for the lower benefit cap at rollout for which outcomes can be tracked over time and whose outcomes can be compared to households who were not subject to the cap, either because they are in earlier cohorts or because their total benefit income puts them close to – but just below – the level of the cap. The monthly benefit cap datasets used in this analysis have been created retrospectively to identify whether or not a household would have been in scope for the cap based on their total weekly benefit income and eligibility for any exemptions. However, quality assurance of these groups confirms that our estimated number of in-scope households converges closely with those actually capped (in the Official Statistics) providing confidence in the reliability of the estimates of those in scope for the cap.
Universal Credit Full Service (UCFS) household datasets
The UCFS household datasets are extracts from a relational database updated at monthly intervals. The dataset provides information on claims to UCFS and the claimant characteristics such as age, start and end dates, gender and geographical location. In our evaluation this dataset is combined with a further dataset containing information on the claimant’s assessment periods (AP), including their earnings, entitlements and any UC award payments.
C.2 Alternative employment data sources considered for this analysis
As part of the development of the evaluation methodology, we explored additional available data on employment status from different datasets to complement the Working Tax Credit claims used as a proxy to assess the impact of the lower benefit cap on employment.
WPLS P45 data
DWP receives data from HMRC from their P45 dataset as part of the Work and Pensions Longitudinal Study (WPLS). The dataset contains information on employment periods (i.e. the start and end dates of employment), from the P45 and P46 forms submitted by employers.
This data has a number of limitations:
- issues with employment start and end dates: employers did not have an explicit requirement to complete P45 and P46 forms for workers with earnings below the lower earnings limit. This means that employment start and end dates are often approximate or missing. The data neglects periods without any earnings. If the earnings fields are populated, they can often be unreliable, as some employers only complete them at the end of the tax year rather than every time an employee is paid
- no self-employment data: the dataset does not capture any information on people who are self-employed and have to make self-assessment tax returns via a different system
Having taken into account these limitations, we decided that this dataset is unsuitable, as it does not provide the necessary level of detail or quality required to supplement the WTC data for this evaluation.
HMRC RTI data
Beginning in April 2013, the HMRC P45/P46 reporting system was replaced by the Real Time Information (RTI) system. RTI offers substantial improvements in data coverage compared to the P45/P46 systems, since employers must report information every time an employee is paid and provide information on all their employees, even if their salaries are below the lower earnings limit.
DWP currently receives data feed of RTI data from HMRC for claimants in receipt of UC and Jobseeker’s Allowance (JSA), but data on claimants in receipt of benefits which currently make up the majority of the benefit cap caseload are unavailable; including Income Support and Child Tax Credit. As only around a fifth of our rollout cohort are in receipt of JSA and none are in receipt of UC at rollout, we decided not to use this dataset for the purpose of this evaluation, as we do not have RTI records for the majority of our sample. Going forward, the benefit cap caseload under UC will increase as more households continue to migrate from HB to UC, or make new UC claims.
Annex D: Measuring employment outcomes under Universal Credit
This annex assesses the number and proportion of households in the rollout cohort, excluding single person households, that have migrated from Housing Benefit (HB) to Universal Credit (UC) after rollout and the extent to which these households are observed as earning enough to exempt them from the application of the benefit cap to their UC award, twelve months after rollout. The aim is to assess the extent to which the work outcome measure used in Chapter 4 (claiming Working Tax Credits (WTC) may be under-estimating the impact of the benefit cap on households moving into work. Because of its being based on a small sample size, the results presented are based on descriptive rather than regression analysis[footnote 67].
As explained in Section 2.2, the analysis in the body of the report considers only households capped under HB at rollout, as very few households were capped under UC at the time the lower cap policy started to roll out.
In Chapter 4, we define movement into work that exempts a household from the application of the cap under HB as whether any member of the household is observed in receipt of WTC after twelve months. However, during the twelve month tracking period, UC started to roll out in many local authorities and some households who would otherwise have made a WTC claim would instead make a new claim to UC[footnote 68]. Households are exempt from the application of the benefit cap to their UC award if they have earnings from work in an Assessment Period[footnote 69] above the benefit cap exemption threshold; earning at or above £430 per UC Assessment Period in 2016/17, and above £520 per UC Assessment Period in 2017/18.
Therefore, there are two additional work outcomes for capped households who migrate to UC that we do not capture using WTC as a proxy for employment:
- a household has earnings in each Assessment Period above the benefit cap exemption threshold. This household is exempt from the benefit cap under UC
- a household has earnings in each Assessment Period below the benefit cap earnings threshold. This household is not exempt from the cap under UC although they do move into work
Not including the outcomes from the second bullet is consistent with the approach followed in Chapter 4 of using WTC as a proxy for work, as it is possible that households move into work but do not meet the employment criteria to exempt them from the cap. But by not including the outcomes in the first bullet above, we may be under-estimating the number of capped households who became exempt from the benefit cap twelve months after rollout due to moving into work. We assess below the extent to which this may have consequences for the results.
Table D1 below shows the number (and percentage) of households in the rollout cohort (in the all capped and comparison groups) who are observed as claiming UC after twelve months and whether they have earnings from employment above or below the benefit cap exemption threshold. All figures exclude single person households to be consistent with the analysis presented in Chapter 4.
Only a very small number of capped households migrate from HB to UC in the twelve tracking-months after rollout (1.2 per cent nationally); and given the geographical pattern of the UC rollout, migration is more common for Greater London households than the Rest of Great Britain (2.3 per cent of capped households moving to UC compared to only 0.9 per cent in the Rest of Great Britain).
Nationally, only a very small minority (0.4 per cent) of capped households at rollout move to UC and have earnings (at any level) and 0.2 per cent of capped households have earnings from employment under UC that exempt them from the cap; of the 90,030 households in the all capped group, there are:
- 1,050 who claim UC (1.2 per cent)
- 340 with any earnings (0.4 per cent of the all capped group)
- only 200 with sufficient earnings to exempt them from the cap (0.2 per cent of the all capped group)
Including the number of UC households with earnings exemption alongside households in receipt of WTC in the analysis of the impact of the benefit cap on work would have a negligible impact on the total number and percentage of households in the rollout cohort observed in-work twelve months after rollout. For example, the percentage of in-work households nationally would increase from 17.4 per cent to 17.8 per cent for the comparison group (an increase of 0.4 percentage points), and from 23.2 per cent from 23.4 per cent in the all capped group (an increase of 0.2 percentage points). This means that the raw difference in work outcomes between the all capped and the comparison groups would be reduced by 0.2 percentage points from 5.8 to 5.6 percentage points. However, we have not controlled for other characteristics that will affect the work outcomes of UC households using econometric analysis. Overall the difference is negligible and well within the 95 per cent confidence interval for our estimates, and thus confirms that we are not under-estimating or over-estimating the impact on work outcomes of capped households using WTC receipt alone in Chapter 4.
#### Table D1 Households in the rollout cohort (HB), who were observed claiming UC twelve months after rollout.
Annex E: Econometric analysis technical annex
The regression analysis in this report (Chapters 4-6) used a Linear Probability Model approach estimated using an Ordinary Least Squares (OLS) Difference-in-Difference (DiD) estimator to estimate the causal impact of the lower benefit cap on employment outcomes, exempting benefit receipt and housing outcomes. The reason for this approach and technical details of the DiD regression specification are set out in this chapter, along with tests conducted to assess whether the underlying methodological assumptions for DiD provide a reasonable central estimate of the impacts of the lower benefit cap.
E.1. Summary of regression specification used
The following example of the regression specification relates to the work outcomes discussed in Chapter 4, however the regression approach taken is consistent across outcomes for exempting benefits and benefit combinations (Chapter 5), and housing moves across LAs and COAs (Chapter 6), with changes only to the binary dependent variable and explanatory variables that capture the outcome history.
As discussed in Chapter 2, movement into employment is proxied by claiming Working Tax Credit (WTC). Hence, the variables used in the regression models to evaluate the impact of the lower benefit cap on the work outcomes are:
- WTC claim twelve months after rollout of the lower benefit cap as the binary dependent variable (=1 if WTC claim, = 0 if no WTC claim)
- Lower benefit cap dummies as the treatment indicators (=1 if in the all capped group, = 0 if in the comparison group i.e. the household has a total benefit income £0-£25 per week below the lower cap level). Lower cap only and both caps dummies were used as sub-groups of this treatment dummy
- a range of other explanatory variables, observed at rollout and fixed, were used to control for other observed characteristics of households that could affect the likelihood of claiming WTC including:
- gender of lead claimant
- whether the household was claiming Jobseeker’s Allowance
- whether the household was claiming Employment and Support Allowance (Work Related Activity Group)
- whether the household was claiming Income Support
- whether the household was in the private-rented sector
- whether the household was in the social-rented sector
- whether the household was in temporary accommodation
- whether the household was a lone parent
- month of lower cap roll out for the household
- the age of the lead claimant (years)
- the age of the household’s youngest child (years)
- region
- duration of the current benefit claim (days)
- the number of children in the household
All regression models in the main report were estimated using a sample of households in the rollout cohort in Great Britain (excluding single person households, modelled separately in Annex F). Sub-group analysis was undertaken for the following groups:
- region (Greater London, Rest of Great Britain)
- cap group (lower cap only, both caps groups)
- family type (lone parents, couples with children)
- cap amount (banded weekly cap deduction amounts at rollout from up to £25 per week up to over £200 per week)
- benefit type of lead claimant at rollout (JSA, ESA (WRAG), IS)
- age of youngest child (under 2, aged 2, aged 3-4, aged 5-19)
E.2. Rationale for using Difference-in-differences approach
A key challenge in estimating the causal impact of the introduction of the lower benefit cap on employment, exempting benefit and housing outcomes is to separate out the impact that the pre-existing higher benefit cap[footnote 70], may already be having on the outcome rates of some households impacted by the lower benefit cap. The 2014 impact evaluation of the original benefit cap found a significant impact on movements into employment, compared to a comparison group of household, with a total benefit income up to £50 per week below the original cap levels.
The group who had a total benefit income over £26,000 at rollout of the lower cap (both caps group as labelled throughout this report) will have been in scope to be capped under both, the higher and previous national cap level of £26,000, and the lower cap levels of £20,000 or £23,000 in Greater London. Therefore, the both caps group will have had a greater, pre-lower cap incentive to claim WTC in order to become exempt from the benefit cap.
This means that in the pre-implementation period before the lower cap was rolled out, it is likely there will have been a pre-existing difference WTC claims for the both caps group, compared to the lower cap only group or the comparison group. If the pre-existing difference is not taken into account in the regression analysis, then it is likely that we would over-estimate the work impacts of the lower cap; particularly for sub-groups where there was a greater proportion of households in scope for the original cap (i.e. Greater London).
Figure E1 (re-produced from Figure 4.1 earlier in the report) shows the proportion of households (by cap group) in the rollout cohort with an open WTC claim up to twelve months before rollout of the lower benefit cap. At this time, from November 2015, the original benefit cap had already been in operation for around two and a half years and so some household outcomes for the both caps group may result directly from the original cap, in contrast to outcomes for the comparison group who were not subject to the benefit cap. At twelve months before rollout there is a national difference of 2 percentage points between the both caps and comparison groups, indicating a pre-existing higher likelihood of the both caps group to claim WTC before the lower cap was introduced. This difference does not exist when we compare the comparison and the lower cap only group. This pre-existing difference is even more apparent in Greater London; 16 per cent of households in the both caps group were already claiming WTC compared to only 12 per cent of households in the lower cap only group (4 percentage point difference). A DiD estimator can be used to account for this pre-existing difference.
Figure E1 Percentage of households with an open WTC claim in Great Britain, twelve months before and twelve months after rollout of the lower benefit cap.
| Group | -12 (%) | -11 (%) | -10 (%) | -9 (%) | -8 (%) | -7 (%) | -6 (%) | -5 (%) | -4 (%) | -3 (%) | -2 (%) | -1 (%) | 0 (%) | 1 (%) | 2 (%) | 3 (%) | 4 (%) | 5 (%) | 6 (%) | 7 (%) | 8 (%) | 9 (%) | 10 (%) | 11 (%) | 12 (%) |
|---|---|---|---|---|---|---|---|---|---|---|---|---|---|---|---|---|---|---|---|---|---|---|---|---|---|
| Lower only | 13 | 12 | 11 | 10 | 9 | 8 | 7 | 6 | 5 | 3 | 2 | 1 | 0 | 3 | 5 | 8 | 10 | 13 | 14 | 16 | 17 | 19 | 20 | 21 | 22 |
| Both caps | 14 | 14 | 13 | 12 | 12 | 10 | 9 | 8 | 7 | 5 | 3 | 1 | 0 | 4 | 8 | 11 | 13 | 16 | 18 | 21 | 22 | 23 | 25 | 26 | 28 |
| Comparison group | 12 | 12 | 11 | 10 | 9 | 8 | 7 | 6 | 5 | 3 | 2 | 1 | 0 | 2 | 4 | 5 | 7 | 9 | 10 | 12 | 13 | 14 | 16 | 17 | 17 |
Difference-in-differences estimation
DiD is a technique to establish the causal estimate of the effect of a policy on an outcome, controlling for observed factors that may be influencing the outcomes of each group at any point in time, but also controlling for any fixed (i.e. time-invariant) impact of differences between the groups that would have existed without the policy.
The typical implementation of DiD in a regression model is of the form below:
Y= β0 + β1[Treatment] + β2[Time] + β3[Treatment*Time] + β4[Covariates]+ε
- Y is the outcome of interest
- β0 is the constant term
- β1 is the covariate-adjusted pre-treatment difference between the treatment and comparison groups
- β2 is the time trend in the comparison group (i.e. the difference within the comparison group between the covariate adjusted outcomes in the post and pre-treatment periods).
- β3 is the interaction between treatment and time. The coefficient in an OLS linear regression (or marginal effect in the case of a non-binary logistic model) shows the DiD estimate of the causal effect of the treatment. This is the main coefficient of interest to us
- ε is a random, unobserved error term
The DiD technique has been used in previous evaluations of labour market interventions in the Department for Work and Pensions, for example, in:
- Lone Parent Obligations (LPO): an impact assessment (DWP, 2013): https://assets.publishing.service.gov.uk/government/uploads/system/uploads/attachment_data/file/211688/rrep845.pdf
- New Deal for Young People evaluation (Blundell et al, 2004): http://discovery.ucl.ac.uk/15843/1/15843.pdf;
- Sector-based work academies quantitative impact assessment (DWP, 2015): https://www.gov.uk/government/publications/sector-based-work-academies-a-quantitative-impact-assessment
E.4. Difference-in-differences specification used to estimate lower cap work impact
The regression analysis covers the period from twelve months before the lower cap was rolled out to twelve months after rollout, and thus covers 25 months in total (i.e. up to twelve months after rollout). In the period from month 1 to month 12, the lower cap was not rolled out yet and these are our pre-treatment periods[footnote 71]. Month 13 is the month in which the cap started to roll out for each household. The lower cap treatment was in place from months 13 to month 25.
Regression specification
The following DiD specification has been used to estimate the impact of the lower cap on work outcomes twelve months after rollout. This impact is additional to the outcome which would have been observed in the absence of the lower benefit cap. This was run as a Linear Probability Model using an OLS estimator. The variables used in the equation are listed in Table E1 below.
Emp = β0 + β1[all_capped] + β2 [emp_monthi] + β3[all_capped_tj] + β4[Covariates]+ε
Where:
- i =2, 3, …., 25 and j =13,14, …, 25 (post-treatment period)
- all_capped_tj = lower cap dummy * emp_monthj is an interaction term and equals 1 if the household was in scope to be capped in that month and 0 otherwise
- standard errors in the model were clustered at the LA level
The main coefficients of interest are β3 on the interaction terms, as these show the estimated effect of the lower cap during the period it was rolled out (treatment period). In this report, unless otherwise stated, the estimates quoted all relate to the employment impact twelve months after rollout (i.e. the coefficient on the all_capped_t25 variable).
The null hypothesis for β3 states that there is no significant relationship between households claiming WTC at twelve months and whether they are subject to the lower benefit cap (with any difference in results due to chance alone); the strength of evidence against this null hypothesis is determined by the p-value on the coefficient. The results presented show whether the impact is statistically significant at the 10 per cent, 5 per cent or 1 per cent level[72].
The β3 coefficients can be interpreted as marginal effects, i.e. the percentage point impact on WTC claims in a specific month as a result of the benefit cap.
In the regression specification, when estimating standard errors, we allow for the error term to be clustered within local authorities. This allows for unobserved factors affecting the outcome to be correlated between households within a local authority and within a local authority over time. Unobserved factors may include for example, local vacancy rates which are not controlled for in the regression model e.g. the opening or closure of a large employer in the area. Clustering the standard errors does not impact on the value of β3.
An extended version of the model was run to identify the impacts of the lower cap on WTC outcomes according to whether a household was observed at rollout in the lower cap only or both caps group. The specification used was as follows:
Emp = β0 + β1[loweronly] + β2[bothcaps] + β3[emp_monthi] + β4[loweronly_tj] + β5[bothcaps_tj] + β6*[Covariates]+ε
Where:
- i =2, 3, …., 25 and j =13,14, …, 25 (post-treatment period)
- loweronly_tj = lower cap only dummy * emp_monthj was an interaction term and equals 1 if the household was in scope to be capped under the lower cap levels only in that month and 0 otherwise
- bothcaps_tj = both caps dummy * emp_monthj was an interaction term and equals 1 if the household was in scope to be capped by both cap levels in that month and 0 otherwise
- standard errors in the model were clustered at the LA level
Detailed regression results including a list of coefficients for the Great Britain lower cap model for WTC claims are provided in Table E1 below.
Table E1 DiD regression output for Great Britain lowercap model
| Explanatory Variable | Coef. | Robust Std. Err. | t | P>|t| | [95% Confidence Interval] | |
|---|---|---|---|---|---|---|
| In scope for the lower cap | -0.011 | 0.001 | -8.03 | 0.000 | -0.013 | -0.008 |
| Effect of lower cap in month 13 | -0.007 | 0.001 | -4.91 | 0.000 | -0.010 | -0.004 |
| Effect of lower cap in month 14 | 0.002 | 0.002 | 1.40 | 0.162 | -0.001 | 0.005 |
| Effect of lower cap in month 15 | 0.016 | 0.002 | 9.03 | 0.000 | 0.013 | 0.020 |
| Effect of lower cap in month 16 | 0.026 | 0.002 | 13.66 | 0.000 | 0.022 | 0.029 |
| Effect of lower cap in month 17 | 0.031 | 0.002 | 14.46 | 0.000 | 0.027 | 0.036 |
| Effect of lower cap in month 18 | 0.039 | 0.002 | 16.67 | 0.000 | 0.034 | 0.043 |
| Effect of lower cap in month 19 | 0.042 | 0.003 | 16.65 | 0.000 | 0.037 | 0.047 |
| Effect of lower cap in month 20 | 0.046 | 0.003 | 17.42 | 0.000 | 0.041 | 0.051 |
| Effect of lower cap in month 21 | 0.047 | 0.003 | 16.81 | 0.000 | 0.041 | 0.052 |
| Effect of lower cap in month 22 | 0.046 | 0.003 | 15.57 | 0.000 | 0.041 | 0.052 |
| Effect of lower cap in month 23 | 0.050 | 0.003 | 16.10 | 0.000 | 0.044 | 0.056 |
| Effect of lower cap in month 24 | 0.051 | 0.003 | 15.56 | 0.000 | 0.044 | 0.057 |
| Effect of lower cap in month 25 | 0.051 | 0.003 | 15.34 | 0.000 | 0.045 | 0.058 |
| Gender: Male | 0.007 | 0.003 | 2.81 | 0.005 | 0.002 | 0.012 |
| Benefit Type: Jobseeker’s Allowance | 0.023 | 0.004 | 5.87 | 0.000 | 0.015 | 0.030 |
| Benefit Type: Employment and Support Allowance | -0.030 | 0.003 | -9.81 | 0.000 | -0.036 | -0.024 |
| Benefit Type: Income Support | -0.019 | 0.003 | -5.58 | 0.000 | -0.026 | -0.012 |
| Tenure: Social Rented Sector | -0.050 | 0.003 | -16.71 | 0.000 | -0.056 | -0.044 |
| Tenure: Private Rented Sector | -0.032 | 0.003 | -9.74 | 0.000 | -0.038 | -0.026 |
| Tenure: Temporary Accommodation | -0.048 | 0.003 | -14.18 | 0.000 | -0.054 | -0.041 |
| Lone Parent: Yes | -0.004 | 0.002 | -1.95 | 0.051 | -0.008 | 0.000 |
| Rollout month: December 2016 | -0.009 | 0.002 | -4.38 | 0.000 | -0.013 | -0.005 |
| Rollout month: January 2017 | -0.017 | 0.002 | -7.53 | 0.000 | -0.021 | -0.013 |
| Age of lead claimant (years): Missing | 0.026 | 0.038 | 0.68 | 0.494 | -0.049 | 0.101 |
| Age of lead claimant (years): 25 to 34 | 0.017 | 0.002 | 9.94 | 0.000 | 0.013 | 0.020 |
| Age of lead claimant (years): 35 to 44 | 0.014 | 0.002 | 7.30 | 0.000 | 0.010 | 0.017 |
| Age of lead claimant (years): 45 to 49 | 0.003 | 0.003 | 0.74 | 0.461 | -0.004 | 0.009 |
| Age of lead claimant (years): 50 to 54 | -0.013 | 0.004 | -3.42 | 0.001 | -0.020 | -0.005 |
| Age of lead claimant (years): 55 to 59 | -0.017 | 0.005 | -3.52 | 0.000 | -0.026 | -0.008 |
| Age of lead claimant (years): 60 plus | -0.047 | 0.008 | -6.01 | 0.000 | -0.062 | -0.032 |
| Age of youngest child (years): Missing | -0.035 | 0.008 | -4.31 | 0.000 | -0.051 | -0.019 |
| Age of youngest child (years): Under 2 | -0.022 | 0.018 | -1.18 | 0.237 | -0.057 | 0.014 |
| Age of youngest child (years): 2 | -0.021 | 0.018 | -1.12 | 0.263 | -0.057 | 0.016 |
| Age of youngest child (years): 3 to 4 | -0.006 | 0.018 | -0.31 | 0.755 | -0.042 | 0.030 |
| Age of youngest child (years): 5 to 10 | -0.016 | 0.019 | -0.89 | 0.374 | -0.053 | 0.020 |
| Age of youngest child (years): 11 to 15 | -0.024 | 0.018 | -1.32 | 0.187 | -0.060 | 0.012 |
| Age of youngest child (years): 16 to 19 | -0.026 | 0.019 | -1.35 | 0.177 | -0.063 | 0.012 |
| Region: North West | 0.003 | 0.004 | 0.68 | 0.496 | -0.006 | 0.012 |
| Region: Yorkshire and the Humber | 0.013 | 0.004 | 3.38 | 0.001 | 0.005 | 0.021 |
| Region: East Midlands | 0.016 | 0.004 | 3.80 | 0.000 | 0.008 | 0.024 |
| Region: West Midlands | 0.014 | 0.004 | 3.67 | 0.000 | 0.007 | 0.022 |
| Region: East | 0.032 | 0.005 | 7.20 | 0.000 | 0.024 | 0.041 |
| Region: South East | 0.039 | 0.004 | 9.78 | 0.000 | 0.031 | 0.047 |
| Region: South West | 0.033 | 0.005 | 6.07 | 0.000 | 0.022 | 0.043 |
| Region: Inner London | 0.029 | 0.004 | 6.58 | 0.000 | 0.020 | 0.037 |
| Region: Outer London | 0.039 | 0.006 | 6.59 | 0.000 | 0.027 | 0.050 |
| Region: Scotland | -0.001 | 0.005 | -0.23 | 0.819 | -0.010 | 0.008 |
| Region: Wales | 0.008 | 0.005 | 1.81 | 0.071 | -0.001 | 0.018 |
| Duration of current benefit claim: Three months | 0.141 | 0.004 | 32.54 | 0.000 | 0.132 | 0.149 |
| Duration of current benefit claim: Six months | 0.081 | 0.004 | 21.59 | 0.000 | 0.074 | 0.088 |
| Duration of current benefit claim: Twelve months | -0.068 | 0.003 | -21.45 | 0.000 | -0.074 | -0.062 |
| Number of dependent children: 1 | 0.077 | 0.022 | 3.52 | 0.000 | 0.034 | 0.120 |
| Number of dependent children: 2 | 0.095 | 0.022 | 4.27 | 0.000 | 0.051 | 0.138 |
| Number of dependent children: 3 | 0.111 | 0.022 | 4.99 | 0.000 | 0.067 | 0.155 |
| Number of dependent children: 4 | 0.120 | 0.022 | 5.36 | 0.000 | 0.076 | 0.164 |
| Number of dependent children: 5 or more | 0.115 | 0.023 | 5.06 | 0.000 | 0.070 | 0.159 |
| Constant | 0.116 | 0.013 | 9.12 | 0.000 | 0.091 | 0.140 |
Testing DiD assumptions
A crucial assumption underlying whether a DiD estimation is an appropriate model is the ‘parallel (common) trends’ assumption. This assumption says that, in the absence of the treatment or policy being examined, the trends (but not necessarily the levels) in the outcome would have been the same, on average, in the treatment and comparison groups (after adjusting for any observed control variables). A visual example of this is shown in Figure E2 below; demonstrates what this would look like for a time period where no lower benefit cap policy is in place; there is a constant difference in the outcome measures observed between the comparison and pre-treatment groups (pre-rollout), i.e. they follow a common trend. Once the policy is in place, the outcome rate for the rollout (treatment) group increases at a greater rate than for the comparison group, which is known as the treatment effect; this is measured as the difference between the treatment and a counterfactual, which represents a constant rate of increase post rollout of the cap. Note that the chart below is for illustrative purposes only; an example for our data is provide in Figure E3.
Figure E2 DiD parallel trends
E.5.1 Parallel trends assumption
To test the plausibility of the parallel trends assumption, we have examined the relationship between the total weekly benefit income and each of the employment, exempting benefit and housing moves outcome rates, for the pre-treatment cohorts (rollout cohort but assuming the cap rolled out a year earlier, t-1, and rollout cohort assuming the cap rolled out two years earlier, t-2), in the “discontinuity” charts (e.g. Figure E3 below); These can be found in Sections 4.1, 5.1 and 6.2 respectively. We made the decision to inspect two pre-treatment cohorts, the rollout cohort minus one year and the rollout cohort minus two years; we paid particular attention to the rollout cohort t-2, as these households are much less likely to be impacted by the original benefit cap and the offer of pre-implementation support (from May 2016, as set out in Section 1.3). The t-2 cohort is also used to check the robustness of our difference-in-difference methodology.
Figure E3 Testing for Parallel trends through visual inspection of the cohorts, WTC claims in the Rest of Great Britain.
We assessed whether the pre-treatment cohorts are parallel and show similar or ‘common’ trends both, above and below the cap levels:
- below the lower cap benefit income levels (£385 per week for Rest of Great Britain) the likelihood of being in employment, on an exempting benefit or moving LA/COA twelve months later should be similar for the pre-treatment cohorts, at given levels of benefit income
- it is particularly important that the proportion of households in a particular outcome are similar across cohorts at levels of benefit income close to the lower cap level, as these will be used to estimate the impact of the lower cap in the DiD analysis
- in Figure E3, we find that in the Rest of Great Britain the relationship between benefit income and the probability of subsequent movements into work is parallel across the two pre-treatment cohorts below the £385 per week cap level
- this parallel trends assumption was assessed across the different outcomes, using similar “discontinuity” charts for WTC claims, in Chapter 4, exempting benefits, in Chapter 5, and housing moves, in Chapter 6
E5.2 Placebo tests
A more formal way of checking whether the parallel trends assumption held in the pre-lower cap rollout (pre-intervention) data, is to run a “placebo test”. This involves running our analysis as if the policy had been applied from a different (earlier) point in time. A well-designed research strategy should not find a statistically significant effect for this different time period. This test indicates whether the approach followed strictly isolates the impact of the policy from other random effects, rather than being prone to other systematic bias.
We would expect the placebo test to show:
- There should be no impact of the lower cap on WTC claims, exempting benefit receipt nor housing moves in the earlier time periods when the lower cap was not yet rolled out.
- The difference-in-difference analysis on the t-2 pre-treatment cohorts yields a zero and non-significant coefficient on the lower cap dummy variable.
- A pre-existing difference between the both caps and the comparison groups, as the original benefit cap was in operation from April 2013 and some households in the both caps group would have moved into work as a result of this policy; this was shown in the 2014 impact evaluation.
The lower cap only group provides the best indicator for this test as those in the both caps group were in scope for the original cap and therefore may already be more likely to respond. The t-2 pre-treatment cohort is also our best reference as this group was unaffected by the pre-implementation support. The results of the placebo test for the t-2 cohort, shown in Table E2, for households in the lower cap only group are as follows:
- households are 0.5 percentage points less likely to move into employment after twelve months compared to the comparison group. This estimate is statistically significant at the 10 per cent level but is not significantly different from zero at the 5 per cent level (95 per cent confidence interval of (-0.9,0.0)). There is therefore no evidence to suggest that households who would have been capped two years earlier had an increased movement into work than those in a comparison group in the absence of the lower benefit cap policy
- households are more likely to move on to an exempting benefit than the comparison group; a significant lower cap only impact of 0.6 percentage points. The magnitude of the impact is smaller than that found for the rollout cohort, however, it suggests that the results for exempting benefits are therefore not as robust as those for WTC claims and are likely to be somewhat sensitive to pre-period trend differences
- there is no significant increase (at the 10 per cent significance level) in the proportion of census output area moves for the lower cap only group compared to the comparison group. Therefore, two years prior to rollout of the lower benefit cap there was no significant impact on COA moves for Great Britain households who would have met the criteria to be capped
- there is a negligible decrease in LA moves for the lower cap only group (0.3 percentage points) when compared to the comparison group (at the 10 per cent significance level) and so households who would have been subject to the cap two years prior are slightly less likely to move than similar households who would not have had the cap applied
Table E2 also shows that running a difference-in-difference regression model on the both caps group gives a marginal employment effect of 2.4 percentage points. This effect is statistically significant but smaller than that observed in the rollout cohort and may be the impact of the original benefit cap.
Table E2 Placebo Test: Difference-in-difference analysis (including covariates) of pre-reform data, Great Britain.
The results from the placebo tests suggest that the parallel trends assumption holds for the work outcomes, LA and COA moves regression models when using the rollout cohort t-2 and looking at the lower cap group only. For exempting benefits, although there was some evidence of common trends identified from the visual inspection of the cohort data, the formal placebo test shows we have some uncertainty over the suitability of this regression approach for this data.
E5.3 Exploring pre-implementation (anticipation) effects
A second test was used to assess whether or not there were any anticipatory impacts on WTC or exempting benefit take-up or house moves (see Pre-Implementation Support Chapter 1.2.1) for the all capped group, when compared to the comparison during the pre-intervention period. Five pre-treatment lower cap interaction terms were added to the Great Britain difference-in-difference regression model, namely all_capped_t8…. all_capped_t12, to assess the effect of the lower cap up to five months before the rollout of the lower benefit cap. Unless the reform had anticipatory effects whereby households responded in advance, then the coefficients on the pre-treatment terms should be close to zero and statistically insignificant.
The results of this regression, presented in Table E3 show that for the pre-intervention time periods t8 to t12, the marginal effects are negative across all outcomes and are statistically significant (except for t8) but smaller than 1.5 percentage points. Consequently, during this period, the all capped group were actually slightly less likely than a comparison group to move into work, become in receipt of an exempting benefit or move house. There is no evidence of a positive anticipatory effect during pre-implementation of the lower benefit cap.
At rollout month, the observed outcomes rates for capped households are still below a counterfactual, however from one month after rollout (t14 onwards), the trends by outcome begin to change:
- there is no statistically significant effect for movement into work a month after rollout of the lower cap. A statistically significant and positive treatment effect only becomes evident two months after rollout of the lower benefit cap (t15). This effect increases through time reaching a peak effect of 4.9 percentage points at month 25 (95% C.I is (4.3, 5.6))
- there is evidence of a move on to exempting benefits from the first month after rollout, with the impact increasing over time up to nine months after rollout, when it then remains at 2.5 percentage points
- there is no evidence of capped households moving LA at a rate above the comparison group (in fact the moves rate is marginally lower for most months)
- capped households are more likely to move COA than the comparison group but this impact is small and not statistically significant until nine months after rollout of the lower cap
The stabilisation of work and exempting benefit outcomes (ppt impact) from ten months after rollout (all_capped_t22) onwards, reaffirms the decision to report outcomes at twelve months.
Table E3 Pre-implementation effects: linear difference-in-difference regression analyses on the rollout cohort by outcome type.
Annex F: Analysis of single person households
This section focuses on how single person households respond to the lower cap policy, through analysis of their observed outcomes for movement into work, into receipt of an exempting benefit or moves between geography, at Census Output Area and Local Authority level.
Single person households have been excluded from the overall analysis in the report, where the focus is reserved for households with children, and presented here separately due to the group exhibiting different characteristics to both couple and lone parent households.
Couples without children make up a small part of the all capped group at rollout (60 households) and this sample size is not sufficiently large enough to do any regression analysis, therefore this group have been excluded from the analysis in this chapter.
F.1. Characteristics of single person households
A single person household is defined as a single benefit unit with one adult and no children. If they are aged under 35 years and living in the Private Rented Sector, then these households are eligible for the lower shared accommodation rate for Local Housing Allowance (LHA), (although some exemptions are in place[footnote 73], whilst adults aged 35 years and over are entitled to the higher 1-bedroom rate. Single person households are subject to cap levels which are two thirds of that for families at £296.35 per week in Greater London and £257.69 per week in the Rest of Great Britain.
In the latest Official Statistics[footnote 74], single person households make up 9 per cent of all Housing Benefit households that have ever been capped and 7 per cent of those currently capped (at February 2020). In our rollout cohort, single person households make up a relatively small – and similar – proportion, 11 per cent, of those who are potentially capped. These households are much more likely to be in scope for the lower cap than under the higher levels of the original cap. Therefore, there is a need to understand the characteristics of this group and assess how they respond to the cap, which was not assessed in the 2014 impact evaluation[footnote 75]. Typically, single person households:
- are in the Employment Support Allowance work-related activity group (ESA WRAG) (50 per cent). They represent a larger proportion compared to other family types (31 per cent of couples with children households are in ESA WRAG and 10 per cent of lone parent households)
- have shorter benefit durations, with 60 per cent having a claim of less than one year[footnote 76]
- are male (67 per cent) and mainly based in Greater London (50 per cent) or Scotland (10 per cent)
- are distributed across the age bands; 33 per cent are aged under 35 years, 36 per cent aged 35-49 years and 30 per cent aged 50 years or over (but below the State Pension Age)
F.2. Descriptive analysis on work status and total weekly benefit income
The latest Official Statistics[footnote 77] show that there are 17,313 single person households no longer capped under Housing Benefit (as at February 2020) and one per cent (223) of these have left the cap because they have an open Working Tax Credit (WTC) claim. Similarly, in our rollout cohort, and unlike households with children, single person households present little evidence of an increased movement into work following the rollout of the lower benefit cap. Figure F1 shows that twelve months after rollout of the lower benefit cap, the trends in the proportion of single person households observed with an open WTC claim are broadly flat across the distribution of total weekly benefit income (where income is recorded at the start of the cohort tracking period); there are no clear discontinuities in the series for the rollout cohort at either the original £350 per week benefit cap level nor the lower £296 per week level in Greater London. A similar picture is observed for the Rest of Great Britain (Figure F2), with flat trends across the full range of total weekly benefit incomes[footnote 78].
Figure F1 The proportion of single person households in employment after twelve months, by total weekly benefit income, in Greater London.
| Total weekly benefit income (£) | Rollout cohort (%) | Rollout cohort t-1 (%) | Rollout cohort t-2 (%) | Number of households in the rollout cohort in receipt of WTC |
|---|---|---|---|---|
| 245 | 0 | 1 | 2 | 1 |
| 250 | 1 | 1 | 3 | 12 |
| 255 | 2 | 2 | 3 | 25 |
| 260 | 1 | 2 | 2 | 21 |
| 265 | 1 | 1 | 3 | 3 |
| 270 | 1 | 1 | 2 | 4 |
| 275 | 2 | 2 | 1 | 22 |
| 280 | 1 | 2 | 2 | 2 |
| 285 | 1 | 2 | 2 | 6 |
| 290 | 1 | 1 | 2 | 4 |
| 295 | 1 | 2 | 1 | 2 |
| 300 | 2 | 2 | 1 | 7 |
| 305 | 1 | 1 | 2 | 2 |
| 310 | 1 | 0 | 2 | 2 |
| 315 | 1 | 1 | 3 | 4 |
| 320 | 1 | 4 | 2 | 1 |
| 325 | 1 | 1 | 3 | 4 |
| 330 | 1 | 2 | 2 | 8 |
| 335 | 1 | 2 | 0 | 12 |
| 340 | 1 | 2 | 2 | 2 |
| 345 | 1 | 1 | 1 | 4 |
| 350 | 3 | 1 | 1 | 3 |
| 355 | 1 | 1 | 2 | 1 |
| 360 | 1 | 2 | 2 | 3 |
| 365 | 1 | 0 | 0 | 2 |
| 370 | 4 | 2 | 4 | 2 |
| 375 | 0 | 2 | 2 | 0 |
| 380 | 6 | 0 | 3 | 1 |
| 385 | 4 | 3 | 3 | 1 |
| 390 | 0 | 2 | 3 | 0 |
| 395 | 4 | 6 | 2 | 1 |
| 400 | 0 | 15 | 2 | 0 |
| 405 | 0 | 0 | 0 | 0 |
| 410 | 5 | 0 | 3 | 1 |
| 415 | 0 | 0 | 0 | 0 |
| 420 | 5 | 0 | 0 | 1 |
| 425 | 8 | 0 | 0 | 1 |
| 430 | 4 | 0 | 0 | 1 |
| 435 | 0 | 13 | 0 | 0 |
| 440 | 0 | 0 | 7 | 0 |
| 445 | 0 | 0 | 4 | 0 |
| 450 | 0 | 0 | 0 | 0 |
| 455 | 0 | 0 | 0 | 0 |
| 460 | 0 | 25 | 0 | 0 |
| 465 | 0 | 0 | 0 | 0 |
| 470 | 0 | 17 | 0 | 0 |
| 475 | 0 | 0 | 0 | 0 |
| 480 | 0 | 0 | 9 | 0 |
| 485 | 0 | 0 | 0 | 0 |
| 490 | 0 | 0 | 17 | 0 |
| 495 | 0 | 0 | 0 | 0 |
| 500 | 33 | 0 | 0 | 1 |
Figure F2 The proportion of single person households in employment after twelve months, by total weekly benefit income, in the Rest of Great Britain.
| Total weekly benefit income (£) | Rollout cohort (%) | Rollout cohort t-1 (%) | Rollout cohort t-2 (%) | Number of households in the rollout cohort in receipt of WTC |
|---|---|---|---|---|
| 210 | 1 | 2 | 2 | 10 |
| 215 | 1 | 2 | 2 | 14 |
| 220 | 1 | 2 | 2 | 16 |
| 225 | 1 | 2 | 2 | 19 |
| 230 | 0 | 1 | 2 | 4 |
| 235 | 1 | 1 | 2 | 5 |
| 240 | 1 | 2 | 2 | 6 |
| 245 | 1 | 2 | 2 | 9 |
| 250 | 1 | 1 | 2 | 8 |
| 255 | 1 | 1 | 3 | 13 |
| 260 | 1 | 2 | 2 | 9 |
| 265 | 1 | 2 | 2 | 5 |
| 270 | 1 | 1 | 2 | 5 |
| 275 | 1 | 1 | 2 | 5 |
| 280 | 2 | 2 | 2 | 6 |
| 285 | 0 | 1 | 0 | 1 |
| 290 | 1 | 1 | 1 | 3 |
| 295 | 1 | 0 | 1 | 2 |
| 300 | 0 | 0 | 2 | 0 |
| 305 | 0 | 0 | 1 | 0 |
| 310 | 2 | 2 | 1 | 3 |
| 315 | 0 | 1 | 2 | 0 |
| 320 | 0 | 1 | 1 | 0 |
| 325 | 2 | 0 | 2 | 2 |
| 330 | 0 | 0 | 2 | 0 |
| 335 | 0 | 0 | 4 | 0 |
| 340 | 0 | 0 | 1 | 0 |
| 345 | 1 | 1 | 3 | 1 |
| 350 | 3 | 0 | 1 | 3 |
| 355 | 2 | 0 | 2 | 1 |
| 360 | 0 | 1 | 3 | 0 |
| 365 | 0 | 0 | 4 | 0 |
| 370 | 0 | 0 | 0 | 0 |
| 375 | 2 | 0 | 2 | 1 |
| 380 | 0 | 3 | 7 | 0 |
| 385 | 3 | 0 | 2 | 1 |
| 390 | 3 | 0 | 0 | 1 |
| 395 | 0 | 0 | 0 | 0 |
| 400 | 0 | 0 | 3 | 0 |
| 405 | 0 | 5 | 5 | 0 |
| 410 | 0 | 0 | 0 | 0 |
| 415 | 0 | 0 | 0 | 0 |
| 420 | 4 | 0 | 3 | 1 |
| 425 | 0 | 13 | 0 | 0 |
| 430 | 0 | 6 | 0 | 0 |
| 435 | 0 | 0 | 0 | 0 |
| 440 | 0 | 0 | 5 | 0 |
| 445 | 0 | 0 | 0 | 0 |
| 450 | 0 | 0 | 0 | 0 |
| 455 | 0 | 0 | 0 | 0 |
| 460 | 11 | 0 | 0 | 1 |
| 465 | 0 | 0 | 4 | 0 |
| 470 | 0 | 0 | 0 | 0 |
| 475 | 0 | 0 | 0 | 0 |
| 480 | 0 | 0 | 0 | 0 |
| 485 | 0 | 0 | 40 | 0 |
| 490 | 0 | 0 | 0 | 0 |
| 495 | 0 | 0 | 0 | 0 |
| 500 | 0 | 0 | 0 | 0 |
F.3. Descriptive analysis on exempting benefit receipt by total weekly benefit income
Single person households are much more likely to move on to an exempting benefit than into work when moving off the benefit cap. Latest Official Statistics[footnote 79] show that 27 per cent (4,570) of all single person households who were once capped are no longer capped as they are in receipt of an exempting benefit compared to one per cent, who move into work. Similarly, in the rollout cohort, the proportion of single person households in receipt of an exempting benefit is higher than that observed for households with children, twelve months after rollout of the lower cap. In Greater London,16 per cent of all capped single person households (15 per cent including the comparison group) are in receipt of an exempting benefit after twelve months, compared to 8 per cent of households with children (also 8 per cent when including the comparison group).
Figure F3 shows that at total benefit weekly income below the lower benefit cap level, the proportion of households in receipt of an exempting benefit increases with weekly benefit income for all cohorts; rollout cohort t, t-1 and t-2, in Greater London. Immediately above the lower benefit cap level (£296 per week of benefit income), we observe an increasing trend in the proportion of single person households in receipt of exempting benefits for the rollout cohort, whilst decreasing for the pre-treatment cohorts, t-1 and t-2. This provides some evidence of an additional proportion of households in receipt of an exempting benefit in the rollout cohort compared to the t-1 and t-2 cohorts, not in scope for the lower cap levels. However, the impact of the lower benefit cap on being in receipt of an exempting benefit can only be determined in the econometric analysis presented in Section F.5.
Figure F3 The proportion of single person households on an exempting benefit after twelve months, by total weekly benefit income, in Greater London.
| Total weekly benefit income (£) | Rollout cohort (%) | Rollout cohort t-1 (%) | Rollout cohort t-2 (%) | Number of households in the rollout cohort in receipt of WTC |
|---|---|---|---|---|
| 245 | 10 | 7 | 12 | 38 |
| 250 | 9 | 9 | 14 | 85 |
| 255 | 9 | 8 | 13 | 100 |
| 260 | 9 | 9 | 13 | 135 |
| 265 | 15 | 14 | 15 | 81 |
| 270 | 12 | 13 | 17 | 73 |
| 275 | 10 | 9 | 19 | 149 |
| 280 | 16 | 14 | 17 | 55 |
| 285 | 14 | 13 | 20 | 66 |
| 290 | 15 | 15 | 17 | 50 |
| 295 | 15 | 10 | 22 | 39 |
| 300 | 18 | 16 | 15 | 81 |
| 305 | 16 | 10 | 14 | 61 |
| 310 | 19 | 10 | 18 | 52 |
| 315 | 11 | 12 | 14 | 60 |
| 320 | 16 | 18 | 16 | 30 |
| 325 | 14 | 10 | 17 | 57 |
| 330 | 12 | 10 | 16 | 74 |
| 335 | 12 | 11 | 19 | 115 |
| 340 | 15 | 12 | 27 | 26 |
| 345 | 20 | 16 | 24 | 54 |
| 350 | 22 | 18 | 16 | 25 |
| 355 | 22 | 19 | 22 | 31 |
| 360 | 26 | 20 | 21 | 53 |
| 365 | 26 | 22 | 23 | 64 |
| 370 | 15 | 12 | 21 | 8 |
| 375 | 14 | 14 | 33 | 12 |
| 380 | 18 | 18 | 17 | 3 |
| 385 | 17 | 13 | 27 | 4 |
| 390 | 24 | 20 | 20 | 8 |
| 395 | 28 | 21 | 16 | 7 |
| 400 | 19 | 0 | 12 | 4 |
| 405 | 17 | 11 | 35 | 3 |
| 410 | 15 | 28 | 33 | 3 |
| 415 | 22 | 20 | 35 | 5 |
| 420 | 23 | 30 | 18 | 5 |
| 425 | 17 | 25 | 22 | 2 |
| 430 | 21 | 17 | 29 | 6 |
| 435 | 14 | 50 | 27 | 1 |
| 440 | 33 | 43 | 53 | 1 |
| 445 | 38 | 49 | 47 | 15 |
| 450 | 29 | 33 | 17 | 2 |
| 455 | 33 | 0 | 50 | 3 |
| 460 | 18 | 0 | 38 | 2 |
| 465 | 25 | 0 | 21 | 1 |
| 470 | 25 | 50 | 33 | 1 |
| 475 | 70 | 0 | 30 | 7 |
| 480 | 67 | 33 | 9 | 2 |
| 485 | 50 | 0 | 10 | 1 |
| 490 | 25 | 13 | 33 | 1 |
| 495 | 0 | 0 | 20 | 0 |
| 500 | 0 | 50 | 0 | 0 |
In the Rest of Great Britain, the impact of the lower cap on exempting benefit receipt is not as evident as in Greater London (Figure F4), as most of the households in receipt of an exempting benefit after twelve months are concentrated in the comparison group. Immediately below and above the lower benefit cap level of £258 per week a slight uptick in the proportion of households on an exempting benefit in the rollout cohort can be observed, in contrast to the pre-treatment cohorts. The actual impact of the lower benefit cap is presented in the econometric analysis in Section F5.
Figure F4 The proportion of single person households on an exempting benefit after twelve months, by total weekly benefit income, in the Rest of Great Britain.
| Total weekly benefit income (£) | Rollout cohort (%) | Rollout cohort t-1 (%) | Rollout cohort t-2 (%) | Number of households in the rollout cohort in receipt of WTC |
|---|---|---|---|---|
| 210 | 19 | 17 | 20 | 316 |
| 215 | 15 | 14 | 18 | 242 |
| 220 | 18 | 16 | 18 | 340 |
| 225 | 16 | 15 | 19 | 324 |
| 230 | 19 | 15 | 18 | 233 |
| 235 | 19 | 19 | 20 | 189 |
| 240 | 19 | 18 | 20 | 186 |
| 245 | 21 | 19 | 20 | 197 |
| 250 | 21 | 19 | 20 | 192 |
| 255 | 19 | 17 | 20 | 191 |
| 260 | 25 | 17 | 18 | 166 |
| 265 | 20 | 16 | 21 | 112 |
| 270 | 16 | 16 | 18 | 135 |
| 275 | 19 | 15 | 18 | 70 |
| 280 | 18 | 15 | 22 | 61 |
| 285 | 23 | 18 | 23 | 60 |
| 290 | 20 | 13 | 23 | 48 |
| 295 | 22 | 16 | 20 | 51 |
| 300 | 18 | 17 | 20 | 45 |
| 305 | 13 | 14 | 23 | 24 |
| 310 | 19 | 14 | 19 | 28 |
| 315 | 16 | 16 | 20 | 24 |
| 320 | 19 | 15 | 17 | 25 |
| 325 | 17 | 20 | 20 | 14 |
| 330 | 15 | 16 | 17 | 12 |
| 335 | 14 | 15 | 14 | 17 |
| 340 | 16 | 17 | 15 | 19 |
| 345 | 24 | 15 | 25 | 20 |
| 350 | 13 | 22 | 27 | 12 |
| 355 | 18 | 16 | 20 | 8 |
| 360 | 14 | 18 | 20 | 11 |
| 365 | 17 | 21 | 20 | 8 |
| 370 | 15 | 22 | 17 | 8 |
| 375 | 16 | 21 | 25 | 8 |
| 380 | 6 | 14 | 16 | 3 |
| 385 | 37 | 21 | 19 | 11 |
| 390 | 23 | 22 | 15 | 7 |
| 395 | 19 | 6 | 31 | 5 |
| 400 | 9 | 5 | 33 | 3 |
| 405 | 19 | 14 | 18 | 3 |
| 410 | 37 | 20 | 18 | 7 |
| 415 | 18 | 9 | 15 | 3 |
| 420 | 17 | 17 | 26 | 4 |
| 425 | 17 | 0 | 19 | 2 |
| 430 | 6 | 19 | 23 | 1 |
| 435 | 28 | 6 | 14 | 5 |
| 440 | 17 | 13 | 33 | 2 |
| 445 | 15 | 13 | 31 | 2 |
| 450 | 13 | 13 | 27 | 1 |
| 455 | 11 | 50 | 0 | 1 |
| 460 | 11 | 17 | 42 | 1 |
| 465 | 0 | 7 | 31 | 0 |
| 470 | 33.33333333 | 0 | 33.33333333 | 2 |
| 475 | 25 | 0 | 33 | 1 |
| 480 | 20 | 67 | 24 | 1 |
| 485 | 0 | 0 | 0 | 0 |
| 490 | 33 | 14 | 18 | 1 |
| 495 | 0 | 0 | 22 | 0 |
| 500 | 0 | 0 | 0 | 0 |
F.4. Econometric analysis on employment impacts for single person households
Evidence from the raw data suggests that the application of the lower benefit cap to single person households may not influence their likelihood of moving into work after twelve months. A difference-in-difference regression analysis on this group of households run under the same model specification as outlined in Annex E for WTC outcomes, confirms that this is a valid interpretation of the raw data. The analysis presented in Table F1 shows that there is perhaps a very small additional work impact for single person households in the all capped group over that seen in the comparison group but this is non-significant.
Table F1 Twelve-month impact of the lower benefit cap on employment for single households, by cap group.
| Counter-factual baseline (%) | Increase | Counter-factual baseline (%) | Increase | Counter-factual baseline (%) | Increase | ||||
|---|---|---|---|---|---|---|---|---|---|
| Group | PPT | % | PPT | % | PPT | % | |||
| Great Britain | 1 | 0.1 | 10 | 1 | 0.1 | 7 | 1 | 0.0 | 0 |
| Greater London | 1 | 0.2 | 20 | 1 | 0.1 | 14 | 2 | 0.0 | 2 |
| Rest of Great Britain | 1 | 0.0 | -1 | 1 | 0.0 | -1 | 1 | 0.0 | -5 |
F.5. Econometric analysis on exempting benefit receipt for single person households
Single capped households are more likely to be in receipt of an exempting benefit after twelve months when compared to similar uncapped households. Also, exempting benefit receipt is higher than that observed for households with children; Table F2 shows that the impact on the receipt of an exempting benefit for single person households for all cap groups and geography. Single households have a 47 per cent relative increase or 5.6 percentage points increase from 12 to 17 per cent for households in receipt of an exempting benefit in the lower cap group compared to the comparison group (Table F2).
Table F2 Twelve-month impact of the lower benefit cap on exempting benefits for single households, by cap group.
| Counter-factual baseline (%) | Increase | Counter-factual baseline (%) | Increase | Counter-factual baseline (%) | Increase | ||||
|---|---|---|---|---|---|---|---|---|---|
| Group | PPT | % | PPT | % | PPT | % | |||
| Great Britain | 12 | 4.8*** | 40 | 12 | 5.6*** | 47 | 11 | 9.6*** | 85 |
| Greater London | 11 | 3.4*** | 31 | 12 | 4.8*** | 41 | 14 | 9.9*** | 72 |
| Rest of Great Britain | 16 | 2.6*** | 16 | 13 | 5.8*** | 45 | 12 | 5.2*** | 44 |
F.6. Econometric analysis on housing moves between LA’s and COA’s for single person households
There is no significant evidence that single person households move to another local authority as a response to the lower benefit cap. Capped single households are 0.3 percentage points less likely to move local authority compared to the comparison group after twelve months. This result is non-significant at the 10 per cent level (Table F3).
Table F3 Twelve-month impact of the lower benefit cap on LA moves for single households, by cap group.
| Counter-factual baseline (%) | Increase | Counter-factual baseline (%) | Increase | Counter-factual baseline (%) | Increase | ||||
|---|---|---|---|---|---|---|---|---|---|
| Group | PPT | % | PPT | % | PPT | % | |||
| Great Britain | 14 | -0.3 | -2 | 16 | 0 | 0 | 14 | -0.3 | -2 |
| Greater London | 13 | -0.5 | -4 | 14 | 1.4 | 10 | 14 | -0.1 | -1 |
| Rest of Great Britain | 14 | 0 | 0 | 17 | -0.5 | -3 | 15 | -0.5 | -4 |
At Census Output Area (COA) level, a significant increase in the moves rate for all capped households compared to the comparison group is found only in the Rest of Great Britain; there is no significant national impact. However, there is a significant national impact for single person households in the both caps group with households 3.6 percentage points or 8 per cent more likely to move COA than the comparison group; an increase in the COA moves rate, from 43 to 47 per cent (Table F4).
Table F4 Twelve-month impact of the lower benefit cap on COA moves for single households, by cap group.
| Counter-factual baseline (%) | Increase | Counter-factual baseline (%) | Increase | Counter-factual baseline (%) | Increase | ||||
|---|---|---|---|---|---|---|---|---|---|
| Group | PPT | % | PPT | % | PPT | % | |||
| Great Britain | 41 | -0.1 | 0 | 43 | 3.6** | 8 | 41 | 0.5 | 1 |
| Greater London | 26 | -0.6 | -2 | 26 | 4.0* | 15 | 26 | 0.4 | 1 |
| Rest of Great Britain | 53 | 0.9 | 2 | 71 | 2.9** | 4 | 55 | 1.8* | 3 |
https://www.gov.uk/government/statistics/benefit-cap-number-of-households-capped-to-february-2020
https://www.gov.uk/government/statistics/benefit-cap-number-of-households-capped-to-february-2020
https://www.gov.uk/government/statistics/benefit-cap-number-of-households-capped-to-february-2020
https://www.gov.uk/government/statistics/benefit-cap-number-of-households-capped-to-february-2020
https://www.gov.uk/government/statistics/benefit-cap-number-of-households-capped-to-february-2020
https://www.gov.uk/government/statistics/benefit-cap-number-of-households-capped-to-february-2020
https://www.gov.uk/government/statistics/benefit-cap-number-of-households-capped-to-february-2020
-
UK Statistics Authority. (2018). Code of Practice for Statistics: https://www.statisticsauthority.gov.uk/code-of-practice ↩
-
https://www.gov.uk/government/publications/benefit-cap-evaluation ↩
-
For more information on the local support agencies interviewed please see Annex B: Lower cap evaluation strategy. ↩
-
The Rest of Great Britain includes all regions in Great Britain with the exception of London i.e. North East, North West, Yorkshire and The Humber, East Midlands, West Midlands, East, South East, South West, Wales and Scotland. ↩
-
Throughout this report, we refer to paid work as “work”. ↩
-
A full list of the benefits that provide an exemption from the benefit cap’s application to Housing Benefit or Universal Credit can be found in Annex A. ↩
-
Based on raw descriptive analysis only. ↩
-
These are the smallest unit for which census data are published - they were initially generated to support publication of 2001 Census outputs and contain at least 40 households and 100 persons, the target size being 125 households. ↩
-
Benefit cap: analysis of the outcomes of capped households (December 2014), https://assets.publishing.service.gov.uk/government/uploads/system/uploads/attachment_data/file/385970/benefit-cap-analysis-of-_outcomes-of-capped-claimants.pdf ↩
-
Out of every 100 capped households, an additional 5 households move into work which may be attributable to the benefit cap policy. ↩
-
Both evaluations used those households with benefit income just below the cap level as a comparison group; for the previous evaluation that was a group with a benefit income up to £50 per week below the original cap and for the evaluation of the lower benefit cap the group was those with income up to £25 per week below the new lower cap. However, as capped levels changed significantly between the evaluations, the characteristics of the comparison groups are different. ↩
-
Benefit cap: number of households capped to February 2020: ↩
-
The percentage point impact for households claiming JSA is statistically significant at the 5 per cent level. ↩
-
COA is the smallest geographical area by which we are able to identify moves in the administrative data available for this evaluation. ↩
-
An increase of 1.8 percentage points on 18 per cent is equal to 19 per cent due to rounding. ↩
-
Elsewhere in the report where we refer to ‘households with children’ and ‘couples with children’, ‘children’ should always be taken to mean ‘dependent children’. ↩
-
Statistically significant at the 10 per cent level. ↩
-
Households with one partner above State Pension Age and one below that receive a working age benefit (HB or UC) are not exempt from the application of the benefit cap and the cap may apply to their HB or UC award. ↩
-
https://assets.publishing.service.gov.uk/government/uploads/system/uploads/attachment_data/file/386911/benefit-cap-review-of-the-first-year.pdf (first published April 2014) ↩
-
Benefit cap: analysis of the outcomes of capped households (December 2014), https://assets.publishing.service.gov.uk/government/uploads/system/uploads/attachment_data/file/385970/benefit-cap-analysis-of-_outcomes-of-capped-claimants.pdf ↩
-
https://assets.publishing.service.gov.uk/government/uploads/system/uploads/attachment_data/file/548741/welfare-reform-and-work-act-impact-assessment-for-the-benefit-cap.pdf ↩
-
Benefit cap: number of households capped to February 2020 ↩
-
Further detail on ‘Preparing for and operationalising the new cap’ can be found in Appendix B of the NatCen report ‘Evaluation of the lower benefit cap: Findings from the mixed method longitudinal evaluation’. ↩
-
See https://www.gov.uk/government/publications/summer-budget-2015/summer-budget-2015 ↩
-
This was in England only, not any of the devolved administrations. See https://www.gov.uk/guidance/welfare-reform-and-work-act-2016-social-rent-reduction ↩
-
The original plan was to interview households at months six and twelve but the fieldwork had to be delayed during the pre-election period before the June 2017 General Election. ↩
-
Households with one partner above State Pension Age and one below that receive a working age benefit (HB or UC)) are not exempt from the application of the benefit cap and are included in the in-scope group. ↩
-
This does not include the small number of households who had the cap applied to their UC live service award during this period, for which we do not have robust administrative data to include them in this evaluation. ↩
-
For more information on the definition of SEA, see HB Adjudication Circular A8/2014: https://assets.publishing.service.gov.uk/government/uploads/system/uploads/attachment_data/file/555002/a8-2014.pdf ↩
-
We refer to the 2014 impact evaluation throughout this report to distinguish this analysis from the other reports that form the 2014 benefit cap evaluation: Benefit cap: analysis of the outcomes of capped households (December 2014), https://assets.publishing.service.gov.uk/government/uploads/system/uploads/attachment_data/file/385970/benefit-cap-analysis-of-_outcomes-of-capped-claimants.pdf ↩
-
These categories are not mutually exclusive. ↩
-
https://www.gov.uk/government/collections/benefit-cap-statistics ↩
-
UC work outcomes are included in Chapter 3 only. They do not form part of the econometric analysis which uses a WTC outcome measure in Chapter 4. Further information can be found in Annex D. ↩
-
Benefit cap: analysis of the outcomes of capped households (December 2014), https://assets.publishing.service.gov.uk/government/uploads/system/uploads/attachment_data/file/385970/benefit-cap-analysis-of-_outcomes-of-capped-claimants.pdf ↩
-
Discretionary Housing Payments guidance manual 2019: lhttps://assets.publishing.service.gov.uk/government/uploads/system/uploads/attachment_data/file/692240/discretionary-housing-payments-guide.pdf ↩
-
More information on LA use of DHP funding in England and Wales can be found here: https://www.gov.uk/government/collections/discretionary-housing-payments-statistics ↩
-
A household may have one or more of the following outcomes: claiming WTC, receipt of an exempting benefit, COA move, LA move and each of these outcomes are modelled in turn in the econometric analysis. This is different to the hierarchical approach defined in Chapter 3, where for example, households with an exempting benefit are only counted if a household is not claiming WTC. Claiming WTC is the highest outcome in the hierarchy and so the percentage of households with this outcome will be the same in Chapters 3 and 4. ↩
-
Benefit cap: analysis of the outcomes of capped households (December 2014), https://assets.publishing.service.gov.uk/government/uploads/system/uploads/attachment_data/file/385970/benefit-cap-analysis-of-_outcomes-of-capped-claimants.pdf ↩
-
A moving average is a technique used to understand the trends in a data set; it is an average of any subset of numbers calculated using the mean of four neighbouring values. For example, the first four-point moving average is calculated using the mean of the first four data points. The second four-point moving average is calculated by discarding the first value and using the next four values etc. ↩
-
This is calculated by dividing the percentage point increase by the estimated counterfactual baseline and multiplying by 100. ↩
-
Characteristics defined as those present at rollout. ↩
-
There are only 60 couples without children households in the all capped group at rollout. ↩
-
The confidence intervals associated with the estimates in Greater London are larger than for the Rest of Great Britain, due to smaller sample size of households in this area. Similarly, for the Rest of Great Britain the confidence intervals are larger for greater capped amounts as the sample sizes in these groups are also smaller. ↩
-
A household may have one or more of the following outcomes: claiming WTC, receipt of an exempting benefit, COA move, LA move and each of these outcomes are modelled in turn in the econometric analysis. This is different to the hierarchical approach defined in Chapter 3, where households with an exempting benefit are only counted if a household is not claiming WTC. ↩
-
See Annex A for a list of benefits providing exemption from the cap. Note exemptions considered are those for households capped under Housing Benefit only i.e. Universal Credit exemptions do not apply here. ↩
-
Benefit cap: number of households capped to February 2020 ↩
-
For reference, the number and proportion of the rollout cohort in each subgroup can be found in Table 2.4 of Chapter 2. ↩
-
There are only 60 couples without children households in the all capped group at rollout. ↩
-
Statistically significant at the 5 per cent level. ↩
-
A household may have one or more of the following outcomes: claiming WTC, receipt of an exempting benefit, COA move, LA move and each of these outcomes are modelled in turn in the econometric analysis. This is different to the hierarchical approach defined in Chapter 3, where households with a COA or LA move are only counted if a household is not claiming Working Tax Credit (WTC) or in receipt of an exempting benefit. ↩
-
Benefit cap: analysis of the outcomes of capped households (December 2014), https://assets.publishing.service.gov.uk/government/uploads/system/uploads/attachment_data/file/385970/benefit-cap-analysis-of-_outcomes-of-capped-claimants.pdf ↩
-
These are the smallest unit for which census data are published - they were initially generated to support publication of 2001 Census outputs and contain at least 40 households and 100 persons, the target size being 125 households. ↩
-
For the exact specifications of COAs, see: https://www.ons.gov.uk/methodology/geography/ukgeographies/censusgeography ↩
-
Figures above do not sum due to rounding. ↩
-
Households in temporary accommodation refers to households living in accommodation secured by a local housing authority under their statutory homelessness functions. The majority of households in temporary accommodation have been placed under the main homelessness duty to secure suitable accommodation until the duty ends. ↩
-
This does not mean that they did not move, rather that the tenure type (SRS, PRS, etc.) did not change after twelve months. ↩
-
Couples without children are included in the regression model but the results are not reported here due to the small sample size. There are only 60 couples without children households in the all capped group at rollout. ↩
-
Statistically significant at the 10 per cent level. ↩
-
Annex A contains a full list of exempting benefits. ↩
-
COAs contain at least 40 households and 100 persons, the target size being 125 households. Moves within COAs are not observed i.e. If a household were to move to another property on the same street, for example, then this might not be captured in the administrative data. ↩
-
Figures are rounded to the nearest one per cent and so totals may not sum due to rounding. ↩
-
Where Housing Benefit is awarded to a person receiving Universal Credit living in Supported or Temporary Accommodation it is not included in the Universal Credit benefit cap calculation. In addition, the benefit cap will not be applied to the Housing Benefit. ↩
-
Benefit cap: number of households capped to February 2020 ↩
-
Code of Practice for Statistics: https://www.statisticsauthority.gov.uk/code-of-practice/the-code/ ↩
-
At the time of rollout of the lower benefit cap, only around 300 households were capped under Universal Credit Live Service according to internal DWP management information. ↩
-
UC was only available in specific locations at the time of the lower cap rollout in November 2016/ This means that in the twelve-month tracking period following the lower cap rollout, a household’s eligibility to claim UC depended on the availability of UC in their local area. ↩
-
Universal Credit is assessed and paid in arrears, on a monthly basis in a single payment. The first assessment period starts on the date that the UC claim is made. The assessment period lasts one calendar month. ↩
-
The original benefit cap was introduced in April 2013. ↩
-
Month 1 in our dataset refers to twelve months before the cap was rolled out or month -12 in our flows charts (e.g. Figure 4.1). Month 13 is the month the lower cap levels were rolled out, and is known as month 0 in our flows charts. Lastly month 25 is twelve months after the cap was rolled out, or month +12 in our flow charts. ↩
-
DWP Housing benefit and Council Tax benefit circular, 2011 https://assets.publishing.service.gov.uk/government/uploads/system/uploads/attachment_data/file/632031/a14-2011.pdf ↩
-
Benefit cap: number of households capped to February 2020 ↩
-
Benefit cap: analysis of the outcomes of capped households (December 2014), https://assets.publishing.service.gov.uk/government/uploads/system/uploads/attachment_data/file/385970/benefit-cap-analysis-of-_outcomes-of-capped-claimants.pdf ↩
-
This is one reason that single households are less likely to have the benefit cap applied that other household types. ↩
-
Benefit cap: number of households capped to February 2020 ↩
-
When interpreting these charts note that the number of households in the rollout cohort observed to have an open WTC claim is generally very small; just 15 households with an initial weekly benefit income above £300 per week are in work a year after rollout of the lower cap. ↩
-
Benefit cap: number of households capped to February 2020 ↩