Liver disease profiles: short statistical commentary, October 2018
Published 2 October 2018

© Crown copyright 2018
This publication is licensed under the terms of the Open Government Licence v3.0 except where otherwise stated. To view this licence, visit nationalarchives.gov.uk/doc/open-government-licence/version/3 or write to the Information Policy Team, The National Archives, Kew, London TW9 4DU, or email: psi@nationalarchives.gov.uk.
Where we have identified any third party copyright information you will need to obtain permission from the copyright holders concerned.
This publication is available at https://www.gov.uk/government/statistics/liver-disease-profiles-october-2018-update/liver-disease-profiles-short-statistical-commentary-october-2018
New in this update
New hospital admissions data for 2016 to 2017 has been added to the liver disease profiles.
This update includes new data for 2 indicators in the profiles:
- age-standardised rate of hospital admissions due to liver disease per 100,000 population
- age-standardised rate of hospital admissions from alcoholic liver disease per 100,000 population
Data for the financial years 2015 to 2016 and 2016 to 2017 have been added for the first time. The previous time series data has been fully revised back to 2010 to 2011. New views have been added to include deprivation deciles and ONS area classifications.
Main findings
This update shows:
- in the financial year of 2016 to 2017, there were 68,364 admissions to hospital due to liver disease in England, a rate of 131.2 per 100,000 population
- over the last 5 years, the admissions rate has been significantly increasing every year
- district and unitary local authority rates of liver disease admissions in 2016 to 2017 varied from 56.6 to 294.3 admissions per 100,000 population
- males in 2016 to 2017, experienced a rate that was 1.6 times higher than that of females
- the most deprived deciles of district and unitary local authorities had a rate 1.7 times higher than the least deprived decile
- the rate of hospital admissions from alcoholic liver disease was 38.5 per 100,000 population in England in 2016 to 2017, a total of 20,202 admissions
- the rate of hospital admissions from alcoholic liver disease for males is more than double that of females
Summary
Hospital admission rate due to liver disease
This indicator has been updated and previous data refreshed to present data from the financial year 2010 to 2012, up to 2016 to 2017. This indicator measures the local burden of liver disease, a largely preventable morbidity, on hospitals.
In 2016 to 2017 the rate of admission to hospital due to liver disease was 131.2 per 100,000 population in England. This represents 68,364 admissions within the year.
The rate for admissions has significantly increased every year since 2012 to 2013 when the rate was 113.4 per 100,000 populations across England, accounting for 56,545 hospital admissions (figure 1).
Figure 1: Hospital admission rate due to liver disease, per 100,000 population, England, financial years 2010 to 2011 to 2016 to 2017
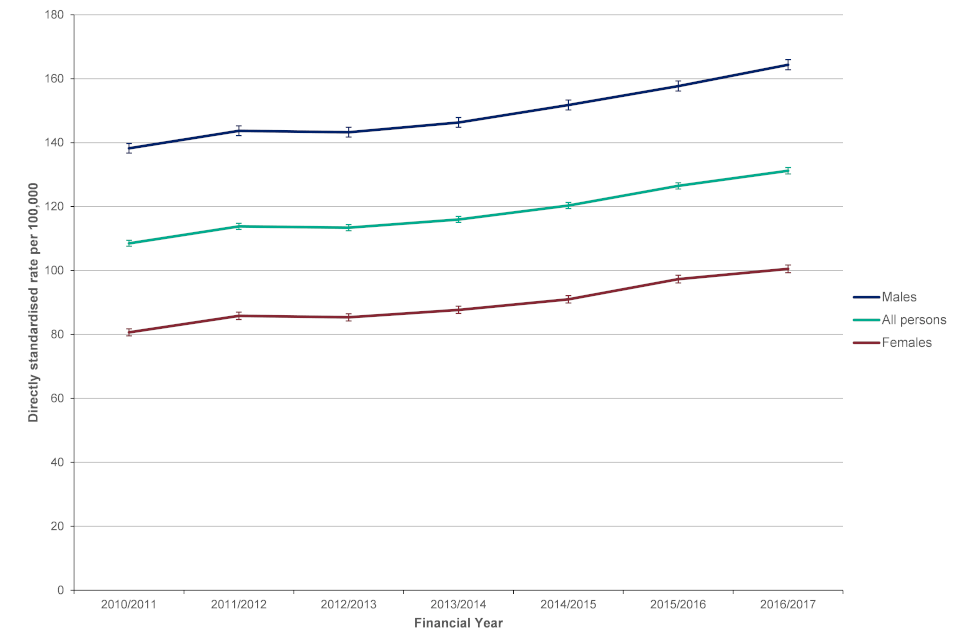
Line chart showing hospital admission rate due to liver disease per 100,000 population in England for financial years 2010 to 2011 to 2016 to 2017 for males, females and persons
The rate of admissions in males in 2016 to 2017 was 164.4 per 100,000, a rate that was 1.6 times higher than the rate for females 100.5 per 100,000. There were 41,385 admissions for males and 26,979 for females in 2016 to 2017.
Across the district and unitary local authorities rates varied from 56.6 per 100,000 population in Tunbridge Wells to 294.3 in Great Yarmouth. Birmingham had the largest count of hospital admissions for liver disease with 1,143 admissions in 2016 to 2017. Leeds and Cornwall also had over 1,000 admissions to hospital in 2016 to 2017.
As seen with other indicators in the Liver Profile, hospital admissions for liver disease differ by levels of deprivation. Those in the most deprived lower tier local authority deprivation decile have an average rate of 167.3 admissions per 100,000 whilst those in the least deprived decile have a rate of 97.2 admissions per 100,000 people. This is a 1.7 fold difference across the groups (figure 2).
Figure 2: Hospital admission rate due to liver disease, per 100,000 population, by lower tier local authority deprivation decile, England, financial year 2016 to 2017
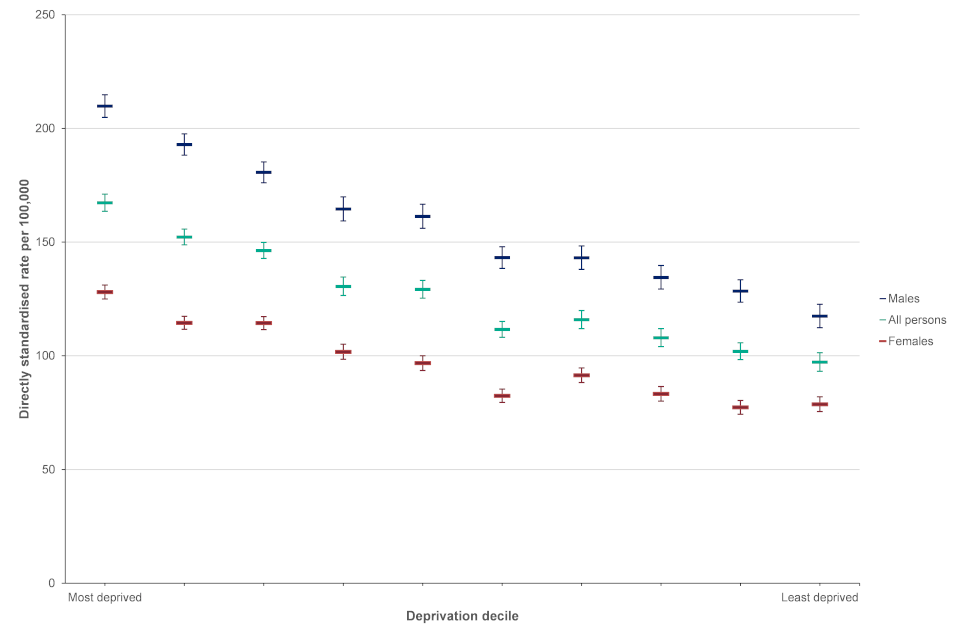
Scatter chart showing hospital admission rate due to liver disease per 100,000 population, by lower tier local authority deprivation decile in England for financial year 2016 to 2017 for males, females and persons
Hospital admissions for alcoholic liver disease
This indicator has been updated and previous data refreshed to present data from the financial year 2010 to 2012, up to 2016 to 2017.
In England, the age-standardised rate of hospital admissions from alcoholic liver disease was 38.5 per 100,000 people, a count of 20,202 admissions.
Since 2013 to 2014 the admission rate has been significantly increasing every year (figure 3). In 2013 to 2014 the rate was 32.0 per 100,000 population, accounting for 16,360 admissions.
Figure 3: Hospital admission rate from alcoholic liver disease, per 100,000 population, England, financial years 2010 to 2011 to 2016 to 2017
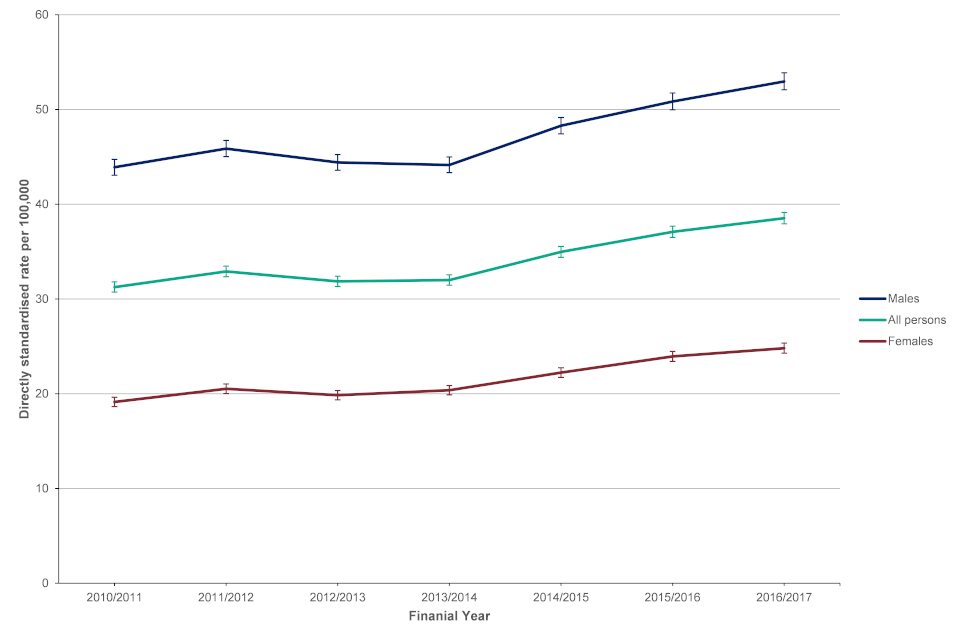
Line chart showing hospital admission rate from alcoholic liver disease, per 100,000 population in England for financial years 2010 to 2011 to 2016 to 2017 for males, females and persons
For males the rate was 53.0 per 100,000, accounting for 13,569 admissions, which was more than double the rate of females at 24.8 per 100,000, 6,633 admissions during 2016 to 2017. This mirrors the trend in data for hospital admission episodes for alcohol specific conditions.
Across local authorities rates varied from 9.7 per 100,000 population in Sutton to 126.6 in Blackburn with Darwen (figure 4).
Figure 4: Hospital admission rate from alcoholic liver disease, per 100,000 population, lower tier local authorities and England, financial year 2016 to 2017
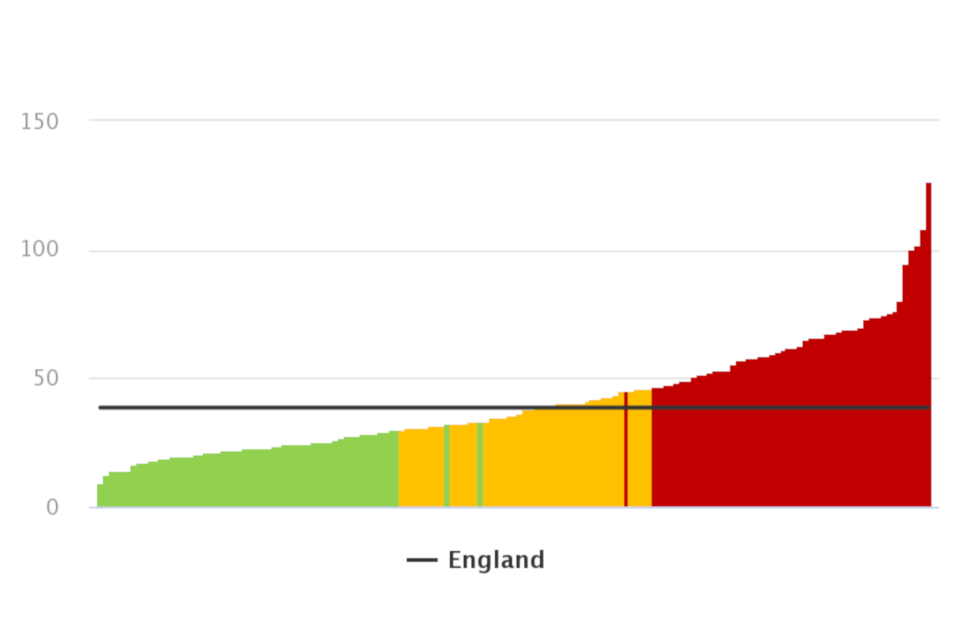
Chart showing hospital admission rate from alcoholic liver disease, per 100,000 population for lower tier local authorities and England as a whole for financial year 2016 to 2017
Background and further information
Liver disease is almost entirely preventable with the major risk factors: alcohol, obesity and hepatitis B and C accounting for up to 90% of cases.
The liver disease profiles provide an invaluable resource relating to one of the main causes of premature mortality nationally; a disease whose mortality rates are increasing in England, while decreasing in most EU countries. The local authority profiles will support the development of Joint Strategic Needs Assessments and work of health and wellbeing boards presenting local key statistics and highlighting questions to ask locally about current action to prevent liver disease.
The website contains data for upper tier local authorities, former Government Office regions, England and where available lower tier local authorities.
The profiles, aimed at primarily LAPH were developed following recommendations in March 2014 from the All-Party Parliamentary Hepatology Group (APPHG) inquiry into improving outcomes in liver disease. Recommendations the LA profiles aim to address were:
- PHE should address the worrying lack of data on all aspects of liver disease by developing a dataset to allow performance management of liver disease across CCGs, local authorities and health and wellbeing boards
- health and wellbeing boards should monitor early detection, treatment and mortality rates from liver disease; assessing progress on tackling liver disease should be made a mandatory part of the joint strategic planning process for CCGs and local authorities
Deprivation deciles are calculated by ranking local authorities in England from most deprived to least deprived and dividing them into 10 equal groups. These deciles range from the most deprived 10% of local authorities nationally to the least deprived 10% of local authorities nationally. The Fingertips profiles technical guidance page includes a guide on assigning deprivation categories.
Further details about the liver profile methodology are available within the definitions section of the online version of the liver disease profile.
Responsible statistician, product lead: Liz Rolfe, Julia Verne
For queries relating to this document, please contact: liverdisease@phe.gov.uk