Lateral flow device specificity in phase 4 (post-marketing) surveillance
Published 10 March 2021

© Crown copyright 2021
This publication is licensed under the terms of the Open Government Licence v3.0 except where otherwise stated. To view this licence, visit nationalarchives.gov.uk/doc/open-government-licence/version/3 or write to the Information Policy Team, The National Archives, Kew, London TW9 4DU, or email: psi@nationalarchives.gov.uk.
Where we have identified any third party copyright information you will need to obtain permission from the copyright holders concerned.
This publication is available at https://www.gov.uk/government/publications/lateral-flow-device-specificity-in-phase-4-post-marketing-surveillance/lateral-flow-device-specificity-in-phase-4-post-marketing-surveillance
Authors:
-
Achim Wolf, NHS Test and Trace, Department of Health and Social Care
-
Jack Hulmes, NHS Test and Trace, Department of Health and Social Care
-
Susan Hopkins, Public Health England
Summary
Public Health England (PHE) and Oxford University evaluated the performance of the Innova LFD device against PCR. In phase 2 and 3a, where the same sample was used for both PCR and LFD specificity analyses, no false positives were detected.
We conducted a phase 4, post-marketing surveillance study in 7,546 individuals with a negative PCR result and compared those results with the LFD results from a separate sample. This study identified 21 (0.28%) discordant test pairs and therefore concluded that the specificity of the LFD device was 99.72%. However, this analysis assumed a sensitivity for the PCR of 100% (that is, that on all 21 discordant samples the PCR, and not the LFD, gave the correct result). Analysis of the phase 4 data can also be interpreted with lower PCR sensitivity levels and is consistent with a PCR sensitivity ranging from 94.2% to 100% and an associated LFD specificity ranging from 100% to 99.72%.
Subsequently we have analysed data from LFD community testing at NHS Test and Trace asymptomatic testing sites (ATSs) from 20 November 2020 to 27 January 2021: 1,700,972 were conducted and 38,270 (2.2%) LFDs returned a positive result. Among positive LFD results, 25,779 (67%) were matched to a PCR test within the subsequent 5 days. Of those, 24,147 (93.7%) returned a positive PCR result, significantly higher than the positive predictive value expected with LFD specificity of 99.72%. The best statistical fit of this data resulted in LFD specificity of 99.97% and PCR sensitivity of 94.8%. Similar numbers were found in schools (LFD specificity 99.97%, PCR sensitivity 94.4%).
These analyses support the policy of not requiring PCR confirmation of positive LFD tests conducted at ATSs under current levels of population prevalence. The data will be kept under review and further post-marketing surveillance analyses conducted at regular intervals.
Study results
The PHE Porton Down/Oxford study evaluated the performance of the Innova LFD device against PCR. For its specificity analyses, it found no false positives in phases 2 and 3, where the same samples were used for both PCR and LFD (0 out of 1,012).[footnote 1]
For phase 4, the study compared 8,223 PCR results with LFD results from a second separate sample from 4 different sites (Table 1). These data were extracted from the studies performed at 4 sites in November 2020.
Table 1: PCR results
| Site | PCR+ | PCR- | PCR total |
|---|---|---|---|
| Regional test sites (RTS) | 373 | 1,314 | 1,687 |
| Liverpool community testing | 88 | 5,438 | 5,526 |
| Manchester evaluation study | 91 | 314 | 405 |
| York evaluation study | 125 | 480 | 605 |
| Total | 677 | 7,546 | 8,223 |
Prevalence based on PCR 8.2% (677/8,223).
7,546 negative PCR results were compared to LFD results. The study identified 21 (0.28%) discordant test pairs and therefore concluded that the specificity of the LFD device was 99.72% (Table 2).
Table 2: false positive LFDs relative to PCR
| Site | LFD+ | PCR- | False positive rate |
|---|---|---|---|
| Regional test sites (RTS) | 5 | 1,314 | 0.38% |
| Liverpool community testing | 3 | 5,438 | 0.06% |
| Manchester evaluation study | 4 | 314 | 1.27% |
| York evaluation study | 9 | 480 | 1.88% |
| Total | 21 | 7,546 | 0.28% |
LFD specificity relative to PCR 99.72%.
However, this assumed that the clinical sensitivity of the PCR was 100%. A recent meta-analysis[footnote 2] found a pooled estimate of 94% (significant heterogeneity, range 42% to 98%). This is likely related to sampling technique, volume of fluid and viral load.
Therefore we modelled the impact of different assumptions of PCR clinical sensitivity on the phase 4 findings of LFD specificity, using the reported data on prevalence (Table 1), discordant PCR negatives (Table 2) and discordant PCR positives (Table 3) using 2 alternative hypotheses:
- Assuming 100% PCR sensitivity to estimate LFD specificity
- Assuming 100% LFD specificity to estimate PCR sensitivity
Table 3: true positive LFDs relative to PCR
| Site | LFD+ | PCR+ | Sensitivity |
|---|---|---|---|
| Regional test sites (RTS) | 214 | 373 | 57.4% |
| Liverpool community testing | 28 | 88 | 31.8% |
| Manchester evaluation study | 34 | 91 | 37.4% |
| York evaluation study | 63 | 125 | 50.4% |
| Total | 339 | 677 | 50.1% |
LFD sensitivity relative to PCR 50.1%.
The assumptions used for the modelling are described in Table 4 below.
Table 4: modelling assumptions
| LFD | PCR | |
|---|---|---|
| Clinical sensitivity | 50.1% | 100% - 94.2% (adjusted to maintain consistency with phase 4 results) |
| Clinical specificity | 99.72% - 100% (adjusted to maintain consistency with phase 4 results) | 100% |
The ‘true’ prevalence was adjusted depending on the PCR sensitivity. The ‘PCR’ prevalence reported in phase 4 was 8.2% (Table 1) so in the scenario which assumes a PCR sensitivity of, for example, 95%, the ‘true’ prevalence is adjusted upwards to 8.7% (0.082/0.95) to ensure consistency with the phase 4 findings.
The baseline scenario (PCR clinical sensitivity of 100%, as per phase 4 analysis) is presented in Table 5.
Table 5: scenario 1 (PCR sensitivity 100%/LFD specificity 99.72%)

Table 5 shows:
- 677 individuals with COVID, all of whom were positive on PCR:
- 339 of those were also positive on LFD
- 338 were negative on LFD
- 7,546 individuals without COVID, all of whom were negative on PCR:
- 7,525 individuals were also negative on LFD
- 21 were positive on LFD (discordant pairs)
In this scenario, there are no PCR false negatives, and the specificity of the LFD device relative to PCR is therefore also the ‘true’ specificity.
At 100% LFD specificity, the PCR sensitivity would need to be 94.2% (Table 6). A PCR sensitivity below 94.2% is not compatible with the phase 4 data as there would be too many PCR false negatives (more than 42) and therefore too many false positive LFD results relative to PCR (that is, more than the 21 observed in the phase 4 results, given the LFD sensitivity of 50.1%).
Table 6: scenario 2 (PCR sensitivity 94.2%/LFD specificity 100%)
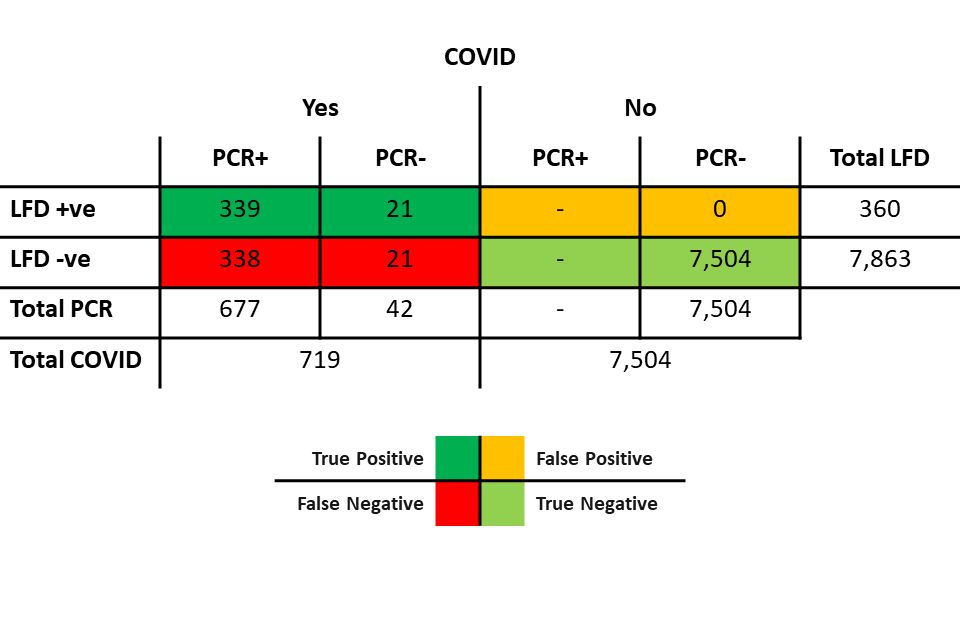
Table 6 shows:
- 719 individuals with COVID:
- 677 of those were positive on PCR. Of those 677:
- 339 were also positive on LFD
- 338 were negative on LFD
- 42 were negative on PCR. Of those 42:
- 21 were positive on LFD (discordant pairs)
- 21 were negative on LFD
- 677 of those were positive on PCR. Of those 677:
- 7,504 individuals without COVID, all of whom were negative on PCR and negative on LFD.
In scenario 2, the numbers reported by phase 4 remain unchanged:
- PCR prevalence of 677 / 8,223, or 8.2%
- 677 PCR positives, of which 339 were LFD positive – LFD sensitivity of 50.1%
- 7,546 PCR negatives, of which 21 were LFD positive – LFD specificity of 99.72% relative to PCR
However, in this scenario the correct interpretation would be that:
- the true prevalence is 719/8,223, or 8.7% (0.082/0.942)
- of the 719 cases, 360 were LFD positive – unchanged LFD sensitivity of 50.1%
- of the 7,504 non-cases, all were LFD negative – ‘true’ LFD specificity of 100%
- in the 21 cases where the PCR was negative but the LFD was positive, the LFD was correct due to the PCR sensitivity of 94.2%
Scenarios compatible with phase 4 findings
Scenarios 1 and 2 are the 2 extremes of possible interpretations of the results. The results found by phase 4 would also be consistent with a PCR clinical sensitivity ranging from 94.2% to 100% and an LFD specificity ranging from 100% to 99.72% (Table 7).
Table 7: possible scenarios for PCR clinical sensitivity
| PCR sensitivity | LFD specificity | LFD specificity relative to PCR |
|---|---|---|
| 100.0% | 99.72% | 99.72% |
| 99.5% | 99.74% | 99.72% |
| 99.0% | 99.77% | 99.72% |
| 98.5% | 99.79% | 99.72% |
| 98.0% | 99.81% | 99.72% |
| 97.5% | 99.84% | 99.72% |
| 97.0% | 99.86% | 99.72% |
| 96.5% | 99.88% | 99.72% |
| 96.0% | 99.91% | 99.72% |
| 95.5% | 99.93% | 99.72% |
| 95.0% | 99.96% | 99.72% |
| 94.5% | 99.98% | 99.72% |
| 94.2% | 100.00% | 99.72% |
The PPV of the first LFD test, and the NPV of the confirmatory PCR will vary depending on:
- our assumption of the sensitivity of PCR
- the underlying prevalence of the tested population
A range of estimates is presented in Tables 8 and 9.
Table 8: impact of PCR sensitivity assumptions and prevalence on the PPV of the LFD
| PCR sensitivity | LFD specificity | PPV of the LFD at 0.5% prevalence | PPV of the LFD at 1% prevalence | PPV of the LFD at 2% prevalence | PPV of the LFD at 5% prevalence |
|---|---|---|---|---|---|
| 100.0% | 99.72% | 47% | 65% | 79% | 90% |
| 99.5% | 99.74% | 50% | 66% | 80% | 91% |
| 99.0% | 99.77% | 52% | 68% | 81% | 92% |
| 98.5% | 99.79% | 54% | 71% | 83% | 93% |
| 98.0% | 99.81% | 57% | 73% | 85% | 93% |
| 97.5% | 99.84% | 61% | 76% | 86% | 94% |
| 97.0% | 99.86% | 64% | 78% | 88% | 95% |
| 96.5% | 99.88% | 68% | 81% | 90% | 96% |
| 96.0% | 99.91% | 73% | 85% | 92% | 97% |
| 95.5% | 99.93% | 79% | 88% | 94% | 98% |
| 95.0% | 99.96% | 86% | 92% | 96% | 98% |
| 94.5% | 99.98% | 94% | 97% | 98% | 99% |
| 94.2% | 100.00% | 100% | 100% | 100% | 100% |
Table 9: impact of PCR sensitivity assumptions and prevalence on the NPV of the PCR confirmatory test
| PCR sensitivity | LFD specificity | NPV of the PCR at 0.5% prevalence | NPV of the PCR at 1% prevalence | NPV of the PCR at 2% prevalence | NPV of the PCR at 5% prevalence |
|---|---|---|---|---|---|
| 100.0% | 99.72% | 100% | 100% | 100% | 100% |
| 99.5% | 99.74% | 100% | 99% | 98% | 95% |
| 99.0% | 99.77% | 99% | 98% | 96% | 90% |
| 98.5% | 99.79% | 98% | 97% | 93% | 84% |
| 98.0% | 99.81% | 97% | 95% | 90% | 78% |
| 97.5% | 99.84% | 96% | 93% | 86% | 71% |
| 97.0% | 99.86% | 95% | 90% | 82% | 64% |
| 96.5% | 99.88% | 93% | 87% | 76% | 56% |
| 96.0% | 99.91% | 90% | 82% | 69% | 46% |
| 95.5% | 99.93% | 86% | 75% | 59% | 36% |
| 95.0% | 99.96% | 77% | 62% | 45% | 24% |
| 94.5% | 99.98% | 55% | 38% | 23% | 10% |
| 94.2% | 100.00% | 0% | 0% | 0% | 0% |
The results for NPV on confirmatory PCR are conservative and the NPV is likely to be lower if the confirmatory PCR is, for example, done on the following day.
Furthermore, we analysed data from NHS Test and Trace ATSs using LFDs from 20 November 2020 to 27 January 2021; 1,700,972 LFDs were performed and 38,270 (2.2%) were reported as positive. Among positive LFD results, 25,779 (67%) were matched to a PCR test within the subsequent 5 days; 24,147 (93.7%) were reported as SARS-CoV-2 PCR positive, significantly higher than the predicted value of 87.2% expected from an LFD specificity of 99.72% (p<0.001).
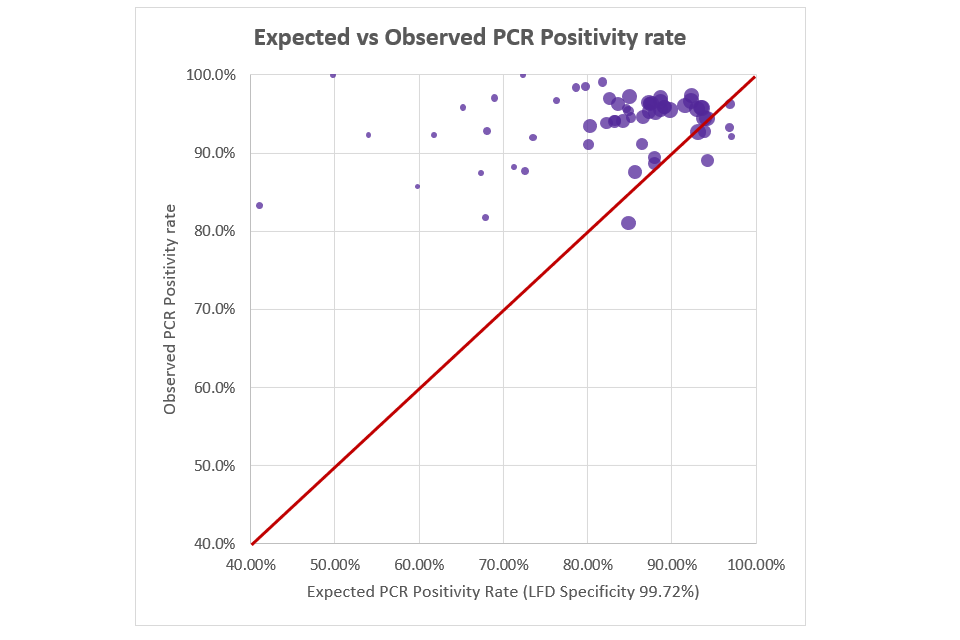
The observed PPV of the Innova LFD device (based on % of follow-up PCRs returning positive) was significantly higher than expected (i.e. if assuming 99.7% specificity). Figure 1 shows the expected PCR positivity rate against the observed PCR positivity rate, based on Community ATS data (up to 27 January 2021 when confirmatory PCR was suspended). Each data point/bubble represents one day with bubble size dependent on number of confirmatory PCRs that day (‘perfect fit’ would be bubbles aligning on the central red line).
Figure 1: expected vs observed PCR positivity rate (based on phase 4 data)
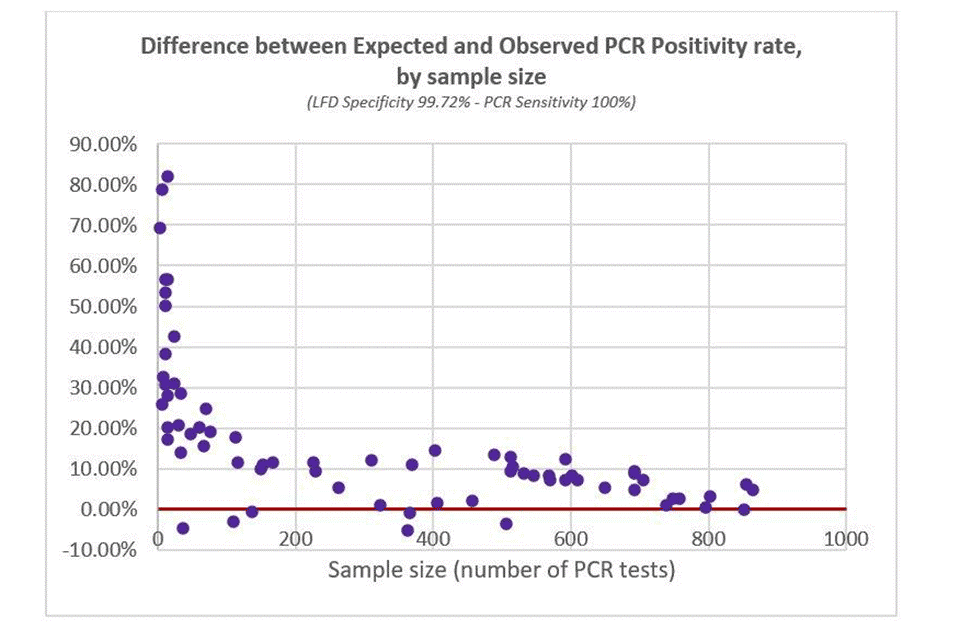
A different way to visualise this is to plot the difference between expected and observed PCR positivity rate (where perfect fit would be on the red 0% line, i.e. no difference between expected and observed values). As above, each data point is a day of testing, and the x-axis is PCR sample size on that day. Figure 2 shows Observed PCR Positivity being significantly higher than Expected PCR Positivity.
Figure 2: difference between expected and observed PCR positivity rate (based on 100% PCR sensitivity)
(LFD specificity 99.72% - PCR sensitivity 100%)
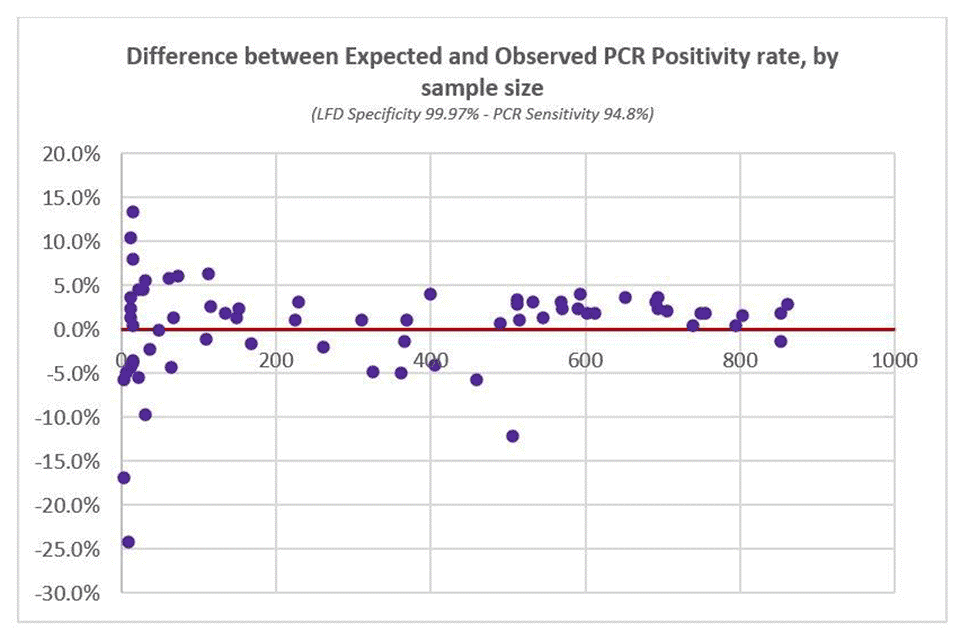
Expected PCR Positivity rates were then recalculated using different combinations of LFD specificity and PCR sensitivity (as per Table 7 above). The optimal fit to observed data (based on weighted least squares) was at LFD specificity of 99.97% and PCR sensitivity of 94.8%, as seen in Figure 3 below.
Figure 3: difference between expected and observed PCR positivity rate (based on optimal statistical fit)
(LFD specificity 99.97% - PCR sensitivity 94.8%)
The same optimal fit for LFD specificity (99.97%) was found when restricting the analyses to PCR tests taken within in a shorter time period (within one, two, three, or four days of the LFD test).
As noted above, 67% of positive LFD tests had a linked PCR test, 33% did not. Differences in disease status may exist between individuals who go on to get a PCR and those who do not. However, the PPV in individuals who go on to get a confirmatory PCR is key in evaluating the impact of a confirmatory PCR policy.
Analyses were repeated using data from the same time period in School/College testing where 999,353 LFDs were performed and 2,332 (0.23%) were reported as positive. Among positive LFD results, 1,948 (84%) were matched to a PCR test within the subsequent 5 days; 1,576 (80.9%) were reported as SARS-CoV-2 PCR positive. The optimal fit to observed data was at LFD specificity of 99.97% and PCR sensitivity of 94.4%.
Conclusion
These analyses support the policy of not requiring PCR confirmation of positive LFDs conducted at ATSs under current levels of population prevalence. The data will be kept under review and further post marketing surveillance analyses conducted at regular intervals.
-
Preliminary report from the joint PHE Porton Down and University of Oxford SARS-CoV-2 test development and validation cell: rapid evaluation of lateral flow viral antigen detection devices (LFDs) for mass community testing. ↩
-
False-negative results of initial RT-PCR assays for COVID-19: A systematic review. ↩