Kickstart Scheme: A Quantitative Impact Assessment
Published 7 October 2024

© Crown copyright 2024
This publication is licensed under the terms of the Open Government Licence v3.0 except where otherwise stated. To view this licence, visit nationalarchives.gov.uk/doc/open-government-licence/version/3 or write to the Information Policy Team, The National Archives, Kew, London TW9 4DU, or email: psi@nationalarchives.gov.uk.
Where we have identified any third party copyright information you will need to obtain permission from the copyright holders concerned.
This publication is available at https://www.gov.uk/government/publications/kickstart-scheme-a-quantitative-impact-assessment/kickstart-scheme-a-quantitative-impact-assessment
DWP research report no. RR 1053
Crown copyright 2024.
You may re-use this information (not including logos) free of charge in any format or medium, under the terms of the Open Government Licence. To view this licence, visit the National Archives.
or write to:
Information Policy Team
The National Archives
Kew
London
TW9 4DU
or email psi@nationalarchives.gov.uk
This document/publication is also available on GOV.UK
If you would like to know more about DWP research, email socialresearch@dwp.gov.uk
First published October 2024
ISBN 978-1-78659-675-8
Views expressed in this report are not necessarily those of the Department for Work and Pensions or any other government department.
Voluntary statement of compliance with the Code of Practice for Statistics
The Code of Practice for Statistics (the Code) is built around 3 main concepts, or pillars, trustworthiness, quality and value:
- trustworthiness – is about having confidence in the people and organisations that publish statistics
- quality – is about using data and methods that produce assured statistics
- value – is about publishing statistics that support society’s needs for information
The following explains how we have applied the pillars of the Code in a proportionate way.
Trustworthiness
- The analysis presented in this report has been scrutinised internally by DWP analysts, and externally peer-reviewed by labour market evaluation experts
- The detailed methodology, data sources and econometric approach taken in this research are set out in this report alongside the findings. The cohort-based, econometric methodology used builds on the methodology used in the previous labour market programme evaluations
Quality
- The process to produce the analysis in this report was conducted by professional analysts taking account of the latest administrative data and applying methods using their professional judgement. The analysis has been through a rigorous quality-assurance process by other DWP analysts and external peer review. The statistical methodology used in this report builds on the methodology used in previous labour market programme evaluations
- This research is part of the mixed method evaluation of Kickstart by the Department. In addition to this quantitative impact assessment, a separate process evaluation for Kickstart focussed on the qualitative impact of Kickstart on participants and employers. This evaluation was carried out by IFF on behalf of DWP, and in part looked at labour market outcomes for Kickstart participants using a representative sample. The findings in this report are consistent with the findings from the process evaluation
Value
- This research provides important new evidence for Ministers, policy makers and external stakeholders on the impacts of Kickstart
- This evaluation sits alongside the Kickstart process evaluation to provide a complete assessment of the performance of the Kickstart scheme
Executive summary
Background
This report presents an impact assessment and accompanying cost-benefit analysis of the Kickstart scheme, which ran from September 2020 to March 2022.
Kickstart was aimed at 16 to 24 year olds on Universal Credit (UC) at risk of long-term unemployment. Kickstart was launched during the first COVID-19 lockdown. Kickstart was designed to mitigate the long-term effects of unemployment by providing 25 hours a week of subsidised employment for six months. Public and private sector employers were invited to participate in Kickstart by providing specific roles within organisations open for Kickstart participants. In total, Kickstart provided 163,000 placements throughout its lifespan.
Methodology
The impact assessment looks at labour market outcomes for individuals who participated in Kickstart from March 2021 to January 2022. Outcomes are tracked up to two years to measure whether somebody was in work or claiming UC at that point. Outcomes from this group are compared to individuals who were eligible for Kickstart but did not start a placement. This average treatment effect approach allows us to measure the labour market impact of Kickstart directly.
Individuals in the two groups are matched together to account for differences in characteristics between the two groups to ensure a fair comparison. This technique accounts for some self-selection bias introduced by the voluntary nature of Kickstart. The methodology is well established and is considered a plausible means of estimating the impact of interventions of this type.
Labour market outcomes are extrapolated forwards to five years to look at the long run impacts of the scheme. These results are then used to produce a cost benefit analysis. This focusses on different perspectives where different groups value the costs and benefits of Kickstart differently, including a society perspective that combines all perspectives together. This analysis follows the DWP Social Cost-Benefit Analysis Framework (Fujiwara 2010)[footnote 1] methodology, in line with the methodology used in other departmental impact assessments.
Key Findings
- This report provides evidence that taking part in Kickstart reduces the time 19 to 24 year old UC claimants spend on benefit and increases the time they spend in employment.
- We estimate that for every 100 people who participated in Kickstart, an additional 11 of those are in unsubsidised employment at two years compared to a similar group of people who did not participate in Kickstart.
- We also estimate that an additional three people are not on UC at the two year point compared to a similar group of non-participants.
- This impact is consistent from eight months after the intervention start and persists up to two years. There is no evidence to suggest that this impact diminishes beyond this point.
- Kickstart has a positive impact on all subgroups examined in this report. Moreso, Kickstart appears to have a greater impact for those who have less success in the wider labour market, creating a levelling up effect.
- For the Exchequer, Kickstart makes a return of £0.27 for every pound spent at two years, and £0.49 at five years. This is due to the high unit cost of Kickstart, and the relatively narrow scope of benefits included in this perspective.
Kickstart makes a return of £1.18 for every pound spent when combining all perspectives at two years. At five years Kickstart makes a return of £3.15 for every pound spent.
The Author
Joseph Cann, Economic Analyst at the Department for Work and Pensions.
Acknowledgements
We would like to thank Professor Hamish Low from the University of Oxford and Dr Jim Riccio from the MDRC as part of the Methods Advisory Group[footnote 2] for their insight and guidance on this report.
We would also like to thank DWP colleagues for their help towards producing this report including:
Mark Griffiths, Genevieve Berwick, Emily Insanally, Jacob McDonald, Marguerite Adewoye, the DWP Employment Data Lab[footnote 3], Mike Daly, James Oswald, Richard Ward, Adam Robinson and Craig Lindsay.
Glossary
| Term | Definition |
|---|---|
| Average treatment effect on the treated | The average estimated impact of a policy intervention among the group who were affected by the intervention |
| Common support | The overlap in matched treatment and comparison group observations based on their propensity scores |
| Comparison group | The group of individuals who were not affected by the policy intervention |
| Conditionality | The conditions (for example work search activity) claimants must comply with in order to receive benefit payments |
| Difference in Differences | A statistical technique which estimates the impact of a programme accounting for latent differences in the treatment and comparison group before intervention |
| Intention to treat | Cohorts of individuals based on the date they met the programme eligibility criteria, regardless of whether they went on to be referred to the programme |
| Propensity score matching | A statistical technique in which individuals are identified as statistically similar to each other based on a set of characteristics |
| Regression | A statistical technique which estimates the extent to which changes in one or more variables are associated with changes in an outcome of interest |
| Searching For Work | The labour market regime in Universal Credit where claimants are expected to search for work and attend regular work search reviews with their work coach |
| Treatment group | The group of individuals affected by the policy intervention |
Abbreviations
| Abbreviation | Explanation |
|---|---|
| ATE | Average Treatment Effect |
| CI | Confidence Interval |
| CIA | Conditional Independence Assumption |
| CBA | Cost Benefit Analysis |
| CBR | Cost Benefit Ratio |
| DiD | Difference in Differences |
| DWP | Department for Work and Pensions |
| FJF | Future Jobs Funds |
| FSM | Free School Meals |
| HMRC | HM Revenue and Customs |
| IDACI | Income Deprivation Affecting Children Index |
| IS | Income Support |
| ITT | Intention to Treat |
| JSA | Job Seekers Allowance |
| LEO | Longitudinal Education Outcomes |
| NHS | National Health Service |
| NLW | National Living Wage |
| PSM | Propensity Score Matching |
| RDD | Regression Discontinuity Design |
| RTI | Real Time Information |
| SCBA | Social Cost Benefit Analysis |
| SEN | Special Educational Needs |
| UC | Universal Credit |
1. Introduction
1.1 Policy Background
The Kickstart scheme was at the heart of the Department for Work and Pension’s (DWP) “Plan for Jobs” package created in response to the Coronavirus pandemic.
The UK was facing unprecedented economic conditions, differing in its nature from past economic emergencies. Protecting public health meant closing many places of work, which significantly impacted the economy and labour market. In July 2020, the Government published the Plan for Jobs which contained measures aimed at getting people back into employment, keeping people in their jobs and creating new jobs. This included the introduction of the Kickstart scheme to support young people at risk of long-term unemployment.
As of September 2020, there were approximately 563,000 unemployed 16 to 24 year olds, 371,000 of whom were not in full time education. There were a further 2.67m 16 to 24 year olds who were economically inactive, including students.
Empirical evidence[footnote 4] shows that extended periods of unemployment early on in a person’s career is likely to cause scarring effects and increase the likelihood of further unemployment spells later in their careers. Implementing a scheme like Kickstart aimed to minimise the risk of scarring by providing real labour market experience, helping young people refresh and learn new skills, and stay closer to the labour market overall. Kickstart was also designed as a demand side intervention for the labour market to encourage employers to create new jobs for young people in economically unstable conditions.
The scheme was introduced in September 2020 with a total of £2bn in funding available to provide up to 250,000 grant funded jobs for young people. Each job consisted of a six month paid role, alongside training and support with an employer.
1.2 Aims and Scheme Design
The Kickstart scheme provided funding to create new jobs for 16 to 24 year olds on Universal Credit (UC) and at risk of long-term unemployment [footnote 5] – particularly those who were out of work or had low earnings and were expected to look for employment opportunities.
Employers of all sizes could apply for funding, which covered:
- 100% of the relevant National Living Wage (NLW) for 25 hours per week for up to six months
- Associated employer National Insurance contributions
- Employer minimum automatic enrolment pension contributions
- Up to £1,500 per position of additional funding to cover setup costs, training, and employability support
Employers could pay Kickstart employees a higher wage and for more hours, but the funding did not cover this. Placements were provided by private and public sector employers.
The jobs created with Kickstart funding were required to be new, additional jobs. This meant that they could not replace existing or planned vacancies, or cause existing employees, apprentices, or contractors to lose work or reduce their working hours. Jobs created needed to be a minimum of 25 hours a week, paid at least the NLW and only require basic training. It was possible for a young person to move to another employment scheme when they finished their six month Kickstart job.
The Kickstart scheme was initially planned to run between September 2020 and December 2021. In November 2021, it was announced that the scheme would be extended for a further three months, to March 2022. Employers could spread job start dates up until 31 March 2022. In total, 163,000 placements were started during this period.
The Kickstart scheme had four key objectives:
- To improve employability and chances of sustained employment of those at risk of long-term unemployment in the 16 to 24 year old age group
- To support the creation of jobs that might not otherwise exist
- Each placement should provide a quality experience
- To incentivise positive behaviours from placement holders, making them more attractive to future employers to reduce the scarring effect of unemployment
1.3 Purpose of the Analysis and Report Structure
The department has publicly committed to evaluating the impact of the scheme. The aims of evaluating the scheme are:
- Inform the design and delivery of the scheme
- Monitor progress in its implementation and performance
- Measure the outcomes for participants
- Quantify the impact of the scheme in terms of employment outcomes
- Quantify the costs, benefits and value for money in a way that can be compared with other labour market schemes
- Make an overall assessment of the effectiveness of the scheme in meeting its objectives
A process evaluation produced by IFF was published in July 2023[footnote 6], focussing on how Kickstart was experienced by participants; early outcomes for Kickstart participants; how the experience had contributed to longer term employment or career aspirations, and how experiences and outcomes differed for different groups.
This impact evaluation aims to build on the findings of the process evaluation, quantifying the impacts in terms of employment outcomes and assessing the costs, benefits and value for money of the scheme overall.
This analysis will use Propensity Score Matching (PSM) methodology to compare two similar groups of people, where the main difference is whether they participated in Kickstart. PSM has been used for various DWP labour market schemes, such as the Future Jobs Fund (FJF) and the Work Programme. This approach matches participants with non-participants based on their likelihood of going on the Kickstart scheme, where the likelihood is calculated based on a rich dataset of characteristics. This quasi-experimental methodology allows for matching people with similar characteristics and comparing average labour market outcomes to measure the impact of the scheme in isolation.
The plan for this report is as follows:
- Section 2 describes the analytical approach covering potential sources of bias, limitations and cohort selection, as well group selection
- Section 3 explains the impacts of the scheme and main sensitivity analyses
- Section 4 presents the cost benefit analysis of the Kickstart scheme
- Section 5 concludes the findings of the impact evaluation, making an overall assessment of the impact of the scheme in meeting its objectives
2. Methodology and Sample Selection
2.1 Propensity Score Matching
The primary aim of this evaluation is to assess the impact of the Kickstart scheme on moving individuals into non-subsidised employment over time. PSM has been chosen as it best suits the features of this scheme.
Kickstart is a voluntary scheme which creates a self-selection issue. Participation in the scheme may be influenced by personal factors that may affect overall outcomes. These demographics may be observable such as age or gender, but could also be factors that are not easy to measure, such as motivation and enthusiasm, making it more difficult to isolate and control for this bias. Statistical methods such as PSM allow us to estimate the impact of Kickstart in terms of the number of additional people who move into employment and off benefit, while minimising this selection bias.
The starting point for PSM is to define an overall sample containing both participants and non-participants in the intervention under consideration. Once the sample has been defined, PSM is carried out as follows:
- Data on the characteristics of individuals in the sample are used as the input to a logistic regression model, using a logit approach, to estimate the probability of each individual participating in the scheme. This probability is also known as an individual’s ‘propensity score’
- The propensity scores are then used to match participants to individuals in the comparison group with a similar likelihood of participating in the intervention. Here, the matching approach used was single nearest neighbour with replacement, meaning one non-participant could be matched to multiple participants
The logic of this is that by assigning reliable propensity scores, and then assessing people with similar scores across the treatment and comparison group, the groups should have similar characteristics overall, in terms of how likely they are to be treated. The only difference is the actual treatment effect itself. This methodology allows us to compare similar people across different groups and isolate the treatment effect to calculate it. PSM is commonly used for labour market programme evaluations, particularly voluntary ones such as Kickstart.
Other options were considered, such as a randomised control trial, however this methodology did not fit well with the policy intent of Kickstart. The scheme was not designed to randomly allocate eligible individuals to the treatment/comparison groups, it was designed to avoid the scarring effects of long-term unemployment for as many eligible young people as possible. An areas based approach was also not possible, as Kickstart was available across Great Britain at the same time. Finally, a regression discontinuity design (RDD) was considered, but as this required a specific cut off during the scheme to compare groups and outcomes before and after this cut off. Kickstart does not have a cut off, so an RDD was not possible for this evaluation.
2.2 Conditional Independence Assumption
For PSM to give an unbiased estimate of the treatment effect, there must be sufficiently rich data to ensure that the conditional independence assumption (CIA) is met. This states that the outcome must be independent of treatment assignment. This means that there are no differences between the matched treatment and matched comparison group which would affect outcomes. Therefore, if Kickstart hadn’t existed, both the treatment and comparison groups would have had the same outcomes, as there would have been no treatment effect.
2.3 Data Sources
Data for Kickstart participants was collected throughout the scheme, giving a detailed timeline of when somebody was referred, started, and completed a placement. A wider set of characteristics has been collected using DWP administrative datasets, particularly from UC datasets and the National Benefit Database for legacy benefits. These datasets are also used to collate benefit history variables used in the matching.
Data on earnings comes from the Real Time Information (RTI) data feed provided by HMRC. DWP receives a regular feed of RTI payslip data specifically for employment impact evaluations of UC claimants. The data covers individuals who have claimed UC, JSA or Income Support (IS) at any point from the beginning of 2014. A crucial design feature of this feed is that data continues to be received even after individuals have left the benefits system. This enables us to track the employment outcomes of UC, JSA and IS claimants for as long as is necessary to assess the employment impact of UC.
In England, data on education outcomes was derived from the Longitudinal Education Outcomes (LEO) dataset. This is made up of three datasets:
- National Pupil Database – covers data on schools, education results below degree level, and education identifiers such as free school meals (FSM) and special educational needs (SEN)
- Individual Learner Record – covers data on skills training through further education providers
- Higher Education Skills Agency – covers data on higher education qualifications
Data on educational outcomes for Kickstart participants is crucial for accurate propensity score matching and therefore high-quality results. This data has only been collected on those who were educated in England. This means that most people living in Scotland and Wales will not be covered by this data, as well as those educated abroad. The influence of this data is very strong and removing it to widen the sample size would lower the quality of the results in this evaluation, so the main set of results is limited only to those who have LEO data.
The data covers those educated from 2001/02 to 2022/23. This data will slightly underreport history on key characteristics such as FSM and SEN, as records are only included when they are 14 or above, as part of the data sharing agreement for this data. Therefore, if somebody was classed as SEN under the age of 14, but not above, then they would not be counted as SEN. We also use other variables for tracking deprivation such as the Income Deprivation Affecting Children Index (IDACI), which can act as an alternative to FSM to mitigate the impact.
2.4 Treatment Group Selection
The aim of the Kickstart impact evaluation is to compare the outcomes of those participating in the scheme, with what their outcomes would have been had they not participated – the “counterfactual” outcomes. The treatment group is made up initially of those who started the scheme. Table 2.1 shows that our initial sample is made up of 163,000 placements started, equivalent to 150,400 individuals. For those who started more than one placement, we have taken their first placement to track against the comparison group - 150,400 starts and individuals. This is to get the most comparable employment journey compared to the comparison group that did not start a Kickstart placement. This will most likely bias results downwards initially, as most initial placements that were repeated ended very early. On the other hand, subsequent placements were generally more successful, so it is likely that most people who took multiple placements would have had better employment outcomes in future months, pushing the results upwards in months after placement start. However, given the number of individuals starting multiple placements is relatively small, the impact is likely to be small.
For PSM to work effectively there must be no missing data that adds explanatory power to the propensity scores. Therefore, data cleaning is done to remove missing values. This is primarily from ethnicity variables, which are taken from voluntary data provided by UC claimants and does not have a 100% completion rate. Additionally, the dataset is limited to those who are in the Searching for Work group at their start date. A small number of individuals are counted as being in lighter touch conditionality groups. Whilst these claimants were eligible for the scheme, this was not the primary group Kickstart was aimed at, so these individuals have been removed.
Table 2.1: Treatment group sample selection
| Restriction | No. placements started | No. individuals |
|---|---|---|
| Initial sample | 163,000 | 150,400 |
| Keep only initial starts | 150,400 | 150,400 |
| Remove cases with missing values and limit to Searching for Work conditionality | 117,300 | 117,300 |
| England only | 94,600 | 94,600 |
| One year of benefit history (19+ only) | 85,400 | 85,400 |
| March 2021 onwards | 83,400 | 83,400 |
The group is limited to those in England only due to data limitations. Education data from the LEO dataset is only available widely in England, and the methodology requires that consistent data is used throughout both the treatment and comparison group. As discussed above, LEO data is very important for the methodology, as education is a strong indicator of labour market performance, so excluding this data compromises the quality of the results considerably. Some education data is available for Wales and Scotland, but the coverage is not as complete as in England, so these groups have been excluded in the core results. Sensitivity analysis will include versions of the results that relax these assumptions to assess the strength of the core results, including GB level results.
The group was also limited to those 19 or older, as one year of benefit and employment history was required to have a suitably deep pool of characteristics. As such, we have excluded 16 to 18 year olds from the treatment and comparison groups. The sensitivity analysis will assess the impact of removing 19 year olds, and using two year of benefit history.
Finally, individuals who started Kickstart prior to March 2021 have been removed from the treatment group. For the comparison group those with pseudo start dates prior to March 2021 have been removed for consistency. Pseudo dates are covered in more detail in Section 2.7. During the Autumn and Winter of 2020, COVID restrictions meant that access to location based placements varied across the country at different times. It is likely that these interruptions will have affected the quality/experience of placements, and therefore are not as comparable as later placements to get the intended treatment effect. These early cohorts are relatively small so the impact on sample size is small. The sensitivity analysis will assess the impact of excluding these early cohorts.
2.5 Comparison Group Selection
2.5.1 Self-Selection Issue
The key question when constructing the comparison group is whether there is a self-selection issue for treatment. If employers recruited participants who had non-observable characteristics that allowed them to perform better in the placement, this could bias the results upwards. The treatment group would have better characteristics (and therefore outcomes) than expected. Given these are non-observable traits such as motivation, this is challenging to control for in the methodology.
For those who were referred to Kickstart but did not start a placement, it cannot be determined from the data available whether this group were rejected from roles, found alternative employment, or if they simply did not apply for a role. As a result, it is difficult to establish how large any self-selection bias is for this group.
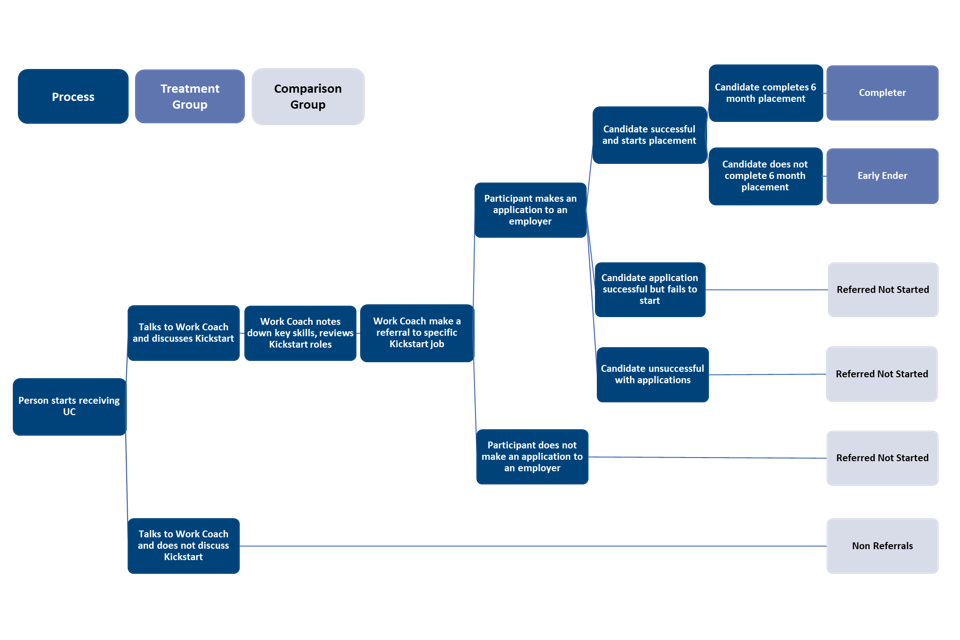
Chart 2.1 shows how participants were referred to Kickstart. Identifying young people who were suitable for Kickstart was based on Work Coach discretion. Internal guidance was provided to identify those who were both vulnerable to long-term unemployment and relatively close to the labour market. Participants were usually recommended a job by their Work Coach, but from Summer 2021 they could search independently from available Kickstart jobs. However, the majority of participants went into a role recommended by their Work Coach.
Qualitative evidence from the Process Evaluation[footnote 7] found that in general young people found the referral process easy to navigate. The majority of employers were able to fill vacancies. The main barrier to filling vacancies was a lack of candidates, implying that there may not be a large employer selection issue. However, employers strongly identified that attitude was a key factor in whether someone was hired or not. To control for this, we have included extensive data on employment history, which acts as a proxy. Academic studies have found that employment history correlates strongly with unobserved but relevant characteristics such as personality traits and motivation (Caliendo, et al., 2014)[footnote 8].
Chart 2.1: Referral process and group allocation for Kickstart
As a final measure to mitigate the potential self-selection issue, a difference in differences analysis (DiD) is conducted. This looks at how the difference in outcomes and characteristics changes over time. For example, if after matching the treatment group has consistently lower outcomes compared to the comparison group before starting Kickstart, it is possible that non-observable characteristics are causing this and therefore may be lowering outcomes post intervention. DiD accounts for these differences pre start and adjusts outcomes post start accordingly. In the case of Kickstart, the results are very robust with small standard errors, so the impact of this extra step is small (<1ppt), but this methodology ensures that as much of the selection bias is accounted for as possible.
2.5.2 Comparison Group
The comparison group is based on two subgroups. The first are those who were referred to Kickstart but did not start a placement. This is referred to as the “referred not started” group from this point in the report onwards. The second group are 16 to 24 UC claimants at risk of long-term unemployment who did not participate in Kickstart at all, so they neither started nor were referred to the scheme. This group is referred to as “non-referrals” from this point in the report onwards.
The quality of matching from PSM relies on having a large sample size and a wide set of variables to match between the treatment and comparison group. Including referred not started along with claimants who were not referred to Kickstart doubles the sample size of the comparison group. This means that once propensity scores are calculated, there are more individuals in the comparison group with similar propensity scores for the treatment group to match to. As well as using extensive employment and education history, a wide set of characteristic variables is used to control for the selection process. This approach is similar to previous DWP evaluations of employment schemes such as [footnote 9]. These mitigations should sufficiently control for any selection bias from the application process.
The non-referrals group were eligible for Kickstart, so should be a close comparator group to those who participated in Kickstart in terms of characteristics. Roughly one third of people eligible for Kickstart were referred to the scheme, leaving a sizeable group who were not referred and thus suitable for a comparison group, based on observable characteristics.
Other comparison groups were considered, such as using 25 to 29 year old UC Searching for Work claimants from this period. However, the characteristics of this group less closely resemble the treatment group, particularly around employment history, which is an important proxy for intangible behavioural characteristics we cannot observe. There were also differences in the core JCP offer at the time for 25 to 29 year olds compared to younger claimants.
Sensitivity analysis will assess the impact of not including non-referrals in the comparison group.
2.6 ITT vs ATE Approach
As stated above, the comparison group includes individuals who were referred to Kickstart but did not start a placement. We are using an average treatment effect (ATE) measure as opposed to an intention to treat (ITT) because our treatment group is made up only of those that receive the treatment effect, by starting a Kickstart placement.
An ITT approach includes those who were referred but did not start a placement in the treatment group. It examines the difference in outcomes between those who were intended to be treated – in other words all those who were referred, but not necessarily all that started a placement – and those that did not intend to be treated (non-referrals). As discussed above, the risk of self-selection by including referred not started in the comparison group appears to be limited, so an ATE approach has been chosen. This allows us to measure the actual treatment effect for those who were treated, compared to a similar group who did not receive the treatment. From a policy design perspective, using an ATE approach allows the department to understand the actual impact Kickstart had on participants, as opposed to the ‘intended’ impact Kickstart would have if using an ITT approach. This knowledge can help the department to inform future employment schemes similar to Kickstart based on the evidence from this evaluation.
2.7 Pseudo Start Dates
To compare treatment and comparison groups consistently, pseudo start dates have been created for the comparison group. The purpose of pseudo start dates is to create similar labour market journeys prior to Kickstart for the comparison group that did not start a placement. The pseudo start dates are created by analysing the distribution of benefit start dates (UC declaration dates) for the treatment group, looking at the cross tabulation of benefit and treatment start dates, and matching these cross tabulations. For example, if everyone who went on Kickstart started on benefit exactly 12 months before, then this method would automatically allocate pseudo start dates to everyone in the comparison group 12 months after they started receiving benefit.
2.8 Descriptive Statistics
2.8.1 Demographics
Table 2.2 below shows a summary of demographic flags for our baseline treatment and comparison groups at their respective start dates. Given the comparison group is made up of both referred not started and non-referrals, the descriptive statistics are split by the two subgroups. Starts represent the treatment group, and the comparison group is based on a weighted average of referred not started and non-referrals. These statistics only include individuals once data cleaning has occurred to give a more representative picture of what treatment and comparison group look like.
Table 2.2: Demographic statistics for unmatched groups
| Statistic | Starts | Referred Not Started | Non-referrals |
|---|---|---|---|
| N | 117,920 | 230,450 | 329,040 |
| % White | 72% | 72% | 80% |
| % Male | 56% | 60% | 45% |
| % London Based | 20% | 18% | 12% |
| Mean Age | 21 | 21 | 21 |
| % Single No Children | 94% | 94% | 68% |
| % Receiving UC Housing Element | 16% | 16% | 36% |
| % Receiving UC Children Element | 4% | 4% | 29% |
| % Receiving UC Disabled Child Element | 0% | 0% | 2% |
| % Receiving UC Carer Element | 0% | 0% | 8% |
| % Receiving UC Limited Capability for Work | 1% | 3% | 10% |
| % Never Been Sanctioned | 77% | 62% | 79% |
The treatment group on average were less likely to be white than the comparison group. This may partly be due to the location of Kickstart placements, which were located mainly in larger employment hubs such as London. London has a higher ethnic minority population, so these dynamics may be driving ethnicity statistics. Those not referred to Kickstart were more likely to vary in family type. The vast majority of those referred to Kickstart were single with no dependants, and usually only receiving the UC Standard Allowance, with no additional elements. Non-referrals were also much more likely to be claiming UC Health entitlements compared to those referred to Kickstart. Kickstart was not designed explicitly for this group. Those with health related employment barriers may not have been looking or ready for work to the same extent as other groups while Kickstart was live. The overall trend based on these results is that Kickstart participants usually had fewer barriers to employment than the comparison group. This was by design as Kickstart was intended to support those who were at risk of long-term unemployment if no intervention was made. Other support, such as Youth Hubs and Youth Employment Coaches, were available to young people with more barriers to employment.
2.8.2 Education Markers
Tables 2.3 and 2.4 shows the breakdown for education markers for each of the three groups. As education is an influential variable in estimating the labour market outcomes, these markers give an insight into how likely on average each group will perform in the labour market and Kickstart.
Table 2.3: Individual education statistics[footnote 10] for unmatched groups
| Statistic | Starts | Referred Not Started | Non-Referrals |
|---|---|---|---|
| Number of individuals | 117,920 | 230,450 | 329,040 |
| % Free School Meals | 25% | 29% | 33% |
| % Special Education Needs | 26% | 30% | 39% |
| % Achieved Level 2 in English & Maths[footnote 11] | 54% | 46% | 33% |
| % w/ Level 2 highest qualification | 29% | 36% | 35% |
| % w/ Level 3 highest qualification | 29% | 25% | 18% |
| % w/ Level 6 highest qualification | 16% | 8% | 3% |
Table 2.4: Wider education statistics for unmatched groups
| Statistic | Starts | Referred Not Started | Non-Referrals |
|---|---|---|---|
| Number of individuals | 117,920 | 230,450 | 329,040 |
| % Children in Need[footnote 12] | 8% | 13% | 21% |
| % Absence rate 15%+ in an academic year[footnote 13] | 17% | 24% | 33% |
| % Excluded in an academic year | 11% | 19% | 19% |
| % IDACI score >0.5[footnote 14] | 7% | 7% | 7% |
Education outcomes vary by group. The overall trend is that the treatment group is generally better educated than the comparison group. A significantly higher proportion have achieved a degree or A Level equivalent qualification and are also more likely to achieve an A*-C (9-4) or equivalent grade in both English and Maths. Additionally, the treatment group are less likely to be classed as SEN or qualify for FSM from age 14 and above and have a better attendance/disciplinary record.
The treatment group are less like to qualify as Children in Need from 14 and above. This means that they are less likely to have had interactions with the children’s social care sector. Finally, IDACI scores of more than 0.5 – meaning that more than 50% of children living in the same area are in income deprivation – are similar across all groups. For lower IDACI scores, the trend is also similar.
2.8.3 Benefit and Employment History
Charts 2.2 and 2.3 show the benefit and employment history of our primary groups in the 24 months up to placement start.
Chart 2.2: Proportion in employment x months before start

| Month | Starts | Referred Not Started | Non Referrals |
|---|---|---|---|
| -24 | 27% | 26% | 19% |
| -23 | 27% | 26% | 19% |
| -22 | 28% | 26% | 19% |
| -21 | 28% | 27% | 19% |
| -20 | 28% | 27% | 19% |
| -19 | 27% | 26% | 18% |
| -18 | 26% | 26% | 18% |
| -17 | 26% | 26% | 17% |
| -16 | 25% | 26% | 17% |
| -15 | 25% | 25% | 16% |
| -14 | 24% | 24% | 15% |
| -13 | 23% | 23% | 15% |
| -12 | 22% | 22% | 14% |
| -11 | 22% | 22% | 14% |
| -10 | 21% | 21% | 13% |
| -9 | 21% | 21% | 13% |
| -8 | 21% | 21% | 13% |
| -7 | 22% | 21% | 12% |
| -6 | 22% | 21% | 12% |
| -5 | 21% | 21% | 12% |
| -4 | 20% | 20% | 11% |
| -3 | 17% | 17% | 10% |
| -2 | 13% | 14% | 8% |
| -1 | 8% | 10% | 5% |
Those who interacted with Kickstart were more likely to have recent employment experience compared to non-referrals. This is based on individual receiving earnings according to RTI records. This partly reflects the design of Kickstart, which was aimed at those who were closer to the labour market with fewer barriers. These characteristics mean that this group most likely were out of work in recent months. Those not referred to Kickstart may have had further barriers to the labour market that made the scheme unsuitable, despite being eligible based on benefit requirements.
Chart 2.3: Proportion on UC x months before start

| Month | Starts | Referred Not Started | Non Referrals |
|---|---|---|---|
| -24 | 18% | 20% | 34% |
| -23 | 19% | 21% | 36% |
| -22 | 20% | 22% | 37% |
| -21 | 21% | 24% | 39% |
| -20 | 23% | 25% | 40% |
| -19 | 24% | 27% | 42% |
| -18 | 26% | 28% | 43% |
| -17 | 28% | 30% | 45% |
| -16 | 30% | 32% | 47% |
| -15 | 32% | 34% | 49% |
| -14 | 35% | 37% | 51% |
| -13 | 37% | 40% | 54% |
| -12 | 40% | 43% | 57% |
| -11 | 43% | 47% | 59% |
| -10 | 46% | 50% | 61% |
| -9 | 49% | 53% | 63% |
| -8 | 52% | 56% | 65% |
| -7 | 55% | 60% | 67% |
| -6 | 58% | 63% | 69% |
| -5 | 62% | 67% | 71% |
| -4 | 67% | 72% | 74% |
| -3 | 73% | 78% | 78% |
| -2 | 83% | 86% | 83% |
| -1 | 95% | 96% | 90% |
As with employment history, those who interacted with Kickstart were also less likely to have claimed benefits in the months prior to starting Kickstart. The proportion on benefit increases over time because individuals were required to be claiming UC or legacy equivalents to be eligible, and this happened gradually over the previous 24 months to start date.
2.9 Contextual Analysis
2.9.1 Kickstart Journeys
This section looks to contextualise the analysis going forward, looking at how people progressed through Kickstart. The tables below look at the number of months between UC claim start to Kickstart referral, and the number of weeks between referral to start. Most people who went on Kickstart joined UC during the pandemic, and the distribution in table 2.5 reflects this. 29% of starts were from long-term unemployed claimants who had been claiming UC for over 12 months. Some participants were referred to Kickstart very shortly after starting a UC claim. Referrals were based on Work Coach discretion, so if a Work Coach deemed that somebody eligible was at risk of long-term unemployment based on their labour market experience, skills or labour market conditions, they could be referred to Kickstart even at this stage. Later cohorts generally had longer gaps between UC declaration and referral, as the majority of participants started their UC claim at a similar time in Spring 2020.
Once referred to Kickstart, individuals applied for roles with employers. This period of selection took different forms such as jobs fairs or interviews. Most employers were quick to take on people suitable for the role as reflected in table 2.6.
Table 2.5: No. months between UC declaration date and Kickstart referral date
| No. Months | Starts | Referred Not Started |
|---|---|---|
| 0 | 14% | 12% |
| 1-3 | 24% | 22% |
| 4-6 | 13% | 14% |
| 6-9 | 10% | 11% |
| 10-12 | 9% | 10% |
| 13-18 | 13% | 14% |
| 19-24 | 7% | 8% |
| 25+ | 9% | 10% |
| Mean | 9 months | 10 months |
| Median | 6 months | 7 months |
Table 2.6: No. weeks between Kickstart referral date and start date
| No. Weeks | % |
|---|---|
| 0 | 9% |
| 1 | 17% |
| 2 | 17% |
| 3 | 14% |
| 4 | 11% |
| 5 | 9% |
| 6 | 6% |
| 7 | 5% |
| 8 | 3% |
| 9 | 2% |
| 10+ | 7% |
Most people had more than one referral, reflective of typical job search activity. Those who started a placement typically had more referrals than those who didn’t. The average number of referrals for those that started was 9, as opposed to 7 for those that didn’t. Two thirds of those who started Kickstart completed the scheme entirely. Of those that didn’t, the distribution is relatively even, shown in Chart 2.4. This suggests that there are a variety of reasons why participants left the scheme early, including securing an alternative job, so they have not been excluded from the treatment group.
Table 2.7: No. referrals by start/referred not started
| No. Referrals | Starts | Referred Not Started |
|---|---|---|
| 1 | 13% | 18% |
| 2 | 10% | 13% |
| 3 | 9% | 11% |
| 4 | 8% | 9% |
| 5 | 7% | 7% |
| 6-10 | 24% | 21% |
| 11-15 | 12% | 10% |
| 16-20 | 7% | 5% |
| 21-25 | 4% | 3% |
| 26+ | 6% | 4% |
Chart 2.4: No. weeks on Kickstart for those who did not complete

| Kickstart duration (weeks) | Proportion of all individuals that start |
|---|---|
| 0 | 0.79% |
| 1 | 1.26% |
| 2 | 1.16% |
| 3 | 1.16% |
| 4 | 1.12% |
| 5 | 1.19% |
| 6 | 1.35% |
| 7 | 1.20% |
| 8 | 1.09% |
| 9 | 0.97% |
| 10 | 1.46% |
| 11 | 1.46% |
| 12 | 1.19% |
| 13 | 1.06% |
| 14 | 1.11% |
| 15 | 1.42% |
| 16 | 1.11% |
| 17 | 0.95% |
| 18 | 0.88% |
| 19 | 1.42% |
| 20 | 0.99% |
| 21 | 0.92% |
| 22 | 0.82% |
| 23 | 1.26% |
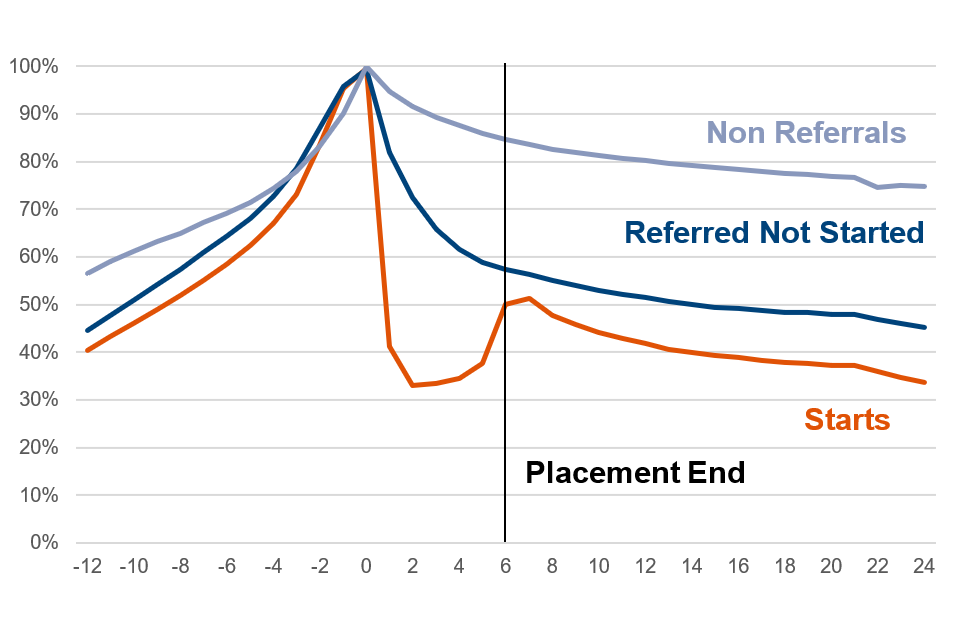
| 24 | 0.99% |
| 25 | 0.95% |
2.9.2 Labour Market Outcomes
It is also important to look at overall labour market outcomes for different groups before PSM is applied. This helps give a baseline estimate of the impact of Kickstart before controls are made for different traits and characteristics.
Charts 2.5 and 2.6 below show aggregated outcomes looking at the proportion of those in employment or in benefit receipt over time, and then wider performance beyond the scheme. As discussed in section 2.8.3, employment outcomes are defined by whether someone is in receipt of earnings in a given month. The outcomes are tracked based on month 0 being the start month or pseudo start month. In the methodology, the sample has been limited to those in Searching for Work at month 0. Given the granularity of the data, it is possible that somebody can be in work, move out of work and start a Kickstart placement all in one month, so the proportion in employment may not reach 0% at month 0. Benefit receipt is used to define benefit outcomes, and given that it was a requirement to be claiming UC when starting a Kickstart placement, outcomes do reach 100% at month 0 for all groups.
There is a clear performance difference for those that participate in Kickstart. They are more likely to be in employment and less likely to receive benefits as time goes on. The performance difference between those that start and the comparison group is much higher in the first six months, as this is the subsidised employment period of Kickstart. This group moves into employment because of the scheme, so only those that drop out early would not be in employment during this time. As a result, most of the difference between groups during the first six months is artificial due to the Kickstart intervention. Once the scheme ends at month 6, there is a decrease in the proportion earning as some participants move back on to benefit. Similarly, whilst they are on the scheme, they move off receipt of benefit by design of the scheme, leading to an artificial drop in the proportion receiving benefit. They are still nominally on the UC caseload, but the majority do not receive benefit payments during their Kickstart placement. Once the scheme ends, there is a temporary rise in the proportion in receipt of benefit followed by a sustained fall.
Referred not started appear to perform better than non-referrals. This may be due to differences in characteristics between each group, with referrals more likely to be closer to the labour market than the wider non-referrals groups. This again reflects the design and intention of Kickstart, helping to stave off the impacts of long-term unemployment by providing support to those who were closer to the labour market. The main aim of Kickstart was not to provide significant employment support to those who had more barriers to employment.
Chart 2.5: Proportion in employment over time by group
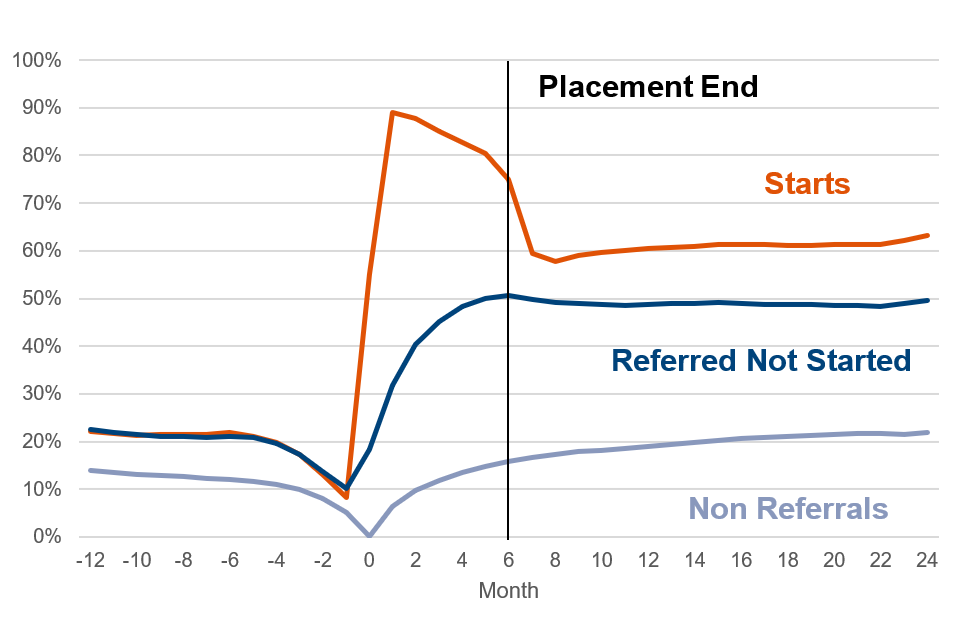
| -12 | -11 | -10 | -9 | -8 | -7 | -6 | -5 | -4 | -3 | -2 | -1 | 0 | 1 | 2 | 3 | 4 | 5 | 6 | 7 | 8 | 9 | 10 | 11 | 12 | 13 | 14 | 15 | 16 | 17 | 18 | 19 | 20 | 21 | 22 | 23 | 24 | |
| Starts | 22% | 22% | 21% | 21% | 21% | 22% | 22% | 21% | 20% | 17% | 13% | 8% | 55% | 89% | 88% | 85% | 83% | 80% | 75% | 59% | 58% | 59% | 60% | 60% | 60% | 61% | 61% | 61% | 61% | 61% | 61% | 61% | 61% | 61% | 61% | 62% | 63% |
|---|---|---|---|---|---|---|---|---|---|---|---|---|---|---|---|---|---|---|---|---|---|---|---|---|---|---|---|---|---|---|---|---|---|---|---|---|---|
| Referred Not Started | 23% | 22% | 21% | 21% | 21% | 21% | 21% | 21% | 20% | 17% | 14% | 10% | 18% | 32% | 40% | 45% | 48% | 50% | 51% | 50% | 49% | 49% | 49% | 49% | 49% | 49% | 49% | 49% | 49% | 49% | 49% | 49% | 49% | 48% | 48% | 49% | 50% |
| Non Referrals | 14% | 14% | 13% | 13% | 13% | 12% | 12% | 12% | 11% | 10% | 8% | 5% | 0% | 6% | 10% | 12% | 14% | 15% | 16% | 17% | 17% | 18% | 18% | 19% | 19% | 19% | 20% | 20% | 21% | 21% | 21% | 21% | 21% | 22% | 22% | 21% | 22% |
Chart 2.6: Proportion on UC over time by group
| -12 | -11 | -10 | -9 | -8 | -7 | -6 | -5 | -4 | -3 | -2 | -1 | 0 | 1 | 2 | 3 | 4 | 5 | 6 | 7 | 8 | 9 | 10 | 11 | 12 | 13 | 14 | 15 | 16 | 17 | 18 | 19 | 20 | 21 | 22 | 23 | 24 | |
| Starts | 40% | 43% | 46% | 49% | 52% | 55% | 58% | 62% | 67% | 73% | 83% | 95% | 100% | 41% | 33% | 33% | 34% | 38% | 50% | 51% | 48% | 46% | 44% | 43% | 42% | 41% | 40% | 39% | 39% | 38% | 38% | 38% | 37% | 37% | 36% | 35% | 34% |
|---|---|---|---|---|---|---|---|---|---|---|---|---|---|---|---|---|---|---|---|---|---|---|---|---|---|---|---|---|---|---|---|---|---|---|---|---|---|
| Referred Not Started | 45% | 48% | 51% | 54% | 57% | 61% | 64% | 68% | 73% | 79% | 87% | 96% | 99% | 82% | 72% | 66% | 62% | 59% | 57% | 56% | 55% | 54% | 53% | 52% | 51% | 51% | 50% | 49% | 49% | 49% | 48% | 48% | 48% | 48% | 47% | 46% | 45% |
| Non Referrals | 57% | 59% | 61% | 63% | 65% | 67% | 69% | 71% | 74% | 78% | 83% | 90% | 100% | 95% | 92% | 89% | 87% | 86% | 85% | 83% | 83% | 82% | 81% | 81% | 80% | 80% | 79% | 79% | 78% | 78% | 78% | 77% | 77% | 77% | 74% | 75% | 75% |
2.10 Matching Quality
2.10.1 Common Support
The success of PSM relies on the matching quality between participants in the treatment group and non-participants in the comparison group. Therefore, the spread of propensity scores between these two groups needs to be similar to find enough people with close propensity scores to match together. The chart below confirms this is the case, and this should improve the accuracy of the results, with a balanced sample once the matching is complete.
Chart 2.7: Cumulative Distribution of Propensity Scores by group

On average, Kickstart participants (n=70,117) have higher propensity scores than non-participants (n=192,520). Those who participated should possess more characteristics linked to participation than those who didn’t. The average propensity scores for participants and non-participants are 0.34 and 0.23 respectively. There are no individuals who are ‘off support’ due to having a propensity score outside of the 0.01 matching range, showing that the range of propensity scores is extremely well balanced.
2.10.2 Impact of Matching
Tables 2.8 to 2.10 below shows the results from matching non-participants to participants based on the distribution of propensity scores. The aim is to select unmatched participants and match them to treated individuals with propensity scores. After matching is complete, both the treatment and comparison groups should have similar characteristics. As there are a wide range of characteristic variables used in the matching, only a select few are shown to give an indication of the impact.
The results show the matching is very effective. Almost all variables see a large reduction in the percentage difference. Untreated individuals who are matched with the treatment group have on average more similar characteristics to the treatment group than unmatched individuals. Comparing these matched individuals with more similar characteristics will produce results that are more credible, because the main difference between the two groups will be the treatment effect, rather than other characteristics. Finally, the Rubin’s B and Rubin’s R are 4.21 and 1.02 respectively, well within the range for a balanced sample[footnote 15].
One exception to this is benefit history. Post match, the percentage difference increases meaning that the matched groups are more different in terms of their benefit history than when unmatched. However, the percentage bias is very low in both cases, so the impact is very low despite the high proportional change. Charts 2.8 and 2.9 demonstrate that the unmatched trends are already extremely similar between the treatment and comparison group, so once the matching is done the change is very small. Despite the two groups having significantly different employment histories, the values are still extremely similar, and the high t values are because of very small standard errors as opposed to large differences in mean values, so this is not a concern.
Table 2.8: Balancing Statistics for Unmatched and Matched Samples – Demographics
| Variable | Sample | Treatment | Comparison | % Diff | Reduction | t | p | |
|---|---|---|---|---|---|---|---|---|
| Cohort Start Date | Unmatched | 11.94 | 11.25 | 23.55 | ||||
| Cohort Start Date | Matched | 11.94 | 11.98 | -1.20 | 95% | -2.23 | 0.03 | |
| % White Ethnicity | Unmatched | 0.70 | 0.73 | -7.48 | ||||
| % White Ethnicity | Matched | 0.70 | 0.70 | -0.19 | 97% | -0.35 | 0.72 | |
| % Male | Unmatched | 0.56 | 0.61 | -9.22 | ||||
| % Male | Matched | 0.56 | 0.56 | 0.99 | 89% | 1.84 | 0.07 | |
| % London | Unmatched | 0.22 | 0.18 | 10.38 | ||||
| % London | Matched | 0.22 | 0.22 | -0.12 | 99% | -0.21 | 0.83 | |
| Age | Unmatched | 21.57 | 21.49 | 4.46 | ||||
| Age | Matched | 21.57 | 21.60 | -2.11 | 53% | -3.98 | 0.00 | |
| % Single No Children | Unmatched | 0.94 | 0.91 | 11.19 | ||||
| % Single No Children | Matched | 0.94 | 0.94 | 1.10 | 90% | 2.26 | 0.02 | |
| % Disabled | Unmatched | 0.01 | 0.07 | -32.80 | ||||
| % Disabled | Matched | 0.01 | 0.01 | -0.30 | 99% | -1.21 | 0.22 | |
| % w/ Zero Sanctions | Unmatched | 0.79 | 0.64 | 33.41 | ||||
| % w/ Zero Sanctions | Matched | 0.79 | 0.79 | -0.19 | 99% | -0.40 | 0.69 |
Table 2.9: Balancing Statistics for Unmatched and Matched Samples – Education Markers
| Variable | Sample | Treatment | Comparison | % Diff | Reduction | t | p |
|---|---|---|---|---|---|---|---|
| % Free School Meals | Unmatched | 0.28 | 0.34 | -11.69 | |||
| % Free School Meals | Matched | 0.28 | 0.28 | -0.03 | 100% | -0.05 | 0.96 |
| % Special Educational Need | Unmatched | 0.29 | 0.36 | -14.57 | |||
| % Special Educational Need | Matched | 0.29 | 0.29 | -0.12 | 99% | -0.22 | 0.82 |
| % Level 2 English & Maths | Unmatched | 0.65 | 0.54 | 22.51 | |||
| % Level 2 English & Maths | Matched | 0.65 | 0.65 | -0.56 | 98% | -1.07 | 0.29 |
| % Level 2 Highest Qualification | Unmatched | 0.32 | 0.46 | -28.43 | |||
| % Level 2 Highest Qualification | Matched | 0.32 | 0.32 | 0.33 | 99% | 0.64 | 0.52 |
| % Level 3 Highest Qualification | Unmatched | 0.35 | 0.30 | 9.29 | |||
| % Level 3 Highest Qualification | Matched | 0.35 | 0.35 | -0.78 | 92% | -1.43 | 0.15 |
| % Level 6 Highest Qualification | Unmatched | 0.22 | 0.09 | 37.09 | |||
| % Level 6 Highest Qualification | Matched | 0.22 | 0.22 | 0.56 | 98% | 0.90 | 0.37 |
| % Children in Need | Unmatched | 0.08 | 0.13 | -18.43 | |||
| % Children in Need | Matched | 0.08 | 0.08 | -0.33 | 98% | -0.71 | 0.47 |
| % IDACI Score <=10% | Unmatched | 0.22 | 0.19 | 6.28 | |||
| % IDACI Score <=10% | Matched | 0.22 | 0.22 | -0.52 | 92% | -0.95 | 0.34 |
Table 2.10: Balancing Statistics for Unmatched and Matched Samples – Benefit/Employment Histories
| Variable | Sample | Treatment | Comparison | % Diff | Reduction | t | p |
|---|---|---|---|---|---|---|---|
| % on Benefit 1 Month pre Start | Unmatched | 0.96 | 0.96 | -0.38 | |||
| % on Benefit 1 Month pre Start | Matched | 0.96 | 0.96 | 0.44 | -16% | 0.82 | 0.41 |
| % on Benefit 6 Month pre Start | Unmatched | 0.64 | 0.68 | -8.77 | |||
| % on Benefit 6 Month pre Start | Matched | 0.64 | 0.64 | 0.15 | 98% | 0.27 | 0.79 |
| % on Benefit 12 Month pre Start | Unmatched | 0.44 | 0.47 | -6.81 | |||
| % on Benefit 12 Month pre Start | Matched | 0.44 | 0.44 | -0.55 | 92% | -1.04 | 0.30 |
| % on Benefit 24 Month pre Start | Unmatched | 0.18 | 0.21 | -5.92 | |||
| % on Benefit 24 Month pre Start | Matched | 0.18 | 0.19 | -0.99 | 83% | -1.90 | 0.06 |
| % in Employment 1 Month pre Start | Unmatched | 0.08 | 0.08 | -2.62 | |||
| % in Employment 1 Month pre Start | Matched | 0.08 | 0.08 | -0.95 | 64% | -1.80 | 0.07 |
| % in Employment 6 Month pre Start | Unmatched | 0.21 | 0.19 | 3.24 | |||
| % in Employment 6 Month pre Start | Matched | 0.21 | 0.21 | -1.36 | 58% | -2.51 | 0.01 |
| % in Employment 12 Month pre Start | Unmatched | 0.23 | 0.22 | 3.77 | |||
| % in Employment 12 Month pre Start | Matched | 0.23 | 0.24 | -1.18 | 69% | -2.17 | 0.03 |
| % in Employment 24 Month pre Start | Unmatched | 0.31 | 0.28 | 6.79 | |||
| % in Employment 24 Month pre Start | Matched | 0.31 | 0.31 | -1.46 | 79% | -2.68 | 0.01 |
Chart 2.8: Employment history for unmatched groups

| Month | Treatment | Comparison |
|---|---|---|
| -24 | 31% | 28% |
| -23 | 31% | 28% |
| -22 | 31% | 28% |
| -21 | 31% | 28% |
| -20 | 31% | 28% |
| -19 | 30% | 28% |
| -18 | 30% | 28% |
| -17 | 28% | 26% |
| -16 | 27% | 26% |
| -15 | 26% | 25% |
| -14 | 25% | 23% |
| -13 | 24% | 22% |
| -12 | 23% | 22% |
| -11 | 22% | 21% |
| -10 | 22% | 20% |
| -9 | 21% | 19% |
| -8 | 21% | 19% |
| -7 | 20% | 19% |
| -6 | 21% | 19% |
| -5 | 20% | 19% |
| -4 | 18% | 17% |
| -3 | 15% | 15% |
| -2 | 12% | 12% |
| -1 | 8% | 8% |
Chart 2.9: UC history for unmatched groups

| Month | Treatment | Comparison |
|---|---|---|
| -24 | 18% | 21% |
| -23 | 19% | 22% |
| -22 | 20% | 23% |
| -21 | 22% | 24% |
| -20 | 23% | 25% |
| -19 | 25% | 27% |
| -18 | 27% | 29% |
| -17 | 28% | 31% |
| -16 | 31% | 33% |
| -15 | 34% | 36% |
| -14 | 37% | 39% |
| -13 | 40% | 43% |
| -12 | 44% | 47% |
| -11 | 47% | 51% |
| -10 | 51% | 55% |
| -9 | 54% | 58% |
| -8 | 57% | 61% |
| -7 | 61% | 65% |
| -6 | 64% | 68% |
| -5 | 67% | 71% |
| -4 | 72% | 76% |
| -3 | 77% | 81% |
| -2 | 86% | 88% |
| -1 | 96% | 96% |
3. Impacts
3.1 Outcome Measures
The primary outcome of the evaluation is to measure the impact on the additional number of months in unsubsidised employment following a placement. A secondary outcome also looks at the number of additional month not in receipt of UC following a placement.
The aim of Kickstart was to provide relevant work experience to move people into long-term unsubsidised employment, so these primary outcomes are the main focus for this evaluation. These outcomes are similar to those of other DWP employment schemes, given that most schemes have similar overall aims in line with departmental priorities to maximise employment.
For the first six months where the placement is live, Kickstart used subsidised employment to move people into work. The department funded 25 hours at the NLW for employers to pay Kickstart participants. For individuals we are assessing if subsidised employment through the scheme helps them move into unsubsidised employment. We can only observe this benefit from month 7 onwards after the Kickstart funding ceases. This evaluation is using RTI to track earnings over time and provide us with more timely outcomes compared to P45 data. However, the RTI data is structured in monthly payments. This means when tracking earnings over time we do not have the granularity of previous evaluations, so we can only assess whether someone has been in receipt of earnings in a month, as opposed to how many days in that month they were in work for. We use earnings as a proxy for employment, however RTI does not track self-employed earnings. Given self employment was not a primary aim of Kickstart this is less relevant for this evaluation. However, because we cannot track these outcomes for both the treatment and comparison groups, this creates a source of uncertainty for the overall results.
Our secondary outcome measure is benefit receipt. As with employment, this outcome can only be measured from month 7 onwards. During the six month placement participants remain on UC. However, because they are earning above the amount needed to stop receiving the Standard Allowance, they receive a zero payment, barring any additional elements such as housing or child element. As shown in Section 2.9.2, the majority of participants only claimed the Standard Allowance, so most received a zero payment. Once Kickstart ends and participants attempt to move into unsubsidised employment, we can then observe the true impact on UC.
As UC is designed to be an in work benefit, looking purely at whether someone is claiming UC or not doesn’t necessarily give an accurate picture of whether someone has a positive labour market outcome. This is especially true for young people who are in the early stages of their labour market journey when earnings are likely to be lower.
To estimate a cost benefit ratio, we need to know the Exchequer impact of lower benefit receipt as a result of the scheme. As with employment, we are tracking this at a monthly rate, as UC is paid monthly. Although we have more accurate dates to track benefit receipt by day, people will likely judge their labour market outcomes in part by how regularly they receive any benefits, which for UC is monthly, so we have kept a consistent measure here too.
Outcomes are tracked up to 24 months from scheme start, or pseudo start date. This is done by looking at mean impacts of the treatment and comparison group and calculating the difference. Once an impact is estimated at 24 months, a DiD analysis is done on these results as discussed in section 2.5.1. In line with the assumptions in the business case and NAO recommendations[footnote 16].
3.2 Net Impacts on Employment and Benefit Receipt
This section estimates the impact of Kickstart on employment and benefit receipt 24 months from individuals starting on the scheme. Section 2 outlined how this would be done, attempting to isolate the impact of the Kickstart scheme by controlling for observed and unobserved bias in claimant characteristics.
Charts 3.1 and 3.2 show the net impact. The orange area represents the percentage point impact that Kickstart has, blue shows the proportion of people who would have moved into employment even without Kickstart, and grey shows the proportion who didn’t move into employment with or without Kickstart. For employment, Kickstart has a net impact of 11 percentage points (ppts) with a confidence interval (CI) of 0.5ppts. This means that for every 100 people that went on Kickstart, an extra 11 would be in employment 24 months after their start date compared to 100 people with very similar characteristics who did not start a Kickstart placement.
For every 100 people that went on Kickstart, 54 would be in employment 24 months after their start date even if they didn’t go on Kickstart. This is based on the outcomes of the comparison group, where 54% would be in employment based on wider economic conditions. Kickstart was not the only way for somebody eligible to find a job, and many were able to find employment through the wider labour market or other employment schemes.
Some individuals (35ppts in the treatment group and around 46ppts in the control group) are not in employment at the two year mark, or may have been in short employment spells over this time and happened to be out of employment at the 24 month mark. They may also have pursued further training during this time instead of employment.
For benefit receipt, the net impact in orange is 3ppts (CI=0.5ppts). This means that an additional three people per 100 are not on UC directly because of Kickstart. This will normally be due to movements into employment, where their earnings would be sufficient to no longer be entitled to UC. Some individuals may have moved into full time education and as such are no longer eligible for UC. An additional 65ppts also move off benefit, but this is not directly due to Kickstart participation. The final 32ppts remain on UC but may be in low paid work where they keep some of their entitlement. The context of these results is discussed further in section 3.6.
Chart 3.1: Net employment impact of Kickstart 24 months after starting on scheme

Chart 3.2: Net UC impact of Kickstart 24 months after starting on scheme

Charts 3.3 and 3.4 show the longitudinal impact of Kickstart on participants to assess how the net impact changes over time. During the first six months the impact of Kickstart is heavily exaggerated due to the design of the scheme, as participants move into employment and generally have no benefit receipt. These are delineated by a dashed line. The primary focus is on impact from month 7 to month 24.
The employment impact is marginally lower in month 8 than month 7. This is partly a timing issue. As discussed in section 3.1, RTI records are based on calendar months, so if somebody completes a Kickstart placement and moves immediately into another role, it may take an additional month for their earnings to appear in the system depending on when they are paid. Not everyone is paid at the same time or the same frequency, so this can create temporary lags on this measure. Some people did move immediately into work following a completed Kickstart placement, but others temporarily moved back to the benefit system following the completion of their placement. Participants were given support by Work Coaches to find unsubsidised employment. From month 8, the impact increases up to month 13 where the impact stabilises at 11ppts, suggesting a consistent long run impact of the scheme.
We see variation in the pattern for benefit receipt too. The impact in month 7 is above zero, meaning that more people in the treatment group are on benefit than those in the comparison group. Many people on Kickstart initially went back into benefit receipt while looking for further employment, whereas the comparison group continue with the support offer provided by Jobcentre Plus from month 0 onwards. However, this trend quickly reverses as the impact of Kickstart kicks in, reaching a steady state of 3ppts fewer people in receipt of UC in later months.
The consistent low impact before month 0 for both measures suggests that the PSM methodology is effective at matching participants with similar benefit and employment histories together, giving more confidence to the outcomes beyond month 0. Additionally, the sampling errors shown by the light shaded areas are very small, so the margin of error in these results is very low.
Chart 3.3: Longitudinal employment impact of Kickstart

Chart 3.4: Longitudinal UC impact of Kickstart

3.4 Sensitivity Analysis
Sensitivity analysis has been conducted to ensure that the analysis is robust when considering different methodologies. Charts 3.5 and 3.6 show the proportion of the treatment and matched comparison group in employment or on benefit at 24 months. The net impact shown on the right hand side also takes into account the DiD adjustment described in section 2.5.1.
One potential issue with this section of the analysis is the risk of the multiple comparison problem. By comparing a variety of different characteristics and looking at the trends, there is a risk that different trends could occur not because the impact of Kickstart is inconsistent across different groups, but because of smaller sample sizes or sampling errors. This subgroup analysis is exploratory and corrections for multiple comparisons have not been applied, so caution should be applied when considering the heterogeneity of the results. However, given the relatively large sample size of these groups, and the results also show no significant deviations from the trend results, the multiple comparison problem is unlikely to be an issue.
3.4.1 Geography
As discussed in section 2.4, the analysis only includes those educated in England due to education data (LEO) availability, however the analysis can be repeated for other regions if the education variables are dropped. Overall, the results appear to be stronger in Scotland and Wales than in England. This is largely due to the performance of the comparison group, which is less likely to be in employment and more likely to be in benefit receipt compared to the main model. The treatment groups are also more likely to be in benefit receipt compared to the main model. The lower performance of the comparison groups for Scotland and Wales increases the gap between them and the treatment group. After DiD the increased employment impact and reduction in benefit receipt is still higher than under the main model. However, as these results have excluded all education variables, the validity of these results is lower. While these results are significant and the DiD does not lower these results significantly, it is likely that omitting these significant education variables from the matching increases the level of unobserved bias in these results. As a sense check, an additional version of the analysis for England was produced that excluded the education variables. This led to similar results to the Wales and Scotland results, suggesting that most of the difference in impact from the main model may be due to omitting these variables.
3.4.2 Different Comparison Groups
The main model includes both non-referrals and referred not started in the comparison group, for the reasons explained in section 2.5. Analysing the impact of Kickstart against both comparison groups individually helps explain what is driving performance in the comparison group. It also shows the level of unobserved bias that cannot be controlled for in the main model. Non-referrals on average perform worse than referred not started. Those referred to Kickstart are likely to be closer to the labour market than non-referrals who may have more barriers to employment, so their overall labour market performance is likely to reflect that. This could also indicate that there is a large amount of unobserved bias. The difference between the results of the two groups may be due to different unobserved characteristics that cannot be controlled for, and so leads to different results. Therefore, we may be overstating the impact of Kickstart in the central analysis. However, it is difficult to judge this with certainty. The reason an individual may leave Kickstart during the referral process could be due to finding permanent employment elsewhere, which would improve labour market performance for this group and introduce bias in the opposite direction. This could also explain the lower impact for this group, but as discussed in section 2.5 we cannot distinguish between those who did not start due to finding a job outside of Kickstart, and those who were unsuccessful in securing a Kickstart placement. The gap is much bigger for employment than benefit receipt, but the trend is the same for both measures. This is discussed in more detail in section 3.6.
3.4.3 Other Sensitivity Checks
Age: The first sensitivity is to remove 19 year olds from the analysis. The main model includes those aged 19 years and above as one year of benefit history is required to get a better idea of what the individual’s labour market history is. This also helps to control for unobserved characteristics such as motivation, which previous research suggests that labour market history may be a good proxy for[footnote 17]. Restricting the sample to 20 years olds (and therefore needing 24 months of labour market history) is a useful sensitivity to check. The results show that the impacts are robust to this check as they are extremely similar to the main model.
Timing of Kickstart participation: The next sensitivity check is to include all cohorts, which includes those who started Kickstart from November 2020 to February 2021. The sample size for these cohorts is small and given they may have been affected by lockdown effects in this period, these cohorts were excluded from the main model to ensure the treatment effect measured is consistent for every cohort and is more generalisable to more ‘normal’ conditions. Including these cohorts does not substantially change the results of the main model, most likely due to the small sample size of these initial cohorts.
Matching methodology: Finally, the PSM methodology was changed from nearest neighbour matching to kernel matching. The main model uses a nearest neighbour methodology due to the consistent spread of propensity scores across the treatment and comparison groups. The 100 nearest individual propensity scores in the comparison group are compared to each treatment group participant to assess the match and performance of each group. Using a normal kernel match changes this approach to look at all comparison group participants within a 0.0001 range of each person’s propensity score in the treatment group. The advantage of this approach is that it removes any extreme scores from the treatment group as it only matches to cases within a certain bandwidth. This approach holds if the propensity score distributions are similar, and the bandwidth is wide enough for cases to match consistently, which is the case for our model.
Overall, the results change very little because the score distributions are well populated across the scale and follow a similar shape. This is shown in the level of common support in Section 2.10.1, where the range of scores between the treatment and comparison groups is very similar, so individuals in the treatment group should always have a number of individuals in the comparison group to
Chart 3.5: Sensitivity analysis of employment impacts

| Treatment | Control | |
| Main Model | 65% | 54% |
|---|---|---|
| Scotland | 61% | 47% |
| Wales | 62% | 45% |
| England (No LEO) | 65% | 50% |
| Non Referrals Only | 65% | 44% |
| Referred Not Started Only | 65% | 59% |
| Exclude 19 Year Olds | 65% | 55% |
| Include All Cohorts | 65% | 55% |
| Kernel Matching | 65% | 54% |
Chart 3.6: Sensitivity analysis of UC impacts

| Treatment | Control | |
| Main Model | 32% | 35% |
|---|---|---|
| Scotland | 38% | 47% |
| Wales | 37% | 48% |
| England (No LEO) | 32% | 40% |
| Non Referrals Only | 32% | 38% |
| Referred Not Started Only | 32% | 34% |
| Exclude 19 Year Olds | 32% | 35% |
| Include All Cohorts | 32% | 35% |
| Kernel Matching | 32% | 35% |
3.5 Sub-Group Analysis
This section examines the results for different groups of Kickstart participants based on demographic flags, education identifiers and ethnicity. This analysis helps identify if certain groups benefitted more from the intervention than others.
All charts in this section compare sub-groups to the main model results in charts 3.1 and 3.2. The blue section is equivalent to the counterfactual impact – the proportion of people moving into work irrespective of Kickstart. The orange section looks at the net impact of Kickstart specifically.
3.5.1 Demographic Flags
Charts 3.7 and 3.8 look at certain demographic markers. The Kickstart impact is relatively consistent across various groups, with overall movements into employment of around 60%, so 6 out of every 10 people aged 16 to 24 in UC IWS moved into work within two years of their start date. Some groups have a slightly lower impact from Kickstart compared to others, but this is largely as a result of the comparison group performing better. For example, young people in London found it easier to move into work outside of Kickstart, so although those on Kickstart performed just as well in London as in the rest of England, the net impact is smaller because of the performance of the comparison group. This may be expected as the size of the London labour market, and better transport links could make it easier for young people to find employment within this market.
For individuals who participated in a Kickstart placement for up to three months the Kickstart employment impact is 3.9ppts, and the benefit impact is 1.2ppts, compared to 12.2ppts and 4.5ppts for those who were on Kickstart for 4-6 months. This shows that the cumulative experience of Kickstart was a significant benefit for participants, and simply starting a placement did not correspond to a complete treatment effect. However, the comparison group with characteristics more similar to those who spent longer on Kickstart performed better than comparable individuals to those with shorter Kickstart spells. This shows that some of the difference in the impacts may be due to characteristics, and potentially placements ended early due to participants not being completely suited to the Kickstart scheme, despite being eligible.
Chart 3.7: Employment impact by demographic groups

| Non Kickstart Impact | Kickstart Impact | Post DiD Impact | |
|---|---|---|---|
| Age: 23-24 | 56% | 9% | 10% |
| Age: 19-22 | 54% | 10% | 10% |
| Gender: Female | 56% | 10% | 10% |
| Gender: Male | 54% | 10% | 11% |
| Geography: Rest of England Only | 54% | 11% | 12% |
| Geography: London Only | 56% | 6% | 7% |
| Duration: 4-6 Months on Kickstart | 56% | 12% | 12% |
| Duration: 0-3 Months on Kickstart | 50% | 4% | 4% |
| Main Model | 54% | 10% | 11% |
Chart 3.8: UC impact by demographic groups

| Non Kickstart Impact | Kickstart Impact | Post DiD Impact | |
|---|---|---|---|
| Age: 23-24 | 64% | 2% | 2% |
| Age: 19-22 | 65% | 5% | 5% |
| Gender: Female | 62% | 5% | 5% |
| Gender: Male | 67% | 2% | 2% |
| Geography: Rest of England Only | 64% | 4% | 4% |
| Geography: London Only | 68% | 1% | 1% |
| Duration: 4-6 Months on Kickstart | 66% | 5% | 4% |
| Duration: 0-3 Months on Kickstart | 59% | -2% | -2% |
| Main Model | 65% | 3% | 3% |
3.5.2 Education Markers
Education is a key predictor of performance on Kickstart, and charts 3.9 and 3.10 below demonstrate this. For the highest qualification level achieved, there is a strong trend between level and proportion in employment/not on benefit. For those that did not go on Kickstart, only 30% of those with their highest qualification being below level 2 were in employment at 24 months, compared to 73% for those with a degree or higher. However, Kickstart was effective at reducing this gap significantly, with an additional 17ppts moving into work for levels 0-1, compared to 3ppts for levels 6-8. It is likely that those with higher qualifications had fewer barriers to employment compared to less qualified participants, so this demonstrates that Kickstart was effective at helping those with lower qualifications move into long-term unsubsidised employment.
The trend is also similar for other markers, such as those with SEN or eligible for FSM. Individuals without these identifiers were generally more likely to get into work, but again Kickstart was effective at reducing this gap, and had a disproportionately larger effect on those with these identifiers than those without. This trend seems plausible, as we would expect those with more employment barriers to have worse outcomes without intervention. However, the scope of Kickstart meant that participants with these identifiers were still deemed suitable for the scheme. It is possible that relevant work experience may have a larger benefit for those with these identifiers.
Chart 3.9: Employment impact by education markers

| Non Kickstart Impact | Kickstart Impact | Post DiD Impact | |
|---|---|---|---|
| Education Marker: No SEN | 59% | 9% | 9% |
| Education Marker: SEN | 45% | 13% | 14% |
| Education Marker: No FSM | 58% | 10% | 10% |
| Education Marker: FSM | 47% | 11% | 12% |
| Qualification: Level 6-8 | 73% | 3% | 3% |
| Qualification: Level 3-5 | 55% | 11% | 11% |
| Qualification: Level 2 | 44% | 14% | 14% |
| Qualification: Level 0-1 | 29% | 17% | 17% |
| Main Model | 54% | 10% | 11% |
Chart 3.10: UC impact by education markers

| Non Kickstart Impact | Kickstart Impact | Post DiD Impact | |
|---|---|---|---|
| Education Marker: No SEN | 70% | 2% | 2% |
| Education Marker: No SEN | 52% | 6% | 6% |
| Education Marker: No SEN | 69% | 2% | 2% |
| Education Marker: No SEN | 53% | 6% | 6% |
| Qualification: Level 6-8 | 85% | -1% | 0% |
| Qualification: Level 3-5 | 68% | 3% | 3% |
| Qualification: Level 2 | 49% | 6% | 6% |
| Qualification: Level 0-1 | 36% | 8% | 8% |
| Main Model | 65% | 3% | 3% |
3.5.3 Ethnicity
The picture for ethnicity is more nuanced. At a headline level, Kickstart was more effective at getting white people into work (12ppts) than ethnic minorities (7ppts). However, this difference is exaggerated by geographical trends by ethnicity. Table 3.1 shows that London accounts for a larger proportion of the ethnic minority population compared to the white population for the treatment group. This is particularly significant for black participants, where London makes up two thirds of the overall group, compared to just 9% for white participants.
Table 3.1: Ethnicity by region (Treatment Group)
| Ethnicity | Rest of England | London |
|---|---|---|
| White | 91% | 9% |
| Black | 35% | 65% |
| Mixed | 64% | 36% |
| Asian | 61% | 39% |
| Other/Prefer not to say | 55% | 45% |
Charts 3.11 and 3.12 show that participants in London had a smaller treatment effect than those in the rest of England for all ethnicities. The lower impact of Kickstart in London is very important for ethnic minorities, given this makes up a larger proportion of the group. This therefore skews the overall result when comparing by ethnicity. However, even within regions, the employment impact for ethnic minorities is lower than for white people, but the gap is generally smaller than the headline results.
This does not mean that ethnic minority groups did not find work. Being located in London means being in a larger labour market with stronger transport links, with more avenues to find work outside of the Kickstart scheme compared to other areas of England. Combining baseline and Kickstart impacts shows that employment outcomes are very similar regardless of ethnicity, but Kickstart played a bigger labour market role outside of London, and therefore white people benefitted disproportionately because of that.
Chart 3.11: Employment impact by ethnicity

| Non Kickstart Impact | Kickstart Impact | Post DiD Impact | |
|---|---|---|---|
| Ethnicity: Asian Rest of England | 58% | 7% | 7% |
| Ethnicity: Mixed Rest of England | 52% | 11% | 12% |
| Ethnicity: Black Rest of England | 55% | 8% | 9% |
| Ethnicity: White Rest of England | 54% | 12% | 12% |
| Ethnicity: Asian London | 63% | 4% | 4% |
| Ethnicity: Mixed London | 53% | 7% | 7% |
| Ethnicity: Black London | 55% | 6% | 6% |
| Ethnicity: White London | 55% | 8% | 9% |
| Ethnicity: Ethnic Minority Only | 55% | 7% | 7% |
| Ethnicity: White Only | 54% | 11% | 12% |
| Main Model | 54% | 10% | 11% |
Chart 3.12: UC impact by ethnicity

| Non Kickstart Impact | Kickstart Impact | Post DiD Impact | |
|---|---|---|---|
| Ethnicity: Asian Rest of England | 74% | 0% | 0% |
| Ethnicity: Mixed Rest of England | 62% | 5% | 5% |
| Ethnicity: Black Rest of England | 65% | 0% | 0% |
| Ethnicity: White Rest of England | 63% | 5% | 4% |
| Ethnicity: Asian London | 75% | 0% | 0% |
| Ethnicity: Mixed London | 66% | 0% | 1% |
| Ethnicity: Black London | 64% | 1% | 1% |
| Ethnicity: White London | 68% | 2% | 2% |
| Ethnicity: Ethnic Minority Only | 68% | 1% | 1% |
| Ethnicity: White Only | 63% | 4% | 4% |
| Main Model | 65% | 3% | 3% |
3.6 Discussion of Results
The analysis shows that Kickstart was successful in supporting people into employment. At two years, for every 100 people who participated on the scheme, Kickstart moved an additional 11 individuals into unsubsidised employment and moved an additional three people off benefit, compared to 100 comparable individuals who did not participate. These results are consistent over time, with the impact increasing in the first six months after the end of a Kickstart placement, and then plateauing from month 12 onwards. This provides some confidence the positive impacts of the scheme persist into the future.
For most groups, barring educational history, the proportion of people moving into work is very similar, however the additional Kickstart impact may be higher or lower depending on how the baseline comparison group performs. The results show that Kickstart tended to have a higher impact for more disadvantaged groups (who have poorer outcomes in the absence of Kickstart). This finding could have implications for future targeting of policies like Kickstart.
The design of Kickstart was in part based on the previous FJF scheme that ran from October 2009 to March 2011. The aims were very similar to Kickstart, providing young people with relevant employment experience to avoid long run scars from unemployment. It had a similar design to Kickstart, where individuals joined specific funded roles, and employers benefitted from subsidised wages for a six month placement. Additionally, the net unit cost was very similar in real terms. Therefore, it is a good benchmark to compare how Kickstart performed.
FJF had an employment impact of 10ppts, and a benefit impact of 7ppts. Kickstart appears to have a similar impact of moving young people into unsubsidised employment. Although the impact was similar, the nature of the economic downturns and subsequent recoveries during each scheme differed. For FJF, the recovery was slower than for Kickstart, and the timing of Kickstart allowed it to maximise the benefit from the labour market opening up in Spring 2021 and a sharp increase in demand for jobs at that time. Additionally, unlike FJF, Kickstart was opened up to private sector employers as well as public sector employers, which helped to increase the scope of jobs available and amplify this labour market benefit. Nonetheless the overall impact was similar over a longer time period once the labour market and wider economy recovered from the initial shock.
The benefit receipt picture is less clear compared to FJF. One the one hand, the percentage point impact is smaller compared to FJF, so Kickstart as a scheme has moved proportionally fewer people off benefit. However, changes in the benefit system over the past decade mean that the two impacts are not comparable. Over the past decade UC has increasingly become the primary out of work benefit for working-age people, rather than Job Seekers Allowance (JSA). Unlike JSA which was designed to be an out of work benefit UC is designed to support people both in and out of work. There are fewer risks of cliff edges, which may disincentivise individuals to move into work, but it also means that once somebody moves into work, they do not automatically move off UC in a way they may have done for JSA. Additionally, UC also encompasses other benefits such as Child Benefit, Tax Credits and Housing Benefit. An individual moving into work would not lose entitlement to these elements of UC. Therefore, it is possible to be in work and claim UC at the same time. Most young people who went on UC were only claiming the UC Standard Allowance, meaning that their benefit picture is closer to the JSA picture than for other types of claimants. However there were a minority claiming other elements, so this will deflate the benefit impact compared to JSA, and this probably explains the lower impact overall.
4. Cost Benefit Analysis
The Kickstart Cost Benefit Analysis (CBA) is based on the impacts set out in section 3. This section describes how these impacts are converted into additional days in employment, and then how the costs and benefits from those additional days are considered. This methodology is consistent with previous departmental impact evaluations, based on guidance from the Green Book[footnote 18], and using the department’s Social Cost Benefit Analysis (SCBA) model. Section 2.4 explains how treatment group selection occurs, removing cases that may create bias in the results by keeping those most likely to get the clearest treatment effect from Kickstart. Therefore, the results presented previously aim to give the most representative estimate of the impact of Kickstart using a subset of those who participated. The results in this section will apply to everyone who started a placement, as the costs and benefits calculated relate to everybody who participated, and therefore the results can be generalised to a much wider group.
4.1 Methodology
4.1.1 Estimating Additional Days in Employment
It is necessary to calculate how many extra days in total were spent in employment as a result of Kickstart. However, only the number additional of days in unsubsidised employment compared to the comparison group should be calculated. The subsidised six month placement does provide a benefit, and will be taken into account in the analysis, however the other costs and benefits described below relate to unsubsidised employment spells, such as taxation paid from employment.
Over the 24 month period following a placement start, an individual spent on average an additional 16 days in unsubsidised employment compared to those who did not start a placement. For the first six months, this figure is -41, meaning that the comparison group spent an additional 41 days in unsubsidised employment compared to the treatment group. This is due to the design of Kickstart, where participants are spending this period mostly in subsidised employment, and have less motivation to seek unsubsidised employment until the six months is completed. A small proportion do find unsubsidised employment during this time, but the majority completed the scheme in its entirety. Meanwhile the comparison group were able to search for unsubsidised employment from month 0, due to not going on the scheme. This phenomenon is known as a ‘lock in period’ and is very common for labour market schemes such as Kickstart.
However, in the following 18 months, the treatment group spent an additional 76 days in employment. Adding these two figures gives a combined total of 35 days.
The CBA will also look at costs and benefits up to the five years after starting Kickstart. This is modelled based on the results up to two years. Performance is forecasted forward using the average performance over a range of time periods during Kickstart from 10 to 24 months after starting a Kickstart placement. The impact of Kickstart is consistent during this period, giving us confidence that predictions beyond 24 months more accurate. From months 10 to 24, the impact is very flat, falling by less than 1ppt over the period, so the impact going forward reflects this gradual change. Table 4.1 below shows the breakdown of the additional days in employment up to 60 months. Year 3 has an additional 38 days in employment, year 4 has a slightly lower figure of 37, and year 5 again slightly lower at 35 days. This gives a total of 127 days over the five year tracking period. Sensitivity analysis in section 4.3 will examine the impacts of adjusting this figure.
Table 4.1: Number of Days in Unsubsidised Employment over time
| Months | No. Days in Unsubsidised Employment | Cumulative Days in Unsubsidised Employment[footnote 19] |
|---|---|---|
| 0-6 | -41 | -41 |
| 7-12 | 17 | -24 |
| 13-18 | 20 | -3 |
| 19-24 | 20 | 16 |
| 25-36 | 38 (projected figure) | 55 (projected figure) |
| 37-48 | 37 (projected figure) | 92 (projected figure) |
| 49-60 | 35 (projected figure) | 127 (projected figure) |
4.1.2 Perspectives Under Consideration
The CBA will consider four key perspectives when calculating the costs and benefits of the scheme, summarised in Table 4.2:
- Kickstart participants
- Employer
- The Exchequer, in other words the government budget perspective
- Society
The participant perspective focusses on individual costs and benefits, in particular changes in wages and benefit entitlement. The employer perspective focusses on the costs of paying participants, which are offset by the Exchequer during Kickstart, and the benefits of the additional output produced by participants during and after the placement. The Exchequer perspective covers the fiscal elements of the policy, such as income and indirect taxes, National Insurance, and reduced benefit spending, as well as the cost of departmental spending on the Kickstart scheme. The society perspective sums up the net impact from the other perspectives, reflecting the participant, employer and Exchequer perspectives in combination. All perspectives will be measured, but the sensitivity analysis will only include the Exchequer and societal perspectives, as these are the primary focus of this report.
For the purposes of this analysis, ‘society’ represents an aggregate of all British citizens. Therefore, a cost or benefit to participants, their employers or the Exchequer can also represent a cost or benefit to society. However, it should be noted that many of the gross impacts of Kickstart are essentially ‘transfer payments’. Transfer payments represent a cost to one group of citizens, but a benefit to another. For example, the wages earned during a Kickstart placement represent a benefit to participants but a cost to the Exchequer, via their employers.
Table 4.2: Monetised costs and benefits of Kickstart
Key to table: ‘+’ denotes a net benefit; ‘-’ denotes a net cost; ‘0’ denotes neither cost nor a benefit.
| Kickstart scheme impact | Perspective of Participants | Perspective of Employer | Perspective of Exchequer | Perspective of Society |
|---|---|---|---|---|
| Increase in output | 0 | + | 0 | + |
| Kickstart additional output | 0 | + | 0 | + |
| Increase in wages post Kickstart | + | - | 0 | 0 |
| Increase in wages during Kickstart | + | - | 0 | 0 |
| Kickstart administrative costs | 0 | - | 0 | - |
| Reduction in operational costs | 0 | 0 | + | + |
| Reduction in benefits post Kickstart | - | 0 | + | 0 |
| Reduction in benefits during Kickstart | - | 0 | + | 0 |
| Increase in taxes | - | - | + | 0 |
| Increase in travel costs | - | 0 | 0 | - |
| Reduction in healthcare costs | 0 | 0 | + | + |
| Redistributive costs and benefits | + | 0 | 0 | + |
| Kickstart employer wage payments | 0 | + | - | 0 |
| Kickstart employer start up payments | 0 | + | - | 0 |
| Departmental costs | 0 | 0 | - | - |
Once the costs and benefits have been calculated, a Cost Benefit Ratio (CBR) is produced reflecting the balance of the two. If the total is greater than £1, then for every pound spent on Kickstart, more than one pound has been earned back in benefits.
4.1.3 Calculating Benefits
Increase in output
This refers to the economic output produced by participants as a result of additional time spent in employment. This is the output derived from the unsubsidised employment spells beyond Kickstart, so unlike the Kickstart specific output discussed below, we assume that 100% of this is output additional. This output represents a benefit to employers (who sell it) and society (who consume it). The DWP does not have information on the value of this output so it is necessary to make a number of simplifying assumptions. The labour market is assumed to be perfectly competitive. This implies that employers will hire workers up to the point where the value of an additional unit of output is equal to the associated marginal cost of production. The cost of production, and therefore the value of the output produced during additional spells in employment, is assumed to equal the commensurate gross wage payments and employers’ National Insurance contributions.
Kickstart additional output
As well as looking at additional output from unsubsidised employment, output from Kickstart roles also needs to be considered. Employers were required to provide roles to participants that were additional to the output they were already producing. In the business case for Kickstart, it was assumed that 50% of all roles would be additional, so therefore 50% of output would be additional from the counterfactual. The SCBA model assumes that the amount spent on wages is equivalent to the amount outputted, so to calculate the additional output from Kickstart roles, 50% of the wage spent on participants is added as an employer and societal benefit. This assumption is tested in the sensitivity analysis to assess what impact it has on the overall results.
Increase in wages during/post Kickstart
This refers to the gross wages received by participants both during Kickstart and in additional time spent in employment beyond the scheme. Wages represent a benefit to participants but a cost to their employers. This means they do not represent a net cost or benefit to society, except via redistributive effects described below.
Kickstart administrative costs
This considers the administrative costs to employers of taking on Kickstart participants. Employers were given payments explained below to cover these costs.
Reduction in operational costs
Kickstart participants are less likely to receive support from Jobcentre Plus advisers following a placement because they are more likely to be working and less likely to be claiming benefit. As a result, this also means participants are less likely to participate in other DWP employment schemes. This translates into operational savings which represent a benefit to the Exchequer and society, as economic resources can be reallocated to alternative uses.
Reduction in benefits post Kickstart
This refers to the net reduction in benefit entitlement and take up that occurs when participants spend additional time in employment as a result of participation on Kickstart. This represents a benefit to the Exchequer and a cost to participants, but no net cost or benefit to society, except via redistributive effects explained below. Changes in benefit entitlement and take up are estimated using the DWP Policy Simulation Model[footnote 20].
Reduction in benefits during Kickstart
This refers to the benefit saving during Kickstart. Participants receive no UC during their placement where their earnings are high enough which sees the UC award tapered to zero. The vast majority of participants are only claiming the single Standard Allowance for under 25s, so their award is reduced to by their earnings on Kickstart. Even those with multiple elements of UC will likely see their award reduced due to earnings if not completely. Therefore, a key benefit is the UC saving during the placement. This is a benefit for the Exchequer and a cost to participants, so this transfer payment is cost neutral for society.
Increase in taxes
This refers to the increase in income tax, National Insurance and indirect tax revenue that occurs when participants spend additional time in employment as a result of participation in Kickstart. This represents a benefit to the Exchequer and a cost to both employer and participants, but no net cost or benefit to society, except via redistributive effects discussed below. Increases in tax revenue are estimated using the DWP Policy Simulation Model[footnote 21].
Increase in travel and childcare costs
This refers to the additional travel and childcare costs that are incurred by participants during additional employment as a result of participation in Kickstart. This also represents a cost to society as the provision of additional travel and childcare services diverts economic resources from alternative uses.
Reduction in healthcare costs
This refers to the reduction in National Health Service (NHS) costs which is expected to occur when participants spend additional time in unsubsidised employment as a result of their participation in Kickstart[footnote 22]. This represents a benefit to the Exchequer, via reductions in NHS expenditure, and society, as economic resources which had been allocated to healthcare provision can be reallocated to alternative uses.
Redistributive costs and benefits
This refers to the redistributive costs and benefits associated with monetary transfers between participants, employers and the Exchequer. In line with the methodology prescribed in the HM Treasury Green Book, participants, who have relatively low incomes, are assumed to value each additional pound more highly than employers and the average taxpayer, who both have a relatively high income compared to participants. This implies, for example, that monetary transfers from the Exchequer to participants represent a benefit to society. In line with the recommendations of Fujiwara (2010), redistributive costs and benefits are estimated by applying a ‘welfare weight’ of 2.4 to monetary transfers made to and from scheme participants.
4.1.4 Calculating Costs
The calculation for CBRs uses a flat unit cost, made up of the two elements below. Both are a net negative to both the Exchequer and societal impact by default.
Employer wage payments
Kickstart provided funding for up to 25 hours a week of funding at the relevant NLW. Anything above this, whether hours worked or wage rates, could be offered by employers but they would have to fund this themselves. Evidence from the process evaluation[footnote 23] shows that roughly 16% of participants were paid above the NLW, but given the nature of the RTI data it would be difficult to establish how much this would be in a given month, and thus we have assumed that everyone was paid the NLW. Including those who did not complete the scheme, the average wage payment to employers was £4368. These payments are a cost to the Exchequer, but a benefit to employers, so from a societal perspective this is a transfer payment.
Employer start up payments
Employers were offered a one off payment to cover administrative costs. This added up to £1500 per placement start, plus an additional £360 if the employer applied through a gateway organisation, with £60 of that potentially being paid back through VAT depending on individual circumstances[footnote 24]. Gateways acted as an intermediary to help employers manage their Kickstart Scheme grant. Essential responsibilities of a Kickstart gateway included ensuring the employer had the capacity and capability to support the participants on Kickstart. The average start up payment was £1692. These payments are a cost to the Exchequer, but a benefit to employers, so from a societal perspective this is a transfer payment.
Departmental costs
Administrative costs for the scheme were also calculated. This includes departmental costs to get the scheme up and running such as IT costs, marketing and DWP staff costs. This equated to a cost of £785 per start. This cost is only taken from the Exchequer perspective, as employers and participants are not affected directly from this. This therefore becomes a cost for society as well.
4.2 Estimates
Table 4.3 shows the breakdown of the baseline results from both the Exchequer and societal perspective at the 24 month mark.
Table 4.3: Estimated Costs and Benefits of Kickstart under baseline assumptions at two years (rounded)
| Kickstart scheme impact (24 months) | Perspective of Participants | Perspective of Employer | Perspective of Exchequer | Perspective of Society |
|---|---|---|---|---|
| Increase in output | - | 420 | - | 420 |
| Kickstart additional output | - | 2,180 | - | 2,180 |
| Increase in wages post Kickstart | 400 | -400 | - | - |
| Increase in wages during Kickstart | 4,370 | -4,370 | - | - |
| Kickstart administrative costs | - | -1,690 | - | -1,690 |
| Reduction in operational costs | - | - | 10 | 10 |
| Reduction in benefits post Kickstart | -90 | - | 90 | - |
| Reduction in benefits during Kickstart | -1,660 | - | 1,660 | - |
| Increase in taxes | -80 | -20 | 110 | - |
| Increase in travel costs | -10 | - | - | -10 |
| Reduction in healthcare costs | - | - | 10 | 10 |
| Redistributive costs and benefits | 300 | - | - | 300 |
| Kickstart employer wage payments | - | 4,370 | -4,370 | - |
| Kickstart employer start up payments | - | 1,690 | -1,690 | - |
| Departmental costs | - | - | -790 | -790 |
| Total Benefits | 5,070 | 8,660 | 1,880 | 2,920 |
| Total Costs | -1,840 | -6,480 | -6,850 | -2,490 |
| Net Benefit | 3,230 | 2,180 | -4,970 | 430 |
| Cost Benefit Ratio (CBR) | 2.75 | 1.34 | 0.27 | 1.17 |
The participant perspective is the highest of the four at £2.75 after 24 months. This is because most of the costs of Kickstart such as wages are a benefit to individual participants. The employer perspective is also positive at £1.34. Most of the costs of Kickstart for employers are offset by payments from the Exchequer. Most of the benefits for employers come from the additional output produced by participants, and this alongside relatively low costs leads to a positive ratio.
The Exchequer perspective is relatively narrow in scope, and the design of Kickstart means that benefits such as reduction in operational costs and increase in taxes only occur once the scheme is completed. At two years these benefits are not enough to outweigh the unit cost of Kickstart, leading to a net loss of £4970. This is equivalent to a benefit cost ratio of £0.27 per pound spent.
The societal perspective adds up the combination of the other three perspectives, and the positive result is a reflection of this. Most of the costs such as wages are transfer payments between the Exchequer, employer and participant. The societal perspective includes wider benefits such as redistributive benefits and output, which are a net benefit under this perspective.
Table 4.4 shows the CBRs up to five years. The ratio from the participant perspective rises gradually over time, as participants gain more in wages post Kickstart, but as a result pay more in taxes and lower benefit receipt, which makes this increase more modest.
The ratio from the employer perspective falls slightly over time. The SCBA model assumes that increases in output matches an increase in wages and National Insurance contributions. The net benefit is therefore consistent over time. However, as the costs and benefits are gradually increasing over time while participants earn more in wages, this net benefit becomes a smaller proportion of the overall cost, so the CBR drops slightly over time.
The Exchequer ratio rises more slowly due to the narrower scope, relying largely on increases in tax receipts and lower benefit receipts to change over time. At the five year mark, the CBR is £0.49 for every pound spent.
The societal benefits increase more quickly over time. Redistributive impacts as well as increased output accumulate as time goes on. Additionally, long run costs such as wages are a transfer payment under this perspective, so remain as a zero cost to society. As a result, the social CBR rises faster than other perspectives, reaching £3.15 after five years.
Table 4.4: Estimated Cost Benefit Ratios over time
| Timeline | Perspective of Participants | Perspective of Employer | Perspective of Exchequer | Perspective of Society |
|---|---|---|---|---|
| 24 Months | £2.75 | £1.34 | £0.27 | £1.18 |
| 36 Months | £2.96 | £1.29 | £0.35 | £1.87 |
| 48 Months | £3.10 | £1.26 | £0.42 | £2.53 |
| 60 Months | £3.20 | £1.23 | £0.49 | £3.15 |
4.3 Sensitivity Analysis
To test the robustness of these results, a number of sensitivity tests have been conducted to test different assumptions used in the modelling. Table 4.5 summarises the assumptions.
Table 4.5: Summary of baseline assumptions and sensitivity adjustments
| Assumption | Baseline | Sensitivity |
|---|---|---|
| Decay in Impact | Gradual decay over time in line with performance up to 24 months | No decay/25% decay |
| Substitution Effects | No substitution effects | 20% substitution effects |
| Additionality | 50% additionality | 30%/100% additionality |
| Percentage on UC | Based on figures from 10-24 months | Projects estimates to five years |
| Distributional Effects | Distributional effects included | No distributional effects |
Decay In Impact
The baseline model assumes that employment impacts follow in line with performance up to 24 months. However, it is possible that this changes as time goes on. This may underestimate future performance if there is no decay in the impact over time. As a sensitivity, a scenario was produced that assumes performance does not decay, as opposed to the baseline assumption which assumes performance continues at an average of different time profiles. This improves results slightly, as there is a small amount of decay in the baseline.
Alternatively, the impact could reduce over time, leading to more decay in performance. Although there is no evidence to show this up to 24 months, as a sensitivity a 25% decay assumption in years 4 and 5 has been added.
Substitution Effects
The baseline model does not assume any substitution effects. As a sensitivity a scenario has been produced to assume of substitution effects of 20%. This assumes that a proportion of the positive employment impacts experienced by participants are obtained at the expense of non-participants. This assumption decreases the results, as some of the previously stated benefits are now substituted.
Additionality
In the baseline, we assume that 50% of output produced during the Kickstart placement is additional. This is an important assumption as it highlights that although Kickstart was aimed at getting young people into sustainable employment beyond the scheme, it also provided a benefit to employers who participated in Kickstart at the time. Given the uncertainty of this assumption, a higher and lower bound of 100% and 30% have been used as scenarios to test to the robustness of the results. The results increase/decrease depending on whether this assumption is set at the upper/lower bound.
Percentage on UC
The baseline results assume that the proportion of individuals claiming UC beyond two years is static, at roughly 40%. However, given the trajectory of early cohorts, this is likely to be an overestimate for longer term results. Therefore, a scenario has been produced that assumes the proportion claiming UC decreases as time progresses, based on forecasting forward the changes up to the two year mark. This has a small positive impact on the results.
Distributional Effects
The baseline results assume that distributional impacts are present. This assumption is based on the marginal utility of income theory, stating that those on lower incomes are likely to benefit more from earning an extra pound, compared to those on higher incomes. This approach is in line with Green Book guidance and given that those who went on Kickstart are at the lower end of the income scale, this assumption is likely to hold. However, as a sensitivity, this assumption has been excluded. It has a significant downward impact on the results. This is because distributional effects assume that marginal changes in income affect the income distribution evenly, and so Kickstart participants mostly do not see a redistributive benefit.
Charts 4.1 and 4.2 show the results of these sensitivity scenarios for the Exchequer and society perspectives at the 2 year mark. Each assumption is presented in isolation to highlight the specific impact it has on results. The Exchequer results show very little change due to the nature of the assumptions used. Most of the assumptions address wider societal impacts such as additionality or distributional impacts. Other scenarios only impact later years, so changes at two years will be zero. The only scenario that impacts the Exchequer CBR is the inclusion of substitution effects. However, at the 2 year mark, most of the Exchequer benefit is through the removed benefit receipts during the Kickstart placement, which is not subject to substitution effects. Other elements such as tax revenue are impacted by this assumption, but the overall impact of including this assumption is negligible at this point.
The societal impacts fluctuate more. Most scenarios are now above £1, and assuming that additionality during the scheme was 100% rather than 50% raises the CBR to £2.06. On the other hand, a lower additionality of 30% only reduces the CBR from £1.18 to £0.83, and the strong assumption of assuming no distributional impact only lowers to the CBR to £1.06 at this point. Some scenarios do not impact the results at two years because they only affect later years.
Chart 4.1: Sensitivity analysis of Exchequer CBRs at two years

| Fiscal - 24 months | |
|---|---|
| Baseline | £0.27 |
| Substitution Effects (20%) | £0.27 |
| 30% Additionality | £0.27 |
| 100% Additionality | £0.27 |
| 25% Decay | £0.27 |
| No Decay | £0.27 |
| Lower % on UC | £0.27 |
| No Distributional Impact | £0.27 |
Chart 4.2: Sensitivity analysis of Social CBRs at two years

| Social - 24 months | |
|---|---|
| 30% Additionality | £0.83 |
| No Distributional Impact | £1.06 |
| Substitution Effects (20%) | £1.11 |
| Baseline | £1.18 |
| No Decay | £1.18 |
| 25% Decay | £1.18 |
| Lower % on UC | £1.18 |
| 100% Additionality | £2.06 |
Charts 4.3 and 4.4 show the results of these sensitivity scenarios for the Exchequer and society perspectives at the five year mark. For the Exchequer impact, the trend is similar to the two year results. Most assumptions have no impact. However, the substitution effect scenario and the 25% decay scenario slightly lower the CBR. Those scenarios that did not affect the results until post two years now have a slightly positive impact, with the no decay scenario raising the CBR to £0.49 from £0.50.
The societal CBR is much more sensitive to changes in assumptions, than the Exchequer CBR. The societal CBRs are above £2 at the five year mark. Removing distributional impacts reduces the CBR from £3.15 to £2.23. Assuming a lower proportion on UC at the five year mark increases the CBR slightly to £3.36. The no decay scenario raises the CBR to £3.23. Given this is not an extremely optimistic scenario this shows that potentially Kickstart could be providing far more benefits overtime than the baseline model would suggest. Finally, assuming 30% additionality only lowers the CBR from £3.15 to £2.81, while raising it to 100% raises the CBR to £4.02. The additionality assumptions have a smaller impact on the five year results, as the additional impact of Kickstart placements is locked in after the first six months. Any output gained as a result of participants moving into unsubsidised employment is assumed to be 100% additional and provides longer term social benefits.
Chart 4.3: Sensitivity analysis of Exchequer CBRs at five years

| Fiscal - 60 months | |
|---|---|
| Substitution Effects (20%) | £0.44 |
| 25% Decay | £0.45 |
| Baseline | £0.49 |
| No Distributional Impact | £0.49 |
| 30% Additionality | £0.49 |
| 100% Additionality | £0.49 |
| No Decay | £0.50 |
| Lower % on UC | £0.51 |
Chart 4.4: Sensitivity analysis of Social CBRs at five years

| Social - 60 months | |
|---|---|
| No Distributional Impact | £2.23 |
| Substitution Effects (20%) | £2.47 |
| 25% Decay | £2.77 |
| 30% Additionality | £2.81 |
| Baseline | £3.15 |
| No Decay | £3.23 |
| Lower % on UC | £3.36 |
| 100% Additionality | £4.02 |
5. Conclusions
5.1 Impact Analysis
The analysis uses an ATE approach to compare outcomes between Kickstart participants and other 16 to 24 UC Searching for Work claimants who did not start a placement. This methodology allows us to compare similar groups of people directly against each other. The analysis uses a large number of characteristic variables to control for different demographic traits that could influence labour market outcomes outside of Kickstart. The aim of this analysis is to assess the direct impact of the Kickstart intervention.
The central results find that for every 100 people that went on Kickstart, an extra 11 would be in employment two years after their start date versus 100 people who didn’t start who had very similar characteristics. We also find that an additional three people would move off UC for every 100 people that went on Kickstart.
The longitudinal results show that the employment outcomes are consistent from month eight onwards. Results appear to be consistently high up to two years, and do not appear to diminish during this period. Benefit outcomes are also consistent but are improving over time.
A number of sensitivity tests were performed to check the validity of these results. The impacts appear to be is consistently strong across different methodological changes, showing that the central results are robust. The referred not started group have better labour market outcomes than non-referrals, which could suggest a selection bias issue. It may be that being referred to the scheme could lead to a treatment effect without starting a placement. However, there is no evidence to suggest this, and as shown in Chart 2.1 a referral was simply an administrative step to allow the participant to apply for roles, rather than receiving any additional benefit to non-referrals. The discrepancy in outcomes is likely because non-referrals have additional labour market barriers that make them unsuited to Kickstart, and therefore may have worse outcomes over the same tracking period.
Section 2.5.1 discusses the possibility of selection bias between the treatment group and referred not started. There is a risk that employers were able to select participants with more favourable non-observable traits that improved their labour market outcomes, for example enthusiasm and work ethic. However, qualitative evidence found that the risk of this was low, given that the key barrier to filling vacancies was a lack of candidates, rather than any evidence of having to be too selective.
Kickstart has had a consistently strong impact on different sub groups. Most groups have a similar propensity to move into employment overall, either through the benefit of Kickstart or from wider labour market impacts. Certain groups are less likely to move into work without the benefit of Kickstart, and in general these groups benefit more from Kickstart than other groups. As a result, Kickstart appears to have a levelling up effect, by having a greater impact on groups to bring overall outcomes in line with other sub groups.
5.2 Cost Benefit Analysis
Using the estimated impacts, a CBA was done to estimate the cost effectiveness of the scheme over time, both at two years, and over five years.
The scheme was examined from the participant, employer and Exchequer perspectives, as each would value costs and benefits differently. These perspectives were then summed together to get an overall society perspective that reflects all three. At the two year mark, for every pound invested:
- Participants benefit by £2.75
- Employers benefit by £1.34
- The Exchequer benefits by £0.27
- Society benefits by £1.18, with a sensitivity range of £0.83 to £2.06
Sensitivity analysis on the Exchequer and society perspectives show that these results are consistent across various assumptions. The exchequer costs include all wages paid to participants, whereas society only includes these as a transfer payment. This is a large portion of the cost, so this discrepancy leads to a significant difference in results between these perspectives.
Performance up to two years is consistent and there is no evidence to suggest this would not continue. The results have been extrapolated up to 5 years, and for every pound invested:
- Participants benefit by £3.20
- Employers benefit by £1.23
- The Exchequer benefits by £0.49, with a sensitivity range of £0.44 to £0.51
- Society benefits by £3.15, with a sensitivity range of £2.23 - £4.02
It is important to reiterate that the accuracy of the cost and benefit estimates is very much dependent on the robustness of the impact estimates from which they are derived and the validity of the assumptions upon which they are based. It should also be borne in mind that a number of potentially significant costs and benefits have been excluded from this analysis due to a lack of robust evidence. These include non-pecuniary benefits from Kickstart participation such as improved motivation, or the costs of future training schemes.
References
Caliendo, M., Mahlstedt, R. & Mitnik, O., 2014. ‘Non-observable but unimportant? The influence of personality traits (and other usually unobserved variables) for the evaluation of labour market policies’ IZA.
Fujiwara D. ‘The DWP Social Cost-Benefit Analysis framework (WP86)’ Department for Work and Pensions working paper 86, 2010.
Hillmore, A., Marlow S., Ainsworth P. ‘Impacts and Costs and Benefits of the Future Jobs Fund’ Department for Work and Pensions Ad-hoc statistical analysis, 2012
HM Treasury, ‘The Green Book: appraisal and evaluation in central government’, 2022
IFF on behalf of Department for work and Pensions, Kickstart Scheme – Process Evaluation, 2023
-
Fujiwara D. ‘The DWP Social Cost-Benefit Analysis framework (WP86)’ Department for Work and Pensions working paper 86, 2010. ↩
-
Equality analysis for the Kickstart Scheme – GOV.UK (www.gov.uk) ↩
-
Conditionality refers to the work related activities claimants are required to do in order get full entitlement for a Universal credit claim. More information can be found here – Conditionality Regime (dwp.gov.uk) ↩
-
Kickstart Scheme: process evaluation – GOV.UK (www.gov.uk) ↩
-
Kickstart Scheme: process evaluation – GOV.UK (www.gov.uk) ↩
-
Caliendo, M., Mahlstedt, R. & Mitnik, O., 2014. Non-observable but unimportant? The influence of personality traits (and other usually unobserved variables) for the evaluation of labour market policies.. IZA. ↩
-
Microsoft Word - Impacts and costs and benefits of the FJF_final.doc (publishing.service.gov.uk) ↩
-
Only includes education data from ages 14 and over. Therefore if somebody displayed any of these flags under the age of 14, they would not be counted in these statistics. Requirement as part of data sharing agreement with Department for Education who own this data. ↩
-
Equivalent to achieving an A*-C (9-4) grade at GCSE in both English and Maths. A full breakdown of qualifications at different levels is available here – What qualification levels mean: England, Wales and Northern Ireland - GOV.UK (www.gov.uk) ↩
-
Characteristics of children in need, Reporting year 2022 – Explore education statistics – GOV.UK (explore-education-statistics.service.gov.uk) ↩
-
15% level based on data collected – Statistics: pupil attendance and absence - GOV.UK (www.gov.uk) ↩
-
Rubin’s B and R summarise the covariate balance of the sample. B measures absolute difference in the mean propensity scores between the treatment and comparison group, and should be under 25 to satisfy a balanced sample. R measures the ratio of treatment to comparison variances of the propensity scores, and should be between 0.5-2 to satisfy a balanced sample. ↩
-
As part of NAO report into Kickstart, recommendation O states: To support public and Parliamentary accountability, and long-term value for money the Department should ensure it is transparent by – Monitoring Kickstart’s impact over at least the five years on which its original business case assumptions are based; Employment support: The Kickstart Scheme (nao.org.uk) ↩
-
Caliendo, M., Mahlstedt, R. & Mitnik, O., 2014. Non-observable but unimportant? The influence of personality traits (and other usually unobserved variables) for the evaluation of labour market policies. IZA. ↩
-
Sums may not add up due to rounding. Unrounded figures have been used in analysis ↩
-
The DWP Policy Simulation Model is a microsimulation model which combines data from the Family Resources Survey with information on the UK tax and benefit systems. This allows users to estimate the changes in benefit payments and tax revenue that occur when unemployed individuals with a given set of characteristics move into work. ↩
-
In order to estimate increases in indirect tax revenue, Office for National Statistics estimates of indirect tax burdens were applied to estimates of participants’ disposable income obtained from the DWP Policy Simulation Model. ↩
-
Fujiwara (2010) presents evidence of a causal relationship between individuals’ employment status and NHS usage ↩
-
Kickstart Scheme – Process Evaluation (publishing.service.gov.uk) ↩
-
[Withdrawn] Kickstart Scheme for gateways – GOV.UK (www.gov.uk) ↩