Influence of bollards on pedestrian evacuation flow (TAL 01/16)
Updated 23 November 2017

© Crown copyright 2017
This publication is licensed under the terms of the Open Government Licence v3.0 except where otherwise stated. To view this licence, visit nationalarchives.gov.uk/doc/open-government-licence/version/3 or write to the Information Policy Team, The National Archives, Kew, London TW9 4DU, or email: psi@nationalarchives.gov.uk.
Where we have identified any third party copyright information you will need to obtain permission from the copyright holders concerned.
This publication is available at https://www.gov.uk/government/publications/influence-of-bollards-on-pedestrian-evacuation-flow-tal-0116/the-influence-of-bollards-on-pedestrian-evacuation-flow
Introduction
Bollards are a common design of Vehicle Security Barrier (VSB) surrounding crowded spaces, in particular busy rail and underground stations, airports and many key commercial and public buildings. This approach reduces the vehicle-borne threat to both people (from a vehicle as a weapon attack) and buildings (from a vehicle delivering a large explosive device) by enforcing stand-off. Guidance on the general implementation of bollards as a VSB around busy buildings, highlighting the general arrangements and considerations for designers, is available in Traffic Advisory Leaflet (TAL) 02/13 Bollards and Pedestrian Movement (ref 1).
This TAL provides additional guidance, based on full-scale evacuation experiments conducted by the Fire Safety Engineering Group (FSEG) of the University of Greenwich, to inform the owners, operators, designers and project managers in the planning and design of bollard VSB schemes that minimise the impact on pedestrian flow.
Key design factors
There are a number of factors that may influence the impact of bollard arrays on evacuation flow. These can be categorised into 3 types:
Bollard array configuration: stand-off distance to bollards, air gap between bollards, the width of the bollard array, the relative positioning of bollards relative to the exit, and the height of the bollards. Bollard array configuration factors can generally be controlled by careful installation of the bollard array; however, they can also be constrained by the nature of the site in which they are installed.
Site: exit width, presence of other obstacles within exit paths, presence of stairs in exit paths, amount of available space beyond the exit and the nature of the space beyond the bollards. For example, pedestrian walkways or roads crossing the exist paths. Site factors are imposed by the setting and must be taken into consideration when designing the bollard array installation.
Population: the population density, demographics, level of encumbrance (for example, hand bags, luggage, push chairs, bicycles) and individual objectives beyond the bollards. Population factors are generally imposed by the nature of the building that the bollard array is protecting and so must be taken into consideration when designing the installation.
To better understand and quantify how these factors influence and impact pedestrian movement during an evacuation, a series of full-scale evacuation experiments were conducted.
The experiments
The experiments were conducted over 5 days in 2 trial campaigns, involving 896 volunteers in 95 trials (ref 2 and 3). Participants were recruited from the public with ages ranging from 18 to over 51 years of age, with a gender mix of 47% males and 53% females.
Trials were conducted with and without a bollard array so that the impact of the array could be measured (Figure 1). Each bollard within the array had an outer diameter of 225mm and a height of 1.0m (Figure 2). The spacing (air gap) between bollards was 1.2m. The bollards had a brushed aluminium appearance with a black band near the top.

Overview of experimental bollard setup and detailed view of the aluminium bollard used in the experiment
The following experimental conditions were considered by the trial to test the effect of varying Configuration, Site and Population factors (examples of trial set-ups are shown in Figures 3, 4 and 5):
- stand-off distance: 0m, 1m, 2m, 3m, 6m
- exit width: 2.4m, 3.5m, 4.5m
- site: clear exit path; exit into a cross flow
- density (of crowd): 3p/m2 and 4p/m2 (4p/m2 is the maximum engineering design density in the UK)
- encumbrance: 0%, 40%, 60% (encumbrance consisting of handbags, satchels, small and large roller bags, pushchairs and bikes)
- access (beyond the exit): clear exit path, exit into a cross flow
Not all combinations of each condition was tested. Further details of the experiments can be found in the full reports.
Each experimental set-up was repeated a minimum of 3 times to reduce the impact of random fluctuations in participant performance. Trial data was collected from video footage captured by four cameras trained on the exit point and the bollard array. The analysis of the trial results was based on a mean average of the data extracted from the 3 repeats.
Results suggested that with an initial population density of 3p/m2, the impact of the bollard array on the evacuation exit flow was insignificant. The guidance presented here is based on the findings of the higher crowd density of 4p/m2.
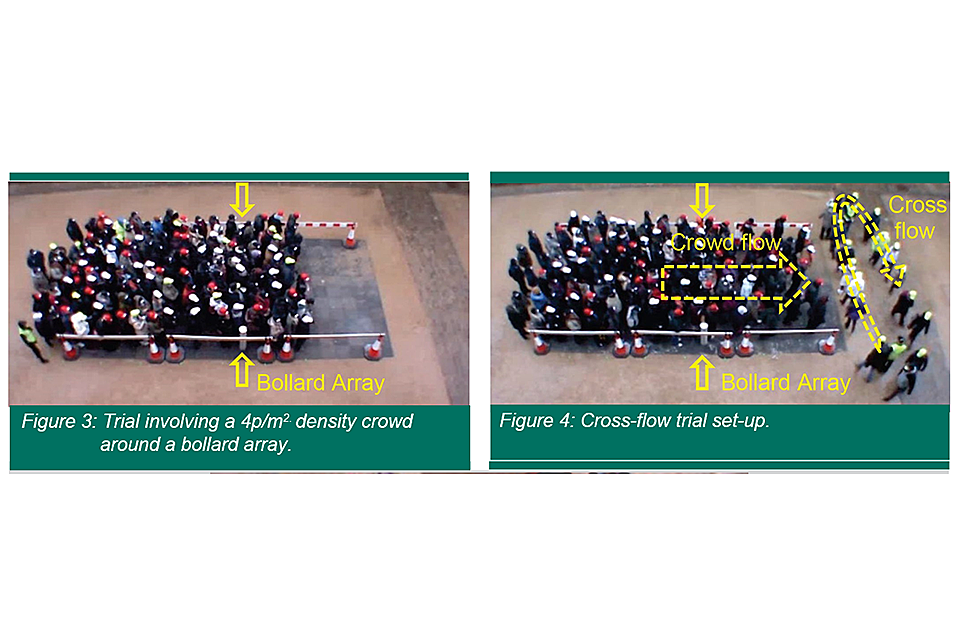
Trial of crowd movement through a bollard array, showing the effect of cross flow
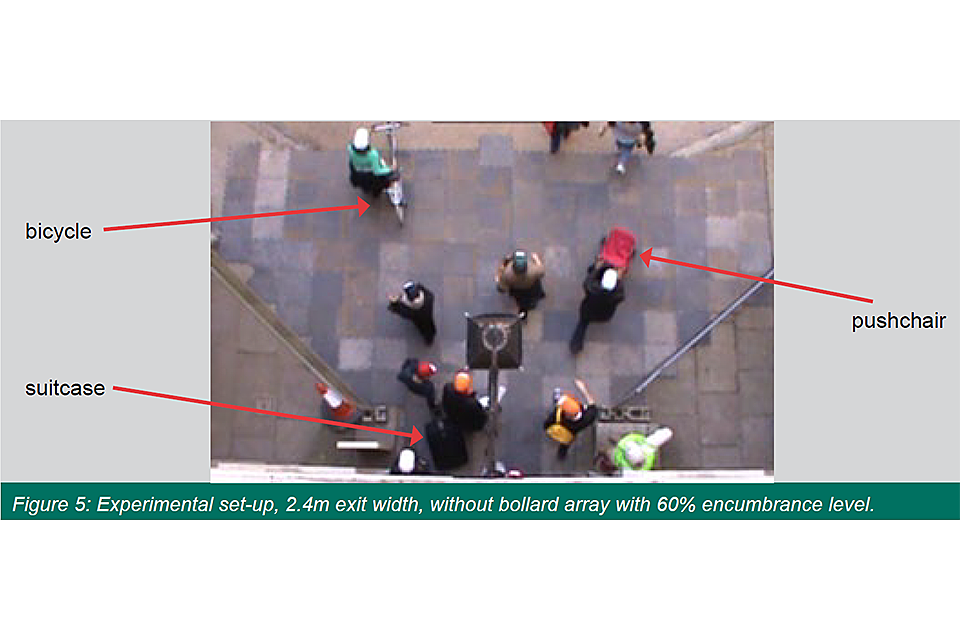
Experimental set-up with 2.4 metre exit width, without bollard array with 60% encumbrance level. Pedestrians with a bicycle, suitcase and pushchair in the experiment group.
Guidance
The following recommendations aim to help designers plan the location and arrangement of bollards to meet security and operational needs while minimising any negative impact on egress safety. Where appropriate the following guidance should be considered:
Crowd diffusion and bollard array width
As a high density (4p/m2) evacuation flow passes through an exit it naturally diffuses into the surrounding space (Figure 6a). The degree of diffusion increases with distance from the exit (Figure 6) and is accentuated by the presence of a bollard array (Figure 6b).
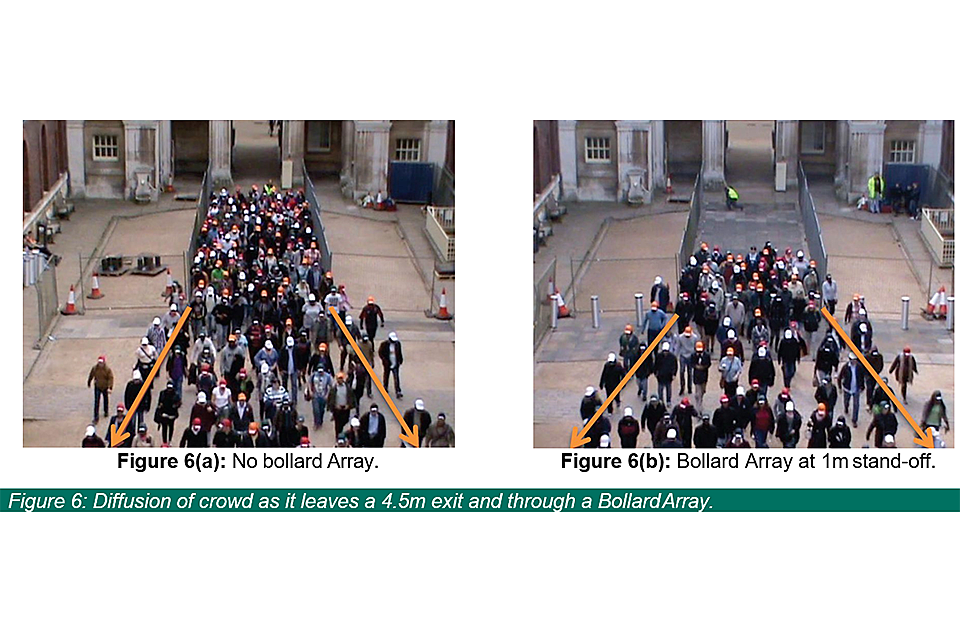
Two images showing movement of a crowd leaving a 4.5 metre exit with and without a Bollard Array.
Recommendations
When positioning bollards in an array at an exit point, it is important that the bollard array does not constrain the natural tendency for the crowd to spread out (or diffuse) as this may lead to a reduction in the exit flow. Therefore, to avoid this, the bollard array width would need to be greater than that of the exit.
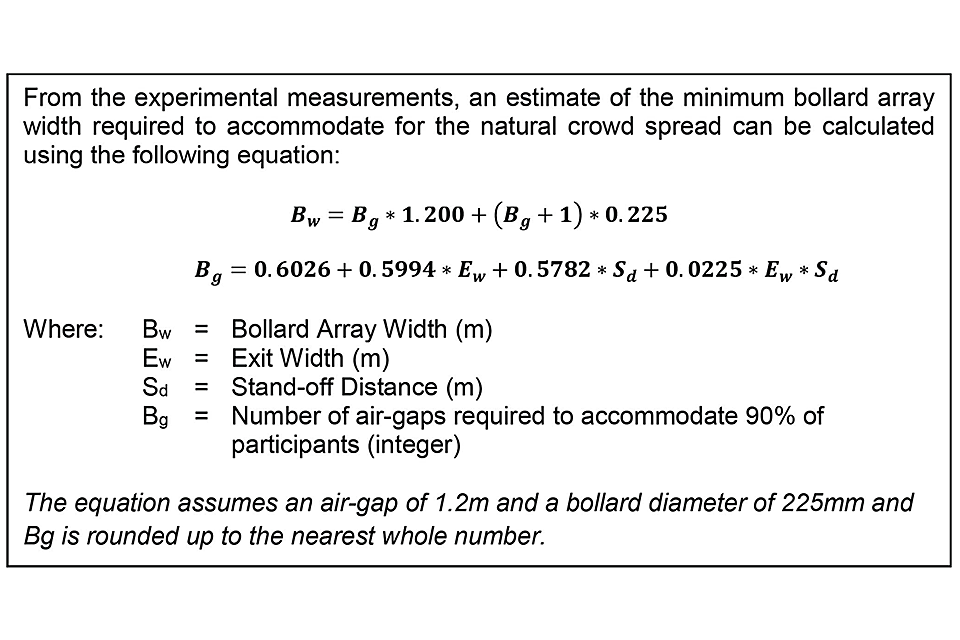
From the experimental measurements, an estimate of the minimum bollard array width required to accommodate for the natural crowd spread can be calculated using an equation.
This relationship can be used to estimate the minimum width of a bollard array required for a given exit width and stand-off distance in order that the exit flow is not constrained. The correlation is based on experimental data concerning bollard array gap usage for the three exit widths (2.4m, 3.5m and 4.5m) and the three stand-off distances (1m, 2m and 3m) examined, for bollard array configurations where a bollard is not placed on the symmetry axis of the exit (Figure 7).
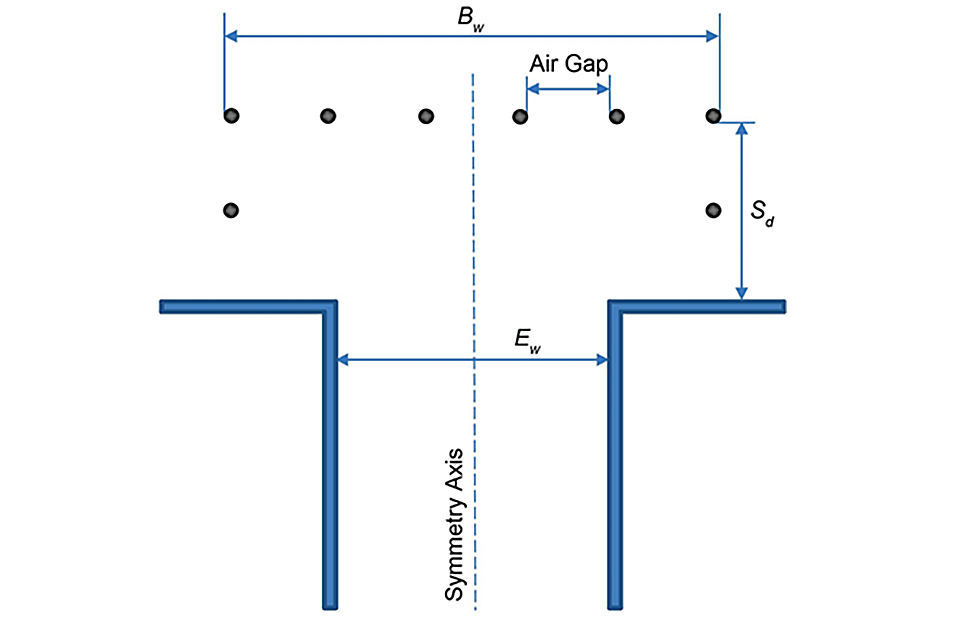
Diagram showing bollard array arrangement around an exit
Impact of bollard array on exit flow
The presence of bollards around an exit will result in a reduction in evacuation flow through emergency exits and should be taken into consideration in emergency planning. However, careful positioning of bollards can minimise the negative impact. The observed maximum reduction in exit unit flow was less than 10% for exits up to 4.5m in width, with stand-off distances from 1m to 6m.
Generally, as the stand-off distance increases the negative impact of a bollard array on exit unit flow decreases, with the maximum observed degradation occurring at a stand-off distance of 2m.
For the 4.5m exit width, placing the bollards symmetrically around the symmetry axis of the exit results in four bollards being positioned within the exit opening (Figure 8 and Figure 9a) - the configuration tested in the trials. However, had the bollards been positioned with a bollard placed on the exit symmetry axis (Figure 9b) this would have reduced the number of bollards positioned within the exit opening to only three, a configuration expected to result in less disruption to exit flow.
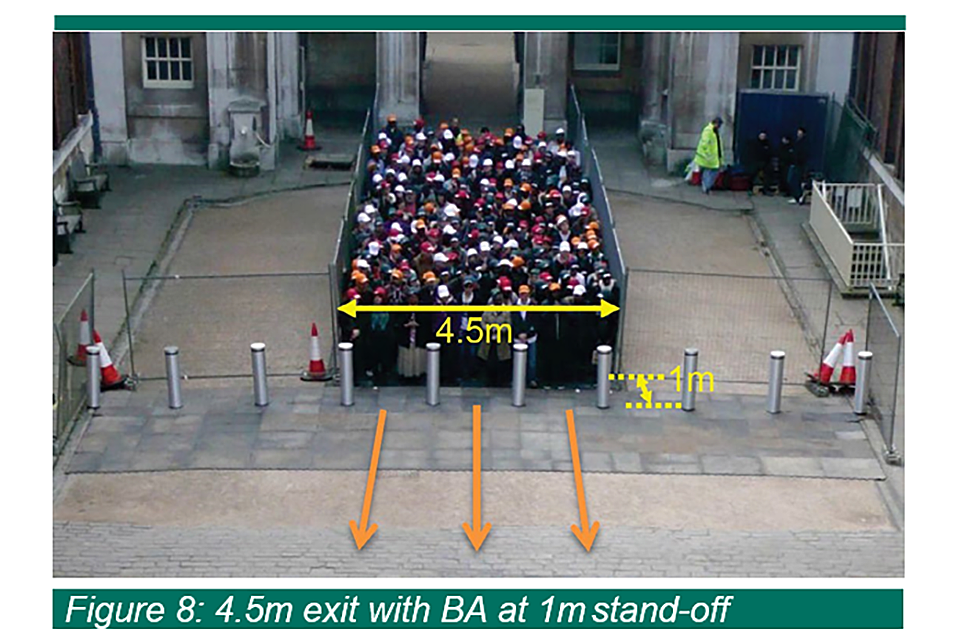
Crowd movement through 4.5 metre exit with bollard array
Recommendations
Where possible stand-off distances between 1m and 3m should be avoided (maximum degradation observed when stand-off distance was 2m). Generally, as the exit width increases, the degradation in the exit unit flow increases. However, based on the results observed, it is not expected that the degradation of exit unit flow with the exit width will continue beyond exits widths of 4.5m. If correct, the maximum impact on exit flow may be a degradation of around 10%.
Where possible, if bollard arrays are to be positioned within 1m of the exit, the bollard array should be positioned in a way that minimises the number of bollards within the expanse of the exit opening (Figure 9).
In order to ensure that the minimum number of bollards are positioned within the expanse of the exit opening, it is recommended that the configuration should be determined from the centre of the exit working outwards.

Alternative bollard configurations for a 4.5 metre wide exit
Impact of bollards in exit opening (0m stand-off) and passenger encumbrance
When a single bollard was placed in the centre of the 2.4m wide exit, reducing the effective exit width by 9.4% (Figure 10), the resulting exit flow for a non-encumbered crowd only decreased by 1% in comparison to the case where there was no bollard.
However, where pedestrians are heavily encumbered (60% of the pedestrians encumbered) the pedestrian flow rates saw a reduction of 17% when there was no bollard, and almost a 20% reduction with a bollard.
The combined effect of high levels of encumbrance and the presence of a bollard was observed to reduce exit flows by almost 20% when compared to the unencumbered case with no bollard. The bollard only contributes 3% to the total reduction in flow rate. Designers of bollard array schemes should take account of the level of encumbrance of the pedestrians through the exit.
Recommendation
If normal operators of the facility suggest the occupants are likely to be heavily encumbered, consider alternatives to placing a bollard array within the exit opening.
Impact of bollard array in a corridor
When a bollard array is placed across an exit path such as a corridor (Figure 3), the reduction in evacuation flow through the bollard array is considerably less than would be expected considering the reduction in effective width of the passage. In particular, for a 4.5m wide corridor with four bollards placed across its width (reducing the effective corridor width by 20%), the high density unencumbered flow through the bollard array was reduced by only 8.1% compared to the case without bollards.
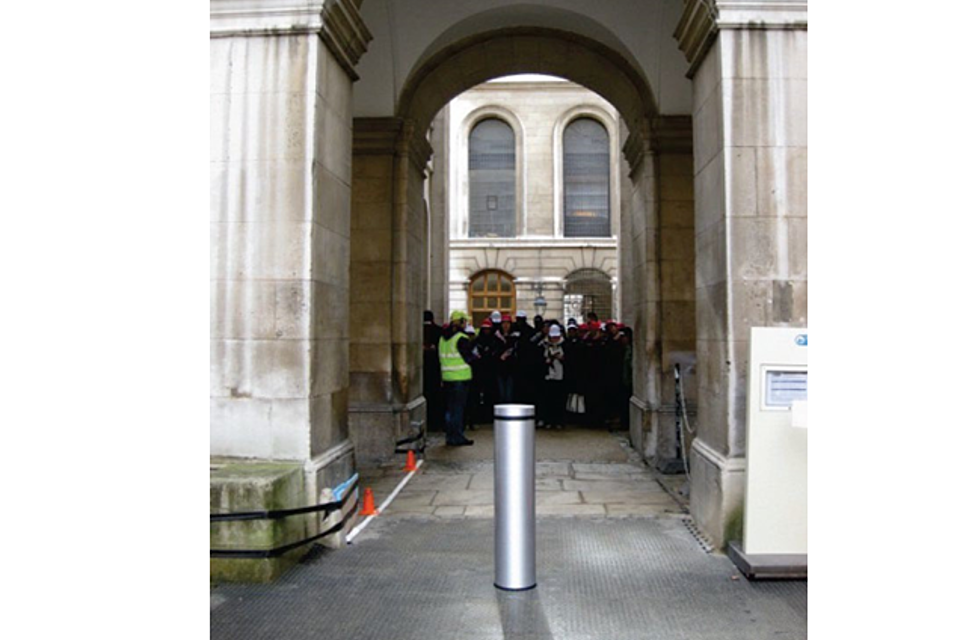
Figure 10: bollard placed within exit opening (0m stand off)
Recommendation
Placing a bollard array within the confines of a corridor will result in only a moderate reduction in flow. While not tested, it is suggested, as with the case with a bollard placed at 0m stand-off, that if the population of pedestrians using the corridor is expected to be heavily encumbered, avoid placing a bollard array within the corridor.
Impact of other pedestrians on bollard array flow
The greatest impact on pedestrian flow through a bollard array resulted from the interaction of the exit flow with cross-walkers (Figure 4). This situation saw pedestrian flow reduce by up to 21% when compared to the situation without cross-walkers. In evacuation situations from stations located on busy streets, it is likely for there to be quite high cross-flows which could have a significant impact on bollard array flow. The severity of the cross-flow influence on exit flow is likely to be affected by cross- walker stand-off distance and flow density and may be amplified by the presence of a bollard array.
Recommendation
In the case of an incident, it is extremely important for the station management to understand and, if possible, manage pedestrian flow immediately outside the station, regardless of whether bollard arrays are present. This might be achieved by the use of procedural measures (for example, staff and notification systems) to cordon off the exit path from the station and divert non-evacuating pedestrians and also through co-ordination with authorities managing the conditions outside the station.
Further observations
A number of observations relating to exit flow were noted, and while not relating to flows associated specifically with bollard arrays, are nevertheless important to the safe management of any crowded space.
Emergency exit flows may be strongly affected by modest changes in ambient environmental conditions. The possibility to reduce exit flows resulting from colder conditions should be considered when designing egress systems.
When using multi-agent evacuation modelling tools or other analysis approaches to assess evacuation capabilities of buildings, it may be necessary to reduce imposed exit flow to take into consideration the impact of:
- adverse weather conditions
- pedestrians encumbered with luggage
- cross-walkers
Glossary
The following terms are often used in describing pedestrian movement in both normal and emergency conditions, and in describing the bollard array:
1) Flow – the rate at which pedestrians pass through a space during a defined period of time. The “flow” is a measure of the number of people passing a fixed line in a given time interval, measured in people per minute (p/min) or people per second (p/sec). For a given width of path the flow is a function of the speed and density of the crowd, and the width of the path.
2) Density – the number of pedestrians occupying a given area of space. The “density” is measured in people per square metre (p/m2), with the upper limit of acceptable pedestrian density defined as 4p/m2 in most building regulations (ref 4 and 5). Above this density free movement is typically reduced to a stagger and so is to be avoided.
3) Unit Flow - is a measure of “flow” which is independent of path width, and is measured in people per minute per metre (p/min/m) or people per second per metre (p/sec/m). Unit flow is used to assess whether the speed and density of pedestrian movement remains within acceptable levels. For design calculations, an upper limit for pedestrian unit flow is 1.33p/sec/m (ref 4).
4) Bollard Array Air Gap – the relative spacing of the bollards in a bollard array as measured from the inner edge of a bollard to the inner edge of the neighbouring bollard. The maximum recommended air-gap is 1.2m (Figure 7).
5) Bollard Array Stand-off distance (Sd) – the distance, measured in metres, of the bollard array from the exit point (Figure 7).
6) Bollard Array Width (B) – the overall extent of the bollard array as measured from the outer edges of the outer most bollards placed across the exit opening (Figure 7).
References
1) Traffic Advisory Leaflet 02/13, Bollards and Pedestrian Movement, May 2013 (as revised September 2017), DfT and CPNI.
2) Galea, E.R., Gwynne, S. Cooney, D., Sharp, G.G., Impact of Hostile Vehicle Mitigation Measures (Bollards) on Pedestrian Crowd Movement. FSEG University of Greenwich report for the CPNI and DfT, 22 August 2013.
3) Galea, E.R., Cooney, D., Xie, H., Sharp, G.G., Impact of Hostile Vehicle Mitigation Measures (Bollards) on Pedestrian Crowd Movement - 2. FSEG University of Greenwich report for the CPNI and DfT, 19 October 2014.
4) HMSO, The Building Regulations 1991 - Approved Document B, section B1, HMSO Publications, London.
5) Fruin, J., Pedestrian planning and design, Metropolitan Association of Urban Designers and Environmental Planners, New York, 1971.
Recommended further reading
- TAL 02/13, Bollards and Pedestrian Movement, May 2013 (as amended October 2017), DfT and CPNI
- IWA 14-2: Vehicle security barriers. Application. ISO
- PAS 69: Guidance for the selection, installation and use of vehicle security barriers. BSI
- PAS 170-1: Vehicle security barriers. Low speed impact testing. Trolley impact test method for bollards. BSI
- Integrated Security: A Public Realm Design Guide for Hostile Vehicle Mitigation – 2nd Edition. CPNI
- Security in Design of Stations (SIDOS) Guide. DfT/CPNI/British Transport Police
- DfT: making transport accessible for passengers and pedestrians
Contacts
Protective security advice and a range of appropriately resilient vehicle security barriers or structural elements for embedding in the public realm are available from specialists at the UK Government’s Centre for the Protection of National Infrastructure (CPNI) or via the local police Counter Terrorism Security Adviser (CTSA).
- Centre for the Protection of National Infrastructure (CPNI)
- Department for Transport land security
- Home Office
- National Counter Terrorism Security Office (NaCTSO)
Acknowledgements
Produced by the Department for Transport in collaboration with CPNI.