Inclusive Transport Strategy scorecard year 4 (2022 to 2023): background information
Updated 29 May 2025

© Crown copyright 2025
This publication is licensed under the terms of the Open Government Licence v3.0 except where otherwise stated. To view this licence, visit nationalarchives.gov.uk/doc/open-government-licence/version/3 or write to the Information Policy Team, The National Archives, Kew, London TW9 4DU, or email: psi@nationalarchives.gov.uk.
Where we have identified any third party copyright information you will need to obtain permission from the copyright holders concerned.
This publication is available at https://www.gov.uk/government/publications/inclusive-transport-strategy-scorecard/inclusive-transport-strategy-scorecard-background-information-and-accompanying-infographics
The Inclusive Transport Strategy (ITS) sets out our plans to make our transport system more inclusive and travel easier for disabled people. Our vision is for disabled people to have the same access to transport as everyone else. They will travel confidently, easily and without extra cost.
We commissioned the National Centre for Social Research (NatCen) to carry out an evaluation of the ITS. This scorecard formed part of its overall evaluation and monitored change in metrics relating to disabled people’s travel between 2019 and 2023.
The scorecard consists of a table of 23 different metrics. You can find this on the homepage of this guidance. Here we provide background information and accompanying infographics on the final scorecard year (2022 to 2023). This is intended to be viewed alongside the scorecard table. A summary of changes across all 4 years can be found in the ITS Scorecard: Summary of key changes 2019 to 2023 page.
The data sources for each metric, as well as further information about the purpose and content of the scorecard can be found later on this page. Due to a combination of the COVID-19 pandemic[footnote 1] and changes to survey content[footnote 2], data collection was not possible for all 23 metrics used in the scorecard in all scorecard years. Because of this, the 2022 to 2023 scorecard does not display any data for metrics 7 to 10, 15, 16 and 18.
Theme 1: access to transport
The ITS aims to create equal access to transport for all. Disabled people should have the same access to transport as everybody else, be able to go where everyone else does and do so easily, confidently and without extra cost.
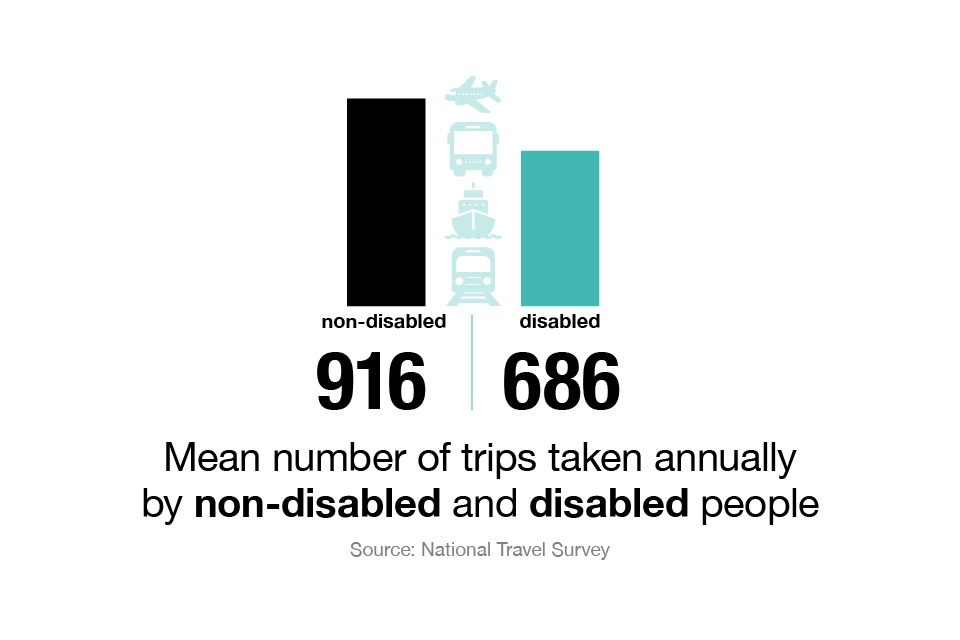
Mean number of trips taken annually by non-disabled people: 916.
Mean number of trips taken annually by disabled people: 686.
Source: National Travel Survey.
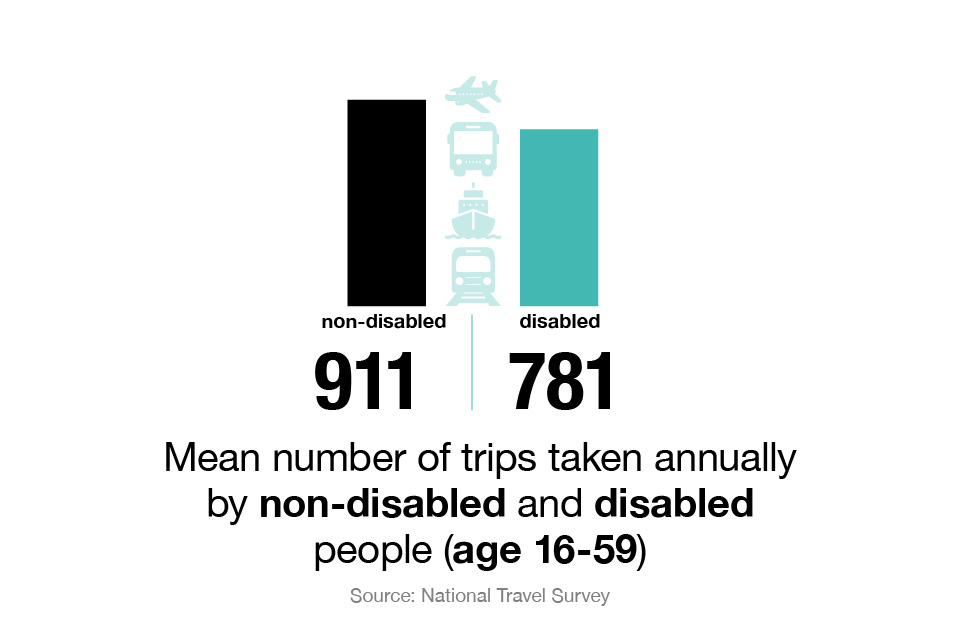
Mean number of trips taken annually by non-disabled people aged 16 to 59: 911.
Mean number of trips taken annually by disabled people aged 16 to 59: 781.
Source: National Travel Survey.
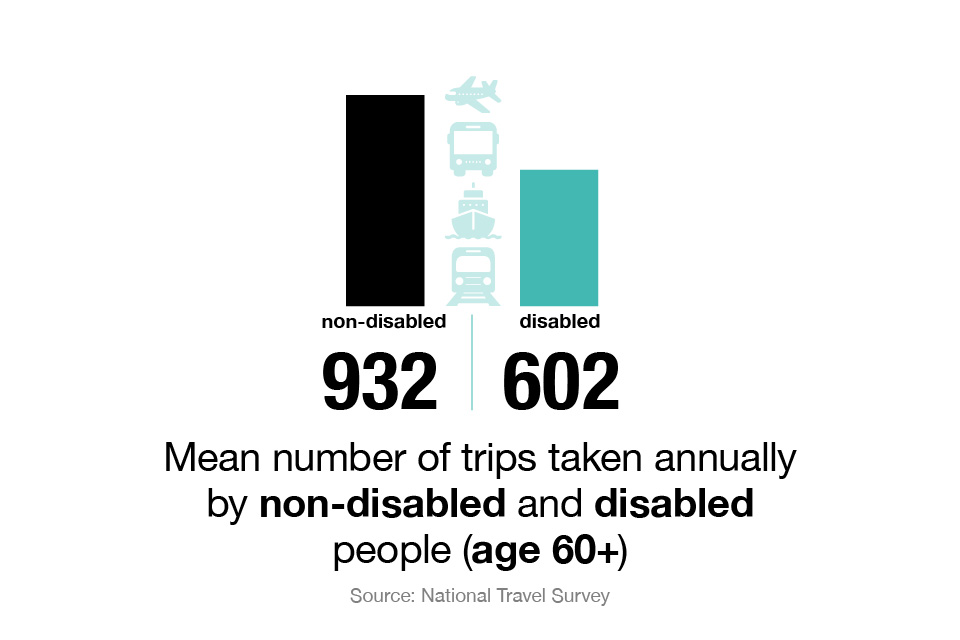
Mean number of trips taken annually by non-disabled people aged 60 or over: 932.
Mean number of trips taken annually by disabled people aged 60 or over: 602.
Source: National Travel Survey.
The infographics in theme 1 represent metrics 1 to 6 of the 2022 to 2023 scorecard[footnote 3].
Theme 2: travelling experience
The ITS aims to ensure disabled people receive a supportive travelling experience on all modes of transport. We believe budgets, training and resources should be directed to the areas and services that help provide the greatest improvements to the experience of disabled passengers.
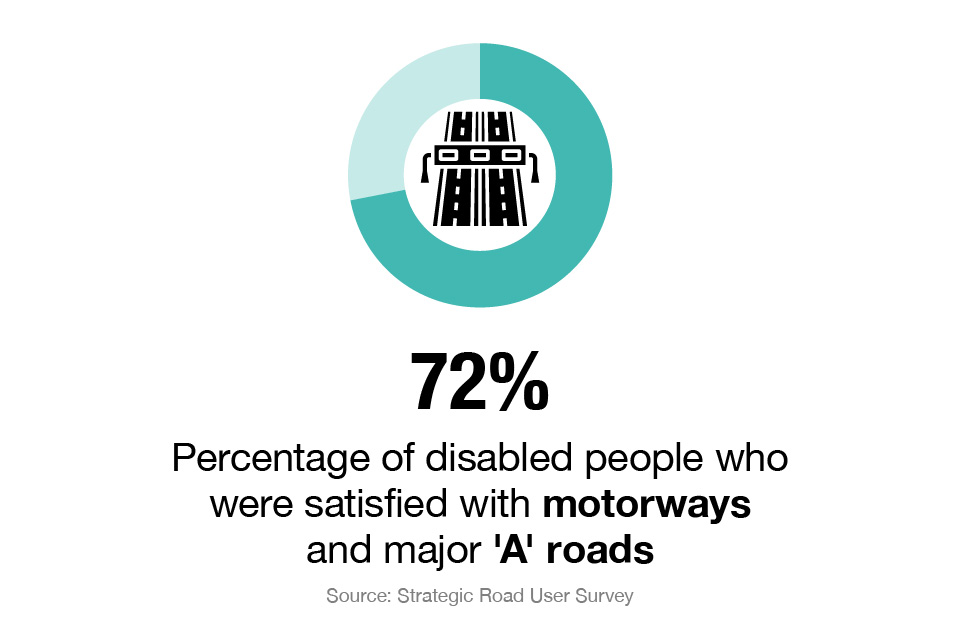
Percentage of disabled people who were satisfied with motorways and major ‘A’ roads: 72%.
This infographic represents metric 11 of the 2022 to 2023 scorecard[footnote 4].
Source: Strategic Road User Survey.
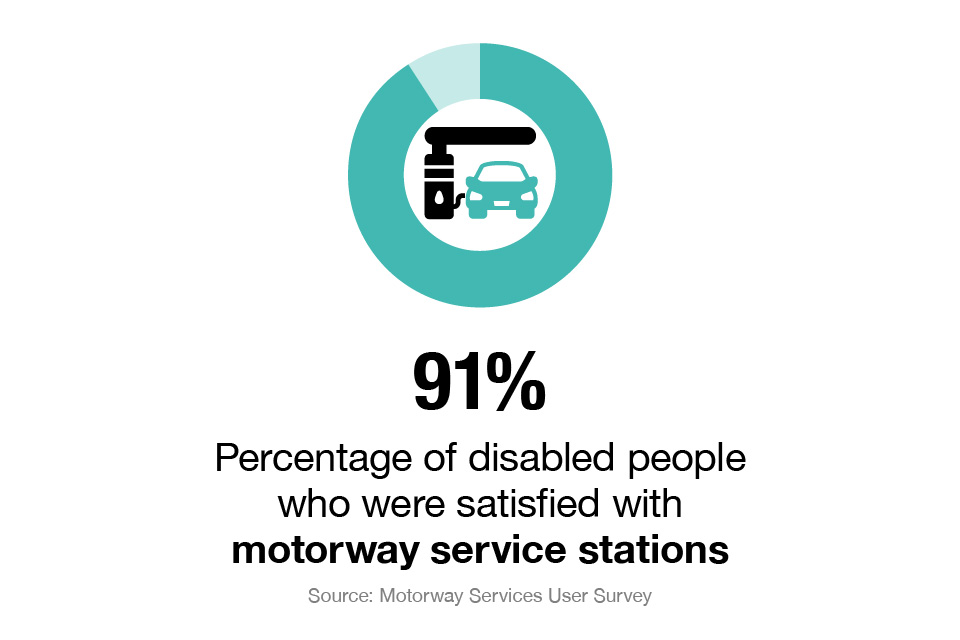
Percentage of disabled people who were satisfied with motorway service stations: 91%.
This infographic represents metric 12 of the 2022 to 2023 scorecard [footnote 5].
Source: Strategic Road User Survey.
It should be noted that, due to changes in survey methodology, data presented for metric 12 in the 2022 to 2023 scorecard year should not be directly compared with the data presented for previous scorecard years.
Theme 2 also draws on the following metrics:
- metric 7: percentage of disabled people who were satisfied with their bus journey (source: bus passenger survey)
- metric 8: percentage of disabled people who were satisfied with their train journey (source: National Rail passenger survey)
- metrics 9 and 10: percentage of disabled people who were satisfied with their ferry or cruise journey (source: Maritime and Coastguard Agency disabled passenger satisfaction survey)
It was not possible to obtain data for metrics 7 to 10 for the 2022 to 2023 scorecard as the surveys these metrics previously drew on were discontinued and the replacement surveys either did not contain equivalent questions or did not cover the 2022 to 2023 period.
However, the National Highways and Transport Network public satisfaction survey includes a similar survey metric to metric 7: satisfaction with local bus services overall. While this survey should not be directly compared with the bus passenger survey, it indicates that between the 2021 to 2022 and 2022 to 2023 scorecard years, satisfaction with local bus services among disabled respondents dropped from 60% to 55%.[footnote 6]
Theme 3: complaints
The ITS aims to raise awareness and enforcement of passenger rights so that disabled travellers know where to access information about their rights, the obligations of transport operators and how to raise complaints.
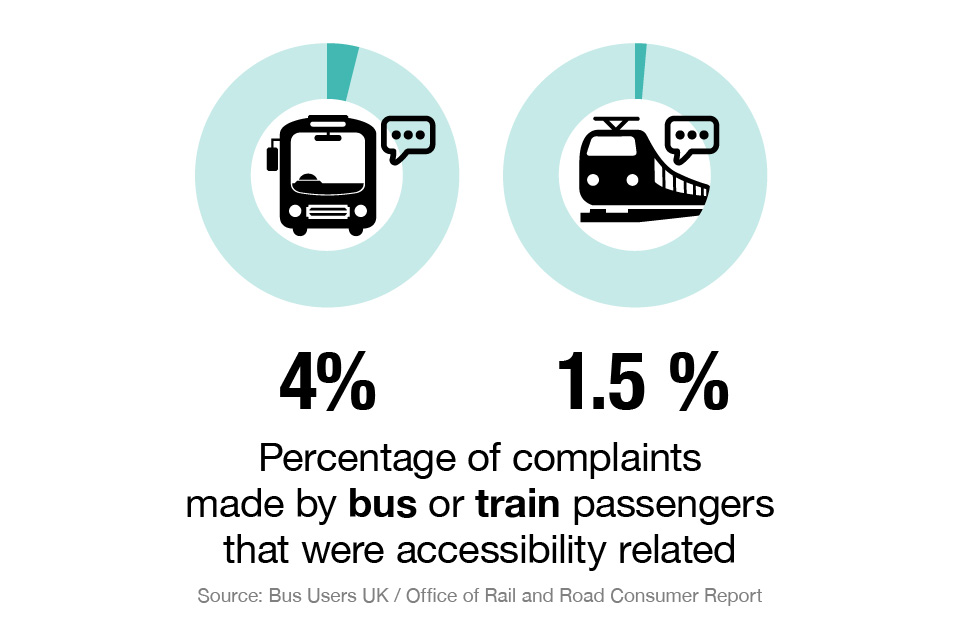
Percentage of complaints made by bus passengers that were accessibility-related: 4%.
Percentage of complaints made by train passengers that were accessibility-related: 1.5%.
Source: Bus Users UK/Office of Rail and Road consumer report.
This infographic represents metrics 13 to 14 of the 2022 to 2023 scorecard [footnote 7].
Theme 4: interactions with transport staff
The ITS aims to ensure that staff interactions become more consistent. Feedback from the government’s accessibility action plan consultation in 2017 suggested that providing effective training to transport staff is likely to improve the travelling experience of disabled passengers. Positive interactions with staff can help build the confidence of disabled people to travel.
Theme 4 draws on the following metrics:
- metric 15: percentage of disabled people who were satisfied with the helpfulness and attitude of the bus driver on their journey (source: bus passenger survey)
- metric 16: percentage of disabled people who thought the helpfulness and attitude of staff on their train was very/fairly good (source: National Rail passenger survey)
It was not possible to obtain data for metrics 15 to 16 for the 2022 to 2023 scorecard as the surveys these metrics previously drew on were discontinued and the replacement surveys either did not contain equivalent questions or did not cover the 2022 to 2023 period.
However, the National Highways and Transport Network public satisfaction survey includes a similar survey metric to metric 15: satisfaction with the helpfulness of bus drivers. While this survey should not be directly compared with the bus passenger survey, it indicates that between the 2021 to 2022 and 2022 to 2023 scorecard years, satisfaction with the helpfulness of bus drivers among disabled respondents was broadly consistent, at 66% and 64%, respectively [footnote 6].
Theme 5: assistance
The ITS aims to ensure assistance is provided if physical infrastructure remains a barrier. Providing timely and high-quality assistance services to disabled travellers, including those with less visible disabilities, is vital to ensure disabled people can travel with confidence.
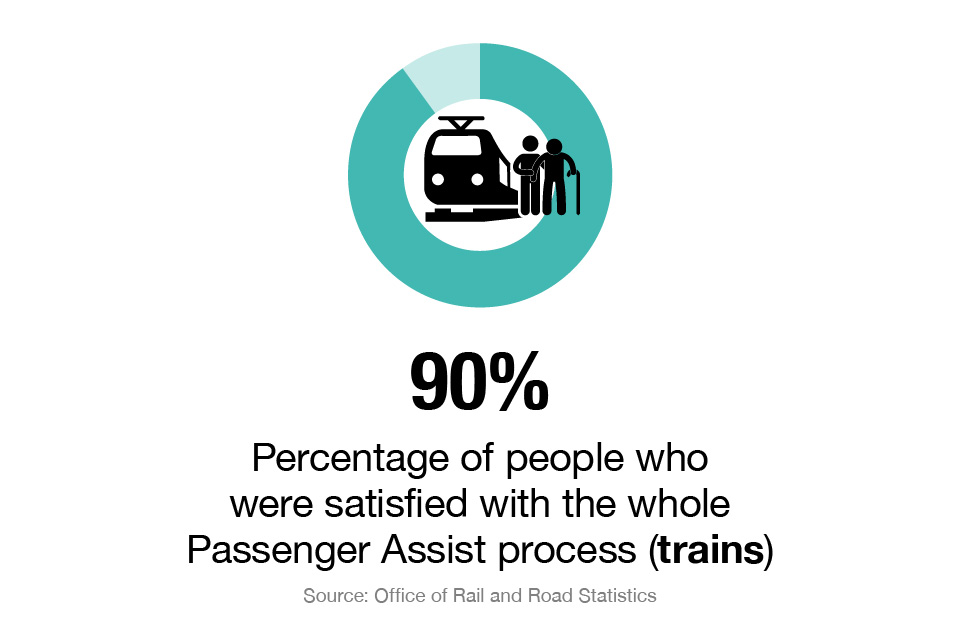
Percentage of people who were satisfied with the whole Passenger Assist process (trains): 90%.
Source: Office of Rail and Road statistics.
This infographic represents metric 17 of the 2022 to 2023 scorecard[footnote 8].
Theme 5 also draws on metric 18, which reports the percentage of people who were satisfied with the assistance they received on their last plane journey (source: Civil Aviation Authority (CAA) aviation consumer survey). It was not possible to obtain data for metric 18 for the 2022 to 2023 scorecard as the question the metric draws on was not asked in survey fieldwork that covered the 2022 to 2023 period. [footnote 2].
Theme 6: accessible vehicles
The ITS aims to ensure that vehicles are designed, built and operated using guidance and regulations so that they are easy to use for all.
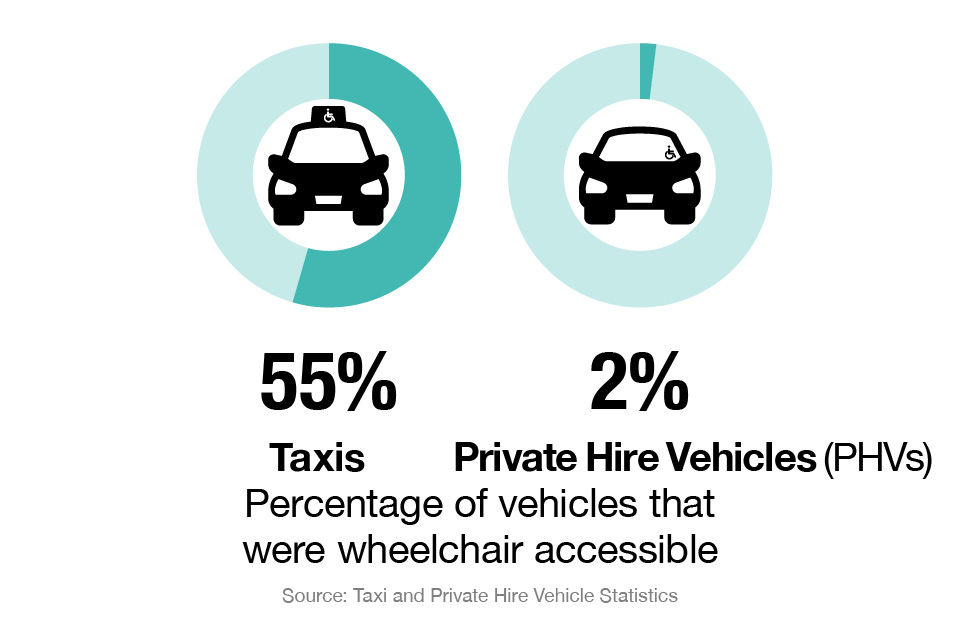
Percentage of taxis that were wheelchair accessible: 55%.
Percentage of private hire vehicles (PHVs) that were wheelchair accessible: 2%.
This infographic represents metrics 19 to 20 of the 2022 to 2023 scorecard[footnote 9].
Source: Taxi and private hire vehicle statistics.
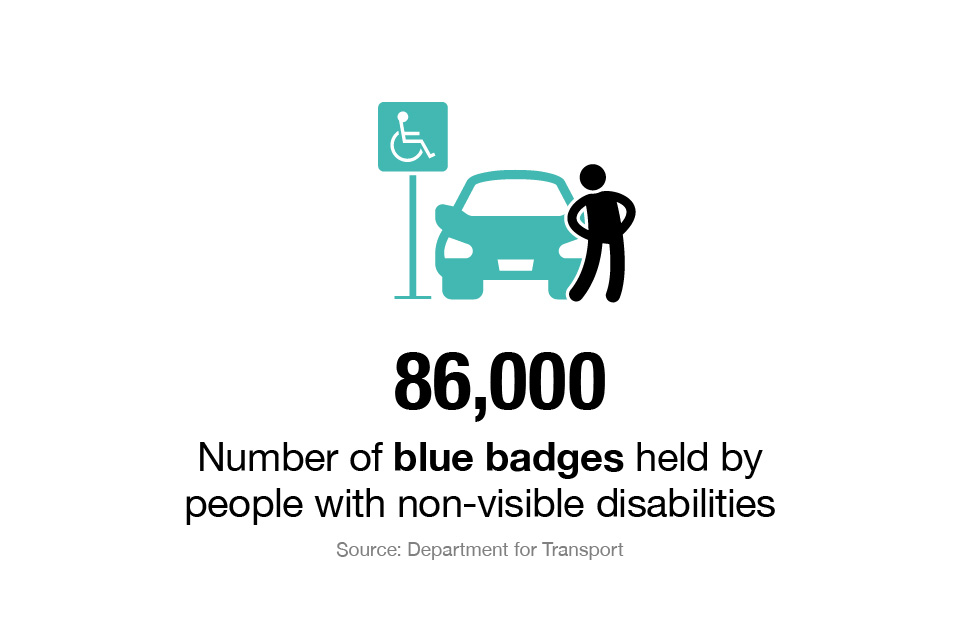
Number of blue badges held by people with non-visible disabilities: 86,000.
This infographic represents metric 21 of the 2022 to 2023 scorecard[footnote 10].
Source: DfT.
Theme 7: information
The ITS aims to ensure that transport operators provide travel information in formats that all passengers can easily access and understand, before and during a journey. We want disabled people to have equal access to transport information.
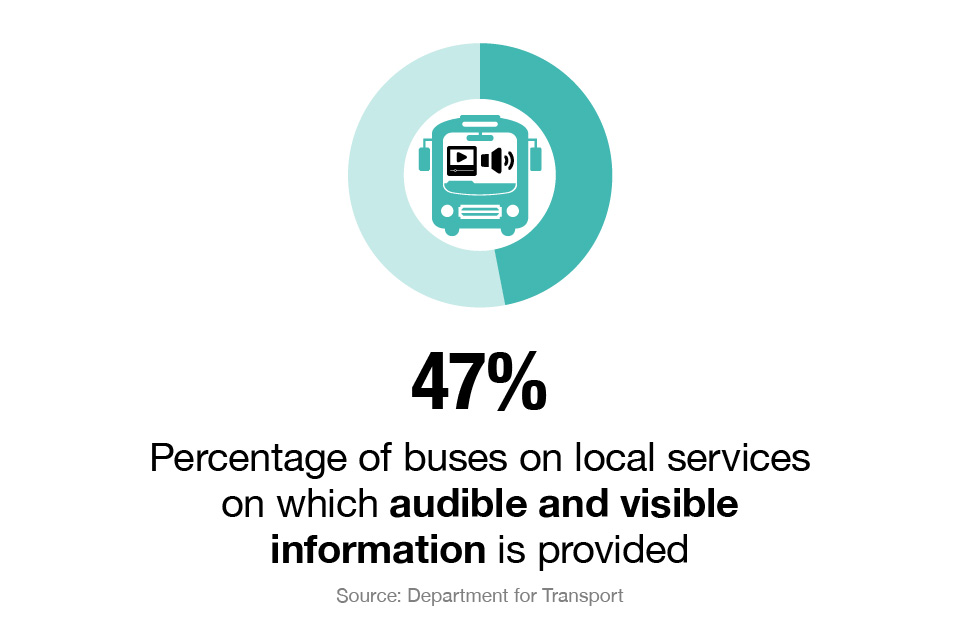
Percentage of buses on local services where audible and visible information is provided: 47%.
This infographic represents metric 22 of the 2022 to 20223 scorecard[footnote 11].
Source: DfT.
Theme 8: interactions with other passengers
The ITS aims to create an inclusive travelling experience for disabled people. This will involve improving the attitude and behaviour of other passengers to ensure disabled people feel confident taking journeys.
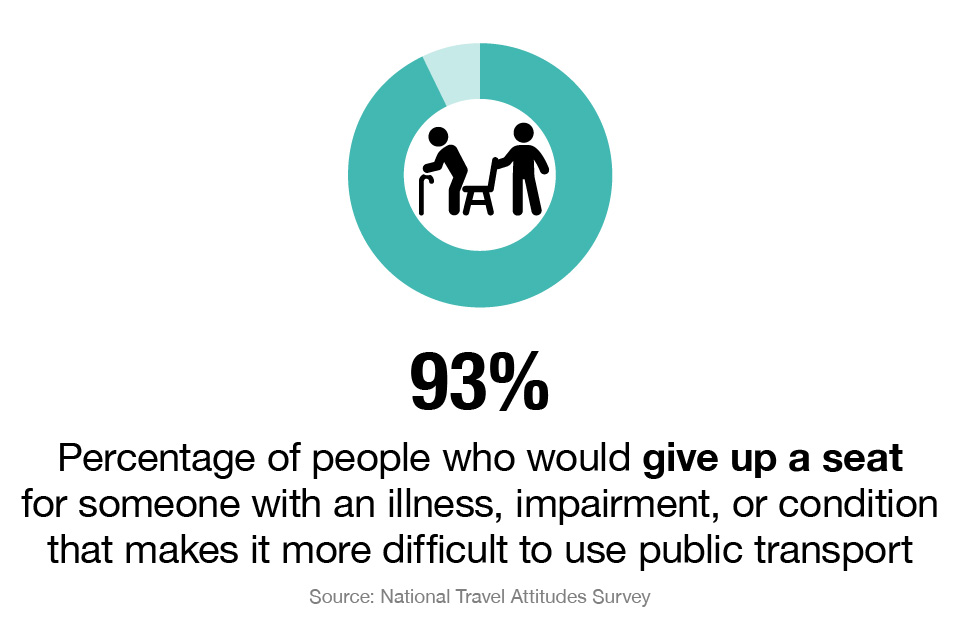
Percentage of people who would give up a seat for someone with an illness, impairment or condition that makes it more difficult to use public transport: 93%.
This infographic represents metric 23 of the 2023 to 2023 scorecard.[footnote 12]
Source: National Travel attitudes survey.
It should be noted that the observed changes cannot be attributed to ITS actions, although ITS actions may have played a role. It should also be noted that where subjective measures such as passenger satisfaction have only increased by 1 or 2 percentage points, they may not represent a material improvement but rather marginal fluctuations between data collections.
Information about the purpose of the scorecard
An initial review of all data sources covering disabled people’s transport habits within Britain found over 75 relevant metrics. The 23 metrics included in the scorecard were chosen based on:
-
Data availability – metrics were only included if data was originally (pre-COVID) expected to be available on an annual basis and likely to be collected up to 2024. However, data was only collected for 16 out of 23 metrics in 2022 to 2023. Certain data was not available as a number of surveys underwent changes to their data collection timeframes and/or survey content, or were replaced with new surveys that did not feature equivalent questions[footnote 2]. This is indicated by cells containing the text ‘no data’ within the spreadsheet.
-
Coverage of different transport types – to accurately reflect the aims of the ITS, it was important that the scorecard included a range of transport types including multiple metrics for trains, buses, private cars, taxis and private hire vehicles (PHVs), cruise ships, ferries and planes.
-
Coverage of different data sources – it is important for the scorecard to present both objective measures of change (for example, number of blue badges) and subjective experiences of these changes for passengers. A range of data sources is used in the scorecard, including official statistics and survey data.
The 23 metrics have been split into 8 different themes based on the logic model developed by the Department for Transport (DfT) as part of its monitoring and evaluation framework. Logic models are evaluation tools that can be used to explore whether expected changes have occurred. They involve breaking a policy down into its constituent elements.
The metrics associated with each theme are detailed in the infographics. The metric number can be viewed in the first column of the scorecard table. The 8 themes cover specific aspects of the original logic model.
Themes:
- 1 and 2 explore the impacts and objectives of the ITS
- 3 to 8 explore the outcomes, outputs and activities of the ITS
The scorecard table presents figures for 3 baseline years, where data for those years was available:
- 2016 to 2017
- 2017 to 2018
- 2018 to 2019
These baseline figures are displayed to provide a reference point for data collected since the ITS was published in July 2018. The table also presents figures for all 4 ITS scorecard years:
- 2019 to 2020
- 2020 to 2021
- 2021 to 2022
- 2022 to 2023
It is important to note that any change that is observed may not be directly attributed to the ITS and associated activities. It is likely that the COVID-19 pandemic and following recovery contributed to some of the observed changes since 2020.
Information about the content of the scorecard
The scorecard’s years are in financial years (April to March). We have attempted to ensure that all figures follow this structure. However, this was not possible for metrics 1 to 6 due to data availability.
Where annual figures are displayed, figures from:
- 2016 are used for scorecard year 2016 to 2017
- 2017 are used for scorecard year 2017 to 2018
- 2018 are used for scorecard year 2018 to 2019
- 2019 are used for scorecard year 2019 to 2020
- 2020 are used for scorecard year 2020 to 2021
- 2021 are used for scorecard year 2021 to 2022
- 2022 are used for scorecard year 2022 to 2023
Baseline data (data from before ITS publication) was not available for some metrics. This is indicated by cells containing the text ‘no data’. This might be due to specific data not being collected that year, or because of methodological changes to surveys which meant comparison of figures was not possible.
-
Certain surveys were paused following the onset of the COVID-19 pandemic, due to significant reductions in the numbers of people using public transport or because it was not safe enough to conduct face-to-face interviews. For 2 of these surveys, (metrics 11 and 12), data collection was resumed in the 2021 to 2022 and 2022 to 2023 financial years (respectively). ‘Bus passenger survey’ was discontinued and replaced by an equivalent survey Your Bus Journey, but data collection started outside of the 2022 to 2023 financial year. Finally, the ‘National Rail passenger survey’ (metric 16) also did not run in the 2022 to 2023 financial year as it was discontinued. ↩
-
Certain surveys either did not feature or report on the relevant questions drawn on by the scorecard during the 2022 to 2023 financial year. For this reason, the 2022 to 2023 scorecard does not display any data for metrics 9 to 10 or 18, which draw on the Maritime and Coastguard Agency disabled passenger satisfaction survey and the Aviation consumer survey. ↩ ↩2 ↩3
-
Metrics 1 to 6 represent data taken from the National Travel Survey. The survey ran between January and December 2022. It was conducted in England and published by DfT. For metrics 3 to 6 the age split was used on the basis that 60 is the age at which it is possible to start claiming free and discounted travel. ↩
-
Metric 11 represents data taken from the strategic road user survey. The data was collected in England between 1 April 2022 and 31 March 2023. The survey restarted in April 2021 with a new methodology. This means that results prior to March 2020 and from April 2021 are not directly comparable. ↩
-
Metric 12 represents data taken from the motorway service user survey. This data was collected in Great Britain between 2022 and 2023. It should be noted that data collection was paused following the onset of the COVID-19 pandemic and resumed in 2022, using a new research method. For this reason, the metric 12 data presented for the 2022 to 2023 scorecard year should not be directly compared with previous years. ↩
-
The National Highways and Transport Network public satisfaction survey trends presented in the 2022 to 23 scorecard publication represent data collected in participating English Local Authority regions (this included all Local Authority regions except for 21 in 2021 and 24 in 2022). This data was collected in the summer of 2021 and the summer of 2022. ↩ ↩2
-
Metrics 13 to 14 represent data taken from bus users UK (not in the public domain) and the Office of Rail and Road. Both datasets were collected in Great Britain between 2022 and 2023. ↩
-
Metric 17 represents Passenger Assist data taken from the Office of Rail and Road. The data was collected in Great Britain between 2022 and 2023. ↩
-
Metrics 19 to 20 represent Taxi and private hire vehicle statistics. The data was collected in England and published by DfT as at 1 April 2023. ↩
-
Metric 21 represents Blue Badge statistics published by DfT. The data was collected in England and published by DfT as at 31 March 2023. ↩
-
Metric 22 represents local bus operator data held by DfT, as at 31 March 2023. The data was collected in Great Britain. Correction: in certain previous scorecard years, data representing just England was presented for metric 22 in error. This has been retrospectively corrected. ↩
-
Metric 23 represents data taken from the National travel attitudes survey. The survey ran between March and April 2023. It was conducted in England and published by DfT. ↩