How many people are detained or returned?
Published 28 November 2019

© Crown copyright 2019
This publication is licensed under the terms of the Open Government Licence v3.0 except where otherwise stated. To view this licence, visit nationalarchives.gov.uk/doc/open-government-licence/version/3 or write to the Information Policy Team, The National Archives, Kew, London TW9 4DU, or email: psi@nationalarchives.gov.uk.
Where we have identified any third party copyright information you will need to obtain permission from the copyright holders concerned.
This publication is available at https://www.gov.uk/government/statistics/immigration-statistics-year-ending-september-2019/how-many-people-are-detained-or-returned
Back to ‘Immigration Statistics, year ending September 2019’ content page.
This is not the latest release. View latest release.
Data in this section relate to the year ending September 2019 and all comparisons are with the year ending September 2018, unless indicated otherwise. A more detailed annual summary can be found in ‘Immigration statistics, year ending June 2019 second edition’.
This section contains data on:
- Individuals detained in the Home Office detention estate and HM Prisons solely under Immigration Act powers; the detention estate comprises immigration removal centres (IRC), short-term holding facilities (STHF) and pre-departure accommodation (PDA)
- Returns of people who do not have any legal right to stay in the UK
1. Immigration detention
The number of people entering detention fell by 3% to 24,441 in the year ending September 2019 compared with the previous year. This was similar to levels seen in 2009 and continues the downward trend since 2015.
EU nationals entering detention increased between 2009 and 2017 but fell by 21% in 2018 and 12% to 3,947 in the year ending September 2019. Non-EU nationals entering detention remained stable at 20,494 in the latest year following a reduction since 2015.
Albanians were the most common nationality entering detention in the latest year, accounting for 14% of the total (3,324) and a 32% increase on the previous year. Iranian nationals entering detention more than doubled to 1,431, moving from the 12th to 4th highest nationality entering detention.
As at 30 September 2019, there were 1,826 people in detention – 11% fewer than on the same date a year previously, and around half the number as at 30 September 2017.
Figure 1: People entering detention under immigration powers in the UK, by EU and non-EU nationals, years ending September 2011 to 20191
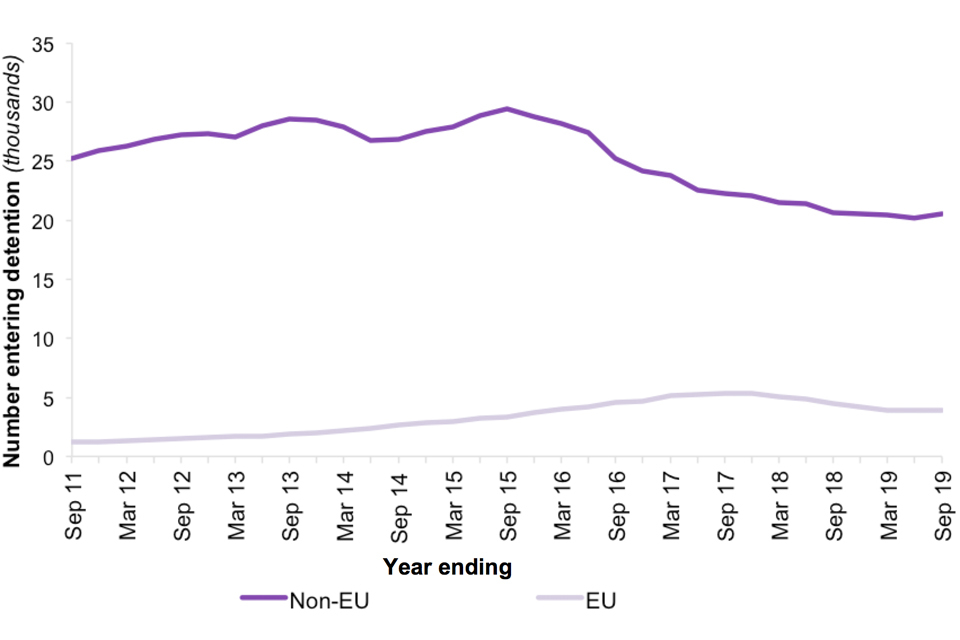
The chart shows the number of people entering detention over the last 9 years, broken down by EU and non-EU nationals.
Source: Immigration detention – Det_D01
Notes:
- Prior to July 2017, those entering detention in prisons would not be counted in the entering figures until they entered the detention estate. These cases are now included when entering immigration detention in prison. This means those entering through prisons will be recorded earlier than previously, and those who were not moved from the prison to the detention estate would not previously have been counted.
Table 1: People entering, leaving and in detention under immigration powers in the UK, years ending September 2015 to 20191,2
| Year ending | Entering detention | Leaving detention | In detentionIn detention (excl. HM Prisons) | |
|---|---|---|---|---|
| September 2015 | 32,742 | 32,509 | n/a | 3,531 |
| September 2016 | 29,758 | 30,210 | n/a | 2,998 |
| September 2017 | 27,567 | 27,820 | 3,455 | 3,125 |
| September 2018 | 25,082 | 26,449 | 2,049 | 1,748 |
| September 2019 | 24,441 | 24,575 | 1,826 | 1,522 |
| Change: latest year | -641 | -1,874 | -223 | -226 |
| Percentage change | -3% | -7% | -11% | -13% |
Source: Immigration detention – Det_D01, Det_D02 and Det_D03
Notes:
- Data from July 2017 include those entering and leaving detention through HM Prisons, as well as those held in detention in HM Prisons. Data are not directly comparable with previous years (which are denoted as n/a). See the user guide for more details.
- Detained under immigration powers in either the immigration detention estate or a prison. Data on those in detention are as at 30 September.
1.1 Leaving detention
In the year ending September 2019, 24,575 people left the detention estate (down 7%), a similar number to those entering detention.
Almost two-fifths (39%) of those leaving detention were detained for 7 days or less, with 73% detained for 28 days or less. Two per cent of detainees were detained for more than 6 months. The Home Office would usually only detain someone for more than 6 months if they are a foreign national offender (FNO), or if they have subsequently claimed asylum while in detention. There has been an increase in the proportion of people leaving detention within 28 days, from 66% in the year ending September 2018 to 73% in the current year.
Figure 2: People leaving immigration detention, by length of detention1, years ending September 2015 to 2019
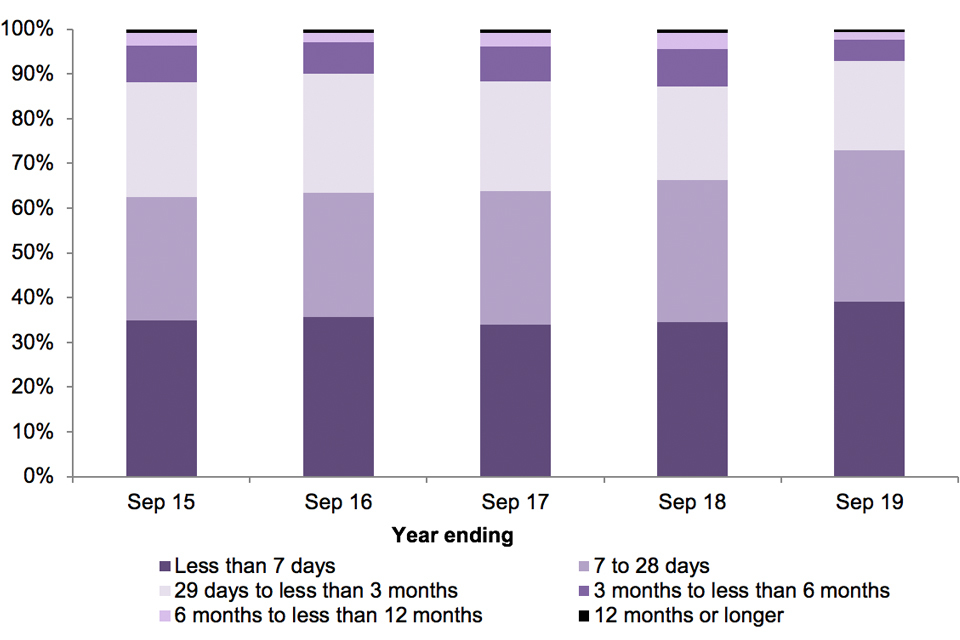
The chart shows people leaving detention, by length of detention, over the last 5 years.
Source: Immigration detention – Det_D03
Notes:
- Data from July 2017 includes those leaving detention through HM Prisons. Data are not directly comparable with previous years. See the user guide for more details.
Of those leaving detention, 60% received bail (either Secretary of State (SoS) or Immigration Judge (IJ)), 39% were returned from the UK to either their country of origin or another foreign country, and 1% left for other reasons (including being granted leave to enter or remain in the UK).
The proportion of people who were returned from the UK to their country of origin or another foreign country on leaving detention fell from 64% in the year ending March 2011 to 39% in year ending September 2019. EU nationals were more likely to be returned on leaving detention than non-EU nationals (86% compared with 29%).
Amongst the top 10 nationalities leaving detention in the year ending September 2019, there were some marked differences in whether people were granted bail or returned from the UK. For example, 92% (1,255) of Iranian and 90% (1,169) of Iraqi nationals were granted bail; however, 95% (1,373) of Romanians and 92% (1,127) of Brazilians were returned from the UK.
Figure 3: Top 10 nationalities leaving detention by reason for leaving1, year ending September 2019
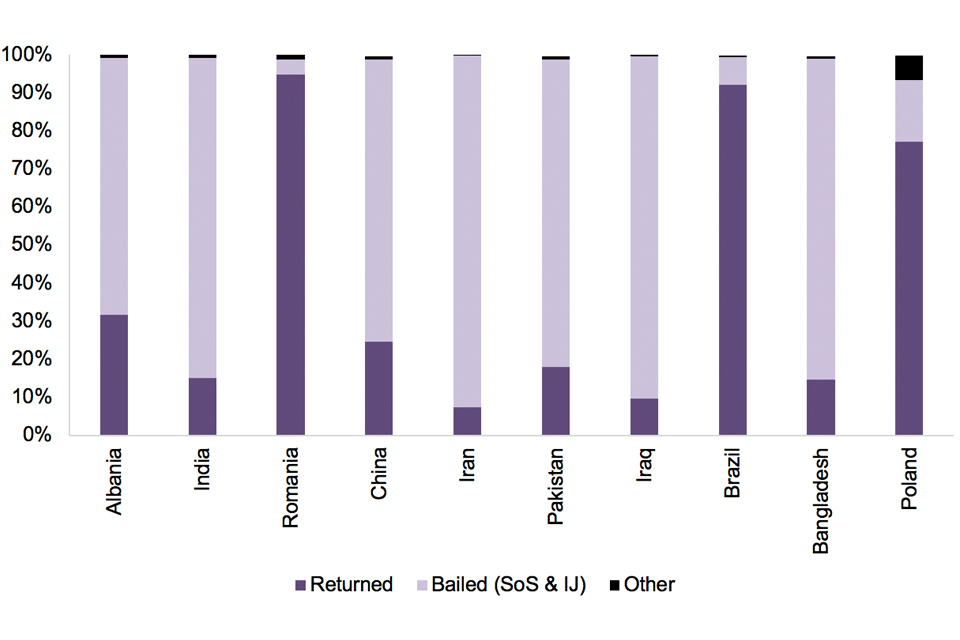
The chart shows people leaving detention, by nationality and reason, over the last year.
Source: Immigration detention – Det_D03
Notes:
- Other reasons for leaving detention include being sectioned under the Mental Health Act, entering criminal detention, being granted leave to enter or remain in the UK, and detained in error. See the user guide for more details.
2. Returns
Enforced returns from the UK fell to 7,624 in the year ending September 2019, the lowest number since records began in 2004 and 25% lower than the previous year. The fall was largely accounted for by a 23% decrease to 5,176 in the enforced return of people who were in detention prior to their return.
There were 12,295 voluntary departures in the year ending September 2019. Although these data are not directly comparable over time – as voluntary returns are subject to upward revision, as in some cases it can take time to identify people who have left the UK without informing the Home Office – the numbers recorded have fallen since the year ending June 2016.
The number of passengers refused entry at port and subsequently departed, remained stable at 18,629 in the year ending September 2019.
Figure 4: Returns from the UK, by type of return1, years ending September 2011 to 2019
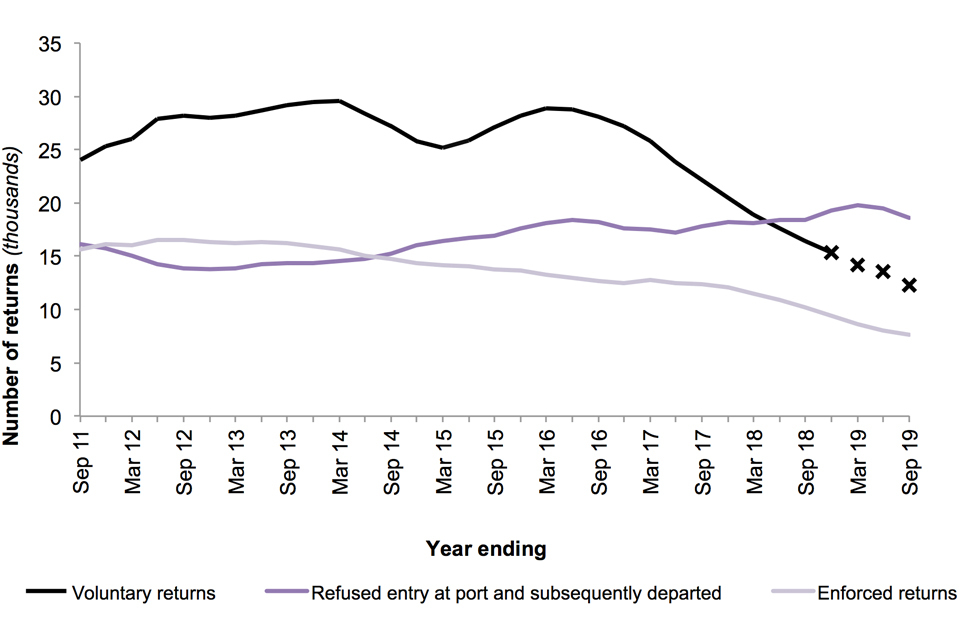
The chart shows the number of returns for the last 9 years, by type of return (voluntary, enforced, refused entry at port and subsequently departed).
Source: Returns – Ret_D01
Notes:
- ‘Voluntary returns’ include ‘verified returns’ which are subject to upward revision (particularly for the last 12 months) as in some cases it can take time to identify people who have left the UK without informing the Home Office. Provisional data are denoted with an ‘X’ in the chart.
The proportion of enforced returns that are accounted for by EU nationals has increased in recent years, from 6% in 2010 (976 of a total 15,828) to 46% in the current year (3,519 of a total 7,624).
Figure 5: Enforced returns1 from the UK of EU and non-EU nationals, years ending September 2011 to 2019
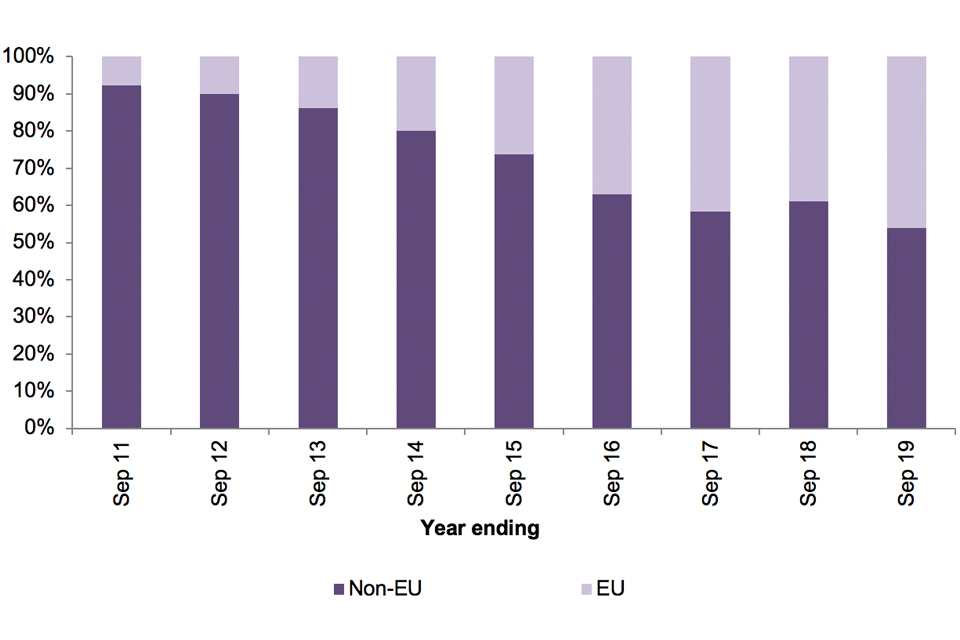
The chart shows the number of enforced returns from the UK of EU and non-EU nationals for the last 9 years.
Source: Returns – Ret_D01
Notes:
- ‘Enforced returns’ cover enforced removals from detention, non-detained enforced removals and other returns from detention where the Home Office will have been required to facilitate or monitor the return.
The top 5 nationalities accounted for 52% of the total enforced returns in the year ending September 2019 – (Romania (17%), Albania (13%), Poland (9%), Brazil (7%) and Lithuania (6%)).
Albanian nationals showed the largest decrease in enforced returns compared with the previous year (down 634) and Brazilians were the only nationality in the top 5 that showed an increase (up 192).
Table 2: Top 5 nationalities1 who had enforced returns2 from the UK
| Nationality | Year ending September 2018 | Year ending September 2019 | Change | Percentage change |
|---|---|---|---|---|
| Romania | 1,319 | 1,300 | -19 | -1% |
| Albania | 1,651 | 1,017 | -634 | -38% |
| Poland | 914 | 689 | -225 | -25% |
| Brazil | 338 | 530 | +192 | +57% |
| Lithuania | 545 | 430 | -115 | -21% |
| Other | 5,397 | 3,658 | -1,739 | -32% |
| Total | 10,164 | 7,624 | -2,540 | -25% |
Source: Returns – Ret_D01
Notes:
- Top 5 nationalities in the most recent year.
- ‘Enforced returns’ cover enforced removals from detention, non-detained enforced removals and other returns from detention where the Home Office will have been required to facilitate or monitor the return.
The largest number of recorded voluntary returns was of Indian nationals (1,948, or 16% of the total), followed by Chinese (1,171, or 10%) and Pakistani nationals (1,137, or 9%). These nationalities accounted for over one-third (35%) of the total voluntary returns (12,295).
The largest number of passengers refused entry at port and subsequently departed were Brazilian nationals (2,049, or 11% of the total), followed by Albanians (1,430, or 8%) and Romanians (1,395, or 7%). These three nationalities also feature within the top 4 nationalities for enforced returns, and accounted for 26% of the total number of passengers refused entry at port and subsequently departed (18,629).
2.1 Returns of foreign national offenders
In the year ending September 2019, there were 5,143 FNOs returned from the UK, 10% less than the previous year. These figures are included in the total returns figures and constitute 26% of enforced and voluntary returns, with the majority being enforced returns.
Of the 5,143 FNOs returned from the UK:
- Just over two-thirds (69%) were EU nationals (3,534), a number which includes those who abuse Treaty rights and those deported on public policy grounds such as criminality
- Almost one-third (31%) were non-EU nationals (1,609)
Figure 6: Returns of FNOs1 from the UK, by nationality (EU or non-EU), years ending September 2011 to 2019
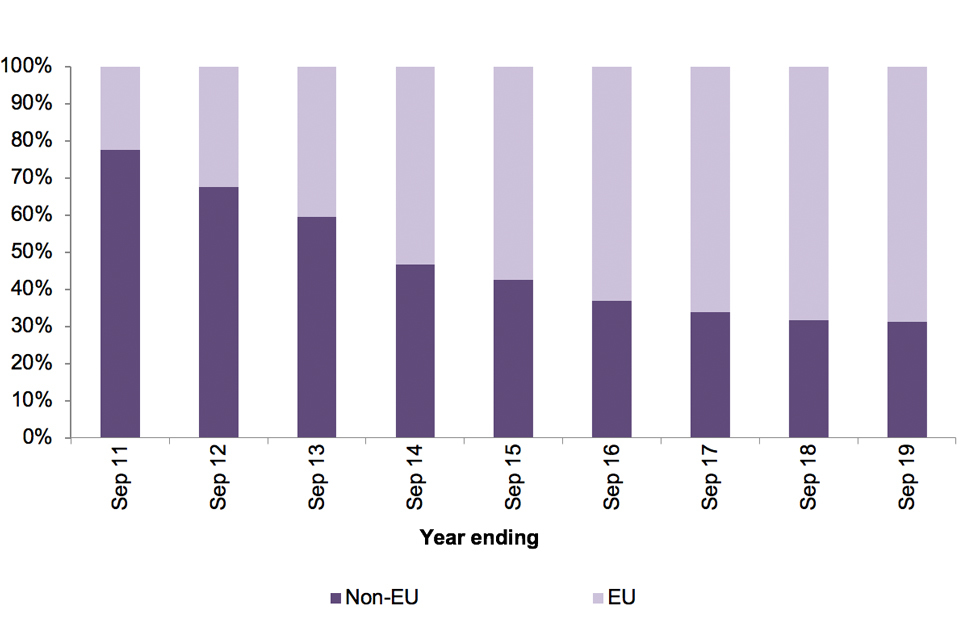
The chart shows the number of FNO returns by EU/non-EU for the last 9 years.
Source: Returns – Summary tables
Notes:
- An FNO is someone who is not a British citizen and is/was convicted in the UK of any criminal offence, or abroad for a serious criminal offence.
3. About the statistics
3.1 Immigration detention
The statistics in this section show the number of entries into, and departures from, detention for those held solely under immigration powers. One individual may enter or leave detention multiple times in a given period and will therefore have been counted multiple times in the statistics. Statistics on foreign nationals held in prison for criminal offences are published by the Ministry of Justice in its ‘Offender management statistics quarterly’.
Data on those entering detention, by place of detention, relate to the place of initial detention. An individual who moves from one part of the detention estate to another will not have been counted as entering any subsequent place of detention. The data, therefore, do not show the total number of people who entered each part of the detention estate.
Data on those in detention relate to those in detention on the last day of the quarter.
Data on those leaving detention, by place of detention, relate to the place of detention immediately prior to being released. An individual who moves from one part of the detention estate to another has not been counted as leaving each part of the detention estate. The data, therefore, do not show the total number of people who left each part of the detention estate.
From July 2017, data on detention of immigration detainees in prisons are included in the immigration detention figures. Previously, individuals who were detained in prison would have been recorded in the data upon entering the detention estate through an IRC, STHF or PDA; now they are recorded upon entering immigration detention within prison. As a result, the length of detention of those entering prison prior to July 2017 will be recorded from the point at which they entered an IRC, STHF or PDA. Time spent in prison under immigration powers prior to entering an IRC, STHF or PDA is not included in the length of detention figures prior to July 2017.
For those entering detention from July 2017, the length of detention will include time spent in prison under immigration powers prior to entering an IRC, STHF or PDA. Data from Q3 2017 onwards are therefore not directly comparable with earlier data. Further details of these changes can be found in the user guide.
Following the introduction of the new Immigration Bail in Schedule 10 of the Immigration Bill 2016, the reason for leaving detention ‘Bailed (SoS)’ replaced the existing powers of ‘granted temporary admission/release’ from 15 January 2018, and ‘Bailed (Immigration Judge)’ replaced ‘Bailed’ to differentiate from ‘Bailed (SoS)’. See the user guide for more details of this change.
Data on the number of children entering detention is subject to change. This will be a result of further evidence of an individual’s age coming to light, such as an age assessment.
3.2 Returns
The statistics in this section show the number of returns from the UK. One individual may have been returned more than once in a given period and, if that was the case, would be counted more than once in the statistics.
The Home Office seeks to return people who do not have a legal right to stay in the UK. This includes people who:
- Enter, or attempt to enter, the UK illegally (including people entering clandestinely and by means of deception on entry)
- Are subject to deportation action; for example, due to a serious criminal conviction
- Overstay their period of legal right to remain in the UK
- Breach their conditions of leave
- Have been refused asylum
The term ‘deportations’ refers to a legally-defined subset of returns, which are enforced either following a criminal conviction, or when it is judged that a person’s removal from the UK is conducive to the public good. The published statistics refer to enforced returns which include deportations, as well as cases where a person has breached UK immigration laws, and those removed under other administrative and illegal entry powers that have declined to leave voluntarily. Figures on deportations, which are a subset of enforced returns, are not separately available.
Data on voluntary returns are subject to significant upward revision, so comparisons over time should be made with caution. In some cases, individuals who have been told to leave the UK will not notify the Home Office of their departure from the UK. In such cases, it can take some time for the Home Office to become aware of such a departure and update the system. As a result, data for more recent periods will initially undercount the total number of returns. ‘Other verified returns’ are particularly affected by this.
Asylum-related returns relate to cases where there has been an asylum claim at some stage prior to the return. This will include asylum seekers whose asylum claims have been refused and who have exhausted any rights of appeal, those returned under third-country provisions, as well as those granted asylum/protection but removed for other reasons (such as criminality).
Data on the number of people returned from the UK from detention in the ‘immigration detention’ tables includes those who were refused entry at port in the UK who were subsequently detained and then departed the UK. Data on those returned from detention in the ‘returns’ tables do not include those refused entry at port, and so figures will be lower.
Data on returns, and requests for transfer out of the UK under the Dublin Regulation, by article and country of transfer, are available from the Asylum data tables Asylum and Resettlement – Dublin regulation. Further details on the Dublin Regulation are set out in the ‘User Guide to Home Office Immigration Statistics’.
EU nationals may be returned for not exercising, or abusing, Treaty rights or deported on public policy grounds (such as criminality).
Eurostat publishes a range of enforcement data from EU member states. These data can be used to make international comparisons.
3.3 The Windrush Scheme
The Windrush generation refers to people from Caribbean countries who were invited by the British government between 1948 and 1971 to migrate to the UK as it faced a labour shortage due to the destruction caused by World War II. Not all of these migrants have documentation confirming their immigration status and, therefore, some may have been dealt with under immigration powers.
On 16 April 2018, the Home Secretary established a taskforce to ensure that members of the Windrush generation could evidence their right to be in the UK. The taskforce provide updates to the Home Affairs Select Committee on the work of the Home Office in relation to Windrush, including official figures, on a monthly basis.
4. Data tables
Data referred to here can be found in the following tables:
- Immigration detention summary tables
- Detailed immigration detention datasets
- Returns summary tables
- Detailed returns datasets
4.1 Review of immigration enforcement data
The Home Office is reviewing the enforcement data that it publishes to ensure it provides a comprehensive overview of the enforcement system. The Home Office will launch a public consultation to enable users to inform future developments in enforcement statistics in 2020.
We welcome your feedback
If you have any comments or suggestions for the development of this report, please provide feedback by emailing MigrationStatsEnquiries@homeoffice.gov.uk. Please include the words ‘PUBLICATION FEEDBACK’ in the subject of your email.
See section 7 of the ‘About this release’ section for more details.