Why do people come to the UK? (2) To work
Published 24 May 2019

© Crown copyright 2019
This publication is licensed under the terms of the Open Government Licence v3.0 except where otherwise stated. To view this licence, visit nationalarchives.gov.uk/doc/open-government-licence/version/3 or write to the Information Policy Team, The National Archives, Kew, London TW9 4DU, or email: psi@nationalarchives.gov.uk.
Where we have identified any third party copyright information you will need to obtain permission from the copyright holders concerned.
This publication is available at https://www.gov.uk/government/statistics/immigration-statistics-year-ending-march-2019/why-do-people-come-to-the-uk-2-to-work
Back to ‘Immigration Statistics, year ending March 2019’ content page.
This is not the latest release. View latest release.
Data relate to the year ending March 2019 and all comparisons are with the year ending March 2018, unless indicated otherwise. A more detailed annual summary can be found in ‘Immigration statistics, year ending June 2018’.
This section contains data on:
- Work-related visas (including Skilled (Tier 2) work visas)
- Sponsored work visa applications from different economic sectors
1. Immigration for work reasons
The total number of work-related visas granted (including dependants) in the year ending March 2019 increased by 11% (or 18,461) to 181,093. Around three quarters of the increase can be accounted for by the increase in Skilled (Tier 2) work visas. This category accounts for the majority (59%) of work-related visas granted.
The total number of work visas granted was the highest level since the year ending March 2009, around the period when the points-based system (PBS) for work was introduced.
The vast majority (95%) of work-related visa applications are granted. Tier 2 work visas had a grant rate of 98%, and Youth mobility and temporary workers (Tier 5) a grant rate of 95%.
Table 1: Work-related visas granted, year ending March 2019 compared with March 2018
| Visa type | Year ending March 2018 | Year ending March 2019 | Change | Percentage change |
|---|---|---|---|---|
| Skilled (Tier 2)1 | 92,916 | 106,524 | +13,608 | +15% |
| Youth mobility and temporary workers (Tier 5)1 | 40,404 | 41,717 | +1,313 | +3% |
| Non-PBS/Other2 | 24,138 | 26,146 | +2,008 | +8% |
| High value (Tier 1)1 | 5,174 | 6,706 | +1,532 | +30% |
| Total | 162,632 | 181,093 | +18,461 | +11% |
Source:
Entry clearance visas table vi 01 q (volume 1).
Table notes:
- Figures include pre-PBS equivalents.
- The ‘Non-PBS / Other’ category includes routes such as domestic workers in private households, and UK Ancestry visas.
1.1 Skilled (Tier 2) Work
There was an increase in Tier 2 work visas granted in the year ending March 2019, up 15% to 106,524. This included a 39% increase in the ‘Tier 2 – General’ category, likely related to the removal of highly-skilled doctors and nurses from the Tier 2 visa cap.
There was also an increase in visas issued to dependants of Tier 2 visa holders (up 6,607, or 16%, to 47,357).
Indian nationals (who account for 53% of all Tier 2 visas granted) saw the largest increase in grants, up 5,360 (or 10%) compared to the previous year. There were also notable increases for nationals of Nigeria (up 1,317 or 91%), the Philippines (up 979 or 32%), Pakistan (up 838 or 54%) and Egypt (up 656 or 51%).
Table 2: Top 5 nationalities granted Skilled (Tier 2) Work visas, year ending March 2019 compared with March 2018
| Nationality | Year ending March 2018 | Year ending March 2019 | Change | Percentage change |
|---|---|---|---|---|
| India | 51,311 | 56,671 | +5,360 | +10% |
| United States | 9,490 | 9,882 | +392 | +4% |
| Philippines | 3,098 | 4,077 | +979 | +32% |
| Japan | 3,479 | 3,189 | -290 | -8% |
| Australia | 2,951 | 3,167 | +216 | +7% |
| All other nationalities | 22,587 | 29,538 | +6,951 | +31% |
| Total | 92,916 | 106,524 | +13,608 | +15% |
Source:
Entry clearance visas table vi 06 q w (volume 2).
In the year ending March 2019, there were 60,559 certificates of sponsorship applications for Tier 2 work, an increase of 6,885 (13%). This included a 62% increase in applications in the Human health and social work activities sector, up 4,342 to 11,337, which is likely related to the removal of doctors and nurses from the Tier 2 cap.
Five sectors accounted for the majority (87%) of Tier 2 work visa applications:
- information and communication (35%)
- human health and social work activities (19%)
- professional, scientific and technical activities (16%)
- financial and insurance activities (12%)
- education (6%)
1.2 Other Work-related visas
The long-term reduction in the number of Tier 1 (High value) visas granted reflects the closure of the Tier 1 General route in December 2010, which changed the route from an open points-based route to one focused on high-value migrants. In the year ending March 2019, there was a 30% increase in the number of Tier 1 visas granted, up 1,532 to 6,706. This was partly driven by a 31% increase for dependants of ‘Tier 1 – Entrepreneurs’ (up 484 to 2,039) and a 63% increase in main applicants on the ‘Other permit free employment – High Value’ category (up 420 to 1,088), which has been mainly comprised of Turkish businessperson visas in recent years.
The number of Tier 5 (Youth mobility and temporary worker) visas granted increased by 1,313 (3%) to 41,717. The Youth mobility route accounts for half the Tier 5 visas granted. The increase in Tier 5 was mainly driven by an increase in grants in the ‘Tier 5 – Creative and sporting’ route (up 893 to 7,967).
Figure 4: Work-related visas granted by visa type3, year ending March 2010 to March 2019
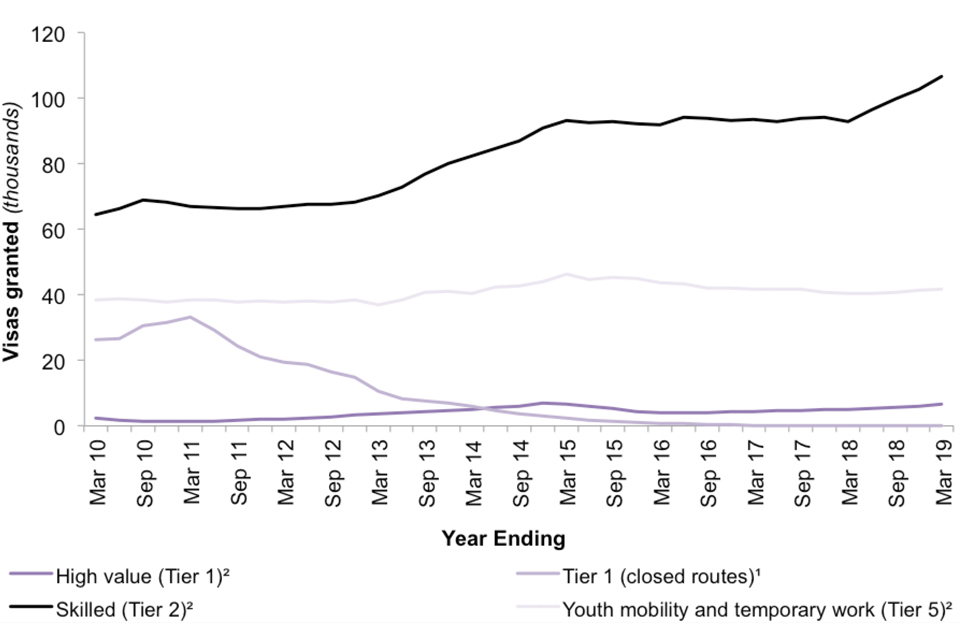
The chart shows the number of work-related Entry clearance visas granted by type of visa over the last 10 years.
Source:
Entry clearance visas table vi 01 q (volume 1).
Chart notes:
- ‘Tier 1 (closed routes)’ includes the ‘Tier 1 – General’, and ‘Tier 1 – Post study’ categories. These categories were closed to new entrants following operational evidence that these routes were not working as intended. These routes are not included in the ‘Tier 1 (High value)’ category in the chart.
- Includes pre-PBS equivalents.
- Non-PBS visas are not included on the chart.
2. About these statistics
The statistics in this section provide an indication of the number of people who have an intention to enter the UK for work reasons. This includes both highly-skilled non-EEA workers, investors and entrepreneurs, temporary workers, and those employed in sports, the arts and other sectors.
Entry clearance visas allow an individual to enter and stay in the UK within the period for which the visa is valid. EEA nationals do not require a visa to enter the UK.
Data in this section refer to the number of Entry clearance visas granted for work reasons within the period. If an individual was granted a visa more than once in a given period, this has been counted as multiple grants in the statistics. If an individual entered the UK multiple times within the period for which a visa was valid, this has been counted as one grant in the visa statistics.
The data do not show whether, or when, an individual arrived in the UK, what they did on arrival to the UK, or how long they stayed in the UK.
Year-on-year comparisons of the number of decisions can be affected by quarterly fluctuations in the data. Such fluctuations can be examined in more detail in the quarterly data that are available in the published tables.
Tier 1 of the PBS was phased in between February and June 2008 as a general route. However, from 2010, Tier 1 has focused on providing visas for ‘high-value’ migrants only, including the exceptional talent route, investors and entrepreneurs.
Tier 2 of the PBS is the primary route for economic migration to the UK. Broadly, the route is for skilled workers from outside the EEA who have an offer of employment in the UK in an occupation classed as skilled to NQF6 or above.
Tier 2 was implemented in November 2008. There are four routes within Tier 2 – General, Intra-company transfer, Minister of religion and Sportsperson.
Tier 5, which is for Youth mobility and temporary workers, providing a route for those coming to the UK for primarily non-economic reasons, was implemented in November 2008.
Applicants for visas (and extensions) for Tier 2 (Skilled) work and for Tier 5 (Youth mobility and temporary worker) must obtain a certificate of sponsorship (CoS) from a registered employer. Any organisation that wishes to sponsor a worker must be registered on the Home Office’s Register of Sponsors.
Tier 2 (General) is currently subject to a cap on the number of CoS that can be allocated to employers for newly hired employees earning less than £159,600 per year, or for dependants of Tier 4 Students who wish to switch into the Tier 2 ‘General’ category. The sponsor must apply for an allocation for these ‘restricted’ CoS on a case-by-case basis to be considered at a monthly allocation meeting held by the Home Office. Details of the outcome of the monthly allocation process are published by UK Visas and Immigration (UKVI). On 15 June 2018, the government announced that doctors and nurses are to be excluded from the cap on skilled worker visas.
Further information about the CoS allocation process is given in the user guide and on the UK visa sponsorship for employers section of GOV.UK.
The Office for National Statistics (ONS) publishes long-term international migration (LTIM) estimates in its ‘Migration Statistics Quarterly report’. The report includes estimates from the International Passenger Survey (IPS) on the number of people coming to the UK with the intention of staying for 12 months or more for work, study, family and other reasons. Estimates are available for EU, non-EU, and British nationals. IPS data are not directly comparable with Home Office visa data for several reasons. See the ONS article ‘Comparing sources of international migration statistics’ for details.
3. Data tables
Data on immigration for work can be found in the following tables:
- Sponsorship tables
- Entry clearance visas tables volume 1
- Entry clearance visas tables volume 2
- Entry clearance visas tables volume 3
- Admissions tables
- Extensions tables
- Settlement tables
- European Economic Area (EEA) tables
We welcome your feedback
If you have any comments or suggestions for the development of this report, please provide feedback by emailing MigrationStatsEnquiries@homeoffice.gov.uk. Please include the words ‘PUBLICATION FEEDBACK’ in the subject of your email.
See section 7 of the ‘About this release’ section for more details.