Summary of latest statistics
Published 25 May 2017

© Crown copyright 2017
This publication is licensed under the terms of the Open Government Licence v3.0 except where otherwise stated. To view this licence, visit nationalarchives.gov.uk/doc/open-government-licence/version/3 or write to the Information Policy Team, The National Archives, Kew, London TW9 4DU, or email: psi@nationalarchives.gov.uk.
Where we have identified any third party copyright information you will need to obtain permission from the copyright holders concerned.
This publication is available at https://www.gov.uk/government/statistics/immigration-statistics-january-to-march-2017/summary-of-latest-statistics
Back to Immigration statistics January to March 2017 content page.
This is not the latest release. View latest release.
1. How many people come to the UK each year?
There were 129.9 million passenger arrivals in 2016, including returning residents: a record number and an increase of 6.5 million on 2015. This increase was mainly accounted for by 3.6 million more arrivals by British, and 2.0 million by other EEA and Swiss nationals (+5% to 113.6 million). These numbers represent the number of occasions when a person entered the UK, not the number of distinct individuals.
2. Why do people come to the UK?
2.1 Visit
In the year ending June 2016, 9.3 million non-EEA visitors arrived in the UK, the same level as the previous 12 months. The latest nationality breakdown available (2015) showed that over a quarter (29%) such arrivals were United States (US) nationals.
A number of nationalities, including US nationals, do not normally require a visa to visit the UK. Consequently the number of visitor visas granted is much lower than the total number of non-EEA arrivals. Over 2.5 million visas were granted in the year ending March 2017 and, of these, almost 2 million (77%) were to visit the UK.
There were 61,220 (3%) more Visitor visas granted in the year ending March 2017. There were notable increases in Visitor visas granted to Chinese nationals, up by 99,940 (25%) to 506,580 (excluding Hong Kong), and Indian nationals, up 20,662 (6%) to 393,929.
The following flow chart illustrates the type and volume of entry clearance visas granted in the year ending March 2017. The data measure permissions to visit rather than confirmed arrivals.
For further details see the Visit section and the visa tables volume 1, visa tables volume 2 and visa tables volume 3.
Visas, year ending March 2017, thousands
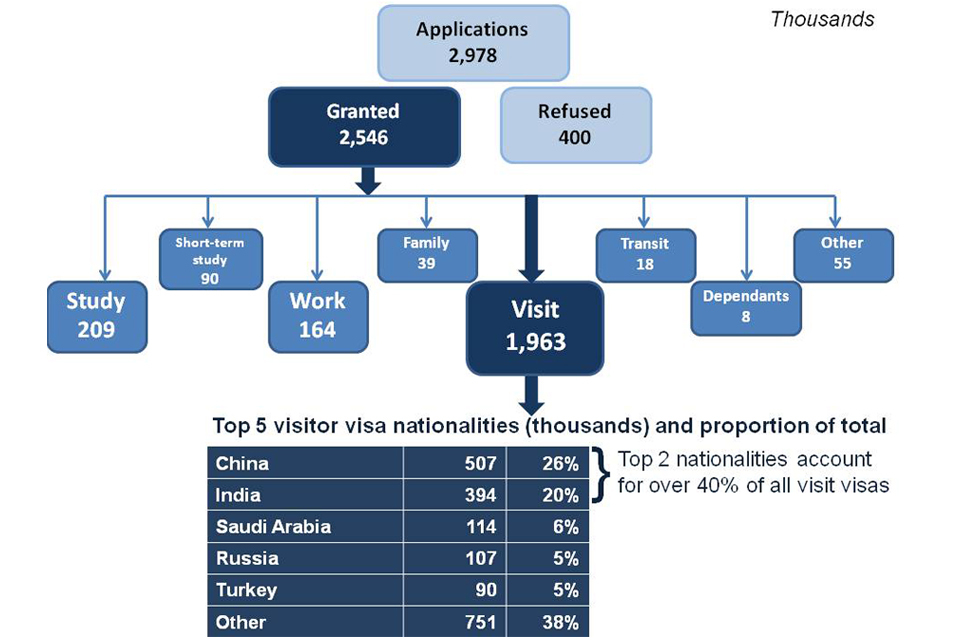
The chart shows the number and type of visas granted for the latest year available. The data are available in Visas tables vi 01 q and vi 06 q o.
Chart notes
Source: Home Office, Immigration Statistics January to March 2017, Visas table vi 01 q (Visas volume 1) and Visas table vi 06 q o (Visas volume 3).
2.2 Work
Including dependants, there were 93,566 Tier 2 Skilled work visas granted in the year ending March 2017, 2% higher than the previous year (91,797).
Of the 56,051 Tier 2 Skilled work-sponsored visa applications (main applicants) in the year ending March 2017, the Information and Communication sector alone accounted for 42% (23,316).
Of 4,677 Tier 1 visas granted in the year ending March 2017, 501 (11%) of these were for Exceptional talent visas (sponsored by; Arts Council England, The British Academy, The Royal Society, The Royal Academy of Engineering, Tech City UK), an increase of 130% over the preceding year. The annual number of places available is 1,000 per year.
For further details see the Work section and the data tables.
2.3 Study
Aside from visitors, the most common visa granted to non-EEA nationals was for study (208,906 in year ending March 2017; 8% of total visas granted to non-EEA nationals), a 1% increase on the previous year.
There were increases for the three largest non-EEA student nationalities: Chinese (+10% to 77,290), United States (+2% to 14,268) and Indian (+9% to 11,642) nationals.
Over the same period, the number of university-sponsored study visa applications (main applicants) rose by 3% to 168,591 and there was a 7% increase for Russell Group universities to 80,664. There were further falls for the Further education sector (-6% to 14,534), as shown in the chart below.
Study-related sponsored visa applications by sector
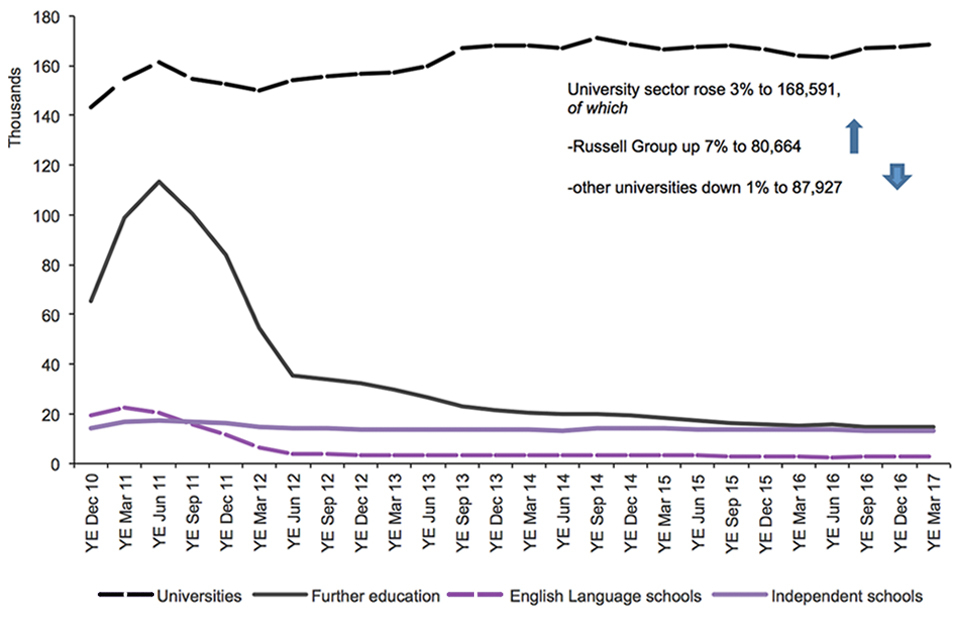
The chart shows the trends in confirmations of acceptance of studies used in applications for visas by the education sector since 2010 to the latest data available. The chart is based on data in Table cs 09 q.
Chart notes
Source: Home Office, Immigration Statistics January to March 2017, Sponsorship table cs 09 q.
‘Universities’ relate to UK-based higher education institutions.
‘Further education’ relates to tertiary, further education or other colleges.
In 2016, the Office for National Statistics (ONS) estimated there were 92,000 non-European Union (EU) long-term immigrants coming to study with an intention to remain a year or more, and 40,000 non-EU former students departing. Although they relate to different cohorts of students, the difference between these figures is around 52,000. The visa numbers above are also higher because they will include short term migrants, dependants, and those who do not travel.
In 2016, there were 44,398 extensions granted (main applicants) to former students, a fall of 31% compared with 2015, this being likely to reflect previous rule changes. Most of the 44,398 grants were for further study (35,572), with the next largest being skilled work under Tier 2 of the immigration system (5,143).
For further details see the Study section and the data tables.
2.4 Family
The combined total number of family-related visas granted, including EEA family permits granted to non-EEA nationals, and visas granted to dependants of other visa holders (excluding visitors) increased by 2% to 136,787 in the year ending March 2017.
For further details see the Family section and the data tables.
3. How many people do we grant asylum or protection to?
In the year ending March 2017, there were 9,634 grants of asylum or an alternative form of protection to main applicants and their dependants, and an additional 6,245 people were resettled to the UK.
Of the 24,293 initial decisions on asylum applications from main applicants, 33% were grants of asylum or an alternative form of protection, compared to 40% in the previous year. A separate Home Office analysis shows that for the years 2012 to 2014, on average 36% of decisions were granted initially, but this proportion rose to 49% after appeal.
There were 5,453 Syrian nationals granted humanitarian protection under the Syrian Vulnerable Persons Resettlement Scheme (VPRS) in addition to the 1,507 grants of asylum or an alternative form of protection to Syrian nationals at initial decision in the year ending March 2017.
For further details see How many people do we grant asylum or protection to? and the data tables.
4. How many people continue their stay in the UK?
Depending on the conditions of entry or visa, individuals inside the UK may extend or change the status of their stay in the UK, or apply to stay permanently. There are a number of ways for people to extend their stay in the UK. This includes applying for a temporary visa extension, applying to stay permanently (also known as ‘settlement’) and applying for British citizenship.
Under European law, EEA nationals do not need to obtain documentation confirming their right of residence in the UK. However, EEA nationals and their non-EEA family members can apply in the UK for a registration certificate (issued to EEA nationals), residence card or derivative residence card (issued to non-EEA family members) to confirm rights of residence.
There were 152,044 main applicants granted an extension to their stay in 2016; 121,026 (80%) allowed the individual to stay within their original broad category (e.g. students continuing to study), with the other 20% having switched categories (e.g. Tier 4 students switching to work).
In the year ending March 2017, 108,590 documents certifying permanent residence and permanent residence cards were issued. This is the highest recorded annual figure and more than 5 times the figure for the previous 12 months (20,514).
Total applications for British citizenship fell by 20,733 (14%) to 131,558 in the year to March 2017, compared to the previous 12 months and 43% (100,704) lower than the peak in 2013 (232,262). Within the total, applications made by EU nationals rose by 5,694 (35%) to 22,029.
For the latest key facts and background information see How many people continue their stay in the UK?.
5. How many people are detained or returned?
An individual may be held and remain in immigration detention for a variety of reasons, including reasons within and outside the control of the Home Office. In addition, the Home Office seeks to return people who do not have any legal right to stay in the UK.
As at the end of March 2017, 2,930 people were in immigration removal centres (IRCs), short-term holding facilities (STHF) and pre-departure accommodation (PDA). In addition, as at 3 April 2017, there were 337 detainees held in prison establishments in England and Wales solely under immigration powers.
The proportion of detainees being returned or voluntarily departing the UK on leaving detention increased from 45% in year ending March 2016 to 48% in year ending March 2017.
Total enforced returns from the UK, including those who were not directly from detention, decreased by 4% to 12,666 in the year ending March 2017 compared with 13,248 in the previous year. In the same period, there were 24,786 voluntary returns.
In the year ending March 2017, 6,171 Foreign National Offenders (FNOs) were returned compared to 5,810 in the previous year, an increase of 6%.
For further details see the How many people are detained or returned? and the data tables.