Why do people come to the UK? (2) To work
Published 25 May 2017

© Crown copyright 2017
This publication is licensed under the terms of the Open Government Licence v3.0 except where otherwise stated. To view this licence, visit nationalarchives.gov.uk/doc/open-government-licence/version/3 or write to the Information Policy Team, The National Archives, Kew, London TW9 4DU, or email: psi@nationalarchives.gov.uk.
Where we have identified any third party copyright information you will need to obtain permission from the copyright holders concerned.
This publication is available at https://www.gov.uk/government/statistics/immigration-statistics-january-to-march-2017/why-do-people-come-to-the-uk-2-to-work
Back to Immigration statistics January to March 2017 content page.
This is not the latest release. View latest release.
Data relate to the year ending March 2017 and all comparisons are with the year ending March 2016, unless indicated otherwise.
This section includes figures on work-related visas granted to non-European Economic Area (EEA) nationals. It also includes figures on long-term immigration to work (i.e. those intending to stay for at least 12 months to work) for non-EU nationals.
1. Key facts
There were 56,051 Tier 2 Skilled work-sponsored visa applications in the year ending March 2017 (non-EEA main applicants, Certificates of Sponsorship (CoS) used), similar to the level in the year ending March 2016 (56,324). This included a 36% increase (1,445 more visas) in the Human health and social work activities sector, which is largely likely to reflect the addition of nurses to the government’s shortage occupation list in November 2015. The largest fall was in applications for the Professional, scientific and technical activities sector (-1,103; -10%).
Including dependants, there were 93,566 Tier 2 Skilled work visas granted in the year ending March 2017, 2% higher than the previous year (91,797), and 41,798 Tier 5 Youth mobility and temporary visas granted, down 1,776 (4%).
Of 4,677 Tier 1 visas granted in the year ending March 2017, 501 (11%) of these were for Exceptional talent visas, (sponsored by; Arts Council England, The British Academy, The Royal Society, The Royal Academy of Engineering, Tech City UK), an increase of 130% over the preceding year. The annual number of places available is 1,000 per year.
In the year ending December 2016, the Office for National Statistics (ONS) estimates there were 66,000 non-European Union (EU) long-term immigrants for work, a 7,000 decrease compared with the previous year (the difference was not statistically significant).
According to the latest estimates from the Labour Force Survey, the number of people employed in the UK increased by 385,000 to 31.9 million. This increase was accounted for by UK nationals (around 46%) and EU nationals (around 44%), with the remaining 9% by non-EU nationals.
2. Work immigration: latest trends
| Year ending March 2016 | Year ending March 2017 | Change | Percentage change | |
|---|---|---|---|---|
| Work-related visas granted | 163,783 | 164,168 | +385 | 0% |
| of which: | ||||
| High value (Tier 1) visas | 4,771 | 4,677 | -94 | -2% |
| Skilled (Tier 2) visas | 91,797 | 93,566 | +1,769 | +2% |
| Youth mobility and temporary workers (Tier 5) visas | 43,574 | 41,798 | -1,776 | -4% |
| Non-PBS/Other work visas | 23,641 | 24,127 | +486 | +2% |
| Year ending December 2015 | Year ending December 2016 | Change (2) | Percentage change | |
| Long-term immigration for work (1), excluding dependants | 73,000 | 66,000 | -7,000 | -10% |
| Long-term (1 year or more) work-related visas, excluding dependants | 81,691 | 73,359 | -8,332 | -10% |
Table notes
Source: Home Office, Immigration Statistics January to March 2017, Visas table vi 04_q (Visas volume 1), International Passenger Survey (IPS), ONS Migration Statistics Quarterly Report.
(1) Immigration for work data are estimates of the number of non-EU nationals intending to change their residence to the UK for at least 12 months based on the IPS.
(2) The decrease of 7,000 in non-EU work-related immigration for the year ending December 2016 has an estimated confidence interval of +/-14,000.
3. Long-term trends in work-related immigration
There was a long-term reduction in work-related visas granted, admissions, and non-EU immigration from 2006 to 2012. Since 2013, increases have been seen in all groups, with some fluctuations.
The chart below shows that IPS estimates of non-EU work immigration are substantially lower as these include only those migrants who state they intend to remain in the UK for a year or more. However, the two series show broadly similar trends with falls from 2006 followed by increases from the middle of 2013 and relative stability over the latest year.
Long-term trends in work-related immigration
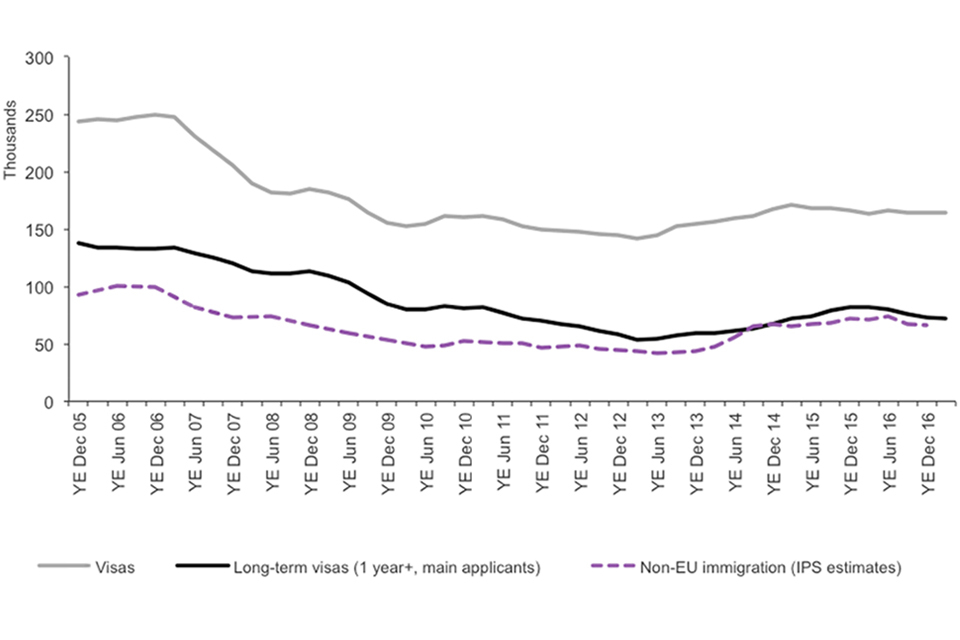
The chart shows the trends for Work visas granted, admissions, and IPS estimates of non-EU immigration between 2005 and the latest data published. The data are sourced from Visas table vi 04 q and corresponding datasets.
Chart notes
Source: Home Office, Immigration Statistics January to March 2017, Visas table vi 04 q (Visas volume 1), and corresponding datasets; ONS, Migration Statistics Quarterly Report.
There are a range of potential reasons why IPS figures differ from figures for Work visas granted or passenger arrivals, and hence why the trends in the different series do not always correspond. Further comparisons of the data are described in the User Guide to Home Office Immigration Statistics.
4. Skilled work
In the year ending March 2017, almost all (97%) of the 96,291 decisions made on entry clearance applications for Skilled work were grants (93,566). The rise in Skilled (Tier 2) grants was accounted for by increases in Tier 2 General main applicants (up 5% to 18,594) and long-term Intra-Company Transfers (up 10% to 29,068).
Indian nationals accounted for 58% of skilled work visas granted in the year ending March 2017.
4.1 Sponsored visa applications, by nationality and industry sector
The number of sponsored visa applications for Skilled work was 56,051 in the year ending March 2017 (main applicants, CoS used), similar to the year ending March 2016 (56,324). The largest change was in the Human health and social work activities sector, an increase of 1,445 (36%), which is largely likely to reflect the addition of nurses to the government’s shortage occupation list in November 2015.
There were 23,316 applications from the Information and Communication sector in the year ending March 2017, and this sector alone accounted for 42% of all Skilled work-sponsored visa applications. Applications from this sector have decreased (by 560; -2%) in the year ending March 2017.
Sponsored visa applications by industry sector, year ending March 2017
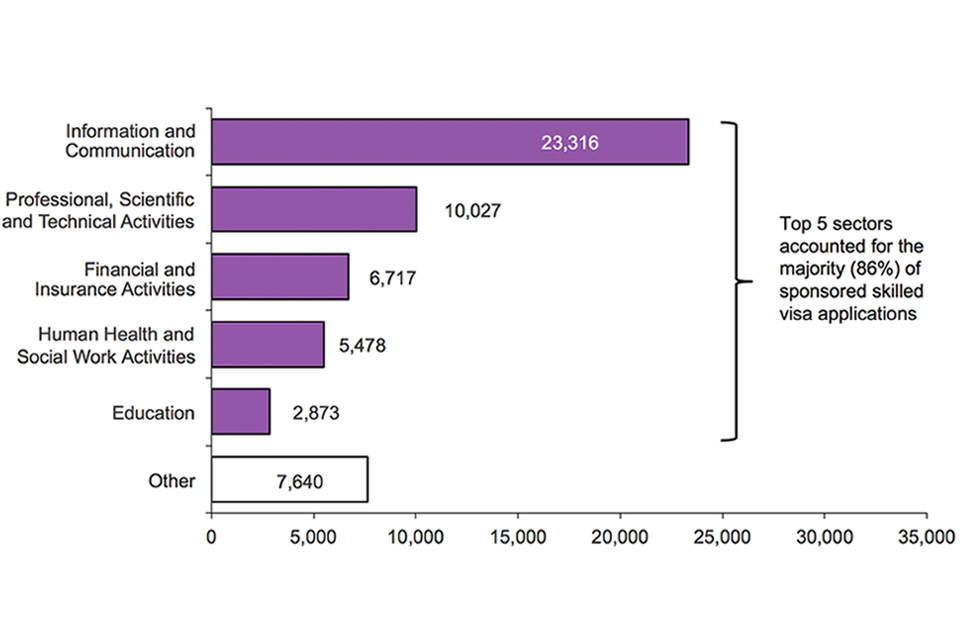
The chart shows the sponsored visa applications by industry sector for the year ending March 2017. The data are sourced from the Sponsorship tables. The top 5 sectors accounted for the large majority (86%) of sponsored Skilled work visa applications.
Chart notes
Source: Home Office, Immigration Statistics January to March 2017, Sponsorship tables. Main applicants only.
5. Data tables
Data on immigration for work, sourced from Home Office administrative systems, can be found in the following tables:
Sponsorship tables
Visas tables volume 1
Visas tables volume 2
Visas tables volume 3
Admissions tables
Extensions tables
Settlement tables
European Economic Area (EEA) tables