How many people do we grant asylum or protection to?
Published 25 May 2017

© Crown copyright 2017
This publication is licensed under the terms of the Open Government Licence v3.0 except where otherwise stated. To view this licence, visit nationalarchives.gov.uk/doc/open-government-licence/version/3 or write to the Information Policy Team, The National Archives, Kew, London TW9 4DU, or email: psi@nationalarchives.gov.uk.
Where we have identified any third party copyright information you will need to obtain permission from the copyright holders concerned.
This publication is available at https://www.gov.uk/government/statistics/immigration-statistics-january-to-march-2017/how-many-people-do-we-grant-asylum-or-protection-to
Back to Immigration Statistics January to March 2017 content page.
This is not the latest release. View latest release.
Data relate to the year ending March 2017 and all comparisons are with the year ending March 2016, unless indicated otherwise.
This section covers asylum applications, initial decisions, estimated final outcomes, resettlement, unaccompanied asylum-seeking children (UASC), international comparisons and support.
1. Key facts
In the year ending March 2017, there were 9,634 grants of asylum or an alternative form of protection to main applicants and their dependants, and an additional 6,245 people newly provided with protection and support under a resettlement scheme the UK.
Asylum applications in the UK from main applicants decreased by 17% to 28,891 in the year ending March 2017.
There were 3,680 asylum applications from UASC in the year ending March 2017, a 9% increase compared to the previous year (3,389). Overall, UASC applications represented 13% of all main applications for asylum.
Of the 24,293 initial decisions on asylum applications from main applicants, 33% were grants of asylum or an alternative form of protection, compared to 40% in the previous year. A separate Home Office analysis shows that for the years 2012 to 2014, on average 36% of decisions were granted initially, but this proportion rose to 49% after appeal.
There were 1,507 grants of asylum or an alternative form of protection to Syrian nationals at initial decision in the year ending March 2017 and an additional 5,453 Syrian nationals were granted humanitarian protection under the Syrian Vulnerable Persons Resettlement Scheme (VPRS). Since this scheme began in 2014, a total of 7,307 people have been resettled.
2. Long-term trends in asylum applications for main applicants
The chart below shows the annual number of asylum applications made since 2001.
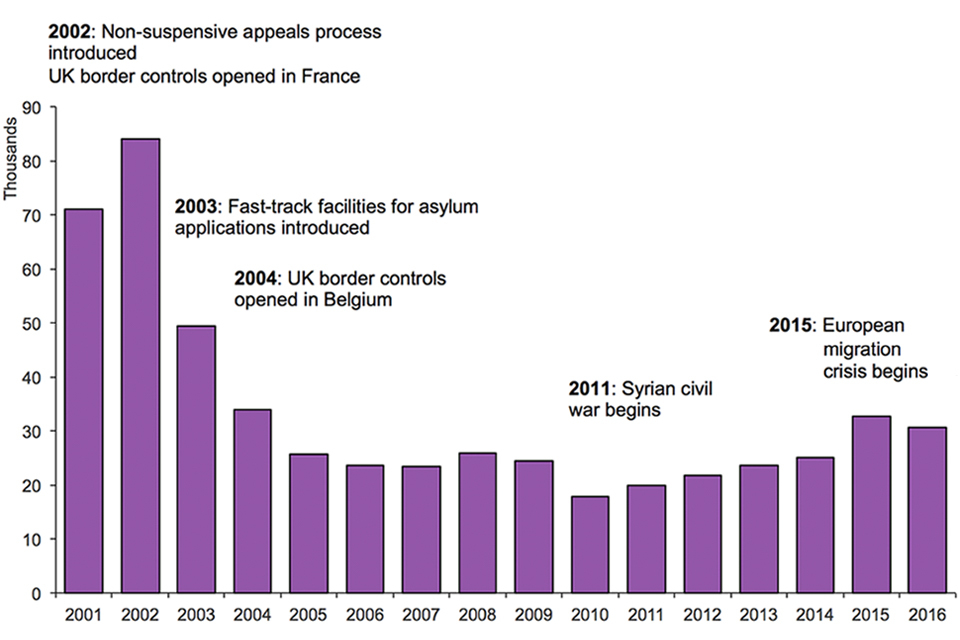
The chart shows the number of asylum applications made between 2001 and the latest calendar year. The data are available in Asylum table as 01.
Chart notes
Source: Home Office, Immigration Statistics January to March 2017, Asylum table as 01 (Asylum volume 1).
3. Asylum applications by nationality
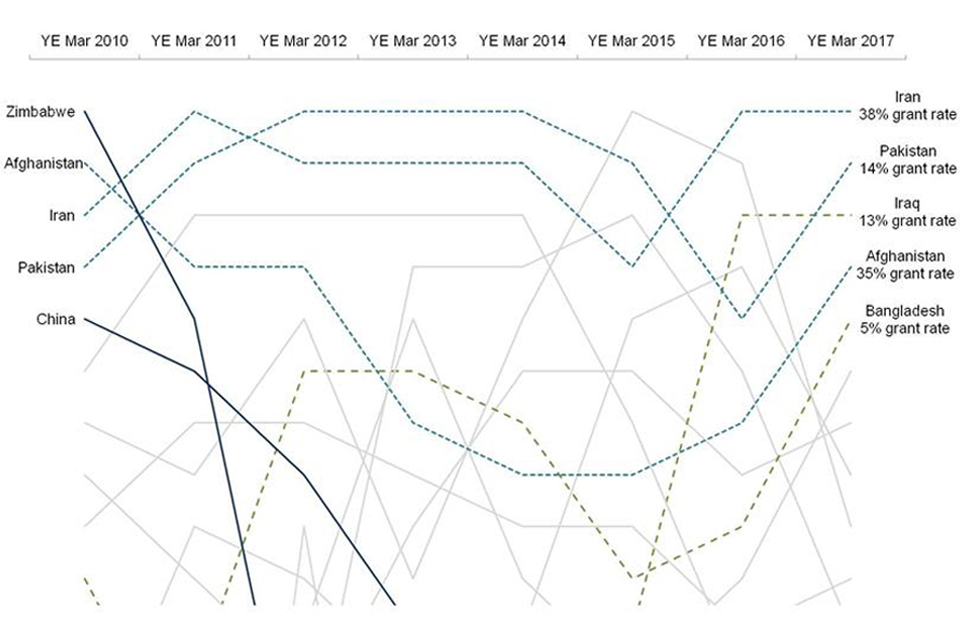
The chart shows the top 5 ranked nationalities for asylum applications between the year ending March 2010 and the year ending March 2017. The data are available in table as 01.
Chart notes
Source: Home Office, Immigration Statistics January to March 2017, Asylum table as 01 (Asylum volume 1).
Three of the top 5 nationalities applying for asylum in the year ending March 2010 were still present in the top 5 in the year ending March 2017 (Afghanistan, Iran and Pakistan). Zimbabwe was ranked first for asylum applications in the year ending March 2010, but fell to 21st in the year ending March 2017. Iraq is now ranked third for asylum applications, up from the series low of 18th in the years ending March 2012 and 2013.
4. Unaccompanied asylum-seeking children
A UASC is a person under 18, or in the absence of documentary evidence establishing age, appears to be under 18, who is applying for asylum in his or her own right and has no relative or guardian in the United Kingdom.
There were 3,680 asylum applications from UASC in the year ending March 2017, a 9% increase compared to the previous year (3,389). Overall, UASC applications represented 13% of all main applications for asylum.
Of the 1,747 initial decisions relating to UASC made in the year ending March 2017, 38% were grants of asylum or another form of protection, and 40% were grants of temporary leave (UASC leave). UASC applicants that are refused will include those from countries where it is safe to return children to their families, as well as some applicants who were determined to be over 18 following an age assessment.
5. Support provided to asylum seekers
At the end of March 2017, a total of 39,365 people were receiving a cash allowance, somewhere to live, or both, in the UK (under Section 95 of the Immigration and Asylum Act 1999). This number has increased from 35,683 at the end of March 2016. The total figure remains considerably below that for the end of 2003 (the start of the published data series), when there were 80,123 people in receipt of Section 95 support.
Separately, at the end of March 2017, there were 3,821 people receiving support under Section 4 of the Immigration and Asylum Act 1999.
6. Resettlement
In addition to those asylum seekers who apply in the UK, resettlement schemes are offered to those who have been referred to the Home Office by The United Nations Refugee Agency (UNHCR).
On 7 September 2015, an expansion to the existing Syrian VPRS was announced. Through this expansion, it was proposed that 20,000 Syrians in need of protection be resettled in the UK by 2020. A total of 7,307 people have been granted humanitarian protection under the Syrian VPRS since the scheme began, and in the year ending March 2017, 5,453 people were resettled under the Syrian VPRS across 235 different local authorities. Half (50%) of those resettled under the Syrian VPRS were under 18 years old (2,726), and around half (47%) were female (2,571).
7. International comparisons
Figures in this section are based on data supplied by the individual countries to the Intergovernmental Consultations on Migration, Asylum and Refugees (IGC), UNHCR and Eurostat. Not all countries provide the latest data in time for each Immigration Statistics release. Where a figure is unavailable for a given month, we estimate it using the average of the last 3 months available, unless the time series is erratic, when we use the average of the last 12 months.
Including dependants, the total number of asylum applications to the EU in the year ending March 2017 was an estimated 1,062,000, a decrease of 25% compared to the year ending March 2016 (1,410,000).
Top EU countries receiving asylum applications, 2016
| Country of application | Total applications | Total positive decisions | Total resettled |
|---|---|---|---|
| Germany | 722,265 | 433,910 | 1,240 |
| Italy | 121,185 | 35,400 | 1,045 |
| France | 75,990 | 28,750 | 1,420 |
| Greece | 49,875 | 2,710 | 0 |
| Austria | 39,860 | 30,370 | 200 |
| United Kingdom (HO data) | 38,517 | 9,933 | 5,181 |
Table notes
Source: Eurostat Asylum quarterly report.
(1) Figures are rounded to the nearest 1,000 and so may not sum to the total.
(2) The estimated figures in this chart are based on data supplied to IGC and UNHCR.
8. Data tables
Data referred to here can be found in the following tables:
Asylum tables volume 1
Asylum tables volume 2
Asylum tables volume 3
Asylum tables volume 4