Immigration statistics, January to March 2012
Published 24 May 2012

© Crown copyright 2012
This publication is licensed under the terms of the Open Government Licence v3.0 except where otherwise stated. To view this licence, visit nationalarchives.gov.uk/doc/open-government-licence/version/3 or write to the Information Policy Team, The National Archives, Kew, London TW9 4DU, or email: psi@nationalarchives.gov.uk.
Where we have identified any third party copyright information you will need to obtain permission from the copyright holders concerned.
This publication is available at https://www.gov.uk/government/statistics/immigration-statistics-january-to-march-2012--2/immigration-statistics-january-to-march-2012
This is not the latest release. View latest release.
1. Immigration statistics January to March 2012: summary of key facts
1.1 Interpreting the figures
This release includes new data for the first quarter of 2012 and provisional annual data for 2011.
Topics covered are:
- work
- study
- family
- before entry
- admissions
- extensions
- settlement
- citizenship
- asylum
- removals and voluntary departures
- detention
- European Economic Area
The trends reflect changes in levels of immigration, policy and legislative changes, including changes to the Immigration Rules, and world events, as well as the availability and allocation of resources within the UK Border Agency.
1.2 Key facts
Work, study and family
For those who are subject to immigration control (non-EEA nationals) the latest data for visas granted showed falls for study (-21%), work (-8%) and family reasons (-16%), to the lowest 12 monthly total recorded using comparable data available from 2005. Recent falls for work and study are likely to be partly due to policy changes for these routes which came into effect from 2011.
Before entry
Excluding visitor and transit visas, 13% fewer visas were issued in the year ending March 2012 (529,000) than the previous 12 months (609,000). By contrast, the number of visitor visas issued continued to rise, to a record 1.7 million, 9% higher than the previous 12 months (1.6 million).
There were 10% fewer non-asylum passengers initially refused entry at ports in the year ending March 2012 (16,382), compared with the previous 12 months (18,120), continuing the calendar year on year falls from 38,391 in 2004.
Admissions
The number of passenger journeys to the UK rose 4% in the year ending March 2012 (106.2 million) compared with the previous 12 months (102.2 million), comprising 3.5 million more journeys (%2B4%) by British, other EEA and Swiss nationals, and 0.5 million more journeys (+4%) by non-EEA nationals. The 4% increase is likely, in part, to reflect lower passenger arrivals during April 2010 because of airport closures due to a volcanic ash cloud.
Extensions
There were 276,600 grants of an extension of stay in the year ending March 2012, 10% lower than the previous 12 months (308,100), largely due to a 28% fall in grants of extensions in the study category, which were partially offset by an increase in the work category. The latest total continued the fall from the previous two years (330,700 and 366,600 in the years ending March 2010 and March 2009 respectively).
Settlement
The number of people granted settlement in the year ending March 2012 fell by a third (-35%) to 148,144, compared with the previous 12 months (226,478). Most of the fall was due to 68,144 fewer grants on a discretionary or other basis which in recent years were mainly granted following a review of asylum applications made before March 2007. The large fall is associated with the completion of the review of these cases. There were also falls in the work (-6%) and the family (-19%) categories.
Citizenship
There were 175,298 grants of British citizenship in the year ending March 2012, 10% fewer than in the previous year (195,369), mainly due to 10,979 fewer grants based on marriage (-24%) and 8,163 fewer grants to children related to British citizens (-17%).
Asylum
There were 4,818 asylum applications during the first quarter of 2012, 1% lower than the first quarter of 2011 (4,844). Pakistan (706) and Iran (575) had the most asylum applications in Q1 2012. However, this followed asylum increases for each quarter in 2011 compared with the same quarter in 2010. Applications were 11% higher in 2011 at 19,804 than in 2010 (17,916), mainly due to an increase in applications from nationals of Pakistan, Libya and Iran.
Detention
During the first quarter of 2012, 7,516 people entered immigration detention, 7% more than in the first quarter of 2011 (7,015). Of these 7,516, 53 were recorded as being under 18 (children), which compares with 10 in the first quarter of 2011. Of the 53 children, 35 were children held at the new Cedars pre-departure accommodation, which is specifically designed for children and their families, 12 were border cases detained at Tinsley House, the remaining 6 were age dispute cases detained at Campsfield House, Colnbrook Short Term and Morton Hall. There was one child in detention as at 31 March 2012.
Removals and voluntary departures
There were 13,386 people (including port removals) who left forcibly or voluntarily during the first quarter of 2012. This was 6% less than the first quarter of 2011 (14,224) and a 26% fall compared with the last peak in the third quarter of 2008 (18,078) - the highest quarterly figure since the publication of data began in the first quarter of 2001.
The 6% fall was mostly accounted for by fewer non-asylum cases refused entry at port and subsequently removed (3,095 in Q1 2012 compared with 3,822 in Q1 2011). Excluding port removals, the number of enforced removals and voluntary departures during the first quarter of 2012 (10,291) was at a similar level of departures recorded during the first quarter of 2011 (10,402).
1.3 Headline statistics: latest 12 months
The table shows the headline numbers for the latest available 12 months, and the percentage change compared with the previous 12 months.
| Year ending March 2012 | Year ending March 2011 | Percentage change | |
|---|---|---|---|
| Before entry visitor visas issued | 1.7 million | 1.6 million | +9% |
| Admissions (journeys) | 106.2 million | 102.2 million | +4% |
| Extensions - grants | 276,642 | 308,122 | -10% |
| Settlement - grants | 148,144 | 226,478 | -35% |
| Citizenship - grants | 175,298 | 195,369 | -10% |
Headline statistics – quarterly data
The table shows the headline numbers for the latest quarter, and the percentage change compared with the same quarter 1 year previous.
| January to March 2012 | January to March 2011 | Percentage change | |
|---|---|---|---|
| Asylum applications (1) | 4,818 | 4,844 | -1% |
| Total removals and voluntary departures (2) | 13,386 | 14,224 | -6% |
Table notes
(1) Excludes dependants.
(2) Includes dependants.
(3) The above data are compared using quarterly comparisons rather than rolling 12-month totals in line with established practice and reflecting that these data series are not identified as subject to seasonal variability.
1.4 Data tables
Further data in conjunction with the topic briefing are available in immigration statistics January to March 2012 tables
1.5 Frequency
This release is updated quarterly (headline tables are updated quarterly and some more detailed tables are updated 6 monthly or annually. Where data in topic text has not been updated and the relevant tables are planned to be updated in future, this is indicated in the text)
1.6 Purpose of the statistics
The purpose of this release is to give an overview of the work of the UK Border Agency, Border Force and other government departments and agencies dealing with immigration; to help inform users including the government, Parliament, the media and the wider public; and to support the development and monitoring of policy.
1.7 What’s new
Provisional data for 2011 have been provided for a range of datasets. The ‘Index’ worksheet for each set of tables contains details of which tables have been updated in this release. Annual tables that have not been updated with 2011 data in this release, in particular those containing detailed data, will be updated in August or November 2012.
Within the Detention briefing tables for those entering detention have been extended to include earlier data that previously released and a wider range of grouping for length of detention. Two new tables have also been added for children leaving detention, by location, reason and length of detention.
In April 2011 the transitional measures put in place by the UK government to regulate EU8 nationals’ access to the labour market (through the Workers Registration Scheme) and to restrict access to benefits came to an end. Figures for this data series ended at the end of April 2011. Within the EEA briefing, tables ee.03 and ee.04 have been dropped from this release, since the schemes they related to have been closed.
Within the Extensions briefing, previously published tables have been reformatted and integrated into other tables (Tables ex.01, ex.02, ex.04.q, ex.05.q, ex.06 and ex.06.q have been combined with tables ex.01 and ex.01.q).
Within the Removals and Voluntary Returns briefing the table for enforced removals and voluntary departures by harm assessment categories has been extended to separate out all categories including those defined as ‘low’ harm.
In response to the recommendations from the UK Statistics Authority (UKSA) assessment of Immigration Statistics improvements have been made throughout the release to meet the requirements of the assessment report:
- within the user guide, expanded text provides a fuller description of the data quality, compilation methods and checks carried out, details of sources used and strengths and weaknesses such as potential sources of errors (e.g. sampling variability).
- the user guide includes addition information clarifying which outputs are considered ‘official statistics’ and not designated as ‘National Statistics’, a link to ONS’ conceptual framework for international migration statistics, and where appropriate individual topic text now carries the ‘National Statistics’ logo.
- information on revisions is now reported more consistently including whether overall trends are affected by revisions, and details of revisions are included within both topic text and on this page.
- the release also includes additional references to relevant policy changes or reports, to help improve the interpretability of the statistics.
- plans have been developed to provide further information about the nature and extent of revisions for each topic, in a consistent format, planned for the user guide for the August 2012 release.
1.8 Revisions to data
Within the Citizenship briefing, there have been minor revisions of figures relating to applications, grants and refusals of British citizenship in 2011. These are due to the replacement of estimates of applications received in Q2, Q3 and Q4 2011 with actual figures (see User Guide for details) and the production of a single consolidated data set for 2011, replacing those used in the production of the quarterly reports. Data relating to decisions is subject to revisions as a result of the outcomes of the administrative reconsideration of a small (0.01%) proportion of cases.
Data for the first quarter of 2012 relating to the Sector Based Scheme (SBS) or Seasonal Agricultural Workers Scheme (SAWS) is highly provisional and likely to be revised significantly in future (based on previous experience of these data sources) and has therefore not been used within the EEA topic commentary. Nationals of Bulgaria and Romania (the ‘EU2’ countries) currently have certain restrictions placed on them; other nationals of EEA countries can apply for documentation that shows that they have the right of free movement. In the first 12 months of stay, working Bulgarian and Romanian nationals are generally required to hold an accession worker card or apply for one of two lower-skilled quota schemes: the SBS or SAWS. Other Bulgarian and Romanian nationals can apply for a registration certificate, giving proof of a right to live in the UK.
1.9 Future changes
Specific future changes planned, subject to data quality and available resources, include:
- within tables detailing nationalities, disaggregating the current ‘Stateless’ grouping into ‘Stateless’ and ‘Refugee’ following user requests;
- improving the data quality of the data on Unaccompanied Asylum Seeking Children (UASC) and age disputed cases to ensure that those whose age dispute case has been fully resolved are counted. The old methodology may have included cases where the individual stopped being an UASC;
- Before Entry data on entry clearance visas granted by nationality by category for earlier years (2011 data published in February 2012), planned for August 2012 release;
- further information about the nature and extent of revisions for each topic, in a consistent format, planned for the user guide for the August 2012 release.
There will be consideration of the feasibility of developing figures for Certificates of Sponsorship and Confirmation of Acceptance for Studies, which are used to support visa applications for the work and study routes respectively.
Further improvements are planned to address the requirements of the UK Statistics Authority (see details below) and further tables will be converted to the re-designed format.
1.10 National Statistics Assessment
In autumn 2011, the UK Statistics Authority assessed Immigration Statistics against the Code of Practice for Official Statistics, as part of its routine programme of assessments. The assessment report, Statistics on Immigration (Home Office), was published on 2 February 2012, and, subject to meeting the report’s 5 requirements, this release will be re-designated by the Authority as National Statistics. More information on National Statistics and the Code of Practice for Official Statistics can be found on the UK Statistics Authority website.
The formal requirements of the assessment report broadly relate to improving and clarifying information about data sources, data quality and revisions to data, improving interpretability and clarifying the status of data that were previously labelled as management information. Home Office Statistics intend to make the improvements needed, including developing plans where appropriate, by the end of May 2012.
The ‘Immigration Statistics’ release is a National Statistics output produced to the highest professional standards and free from political interference. It has been produced by statisticians working in the Home Office Statistics Unit in accordance with the Home Office’s ‘Statement of compliance with the Code of Practice for Official Statistics’ which covers our policy on revisions and other matters. The governance arrangements in the Home Office for statistics were strengthened on 1 April 2008 to place the statistical teams under the direct line management of a Chief Statistician, who reports to the National Statistician with respect to all professional statistical matters.
1.11 Further information and feedback
If you have any questions or comments about this release, please send an email to MigrationStatsEnquiries@homeoffice.gov.uk or write to:
The Editor, Immigration Statistics,
Migration Statistics,
Home Office Statistics,
2nd Floor Green Park House
29 Wellesley Road
Croydon CR0 2AJ
Press enquiries should be made to:
Home Office Press Office
Peel Building
2 Marsham Street
London
SW1P 4DF
T: 020 7035 3535
The Home Office Responsible Statistician is David Blunt, Chief Statistician and Head of Profession for Statistics.
1.12 Communications
An email distribution list is available to allow communication between users and producers of migration statistics throughout the year.
Specifically, this is a forum for discussion of migration statistics that allows users to discuss their need for and use of the data and for producers to consult on presentation and changes. The main focus will be on figures for the United Kingdom, but this would not exclude discussion of migration statistics for other countries. Home Office Statistics intends to use this list for communication with users, including data and release developments.
A one-day migration statistics user conference is also planned for 18 September 2012. Details of the event are now available, including a draft programme and details of how to book a place. These can be viewed at:
Conference of the Migration Statistics User Forum
The conference programme has a wide range of speakers from Home Office Statistics, the Office for National Statistics and users of the statistics. The day is also designed to allow lots of scope for discussion and questioning. The day is free of charge for users of migration statistics but pre-registration is essential.
2. Work
Valid: 24 May to 30 August 2012
2.1 Interpreting the figures
There are a range of measures that can be used to monitor those, subject to immigration control, coming to the United Kingdom to work. These include:
- issues of visas for entry clearance, providing information of those intending to come
- admissions data, providing information on migrants at the border
- numbers of people allocated national insurance numbers, providing an indication of migrants entering the labour market
- estimates on non-EU immigration from the International Passenger Survey (IPS) on migrants intending to stay for at least a year for work purposes
In addition, grants of (in-country) extensions of stay for work purposes provide information on migrants in-country, while work-related grants of settlement provides a measure of longer-term migration.
These various statistics and research can appear to give different pictures of immigration for work. Often this is because the latest data for different measures cover different time periods. In addition, they also count different aspects of the immigration process, with some showing intentions or permissions, while others show actual events.
The User Guide provides further details on the topics related to work including, definitions used, how figures are compiled, data quality and issues arising from figures being based on data sourced from an administrative database or from surveys.
The figures include dependants, unless stated otherwise. Data are provided to the nearest thousand; the accompanying tables provide unrounded data (except for admissions data).
All data for 2010 and 2011 are provisional, except for IPS estimates which have been finalised for 2010.
Figures for entry clearance visas are Official Statistics and have not been designated as National Statistics. For details about the quality of the data relating to these figures please see the User Guide.
2.2 Key facts
There were 148,000 visas issued for work in the year ending March 2012, 8% fewer than the previous 12 months (162,000), the lowest 12 monthly total recorded using comparable data available from 2005. This fall was largely due to lower numbers in the Tier 1 (Highly skilled) General category, from 24,000 to 9,000, reflecting the closure of the Tier 1 general route. There was a slight, 3%, increase in visas issued for the Tier 2 (skilled) route from 64,000 to 66,000.
Overall, the number of visas issued for work has fallen each year since its peak in 2006 (250,000), as has number of non-EU immigrants who entered for work (106,000 in 2006). Extensions of stay had also fallen from a peak in 2008 (188,000). These changes are likely, in part, to reflect the introduction of the points-based system from 2008.
For the purposes of publication figures for passenger arrivals are published by European Economic Area (EEA), whereas figures from the IPS are published with reference to membership of the European Union (EU).
In the year ending June 2011, the latest data available, there were 2% more passenger arrivals (161,000 journeys) of non-EEA nationals for work compared with the previous 12 months (159,000); provisional IPS estimates show that in the year ending September 2011 some 52,000 non-EU nationals migrated to the UK for work (either going to a definite job or to look for work) intending to stay for a year or more, 6% more than the previous 12 months (49,000). There was a smaller, 4%, increase in non-EU nationals emigrating from the UK for work, from 69,000 to 72,000. Differences between flows of immigration and emigration for work reasons need to be interpreted with caution. Some immigrants are likely to have originally entered the UK for other reasons outside of work such as study or family reasons while others will have gained citizenship whilst in the UK.
Compared with non-EU nationals, the IPS figures indicate a different picture for immigration for work by UK and by other EU nationals, which both fell 17%. There were larger increases (20% for the UK and 24% for other EU nationals) for those emigrating for work, though again original reasons for being in the country may not have been work-related.
Comparison of sources of data on work-related immigration
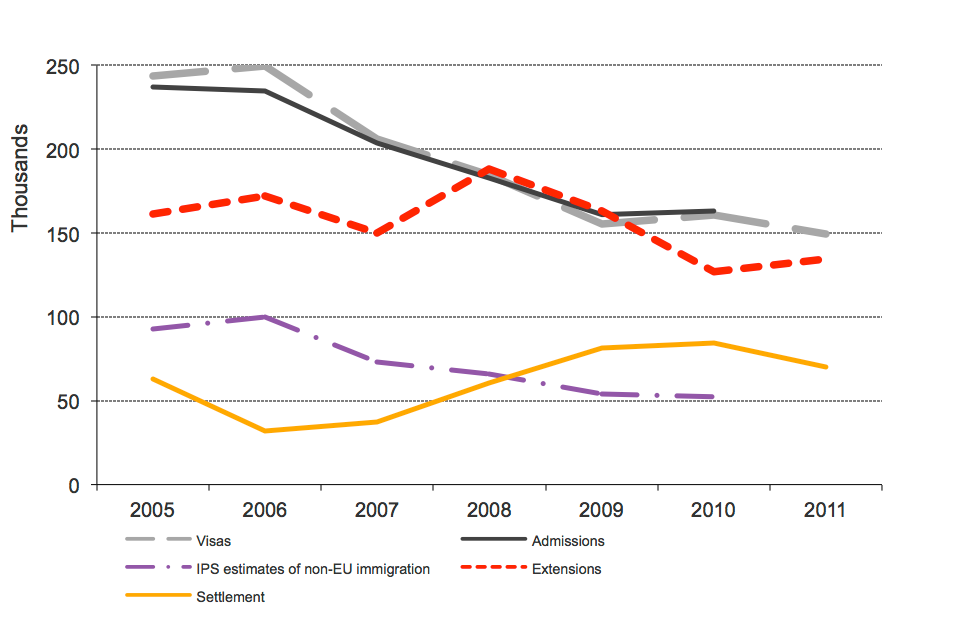
The chart shows the trends of visas issued, passenger arrivals and International Passenger Survey (IPS) estimates of immigration for work between 2005 and the latest calendar year. The data are sourced from Tables be.04, ad.01, ex.03 and se.02. Estimates
Chart notes
Source: Home Office, immigration statistics January to March 2012, Before Entry Table be.04, Admissions Table ad.01, Extensions Table ex.03 and Settlement Table se.02; Office for National Statistics.
The above chart shows that IPS estimates, while being substantially lower, follow a broadly similar trend to work visas issued and passenger arrivals, with increases in all three series between 2005 and 2006, followed by 3 years of decrease. Two reasons why IPS estimates of immigrants for work are lower than figures for work visas issued or passenger arrivals are that the IPS figures exclude any workers who intend to stay for less than a year and the admissions and visas data include dependants. Further reasons are described in the User Guide.
2.3 Data tables
Data on immigration for work, sourced from Home Office administrative systems, can be found in the following tables:
- Before entry (Tables be.01 to be.04q and be.06.w)
- Admissions (Tables ad.02 to ad.03 and ad.03.w)
- Extensions (Tables ex.01 to ex.02)
- Settlement (Tables se.01 to se.05)
2.4 Nationalities arriving for work
Data for arrivals by nationality in 2011 are planned to be published in Immigration Statistics April – June 2012, due to be released in August 2012, as part of additional analysis of data for 2011.
The countries whose nationals (subject to immigration control) accounted for the largest shares of the 163,000 admissions for work in 2010 were: India (28%), United States (17%), Australia (10%), Canada (4%), the Philippines (4%), Pakistan (4%), New Zealand (3%), Japan (3%), China (3%) and Nigeria (2%). Together these accounted for 78% of such admissions.
2.5 Extensions of stay
Latest annual data show that there were 134,000 work-related grants of extensions in 2011, 6% higher than 2010 (127,000), after falling from 188,000 in 2008.
Data for grants by nationality in 2011 are planned to be published in Immigration Statistics April – June 2012, due to be released in August 2012, as part of additional analysis of data for 2011.
In 2010, the countries whose nationals (subject to immigration control) accounted for the largest shares of the 89,000 grants of extensions of stay (excluding dependants) in the work category were: India (31%), Pakistan (9%), China (8%), Nigeria (7%), the Philippines (5%), Turkey (5%), United States (4%), Sri Lanka (3%), Bangladesh (3%), Australia (2%). Together these accounted for 76% of such extensions.
2.6 Settlement
The latest data show that work-related grants of settlement fell by 17% from 84,000 in 2010 to 70,000 in 2011. This decrease follows a broadly rising trend in work-related grants that had partly reflected an increase in the number of people admitted in work categories 5 years earlier. The dip in the number of work-related grants in 2006 and 2007 reflect a change in the qualifying period for settlement from 4 to 5 years, delaying grants that would otherwise have occurred earlier.
Data for grants by nationality in 2011 are planned to be published in Immigration Statistics April – June 2012, due to be released in August 2012, as part of additional analysis of data for 2011.
In 2010 the countries whose nationals (subject to immigration control) accounted for the largest shares of the 37,000 grants of settlement (excluding dependants) in the work category were: India (29%), the Philippines (9%), South Africa (8%), Pakistan (6%), China (5%), Zimbabwe (4%), Australia (4%), Nigeria (4%), United States (3%), and New Zealand (2%). Together these accounted for three-quarters of such grants.
2.7 Non-EU nationals working in the United Kingdom
In 2010 there were 1.2 million non-EU foreign nationals living and working in the United Kingdom, of whom 477,000 were in the ‘Professional, employers, managers’ socio-economic group. Of these 1.2 million nationals: 302,000 worked in the ‘distribution, hotels and restaurants’ sector; 222,000 worked in the ‘banking and finance’ sector; and 427,000 were classified under ‘Other’ (including public administration, education, and health). More than half lived in London (515,000) or the South East (211,000).
In 2009/10 there were 299,000 non-EU foreign nationals registered and allocated a National Insurance Number (NINo), mainly from Asia and the Middle East (191,000), a slight fall from the 309,000 in 2008/9. These numbers will include people admitted to the United Kingdom for reasons other than work, for example: students who are allowed to work a limited number of hours; and those admitted for family reasons, as well as refugees. Equally, there may be significant lags between some migrants arriving in the United Kingdom and obtaining a NINo, for example children who join or accompany others.
Source: International Migration and the United Kingdom Report of the United Kingdom SOPEMI Correspondent to the OECD 2010 Chapter 4 Tables 4.5, 4.6, 4.7 using the Labour Force Survey (ONS) and Table 4.24 from the National Insurance Recording System, DWP.
2.8 Staying in the United Kingdom
Research undertaken for the Migrant Journey Analysis showed that, of the 105,880 migrants granted visas in 2004 in the work (leading to citizenship) route; two-fifths (40%) appear to have remained in the immigration system after 5 years, three-quarters of whom had been granted settlement. Similarly, in the 2004 cohort of 94,540 migrants granted work-related visas in the work (not leading to citizenship) route, 11% appear to have remained in the immigration system after 5 years, most of whom had moved into the work (leading to citizenship) route, with 3% having been granted settlement.
Source: Migrant Journey Analysis, Home Office Migration Research
2.9 Other related data
Estimates of those coming for work, International Migration, intending to stay for 12 months or more; international short term migration estimates for England and Wales; and United Kingdom labour market statistics including data on employment rates and changes by country of birth and by nationality are published by the Office for National Statistics.
National Insurance Number Allocations to Adult Overseas Nationals entering the UK are published by the Department for Work and Pensions. On 20 January 2012, the department published a report on ‘Nationality at point of National Insurance number registration of DWP benefit claimants: February 2011 working age benefits’.
On 10 January 2012, the Migration Advisory Committee published a report ‘Analysis of the Impacts of Migration’ as well as 6 external research reports that it commissioned to inform it.
The MAC published on 28 February 2012 a report ‘Limit on Tier 2 (General) for 2012/13 and associated policies’ as well as 2 external research reports Can immigration constitute a sensible solution to sub-national and regional labour shortages? - Dustmann, Frattini and Preston, December 2010 and Skilled immigration and strategically important skills in the UK economy - NIESR, January 2012.
The Before Entry, Admissions and Settlement sections of the User Guide includes a discussion on the differences between the various data sources presented on immigration for work.
3. Study
Valid: 24 May to 30 August 2012
3.1 Interpreting the figures
There are a number of different measures that can be used to monitor numbers of people coming to the United Kingdom for study.
For those students who are subject to immigration control, administrative information is available on student visas and visa extensions, as well as records of students admitted. The International Passenger Survey (IPS), run by the Office for National Statistics (ONS), provides estimates of all students arriving in the United Kingdom, with the ONS migration statistics focusing on those who intend to stay for a year or more. Research into students has also been published, for example the Migrant Journey Analysis that involved linking records to give a more complete picture as to what happened to a group of students over a 5-year period.
These various statistics and research can appear to give different pictures of student immigration. Often this is because the latest data for different measures cover different time periods. In addition, they also count different aspects of the immigration process, with some showing intentions or permissions, while others show actual events.
The User Guide provides further details on the topics relating to study including definitions used, how figures are compiled, data quality and issues arising from figures being estimated from samples or based on data sourced from an administrative database
Except for sections on dependants and student visitors, all numbers in this summary relate to students excluding student visitors, who come to study for less than six months, and dependants. The IPS estimates relate to non-EU citizens who migrate to the UK for 12 months or more. These are to provide a reasonable comparison between the IPS estimates and Home Office administrative data. Data are provided to the nearest thousand; the accompanying tables provided unrounded data (except for admissions data).
Figures for entry clearance visas are Official Statistics and have not been designated as National Statistics. For details about the quality of the data relating to these figures please see the User Guide.
All data for 2010 and 2011 are provisional, except for IPS estimates which have been finalised for 2010.
3.2 Key facts
Between 2005 and 2010, student immigration had seen a general increase, with the range of measures showing that numbers rose particularly rapidly in 2009. The increase in 2009 was largely driven by an increase in students from Asia. However, there are signs that student immigration may have peaked, as the various data sources have all seen some decrease since peaks in the latter part of 2010. In particular, entry clearance visa data, which provide the most up-to-date picture of immigration show that to the year ending March 2012, 206,000 visas were issued, a 21 per cent fall to the level seen in the year ending March 2011 (262,000).
For the year ending June 2011 (the latest available across all data sets), there was a 6% fall in student entry clearance visas issued from the previous year (down from 288,000 to 271,000). This compares to a decrease of 6% in those arriving (down from 295,000 to 277,000). However, for the year ending June 2011 provisional IPS estimate for non-EU nationals arriving to study for more than a year increased by 4% (up from 178,000 to 185,000) since the previous year.
Since the year ending December 2005 (176,000) the number of student visas gradually increased to the year ending June 2009 (204,000), followed by a higher rate of increase to a peak in the year ending June 2010 (288,000). Since then the number of visas issued to students has decreased overall.
Comparison of sources of data on student immigration
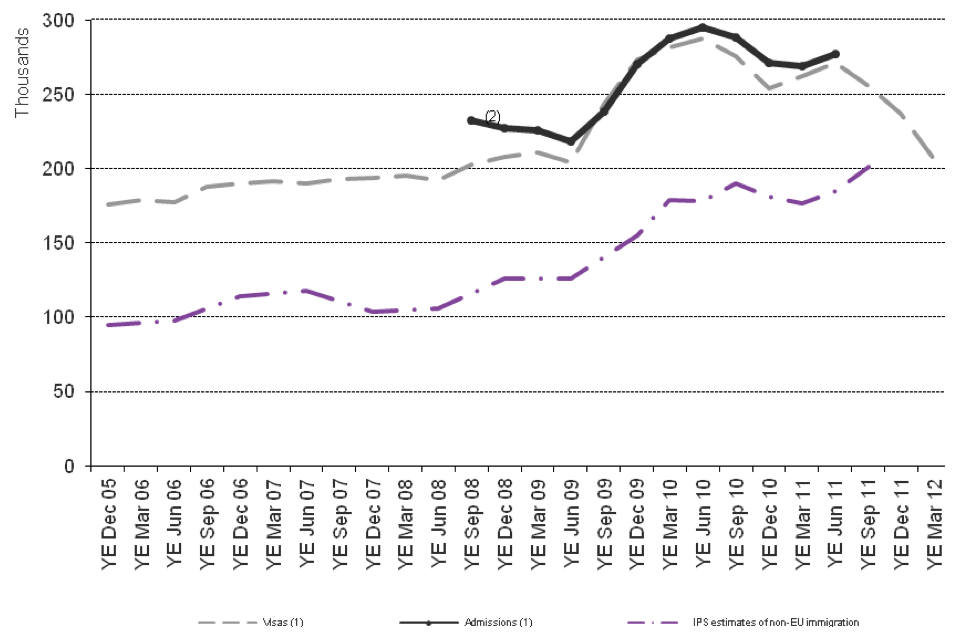
The chart shows the trends of visas issued, passenger arrivals and International Passenger Survey (IPS) estimates of immigration for study between year ending December 2005 and the latest data published. The data are sourced from Tables be.04.q and ad.02.
Chart notes
Source: Home Office, Immigration Statistics January – March 2012, Before Entry Table be.04.q and Admissions Table ad.02.q; Office for National Statistics.
(1) Excludes dependants and student visitors for greater consistency with non-EU immigration estimates based on the International Passenger Survey
(2) For periods prior to the year ending September 2008, the count of student arrivals is not comparable with student visas issued. This is because student arrival numbers include short-term students that can be excluded from the visa time series.
The above chart shows that IPS estimates, while being substantially lower, follow a broadly similar trend to student visas issued and passenger arrivals, with increases in all three series during 2009. One reason why IPS estimates of students arriving are lower than figures for student visas issued or passenger arrivals is that the IPS figures exclude the many students who intend to stay for less than a year.
Despite the general trend being similar, there are instances where the trends in visas issued, admissions and IPS estimates appear at odds with one another, for example, the chart above shows that the IPS estimates for the years ending September 2010, March 2011, June 2011 and September 2011 (the latest quarter covered by the IPS) all showed a different trend to the visas. This apparent discrepancy could be due to the potential for a margin of error that is inherent in surveys, together with possible changes in the proportion intending to stay for more than a year and the time difference between a visa being issued and the individual arriving.
The fall in visas issued for the purposes of study since the year ending June 2011 is consistent with significant changes to the student visas system from mid-2011 which were introduced following a major public consultation on reforming Tier 4 of the points-based system. The peak in the number of visas issued in the year ending June 2010 was mostly driven by more study visas issued between August 2009 and January 2010. In February 2010, the UK Border Agency temporarily suspended student visa applications from a number of countries which had shown a spike in applications. Following the suspension, numbers of visa applications and issues appear to have dropped.
3.3 Data tables
Data on student immigration, sourced from Home Office administrative systems, can be found in the following tables:
- Study (Table st.01)
- Before entry (Tables be.01 to be.04q and be.06.s)
- Admissions (Tables ad.02 to ad.03 and ad.03.s)
- Extensions (Tables ex.01 to ex.02.s)
3.4 Visas
Latest quarterly data show that in the year ending March 2012, the number of study entry clearance visas issued was 206,000, a decrease of 21 per cent on a year earlier (262,000).
The recent decline follows, a gradually increasing trend in student visas issued within rolling 12 month periods between the year ending December 2005 (176,000) and June 2009 (204,000), followed by a higher rate of increase to a peak in the year ending June 2010 (288,000). Since then the number of visas issued to students has decreased. The number of visas issued in the year ending March 2012 (206,000) is now at a similar level to that for the year ending June 2009 (204,000).
3.5 Admissions
Latest data show that the number of student admissions was 277,000 in the year ending June 2011, a decrease of 18,400 (6%) on the year ending June 2010.
When considering study (excluding student visitors), since the introduction of the student visitor category, admissions and entry visa numbers follow a similar trend as all those wishing to stay for six months or more require a visa.
3.6 Immigration for study
For the year ending September 2011, the provisional IPS estimate for non-EU nationals arriving to study for more than a year increased by 6% since the previous year (up from 190,000 to 201,000). The estimate for the year ending September 2011 is the highest in the series of year end figures published from the survey, but not a statistically significant difference from the estimate of 190,000 in the year to September 2010.
Source: ONS, Long-Term ONS, International Migration.
3.7 Extensions of stay
Latest data show that in the year ending March 2012, the number of extensions of stay granted to those for study was 88,000 a decrease of 27% on a year earlier (120,000). Number of grants of extension for the year ending March 2012 are lower than any comparable period in the current published series.
3.8 Dependants
For the year ending June 2011 (the latest available across all data sets), dependants of students accounted for: 33,000 entry clearance visas (a 2% rise on a year earlier); 25,000 passenger arrivals (a 9% rise on the year ending June 2010) and 19,000 extensions of stay (an 11% decrease on the year ending June 2010).
3.9 Student visitors
In the year ending March 2012, 65,000 people were issued student visitor visas. The number of visas issued to student visitors has increased steadily since 2005 (16,000) and is now at its highest level.
The latest data available on passenger arrivals show that in the year ending June 2011, 246,000 people (an 8% rise on the year ending June 2010) were admitted under student visitor rules. Student visitor visas are not required for non-visa nationals (e.g. United States); however, non-visa nationals will be included in the passenger arrivals data as a student visitor. This means that student visitor arrivals are considerably higher than student visitor visas issued (55,000 in the year ending June 2011).
Student visitors have a maximum six-month visa, except in a small number of cases following a recent change in the rules, and have to leave the country in order to apply for further stay. Therefore they are not counted as long-term migrants or in the extensions of stay data.
Between 2004 and 2008, the total number of people (including their dependants) admitted for study increased by 27% from 307,000 to 391,000. A significant proportion of this increase may be due to the rules surrounding the introduction of the student visitor category in September 2007, as some coming to study for a short period would have been counted as visitors. However, since 2008 the total number of people (including their dependants) admitted for study has continued to increase year on year to 547,000 in the year ending June 2011.
3.10 Nationalities arriving to study
Data for arrivals by nationality in 2011 are planned to be published in Immigration Statistics April – June 2012, due to be released in August 2012, when 2011 data are available.
Of the total number of students admitted in 2010, 63% (172,000) were from Asia, a change from 2008 when only 51% (114,000) were nationals of countries in Asia.
The increases in student admissions seen in late 2009 and early 2010 were mainly driven by Asian nationals. Between 2008 and 2009, there were large increases in numbers of students arriving from India, Bangladesh and Nepal, with a total increase of 46,000 (almost two and a half times) across the three countries. Following the temporary suspension of visa applications from northern India, Bangladesh and Nepal in 2010, student admissions fell from nationals of these countries, although levels in 2010 continued to be significantly above those seen in 2008. There were also increased student admissions from nationals of other Asian countries between 2008 and 2010, in particular China (up 15,000 or 54%), Sri Lanka (up 4,000 or 139%) and Pakistan (up 15,000 or 181%); the increases from China and Sri Lanka have been steady increases, while the increase from Pakistan was mainly seen between 2009 and 2010.
These proportions are significantly different to student visitor admissions, where 62% (149,000) of student visitor arrivals were from the Americas.
3.11 Staying in the UK
Research undertaken for the Migrant Journey Analysis showed that, of migrants granted student visas in 2004, one in five (21%) appears to have remained in the immigration system after five years. The analysis of UK Border Agency data suggests that these were split between those who remained as students (6%), and those granted further stay for work and family reasons (through marriage, for example). Only a small number of those issued with student visas in 2004 had been granted settlement.
Source: Home Office, Migrant Journey Analysis, Home Office Migration Research.
3.12 Other related data
The Before Entry and Admissions sections of the User Guide includes a discussion on the differences between the various data sources presented on immigration for study.
The Office for National Statistics publishes data on student immigration, ONS International Migration.
Statistics on students in Higher Education Institutions including analysis of overseas student numbers from published statistics released by The Higher Education Statistics Authority (HESA).
4. Family
Valid: 24 May to 30 August 2012
4.1 Interpreting the figures
There are a number of ways that allow people to come to the United Kingdom for family reasons. The traditional ‘family route’ is made up of those coming to join or accompany family members who are British Citizens or settled people. This includes married or unmarried partners, including same-sex partners; children; and elderly relatives. Others come as dependants of people who have not been granted the right to stay permanently, including the family members of those working or studying in the United Kingdom and of refugees. There are also those who come for a short time to visit family members.
The numbers coming for family reasons can be monitored using a number of different measures. For those who are subject to immigration control, administrative information is available on visas, admissions, extensions of stay and settlement. These differentiate between the ‘family route’ and dependants of other migrants. The IPS, run by the ONS, provides estimates of all those who state their main reason for migrating to the UK for 12 months or more is to accompany or join friends or family.
These various statistics can appear to give different pictures of family immigration. This is because they use different definitions of ‘family’ and count different aspects of the immigration process, with some showing intentions or permissions, while others show actual events.
The User Guide provides further details on this topic including definitions used, how figures are compiled, data quality and issues arising from figures being estimated from samples or based on data sourced from an administrative database.
Data are provided to the nearest thousand; the relevant tables provide unrounded data (except for admissions data and IPS estimates). All data for 2010 and 2011 are provisional, except for IPS estimates which have been finalised for 2010.
4.2 Key facts
Taking the last 6 years, the numbers of visas issued to those coming on the ‘family route’ and those who were dependants of other migrants reached a peak in the year ending March 2007 after which numbers decreased for both visa groups until the year ending September 2009. Following this, visas issued to those coming on the ‘family route’ rose to another lower peak in the year ending December 2010 but have now, for the year ending March 2012, fallen to the lowest level since figures have been published in this series (2005). Visas issued to dependants of migrants rose to reach a peak in the year ending June 2011 after which numbers have also decreased.
Figures for entry clearance visas are Official Statistics and have not been designated as National Statistics. For details about the quality of the data relating to these figures please see the User Guide.
Provisional IPS estimates of non-EU immigration for those wishing to accompany or join others for more than 12 months peaked in the year ending December 2006 at 74,000, fell to a low of 51,000 in the year ending June 2010 and have since increased to 57,000 in the year ending September 2011.
Since the year ending September 2009 the various sources of data on family migration have followed a broadly similar trend with immigration for family reasons on a downward trend following a rise to a peak around the year ending March 2011.
Comparison of sources of data on family immigration
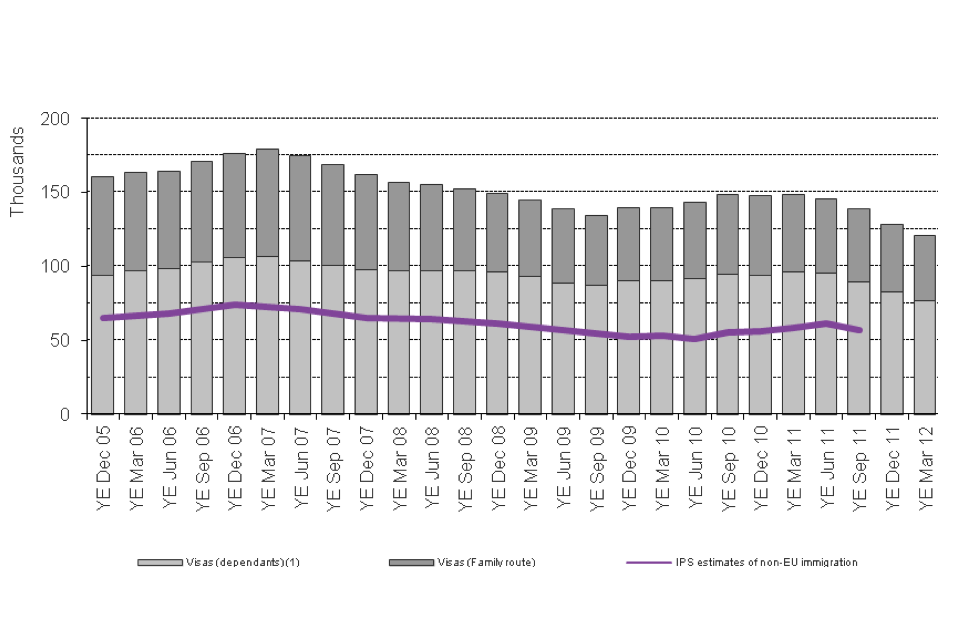
The chart shows the trends of visas issued and International Passenger Survey (IPS) estimates of immigration for family reasons between the year ending December 2005 and the latest data published. The visa data are sourced from Table be.04.q. Estimates fr
Chart notes
Source: Home Office, Immigration Statistics January – March 2012, Before Entry Table be.04.q; Office for National Statistics.
(1) Includes all dependants (e.g. dependants for work and study), except visitors.
The above chart shows that IPS estimates, while being substantially lower, follow a broadly similar trend to visas issued to those coming for family reasons. One reason why IPS estimates of those arriving are lower than figures for visas issued is that the IPS figures exclude the many people who intend to stay for less than a year. Further reasons are described in the User Guide.
4.3 Data tables
Data on family immigration, sourced from Home Office administrative systems, can be found in the following tables:
- Before entry (Tables be.01 to be.06.f)
- Admissions (Tables ad.02 to ad.03.f)
- Extensions (Tables ex.01 to ex.02.f)
- Settlement (Tables se.01 to se.06)
The Office for National Statistics publishes estimates of those coming to join or accompany others at ONS, International Migration.
4.4 Visas
Most recent data show that in year ending March 2012, the number of entry clearance visas issued to those on the ‘family route’ was 45,000, a decrease of 16% on a year earlier (53,000). In addition, there were 44,000 dependants of workers, 20,000 dependants of students and 13,000 other dependants.
Figures for entry clearance visas are Official Statistics and have not been designated as National Statistics. For details about the quality of the data relating to these figures please see the User Guide.
The number of passengers recorded as entering the country for family reasons are much lower than numbers of visas issued. Some of those that are identifiable as coming for family reasons in the visa data are not identifiable in the arrivals data and are included within ‘Others given leave to enter’.
4.5 Immigration for family reasons
Provisional IPS estimates of non-EU nationals accompanying or coming to join family or friends for a year or more were 57,000 in the year ending September 2011, having been in the range of 51,000 to 61,000 since the year ending December 2008.
Source: ONS, Long-Term ONS, International Migration.
4.6 Extensions of stay
Latest data show that in the year ending March 2012, the number of extensions of stay granted to those on the ‘family route’ was 17,000, a decrease of 15% on a year earlier (20,000), continuing the fall in the previous two years. In addition, there were 37,000 dependants of workers, 13,000 dependants of students and 7,000 other dependants.
4.7 Settlement
Family formation and reunion grants of settlement fell by 19% from 60,000 in the year ending March 2011 to 49,000 in the year ending March 2012, a return to similar levels seen in 2007 (51,000).
4.8 Staying in the UK
Research undertaken for the ‘Migrant Journey Analysis’ showed that, of 63,400 migrants who were granted visas for family reasons (generally on the family route) in 2004, 63% appear to have remained in the immigration system after five years. The analysis of UK Border Agency data suggests that most of those still active in the immigration system had been granted settlement (55% of the total) and a further 6% continued to hold a family visa. The remaining 2% held other types of visa.
Source: Migrant Journey Analysis, Home Office Migration Research.
4.9 Other related data
Information on numbers of non-EEA family members of EEA nationals who exercise rights to stay in the country is available in the ‘European Economic Area’ briefing.
The Before Entry, Admissions and Settlement sections of the User Guide to Home Office Immigration Statistics includes a discussion on the differences between the various data sources presented on immigration for family reasons.
5. Before Entry
Valid: 24 May to 30 August 2012
5.1 Interpreting the figures
The data in this topic briefing cover: applications, issues and refusals of entry clearance visas; and non-asylum passengers initially refused entry at ports. Before travelling to the United Kingdom, a person may be required to apply for and be issued with an entry clearance visa, depending on their nationality, purpose of visit and intended length of stay. On arrival at UK ports or a juxtaposed control in France or Belgium, before being admitted to the country, all individuals have to satisfy a UK Border Agency officer that they have the right to enter the country.
The user guide provides further details on this topic including definitions used, how figures are compiled, data quality and issues arising from figures being based on data sourced from an administrative database.
The data in this briefing include dependants, unless stated otherwise. Visa data are generally rounded to the nearest 1,000; the accompanying tables provide unrounded data. Data prior to 2005 are not comparable.
Figures for entry clearance visas are Official Statistics and have not been designated as National Statistics. For details about the quality of the data relating to these figures please see the User Guide.
5.2 Key facts
Excluding visitor and transit visas, the number of visas issued fell to 529,000 in the year ending March 2012, the lowest 12 monthly total recorded using comparable data available from 2005. This was 13% lower than the year ending March 2011 (609,000). This included falls in the study (-21%, excluding dependants and student visitors), work (-8%) and family (-16%) categories, with the latter 2 categories all at their lowest levels recorded using comparable data. Recent falls for work and study are likely to be partly due to changes to the entry clearance system for these routes which came into effect from 2011.
The number of visas issued, excluding visitor and transit visas rose from 586,000 in 2005 to 624,000 in 2006, and remained between 600,000 and 597,000 during 2007 to 2010 and then fell 6% to 564,000 in 2011.
By contrast, there was a 9% increase in visitor visas issued to 1.7 million in the year ending March 2012 (compared with the previous 12 months) and the highest 12 monthly total recorded, using comparable data. After increasing from 1.4 million in 2005 to 1.6 million in 2006, the numbers fell back to 1.3 million in 2008 and 1.4 million in 2009 and have risen steadily since.
There were 10% fewer non-asylum passengers initially refused entry at ports in the year ending March 2012 (16,382), compared with the previous 12 months (18,120), continuing the calendar year on year falls from 38,391 in 2004.
Entry clearance visas issued (excluding visitor and transit visas)
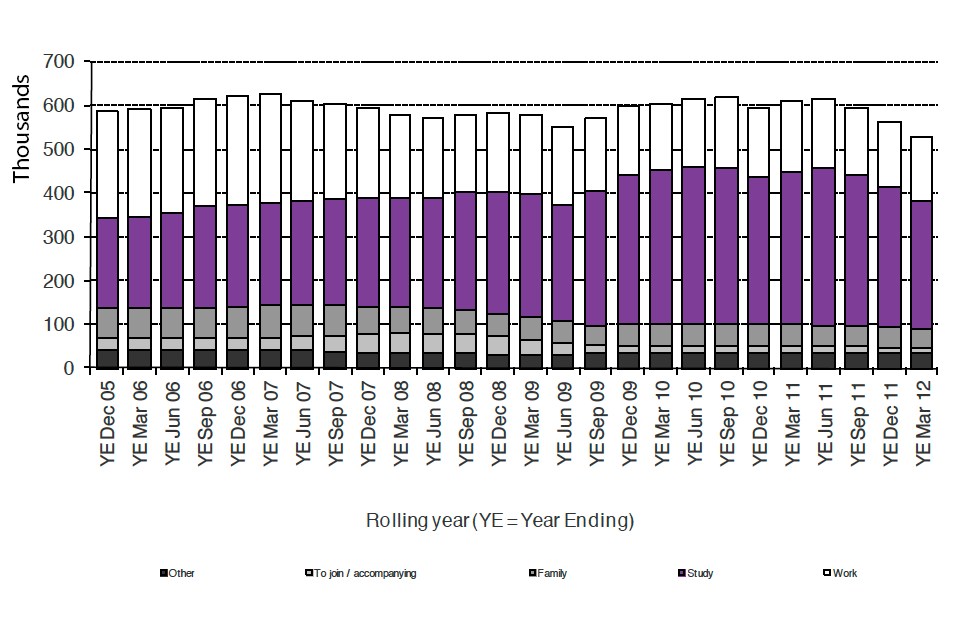
The chart shows the number of entry clearance visas issued, excluding visitor and transit visas, between 2005 and the latest rolling year available. The data are available in Table be.04.q.
Chart notes
Source: Home Office, immigration statistics, January to March 2012, based on data in Before Entry Table be.04.q.
Detailed briefing on the trends of visas issued for work, study or family reasons (together with dependants joining / accompanying) are available in the ‘Work’ briefing, ‘Study’ briefing and ‘Family’ briefing.
5.3 Data tables
Further data on before entry are available in Before Entry Tables be.01 to be.07.
5.4 Visa applications
Total visa applications declined from a peak of 2.7 million in 2006 to a low of 2.4 million in 2008. Since then, visa applications have increased again to 2.6 million in the year ending December 2011.
However, when excluding visitor and transit visas, the number of visa applications peaked in 2008 (788,000) and have since declined to 652,000 in 2011, the lowest number recorded since comparable data have been available (data prior to 2005 are not comparable).
5.5 Non-asylum passengers initially refused entry
Since 2004, when data were first available, numbers of non-asylum passengers initially refused entry at ports have fallen year on year. In 2011, 17,173 were initially refused entry, 9% fewer than in 2010 (18,941) and 55% fewer than in 2004 (38,391).
The quarterly data shows a similar trend. Of the 3,473 passengers initially refused entry during first quarter of 2012, 823 (24%) were refused at juxtaposed controls. This is the lowest quarterly figure since publication of data began in the first quarter of 2004.
5.6 Other related data
Information on non-asylum passengers refused entry and subsequently removed are available in the ‘Removals and voluntary departures’ briefing.
The Before Entry section of the user guide includes a discussion on the differences between entry clearance visas and other data sources including: passenger arrivals; long-term international migration estimates of immigration published by Office for National Statistics and differences between appeals on visa decisions published by the Home Office and the HM Courts and Tribunals Service.
Data on migration applications decided within published standards and the cost per decision for all permanent and temporary migration applications are published as official statistics by the UKBA as part of their key input and impact indicators, UK Border Agency, Our Performance.
6. Admissions
Valid: 24 May to 30 August 2012
6.1 Interpreting the figures
The figures show the number of journeys made by people entering the United Kingdom. Where an individual enters the country more than once, each arrival is counted. For arriving passengers subject to immigration control, who have previously obtained leave to enter, the journey is recorded as ‘returning after a temporary absence abroad’. Due to the volume of passengers arriving at Heathrow and Gatwick some data are estimated from monthly samples.
Some major components of the total (visitors, passengers returning and passengers in transit) reflect, to a large extent, trends in international tourism. The number of other admissions (for example, for work, study or family reasons) are likely to reflect trends in international migration and related policy and legislative changes affecting those subject to immigration control, for example changes in immigration legislation, enlargement of the European Union, and the introduction of the points-based system for work and study in 2008 and 2009 respectively.
All people admitted are subject to immigration control except British, other European Economic Area (EEA) and Swiss nationals.
Total passenger arrival data are available up to March 2012 (table ad.01); data on the purpose of journey (e.g. visit, work, study) are available up to the year ending June 2011 (table ad. 02q); and data for individual nationalities are available for the calendar year 2010 (table ad.03). Detailed data on passenger arrivals in 2011 will be available in future publications when further data and analyses are available; for example, the number of other EEA and Swiss nationals are planned to be published in Immigration Statistics April - June 2012, due to be released in August 2012. Most data in this briefing are rounded to three significant figures. All data include dependants.
The User Guide to Home Office Immigration Statistics provides further details on this topic including definitions used, how figures are compiled, data quality and issues arising from figures being estimated from samples.
6.2 Key facts
The total number of admissions rose 4% to 106.2 million in the year ending March 2012 compared with the previous 12 months (102.2 million), comprising 3.5 million more journeys (%2B4%) by British, other EEA and Swiss nationals, and 0.5 million more journeys (%2B4%) by non-EEA nationals who are subject to immigration control. The increase is likely, in part, to reflect lower passenger arrivals during April 2010 because of airport closures due to a volcanic ash cloud.
The rise in total admissions in 2011 follows little change in 2010 compared with 2009, after falls from the 109.5 million peak in 2007. The total in 2011 was 3.6 million lower (-3%) than the peak of 109.5 million in 2007, when there had been 3.4 million more journeys by British, other EEA and Swiss nationals and 0.2 million more journeys by nationals subject to immigration control.
There were 13.2 million admissions of nationals subject to immigration control in 2011, or 12% of total admissions. The number of admissions of such nationals was higher than in 2010 (12.5 million).
In the year ending June 2011, there were 13.1 million admissions of nationals subject to immigration control, of which: 7.6 million were visitors; 3.3 million were people returning after a temporary absence abroad; and 1.1 million were people in-transit.
Total admissions
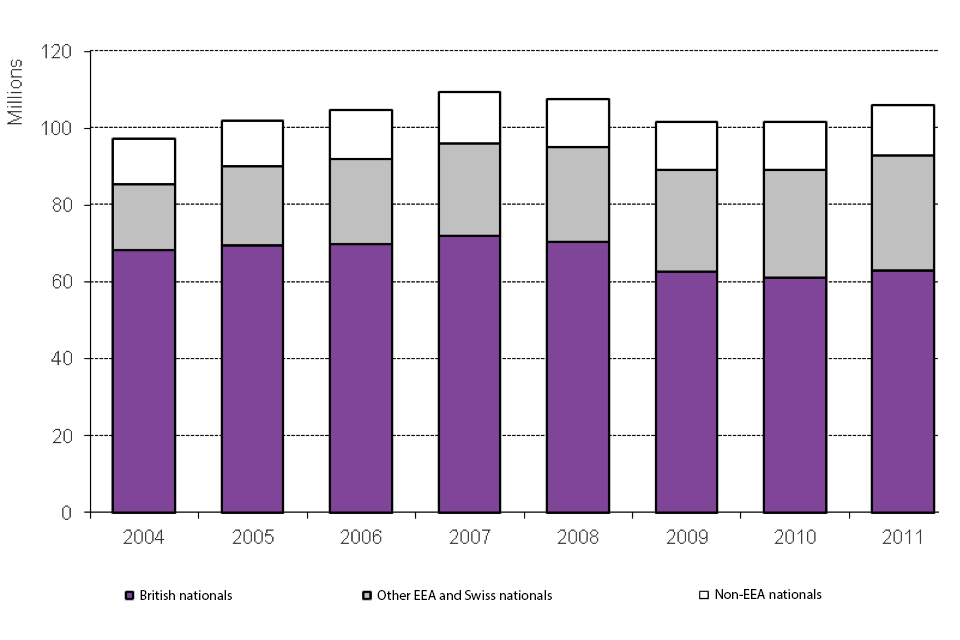
The chart shows the total number of journeys made into the United Kingdom by broad nationality between 2004 and the latest calendar year available. The data are available in Table ad.01.
Chart notes
Source: Home Office, immigration statistics January – March 2012, Admissions Tables ad.01.
Detailed briefing on the trends of admissions for work and study reasons are available in the ‘Work’ briefing and the ‘Study’ briefing.
6.3 Data tables
Further data on admissions are available in Admissions Tables ad.01 to ad.03.
6.4 Admissions by purpose of journey – nationals subject to immigration control
The points-based system was introduced for work and study during 2008 and 2009 respectively, while the student visitor category was introduced during 2007.
Admissions of visitors, both ordinary and business, in the year ending June 2011 (7.6 million) increased by 11% compared to the year ending June 2010 (6.9 million).
Admissions for work in the year ending June 2011 (161,000) were slightly higher than the year ending June 2010 (159,000), and lower than previous years (13% lower than in the year ending June 2008, 186,000; and 31% lower than the calendar year 2004, 233,000). The lower figures over the last 2 years are likely to be partly due to the tightening of controls on the inward migration of workers, as well as the global recession.
Admissions for study in the year ending June 2011 (547,000) were similar to the year ending June 2010 (545,000). Of those 547,000 journeys, 45% (246,000) were made by student visitors, who have a limited period of stay (generally 6 months) and cannot apply to extend that stay. This was 8% higher than the year ending June 2010 (227,000). Excluding student visitors, a total of 302,000 people and their dependants entered to study, 5% fewer than in the year ending June 2010 (318,000).
Admissions for family reasons in the year ending June 2011 (36,100) increased slightly (2%) compared with the year ending June 2010 (35,400).
6.5 Admissions by nationalities – nationals subject to immigration control
29% of the journeys by those subject to immigration control were made by US nationals (3.6 million), the majority of whom (54%) were visitors. Australian nationals (1.1 million) were the next highest group followed by nationals of India (0.9 million), Canada (0.9 million) and Japan (0.5 million).
6.6 Other related data
Further briefing on those arriving who are not subject to immigration control is available in the European Economic Area briefing.
The Admissions section of the User Guide to Home Office Immigration Statistics includes a discussion on the differences between passenger arrivals and long-term international migration estimates of immigration published by Office for National Statistics. A comparison between passenger arrivals and entry clearance visas is provided in the Before Entry section.
Further information on visitors to the United Kingdom is published by Office for National Statistics in ‘Overseas Travel and Tourism - February 2012’.
Historical data on travel trends from 1961/2 to 2010 was published in ONS’s bulletin ‘Travel trends 2010’.
Data on the clearance of passengers at the border within published standards and the cost of passengers cleared at the border are published as official statistics by the UK Border Agency as part of their key input and impact indicators. UK Border Agency, Our Performance.
7. Asylum
Valid: 24 May to 30 August 2012
7.1 Interpreting the figures
When someone applies for asylum, they are applying for protection from persecution or fear of persecution in their own country. The UK Border Agency then decides whether the application is legitimate. One person (the main applicant) can apply for asylum on behalf of themselves and others (dependants).
The User Guide to Home Office Immigration Statistics provides further details on this topic including definitions used, how figures are compiled, data quality and issues arising from figures being based on data sourced from an administrative database.
This briefing excludes numbers of dependants, unless stated otherwise. All data for 2010, 2011 and 2012 are provisional.
7.2 Key facts
The numbers of asylum applications have been relatively stable since 2005, having fallen substantially from a peak in 2002. These falls coincide with: the introduction in 2002 of a process preventing certain nationalities from appealing a decision while in the country; the opening of juxtaposed controls in France and Belgium in 2002 and 2004; and the introduction of fast-track facilities in 2003. In particular, all quarters from the 4th quarter of 2009 to the first quarter of 2012 saw fewer than 5,000 asylum applications, except the 4th quarter of 2011 (5,261).
The first quarter of 2012 had 4,818 asylum applications, 1% lower than the first quarter of 2011 (4,844). Overall asylum applications were up 11% in 2011 (19,804) compared to 2010 (17,916), with each quarter in 2011 being higher than the one 12 months earlier, although the annual number of applications remains low relative to the 2002 peak and with only 2010 having a lower annual figure.
Of the 17,496 initial decisions in 2011, 25% were grants of asylum, 8% grants of a form of temporary protection (humanitarian protection or discretionary leave) and 68% were refusals.
Initial decisions in the first quarter of 2012 numbered 4,496, 8% fewer than in the first quarter of 2011 (4,894). Of the 4,496, 65% were refusals.
Asylum applications
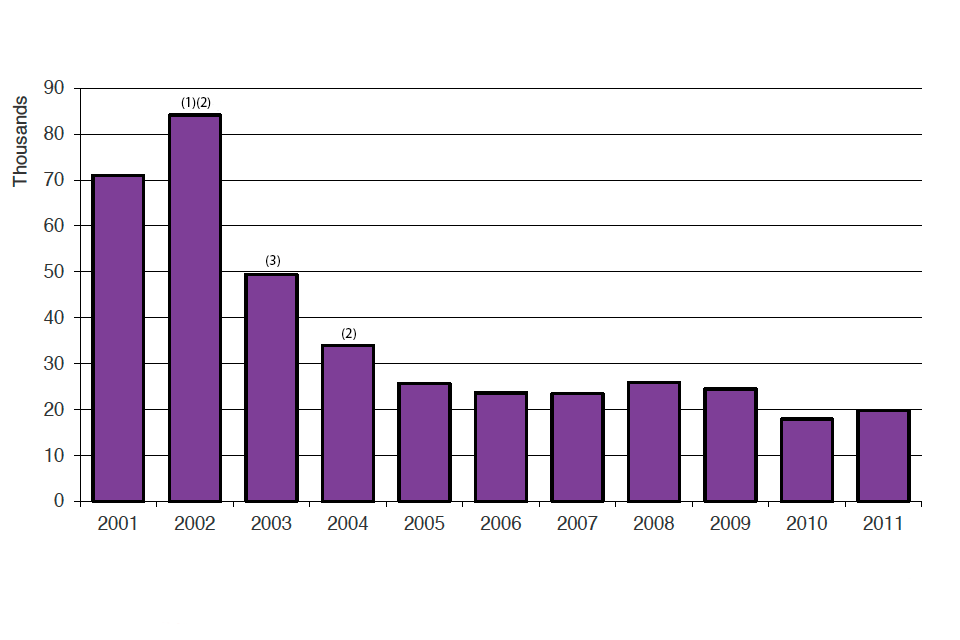
The chart shows the number of asylum applications made between 2001 and the latest calendar year. The data are available in Table as.01.
Source: Home Office, immigration statistics January – March 2012, Asylum Table as.01.
(1) A process preventing certain nationalities from appealing a decision while in the country (non-suspensive appeals process) was introduced in 2002.
(2) Juxtaposed controls were opened in France and Belgium in 2002 and 2004.
(3) Fast-track facilities for asylum applications were introduced in 2003.
7.3 Data tables
Asylum vol. 1: Applications and initial decisions (Tables as.01 to as.1.q)
Asylum vol. 2: Applications and initial decisions (Tables as.2 to as.4.q)
Asylum vol. 3: Initial decisions and Unaccompanied asylum seeking children (Tables as.05 to as.9.q)
Asylum vol. 4: Age disputed cases; detained fast track; non-suspensive appeals process; appeals and support (Tables as.10 to as.15)
Asylum vol. 5: Support and resettlement scheme (Tables as.16.q to as.19)
7.4 Applications
World events have an effect on which nationals are applying for asylum at any particular time. In 2010 and 2011, nationals of Iran made the most asylum applications, accounting for 2,485 applications or 13% of the 19,804 total in 2011, closely followed by Pakistan with 12% of applications in 2011. In 2009, it was nationals of Zimbabwe who made the most applications (23%). Recent political unrest in Libya appears to have led to a substantial increase in asylum applications from Libyan nationals in 2011 (721 applications compared to 90 in 2010), although numbers of applications fell during the first quarter of 2012 to just 57 compared to 102 in the first quarter of 2011.
Most applications are made by those already in the country (88% of applications in 2011) rather than people arriving at a port.
Of applicants in 2010, over half of applicants (55%) were in the 21-to-34 age bracket and 70% were male.
7.5 Initial decisions
Of the 17,496 initial decisions in 2011, 25% were grants of asylum, 8% grants of a form of temporary protection (humanitarian protection or discretionary leave) and 68% were refusals.
The proportion of applicants granted asylum or a form of temporary protection at initial decision has remained in the range of 22% to 35% since the first quarter of 2007, except for the first quarter of 2009, when it was 41%.
The higher grant rate of 41% in the first quarter of 2009 followed a judicial review where it was ruled that any national of Zimbabwe who could not demonstrate loyalty to the Mugabe regime could not be lawfully removed to that country and almost 2-fifths of grants at initial decision were to Zimbabweans.
That the 4th quarter of 2011 and the first quarter of 2012 are at the higher end of the 22% to 35% range can be linked to a large number of asylum grants to nationals of Iran. In the first quarter of 2011, 39% of initial decisions to Iranian nationals were grants. This compares to the first quarter of 2012, when nationals of Iran accounted for 14% of the 4,496 initial decisions and almost half of those initial decisions were a grant of asylum or some form of protection. This change may be due to a reported increase in human rights abuses.
Looking longer term, of the thirteen nationalities that had more than 10,000 initial decisions made in total between 2001 and 2011, Afghan nationals had the highest proportion of decisions granted asylum or a form of temporary protection (51%), while Indian nationals had the lowest (2%).
7.6 Appeals
In the first quarter of 2012, the Tribunals Service Asylum and Immigration received 2,267 asylum appeals from main applicants, 21% lower than the first quarter of 2011 (2,878). During the same period, the number of applicants who had asylum appeals determined decreased by 27% to 2,207. Nationals of Pakistan had the most appeals received (400) and determined (371), while nationals of Sri Lanka had the most appeals allowed (112).
In 2011, a total of 9,980 main applicants requested an asylum appeal, a 28% decrease compared to 2010 (13,928). This fall coincides with a similar sized fall in the number of refusals at initial decisions between 2010 and 2011, although this may be one of many factors. Immigration Judges determined 10,521 asylum appeals, down 29% compared to 2010. Data from UK Border Agency sources are currently only available back to 2007, but data published by the HM Courts and Tribunals Service suggest that 2010 saw the most cases determined since 2005.
The proportion of appeals dismissed in 2011 was 67%, while 26% of appeals were allowed. The remainder of appeal determinations were withdrawals.
7.7 Case outcomes
Updated information on asylum case outcomes, including those relating to applications in 2011, are planned to be published in immigration statistics April – June 2012 due to be released in August 2012.
Following through the 17,916 main applicants who applied for asylum in 2010, as at May 2011 when the statistics were compiled, 6,273 (35%) had been granted asylum, humanitarian protection or discretionary leave at either initial decision or appeal. 10,423 cases had been refused; and a further 1,220 were awaiting confirmation of an initial decision. The proportion of applications granted asylum or a form of temporary protection at initial decision or appeal in 2004 was 26%, and had gradually increased year-on-year to 38% in 2009.
Outcome of asylum applications, by year of application
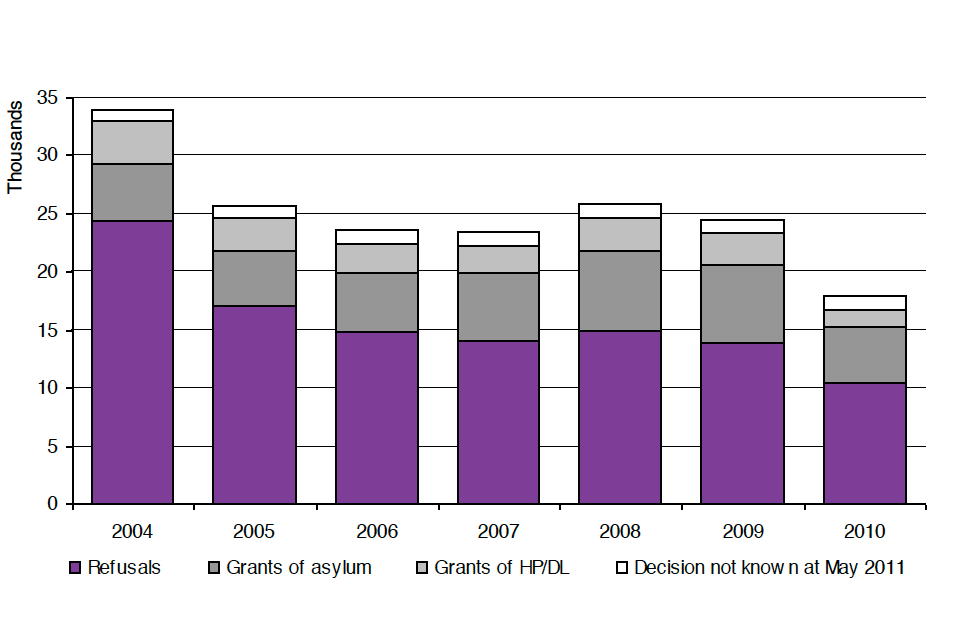
The chart shows the outcome of asylum applications made between 2004 and the latest calendar year as at May 2011. The data are available in Table as.06.
Chart notes
Source: Home Office, immigration statistics January - March 2012, Asylum Table as.06.
The increase in applications and grants of asylum in 2008 and 2009 compared to earlier years is related to the large number of nationals of Zimbabwe applying for asylum in late 2008 and early 2009. Of the 5,599 main asylum applicants from Zimbabwe in 2009, 3,095 (55%) have been granted asylum, humanitarian protection or discretionary leave at either initial decision or appeal and 2,366 cases were refused.
7.8 Cases pending a decision
At the end of March 2012, 11,454 applications, received since April 2006 from main applicants, were pending a decision (initial decision, appeal or further review), 2% more than at the end of March 2011. Nationals of Pakistan, who accounted for the largest number of asylum applications in the first quarter of 2012, had the most cases pending a decision and in particular, cases pending further review, while nationals of Iran, who accounted for the largest number of grants of asylum or a form of protection in the first quarter of 2012 had the most cases pending initial decision.
7.9 Asylum support
As asylum seekers are not normally allowed to work for the first year while their application is being considered, support (known as Section 95 support) is available. There were 11,600 support applications in 2010, having fallen from a peak of 68,624 in 2002. Data for support applications in 2011 are planned to be published in the immigration statistics April – June 2012 release in August 2012.
At the end of March 2012, 20,993 asylum seekers, including dependants, were receiving Section 95 support, down from 21,223 a year ago. Of these, 2,761 were receiving subsistence-only support and 18,232 were supported in dispersed accommodation. The largest nationality group currently supported are nationals of Pakistan (19% of the total). The numbers receiving support has fallen from 80,123 at the end of 2003.
The overall falls in support applications and numbers receiving support are in line with falling numbers of asylum applications and the clearance of a backlog of asylum claims from the early part of the decade.
Failed asylum seekers who are not eligible for support under Section 95, but are homeless and have reasons that temporarily prevent them from leaving, may be eligible for support (called Section 4). In 2011, there were 3,788 decisions to grant Section 4 support and at the end of March 2012, there were 2,232 failed asylum seekers, excluding dependants, recorded as receiving this support.
7.10 Dependants
In 2011, the 19,804 asylum applications received accounted for 25,455 individuals when dependants were included; an average of 2 dependants for every 7 main applicants. Comparing the ten nationalities with the highest number of main applicants in 2011, the ratios of dependants to main applicants ranges from 1 dependant for every 31 main applicants for nationals of Eritrea to 2 dependants for every 3 main applicants from Libya.
In 2011, initial decisions were made relating to 5,244 dependants. Of these: 1,152 (22%) were granted asylum; 341 (7%) were granted a form of temporary protection; and 3,751 (72%) were refused. The proportion being refused asylum is slightly higher than main applicants in 2011, although lower than the proportion for dependants in 2010.
7.11 Unaccompanied asylum-seeking children
In 2011, 6% (1,277) of main applicants were Unaccompanied Asylum-Seeking Children (UASCs). Almost a third (30%) of UASC applications were made by male nationals of Afghanistan; and overall 82% (1,049) of applications were from male applicants. UASC annual applications continue to fall and fell by 26% between 2010 (1,717 applications) and 2011. This decreasing trend has been influenced by falling applications from nationals of Afghanistan.
In 2011, a total of 1,356 initial decisions were made on UASC applications, a decrease of 43% compared to 2010 (2,359). Despite UASCs only accounting for 8% of all initial decisions, 47% (593) of all grants of Discretionary Leave at initial decision were to UASCs aged 17 or under at the time of the decision. 39% of these were to nationals of Afghanistan.
7.12 Other related data
The UK Border Agency disputes the age of some asylum applicants. In 2011, 354 individuals had their age disputed, a decrease of 28% compared to 2010 (489) and 69% compared to 2009 (1,129). Of the 354 individuals, 30% (106) were nationals of Afghanistan.
In addition to those asylum seekers who apply in the United Kingdom, a resettlement scheme is also offered to those who have been referred to the UK Border Agency by UNHCR (the UN agency for refugees). In 2011, a total of 454 refugees were resettled in the United Kingdom through this process. This is lower than in recent years due to the scheduling of arrivals within an operating year of April to March, rather than calendar year.
Figures for refugees resettled are Official Statistics and have not been designated as National Statistics. For details about the quality of the data relating to these figures please see the User Guide to Home Office Immigration Statistics.
In 2011, there were 930 fresh claims from those who had previously applied for asylum, a decrease of 43% compared to 2010 (1,621), but similar to levels in 2009 (905).
Including dependants, the estimated total number of asylum applications to the 27 European Union countries was 281,100 in 2011. The total number of asylum applications across the EU increased from 2010 and was the highest since 2004. When the relative size of resident populations of the 27 EU countries is taken into account, the United Kingdom ranked 14th in terms of asylum seekers per head of population in 2011, down from 13th in 2010. In terms of total asylum applications, having had the most applications in the first quarter of 2009, the United Kingdom’s ranking had dropped to 5th by the first quarter of 2012. France received the most asylum applications in 2011. Estimates, based on data that EU countries have provided to international organisations, suggest that a number of EU countries, including Italy and Belgium, have seen a larger increase in asylum applications between 2010 and 2011 than the United Kingdom.
Numbers of asylum applicants removed are available in the ‘Removals and voluntary departures’ briefing.
The Asylum section of the user guide includes a discussion on the differences between the definition of asylum applications used in this release compared to Eurostat (the European statistical organisation), as well as the definition of asylum appeals used in this release compared to asylum appeals published by the HM Courts and Tribunals Service.
Data on asylum performance framework measures and the size of the controlled archive are published as official statistics by the UK Border Agency as part of their performance data, UK Border Agency, Our Performance.
8. Extensions
Valid: 24 May to 30 August 2012
8.1 Interpreting the figures
The figures relate to the number of people, subject to immigration control, who are granted or refused permission to extend or change the category of their stay in the United Kingdom. Within the Immigration Rules, an individual may make more than one application in any given year.
The numbers of applications and decisions made reflect changes over time in levels of immigration, as well as policy and legislative changes, including changes to immigration legislation. The availability and allocation of resources within the UK Border Agency can also affect the number of decisions.
The User Guide to Home Office Immigration Statistics gives further details on this topic including definitions used, how figures are compiled, data quality and issues arising from figures being based on data sourced from an administrative database.
The data in this briefing include dependants, except where stated otherwise, and take account of the outcomes of reconsiderations and appeals. All data in this briefing have been rounded to the nearest 100; the accompanying tables provide unrounded data. All figures for 2010, 2011 and 2012 are provisional.
8.2 Key facts
The total number of grants of an extension of stay has fallen in each of the last 3 years from 362,900 in 2008 to 300,100 in 2011. The latest figures show that the total number of grants has continued to fall (to 276,600 for the year ending March 2012, down from 308,100 for the previous 12 months).
The 10% fall in grants for the year ending March 2012 was largely due to a 28% fall for study-related grants (-39,500) being associated with a tightening of the rules. There was also a slight increase (4% or 4,900 to 129,600) in work-related grants largely resulting from a 13% increase for highly skilled workers (up from 74,100 to 84,000), although total work-related grants remained much lower than the previous 2 years (188,500 in 2008 and 163,400 in 2009).
Grants of extensions by category and refusals
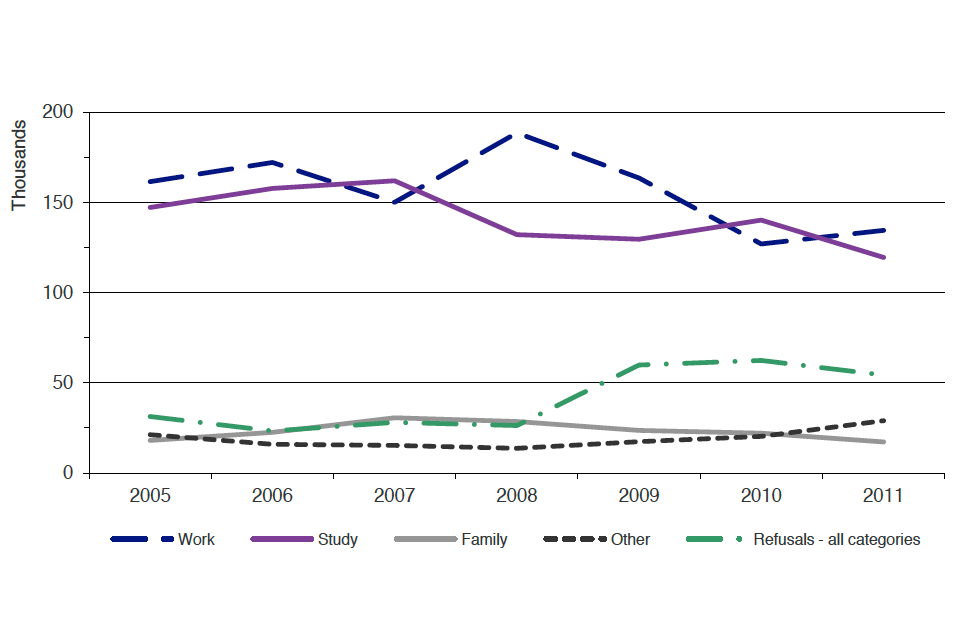
The chart shows grants of extension of stay by category and refusals between 2005 and the latest calendar year. The chart is based on data in Tables ex.01 and ex.02.
Chart notes
Source: Home Office, immigration statistics January – March 2012, Extensions Tables ex.01 and ex.02.
8.3 Data tables
Further data on extensions are available in Extensions Tables ex.01 to ex.02.
8.4 Grants of extensions, by category
There were 129,600 work-related grants in the year ending March 2012, 4% higher than the previous 12 months (124,800), but still much lower than in the previous 2 years (158,300 and 196,000 in the years ending March 2010 and March 2009 respectively). The increase in the work category is largely due to a 13% increase in grants to highly skilled workers (Tier 1 and equivalent) from 74,100 to 84,000.
There were 100,900 study-related grants in the year ending March 2012, 28% lower than in the previous 12 months (140,400), after increasing from 130,300 in the year ending March 2010. This fall is associated with a tightening of the rules in 2011, including a limit in the length of stay being introduced for most international students.
There were 17,200 family-related grants in the year ending March 2012, compared with 20,400 in the previous 12 months and continuing the fall from the previous 2 years (23,200 and 26,200 in the years ending March 2010, and March 2009 respectively).
Other grants of an extension of stay rose 28% to 28,900 in the year ending March 2012, compared with the previous 12 months (22,600), continuing the increases from the previous 2 years (18,800 and 13,700 in the years ending March 2010 and March 2009 respectively). These increases are mainly attributable to discretionary leave grants under Human Rights articles.
8.5 Refusals
There were 45,700 refusals in the year ending March 2012, a fall of 30% compared with the previous 12 months (65,100), partly reflecting fewer overall decisions. The refusal rate has remained relatively high in the last 3 years (14%, 17% and 16% in the years ending March 2012, March 2011 and March 2010 respectively) compared with 8% in the year ending March 2009.
The refusal rate in the year ending March 2012 by category was 6% for work, 16% for study, and 14% for family (compared with 9%, 14% and 13% in the year ending March 2011).
8.6 Nationalities granted an extension (excludes dependants)
Data for grants by nationality in 2011 are planned to be published in immigration statistics April – June 2012, due to be released in August 2012, as part of additional analysis of data for 2011.
Of the total 244,300 grants of an extension of stay in 2010, 64% (156,000) were to Asian nationals and 16% (39,600) were to African nationals.
The 10 countries whose nationals accounted for the largest number of extensions of stay granted in 2010 were India (45,300); China (40,900); Pakistan (22,000); Nigeria (16,200); Bangladesh (9,000); the Philippines (8,000); United States (6,400); Turkey (6,300); Sri Lanka (6,300) and Thailand (4,900). These nationalities accounted for 68% of the total grants of an extension of stay.
8.7 Other related data
Data on migration applications decided within published standards, the cost per decision for all permanent and temporary migration applications and the size of the controlled archive are published as official statistics by the UK Border Agency as part of their performance data, UK Border Agency, Our Performance.
9. Settlement
Valid: 24 May to 30 August 2012
9.1 Interpreting the figures
The figures show the number of people, subject to immigration control, that are granted or refused permission to stay indefinitely.
The numbers of applications and decisions made reflect changes over time in levels of those entering the country, as well as policy and legislative changes, which, for example, may affect the number of people potentially eligible for settlement. The availability and allocation of resources within the UK Border Agency can also affect the numbers of decisions.
The User Guide to Home Office Immigration Statistics provides further details on this topic including definitions used, how figures are compiled, data quality and issues arising from figures being based on data sourced from an administrative database.
All the figures given below include spouses and dependants, unless stated otherwise. All data for 2010, 2011 and 2012 are provisional.
9.2 Key facts
There were 148,144 people granted settlement in the year ending March 2012. This was a fall of around a third (35%) or 77,715 lower than the previous 12 months, suggesting that the peak in 2010 has passed.
Most of the fall was due to 68,144 fewer grants on a discretionary or other basis (from 83,964 to 15,820, an 81% fall), which in recent years were mainly granted following a review of asylum applications made before March 2007. The large fall is associated with the completion of the review of these cases.
There was also further falls in work-related grants (to 70,916, down from 75,144 and 90,569 in the years ending March 2011 and 2010 respectively) and in family-related grants (to 48,676, down from 59,927 and 75,852 respectively); whilst asylum-related grants nearly doubled to 12,732 in the year ending March 2012 compared with 7,443 in the previous year, this largely reflecting rule changes in August 2005 when immediate settlement for people granted refugee status was replaced with five years’ limited leave.
Grants of settlement (by category from 1997)
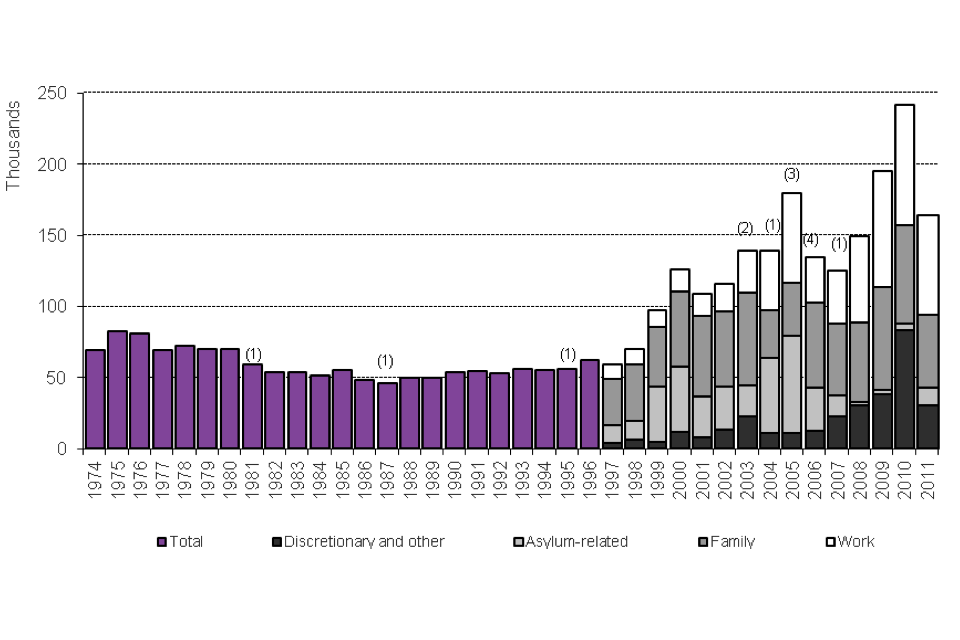
The chart shows the number of people granted settlement, 1974 to the latest calendar year, with breakdown by broad category from 1997. The data are available in Tables se.02 and se.06.
Chart notes
Source: Home Office, Immigration Statistics January – March 2012, Settlement Tables se.02 and se.06.
(1) Nationals of EU accession countries are excluded following the accession date of the country e.g. Bulgarian and Romanian nationals are excluded from 2007 onwards.
(2) Family formation and reunion grants were affected by a change in the qualifying period for settlement in April 2003.
(3) Asylum-related grants were affected by a change in the rules in August 2005, when immediate settlement for people granted refugee status was replaced with five years’ limited leave.
(4) In 2006, the qualifying period for settlement in all work-related categories changed from 4 to 5 years which reduced the number of grants during 2006 and 2007.
9.3 Data tables
Further data on settlement are available in Settlement Tables se.01 to se.06.
9.4 Decisions
The number of decisions on applications for settlement fell by around a third (35%) to 155,349 in the year ending March 2012 compared with 237,837 in the previous 12 months. Of these 155,349 decisions 95% (148,144) were grants and 5% were refusals (7,205).
9.5 Grants by category
The proportion of grants on a discretionary basis fell to 11% in the year ending March 2012 compared with 37% in the previous 12 months; correspondingly there were increases in the share accounted for by work-related grants (from 33% to 48%) and in the share due to family formation and reunion (from 26% to 33%).
‘Discretionary and other’ grants fell by 81% from 83,964 in the year ending March 2011 to 15,820 in the year ending March 2012, a return to similar levels seen in 2007. The peak in 2010 (82,686) was mainly attributable to people being granted indefinite leave outside the Immigration Rules following a review of asylum applications made before March 2007 (known as ‘legacy cases’). The large fall is associated with the completion of the review of these cases.
Work-related grants of settlement fell by 6% to 70,916 in the year ending March 2012 compared with 75,144 in the previous 12 months and 90,569 in the year ending March 2010. The falls in the last two years follow a broadly rising trend in previous years corresponding to earlier increases in the number of people admitted in work categories. (The dip in the number of work-related grants in 2006 and 2007 reflected a change in the qualifying period for settlement from 4 to 5 years, delaying grants that would otherwise have occurred earlier).
Family formation and reunion grants of settlement fell by 19% to 48,676 in the year ending March 2012, from 59,927 in the previous 12 months and 75,852 in the year ending March 2010. (The dip in the number of family formation and reunion grants which occurred in 2004 and 2005 reflected a change in the qualifying period for settlement, mostly from 1 to 2 years, delaying grants that would otherwise have occurred earlier.)
The number of asylum-related grants nearly doubled to 12,732 in the year ending March 2012 compared with 7,443 in the previous 12 months (these exclude any ‘legacy cases’). This increase is partly due to settlement grants being delayed following a change in the rules in August 2005 when immediate settlement for people granted refugee status was replaced with five years’ limited leave (at the end of this period they were entitled to apply for settlement).
Asylum-related grants were at high levels between 2004 and 2007 (due to the Family Indefinite Leave to Remain exercise and to grants of exceptional leave four years previously) and fell from a peak of 67,810 in 2005 to 14,191 in 2007. From 2008 to 2011 the numbers have remained relatively low.
9.6 Nationalities granted settlement
Data for grants by nationality in 2011 are planned to be published in Immigration Statistics April – June 2012, due to be released in August 2012, as part of additional analysis of data for 2011.
Over half (51% or 121,812) of those granted settlement in 2010 were nationals from Asia and 27% (64,875) were African nationals.
The ten countries whose nationals accounted for the largest number of grants in 2010 were India (37,436); Pakistan (21,382); China (14,616); Nigeria (10,031); the Philippines (9,934); Zimbabwe (9,848); Sri Lanka (9,422); Iran (8,401); South Africa (7,532) and Iraq (7,066). These nationalities accounted for 56% of the total grants.
9.7 Other related data
The Settlement section of the user guide includes a discussion on the differences between grants of settlement and long-term international migration estimates of immigration published by Office for National Statistics.
10. Citizenship
Valid: 24 May to 30 August 2012
10.1 Interpreting the figures
The figures relate to the number of people that are granted or refused British Citizenship. Citizenship is granted under the British Nationality Act 1981 which came into force on 1 January 1983, subsequently amended by the Nationality, Immigration and Asylum Act 2002.
The number of applications and decisions made reflect changes over time in levels of those entering the country, as well as policy and legislative changes, which for example may affect the number of people potentially eligible to apply. The availability and allocation of resources within the UK Border Agency can also affect the number of decisions.
All applications for citizenship are from individuals treated as main applicants in their own right (including those made on the basis of a relationship with an existing British citizen). The data also reflect the outcome of reconsidered decisions. All figures for 2011 and 2012 are provisional.
The User Guide to Home Office Immigration Statistics gives further details on this topic including definitions used, how figures are compiled, data quality and issues arising from figures being based on data sourced from an administrative database.
10.2 Key facts
There were 175,298 grants of British citizenship in the year ending March 2012, 10% fewer than in the previous 12 months (195,369), mainly due to 10,979 fewer grants based on marriage (-24%) and 8,163 fewer grants to children related to British citizens (-17%).
Applications made for British citizenship in the year ending March 2012 (198,718) were 4% lower than the previous 12 months (206,850), and below (-6%) the peak in 2005 (211,911).
There were 181,985 citizenship decisions made in the year to March 2012, 10% less than the previous 12 months (203,278). This is likely, in part, to be due to reductions in staff resources within the UKBA teams dealing with citizenship casework and the transfer of some staff to the administration of new applications, and may also reflect the 35% fall in grants of settlement over the same period. The refusal rate remained at 4% between 2010 and 2011; slightly lower than 2009 (5%) and lower than the levels of earlier years (between 7% and 9% from 2003 to 2008).
The number of applications and grants has risen significantly since the mid-1990s. This increase is likely, in part, to reflect increased grants of settlement over the same period to non-European Economic Area nationals; after a period of residence those granted settlement become eligible to apply for citizenship. There were 177,785 grants in 2011, lower than the record 203,789 in 2009, but remaining more than double the level of a decade earlier.
Grants of British citizenship
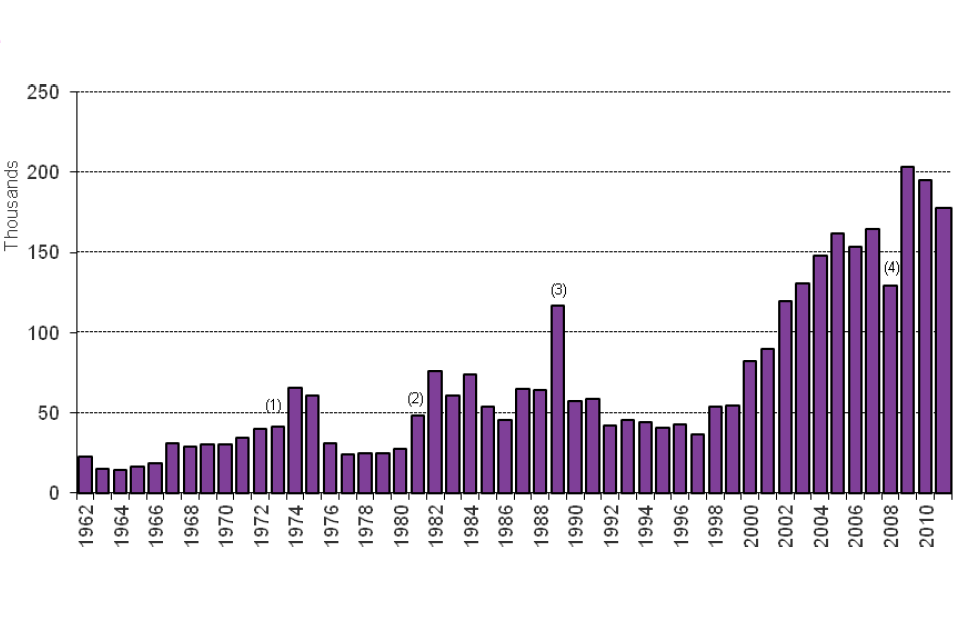
The chart shows the number of grants of British citizenship between 1962 and the latest calendar year. The data are available in Table cz.03.
Chart notes
Source: Home Office, immigration statistics January - March 2012, Citizenship Table cz.03.
(1) Following the Pakistan Act 1973, grants rose in 1974 and 1975 due to increased grants to Pakistani nationals.
(2) British Nationality Act 1981. Higher numbers of grants between 1981 and 1988 reflect work to deal with a surge in applications before the end of transitional registration provisions in the British Nationality Act 1981 which expired at the end of 1987.
(3) The large increase in grants in 1989 reflects the opening of the Liverpool nationality office, doubling casework capacity.
(4) Grants in 2008 were reduced when staff resources were temporarily transferred from decision-making to deal with administration of new applications.
10.3 Data tables
Further data on British citizenship are available in Citizenship Tables cz.01 to cz.10.
10.4 Refusals
There were 6,687 refusals and withdrawals of applications in the year to March 2012, 15% lower than in the previous 12 months (7,909), reflecting a 10% fall in the number of decisions. The proportion refused or withdrawn has remained at 4% from 2010 to date, having fallen from the 9% level that occurred during the 4 year period 2004 to 2007. The lower rates of refusal are thought to reflect the introduction of application checking services leading to fewer incomplete or inappropriate requests. For example the following 3 reasons for refusal accounted for the majority of the fall in refusals between 2007 and 2011 were: - parent not British, residence (failure to comply with requirements), delays in replying to UKBA enquiries by the applicant.
The most common reason for refusal in 2011 was on grounds that the applicant was considered not to be of good character (2,369 or a third of total refusals and withdrawals), closely followed by refusals on grounds that the applicant failed to fulfil a residence requirement (2,216 decisions). From 1 January 2008 a policy change meant that individuals were normally refused if they had been convicted of a criminal offence and the conviction had not yet become ‘spent’, in accordance with the provisions of the Rehabilitation of Offenders Act 1974. This led to higher numbers of such refusals.
10.5 Grants by previous nationality
Former Indian and Pakistani nationals have accounted for the largest numbers of grants in every year since 1998, except 2007, when most grants were made to former nationals of India, the Philippines and Afghanistan. Together, former Indian and Pakistani nationals accounted for a quarter (25%) of grants in 2011 (26,290 and 17,641 grants respectively), followed by former nationals of the Nigeria (7,932), Philippines (7,133), China (6,966), South Africa (6,351) and Sri Lanka (5,886).
10.6 Grants by age, sex and region of previous nationality
In 2011 the largest proportion of persons granted British citizenship were between 25 and 34 years of age (31%), followed by persons aged between 35 and 44 (25%). These 2 age groups have consistently been the largest in each year since 2002 (the first year for which age data is available). This pattern continues when broken down by sex, although a larger proportion are female, in particular in 2010 when 18% of grants were to females aged 25-34 and 13% were to males in this age bracket.
The proportions of males and females granted British citizenship overall has changed little between 2003 (the first year for which consistent data is available) and 2011, varying between 47% and 50% for males. Similar proportions are seen when the data are broken down by the applicants region of previous nationality, with the exception of the Middle East. For this region, males generally outnumber females each year, with proportions of grants to males ranging between 50% and 75%.
10.7 British citizenship ceremonies
There were 131,294 individuals attending British citizenship ceremonies in 2011 compared with 143,045 in 2010, reflecting the fall in grants. A large majority of those granted citizenship attend a ceremony (for example for 2011 there were 177,785 grants and 131,294 attendees). Those granted citizenship who are less than 18 years of age are not required to attend a ceremony and some individuals may attend a ceremony in a different period to when the grant was made.
40% (52,837) of the 131,294 individuals attending British citizenship ceremonies in 2011 did so in the London region. More people have attended ceremonies held in London than in any other regions. However the proportion attending in London has been falling, from 54% in 2005 to 40% in 2011, while proportions attending have increased in the North West, Yorkshire and the Humber and West Midlands regions.
10.8 Other related data
Who are the UK’s new citizens?, Centre on Migration, Policy and Society (COMPAS) Breakfast Briefing Summary, July 2011
11. Removals and voluntary departures
Valid: 24 May to 30 August 2012
11.1 Interpreting the figures
The figures relate to people leaving the United Kingdom either voluntarily or forcibly whom, in the main, the UK Border Agency has sought to remove.
This briefing generally refers to total numbers of people, including dependants, removed and departing voluntarily, which are referred to here as ‘departing’. While individuals removed at a port of entry have not necessarily entered the country, their removal requires action by the UKBA, such as being placed on a return flight, and are therefore included unless stated otherwise.
The User Guide to Home Office Immigration Statistics gives further details on this topic including definitions used, how figures are compiled, data quality and issues arising from figures being based on data sourced from an administrative database.
All data include dependants, unless otherwise stated. All data for 2010, 2011 and 2012 are provisional.
11.2 Key facts
13,386 people (including port removals) departed during the first quarter of 2012. This was a 6% fall compared with the first quarter of 2011 (14,224) and a 26% fall compared with the last peak in the third quarter of 2008 (18,078), the highest quarterly figure since the publication of this series began in the first quarter of 2001.
The overall fall in the first quarter of 2012 is mostly accounted for by the lower number of non-asylum cases refused entry at port and subsequently removed (down 19% from 3,822 in Q1 2011 to 3,095 in Q1 2012). Excluding port removals, the number of enforced removals and voluntary departures during the first quarter of 2012 (10,291) have returned to a similar level of departures recorded during the first quarter of 2011 (10,402).
Since a peak in 2008, the number of people departing has decreased; the number of people departing during 2011 was 52,526, down 13% from 60,244 during 2010 and down 23% from the peak of 67,981 during 2008.
A third of the fall in 2011 can be accounted for by a lower number of non-asylum cases refused entry at port and subsequently removed (down 15% from 18,276 during 2010 to 15,556 during 2011).
When excluding port removals, there has been a 12% fall in the total number of people forcibly removed or departing voluntarily in 2011 (down from 41,968 to 36,970); this fall has been affected by the decreased numbers of assisted voluntary returns and other voluntary departures, particularly in the first and second quarters of 2011 respectively.
Departures by type
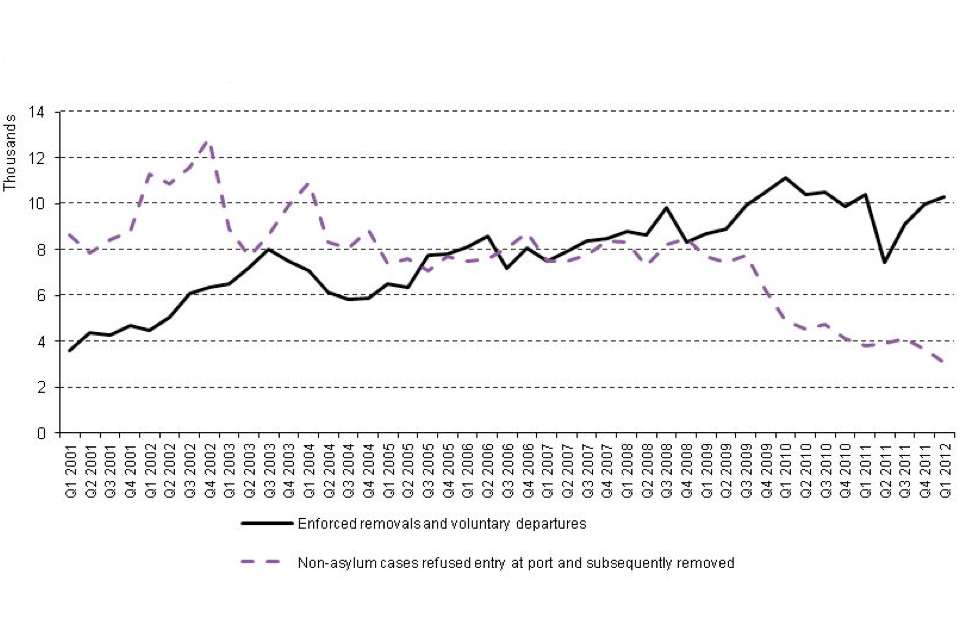
The chart shows the number of enforced removals and voluntary departures and non-asylum cases refused entry at port and subsequently removed between Q1 2001 and the latest quarter. The data are available in Table rv.01.q.
Chart notes
Source: Home Office, immigration statistics January – March 2012, Removals and Voluntary Departures Table rv.01.q.
The chart shows that the numbers of enforced removals and notified voluntary departures have returned from the unusually low figure seen in the second quarter of 2011. The numbers of non-asylum cases refused entry at port and subsequently removed in Q1 2012 is the lowest quarterly figure since the publication of data began in the first quarter of 2001.
11.3 Data tables
Further data on removals and voluntary departures are available in:
11.4 Asylum and non-asylum cases
Within the total number of people departing during the first quarter of 2012, there were 2,453 people who had claimed asylum (6% lower than during the first quarter of 2011) and 10,933 non-asylum cases (6% lower than during the first quarter of 2011).
Looking longer term, during 2011 there were 8,869 people departing who had sought asylum at some stage, down 15% compared to 2010 (10,394) and 51% lower than the peak of 18,280 during 2006. This decrease in asylum cases departing can be viewed in the context of a general decreasing trend in asylum applications since 2001.
There were 43,657 non-asylum cases departing during 2011, 12% lower than 49,850 during 2010. Numbers of those refused entry at port and subsequently removed (see ‘Other data on departures’ below), as well as the number of non-asylum cases forcibly removed or departed voluntarily, have decreased, the latter having decreased by 11% from 31,574 during 2010 to 28,101 during 2011.
11.5 Departures by ‘harm’ assessment
In the financial year 2011/12, of the 36,859 people forcibly removed or departed voluntarily who were subject to an assessment for a harm rating, 10% of removals were assessed as ‘higher harm’. This is similar to the previous financial year, when 11% of removals were assessed as ‘higher harm’. ‘Higher harm’ assessments include people who have committed serious criminal and immigration offences. Latest quarterly data is available in Removals and Voluntary Departures Table rv.08.q.
Figures for departures by harm assessment are Official Statistics and have not been designated as National Statistics. For details about the quality of the data relating to these figures please see the user guide.
11.6 Other data on departures
During the first quarter of 2012, 1,219 foreign national offenders were removed, 11% fewer than in the first quarter of 2011 (1,364). During the financial year 2011/12, 4,377 foreign national offenders were removed. In this period the UKBA target for removal of foreign national offenders was 4,700.
Figures for foreign national offenders are Official Statistics and have not been designated as National Statistics. For details about the quality of the data relating to these figures please see the user guide.
Of the total number of departures during 2011, 45% were from Asia, 19% from Africa and 18% were from the Americas. The top countries of nationality were India (13%), Pakistan (8%), followed by Brazil (6), China (6), and Nigeria (6%).
The number of non-asylum cases refused entry at port and subsequently removed had fallen sharply in recent years. In the first quarter of 2012, there were 3,095 such cases, 19% fewer than in the first quarter of 2011(3,822).This is the lowest quarterly figure since publication of data began in the first quarter of 2001.
11.7 Other related data
Information on numbers of people removed upon leaving detention is available in the ‘Detention’ briefing and numbers of non-asylum passengers initially refused entry at port are available in the ‘Before Entry’ briefing.
Data on the family returns process are published as official statistics by UKBA as part of their performance data, UK Border Agency, Our Performance.
12. Detention
Valid: 24 May to 30 August 2012
12.1 Interpreting the figures
Figures presented here relate to people held solely under Immigration Act powers in UK Border Agency immigration removal centres, short-term holding facilities and pre-departure accommodation. These people are referred to here generically as being ‘detained’ or ‘in detention’. Data are not available on those held in short term holding rooms (for less than 24 hours), police cells and prisons under immigration offences.
The User Guide to Home Office Immigration Statistics gives further details on this topic including definitions used, how figures are compiled, data quality and issues arising from figures being based on data sourced from an administrative database. The User Guide also includes information on new pre-departure accommodation which opened in August 2011 and has been specifically designed for children and their families. This followed the government announcement in December 2010 that it would end the detention of children for immigration purposes.
Children are those recorded as being under 18 years of age. All data for 2010, 2011 and 2012 are provisional.
12.2 Key facts
During 2011, 27,072 people entered immigration detention, an increase of 5% from the 25,904 for 2010. Data for the first quarter of 2012 show 7,516 people entered detention, the highest recorded since publication of data began in the first quarter of 2009, and an increase of 7% from 7,015 in the first quarter of 2011.
The number of people leaving immigration detention was 27,112 during 2011. Of these: 62% were removed from the United Kingdom; 30% were granted temporary admission or release; and 7% were bailed. Data for the first quarter of 2012 show 6,870 left detention, similar to the 6,875 for the first quarter of 2011.
There were 3,034 people in immigration detention on 31 March 2012, the highest recorded since publication of data began in 2001, and 14% more than on 31 March 2011 (2,654).
The number of children entering detention fell considerably during 2010 to reach a low point of 10 in the first quarter of 2011. However, it has since increased quarter on quarter. The number of children entering detention was 53 in the first quarter of 2012. There was 1 child in detention (at Cedars pre-departure accommodation) on 31 March 2012.
12.3 Data tables
Further data on detention are available in Detention Tables dt.01 to dt.12.q.
12.4 Occurrences in detention
Of the 7,516 people entering detention during the first quarter of 2012, 6,647 entered for the first time; 720 entered for the second time; 83 entered for the third time and 18 entered for the 4th time or more since January 2009, the earliest recording point in this dataset.
Figures for occurrences in detention are Official Statistics and have not been designated as National Statistics. For details about the quality of the data relating to these figures please see the user guide.
12.5 Length of detention
Of those leaving detention during the first quarter of 2012, 4,648 (68%) had been in detention for less than 29 days, 1,071 (16%) for between 29 days and 2 months and 722 (11%) for between 2 and 4 months. Of the 429 (6%) remaining, 52 had been in detention for between one and 2 years and 16 for 2 years or longer.
Of those people in detention on 31 March 2012, 1,270 (42%) had been in detention for less than 29 days, 685 (23%) for between 29 days and 2 months and 461 (15%) for between 2 and 4 months. Of the 618 (20%) remaining, 118 had been in detention for between one and 2 years and 42 for 2 years or longer.
12.6 Children
99 children entered detention in 2011; 79 of these at either Tinsley House or Cedars pre-departure accommodation. 102 children left detention in 2011, of whom 59 were removed from the UK. There were no children in detention on 31 December 2011.
53 children entered detention during the first quarter of 2012. Of the 53 children, 35 were children held at Cedars pre-departure accommodation, 12 were border cases detained at Tinsley House, the remaining 6 were age dispute cases detained at Campsfield House, Colnbrook Short Term and Morton Hall.
53 children left detention during the first quarter of 2012. Of these: 27 were removed and 25 were granted temporary admission/release.
Children entering detention, solely under Immigration Act powers
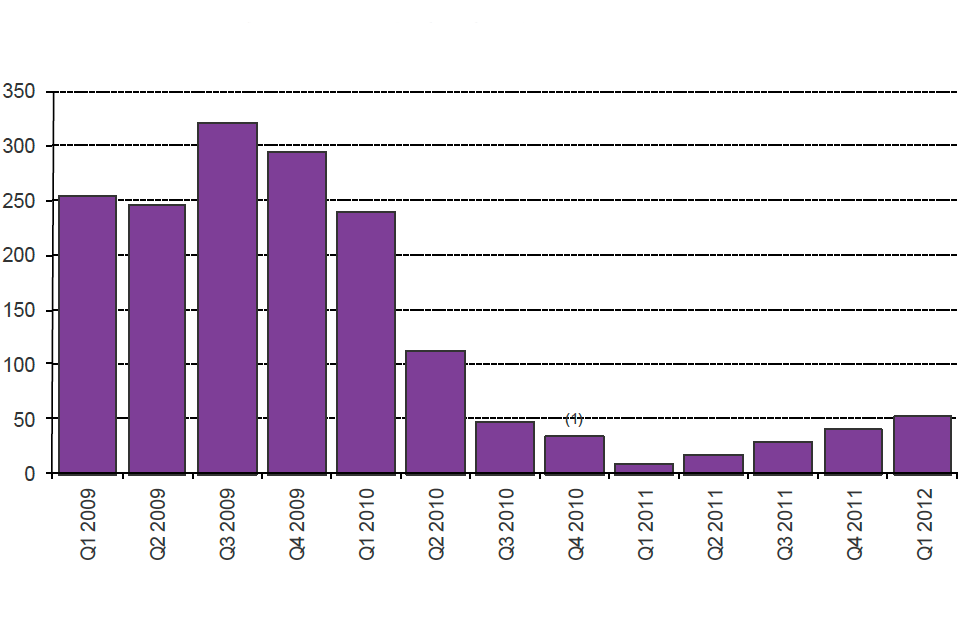
The chart shows the number of children entering detention between Q1 2009 and the latest quarter. The data are available in Table dt.03.q.
Chart notes
Source: Home Office, immigration statistics January – March 2012, Detention Table dt.03.q (1) Oakington Reception Centre closed on 12 November 2010 and Yarl’s Wood closed to families with children on 16 December 2010.
12.7 Other related data
Data on the family returns process are published as official statistics by UK Border Agency as part of their performance data, UK Border Agency, Our Performance.
13. European Economic Area
Valid: 24 May to 30 August 2012
13.1 Interpreting the figures
The European Economic Area (EEA) consists of countries within the EU, together with Norway, Iceland and Liechtenstein. Nationals of the EEA and Switzerland have rights of free movement within the United Kingdom. This means that there is less information on numbers coming to the United Kingdom than for nationals of other countries. This topic briefing brings together the information that is known about these nationals.
Nationals of Bulgaria and Romania (the ‘EU2’ countries) currently have certain restrictions placed on them; other nationals of EEA countries can apply for documentation that shows that they have the right of free movement. In the first 12 months of stay, working Bulgarian and Romanian nationals are generally required to hold an accession worker card or apply for one of 2 lower-skilled quota schemes: the Sector Based Scheme (SBS) or Seasonal Agricultural Workers Scheme (SAWS). Other Bulgarian and Romanian nationals can apply for a registration certificate, giving proof of a right to live in the United Kingdom. Data for the first quarter of 2012 relating to these schemes is highly provisional and likely to be revised significantly in future (based on previous experience of these data sources) and has therefore not been used within the commentary.
For the purposes of this briefing, ‘EEA’ refers to countries in the EEA, excluding the United Kingdom, together with Switzerland. Long-Term International Migration (LTIM) and International Passenger Survey (IPS) estimates relate to EU countries, rather than EEA countries. Except for passenger admissions, LTIM and IPS, all data are provided unrounded. Data in this topic include dependants where relevant, unless stated otherwise. All data for 2010 and 2011 are provisional, except for LTIM and IPS which have been finalised for 2010.
The User Guide to Home Office Immigration Statistics gives further details on this topic including definitions used, how figures are compiled, data quality and issues arising from figures being based on data sourced from an administrative database or from surveys.
13.2 Key facts
A large proportion of those entering the country have rights of free movement and are not subject to immigration control. In 2011, 88% of passenger arrivals were British or EEA nationals (based on Home Office admissions data table ad.01)
In the year ending September 2011, provisional estimates based on intentions to stay for at least 12 months indicate that 60,000 more British nationals emigrated than immigrated (i.e. a net migration of -60,000). However, the opposite is true of other EU nationals, with estimated net migration of %2B74,000.
For the EU2 (Bulgaria and Romania), revised data for 2011 indicates that applications for Accession worker cards rose by 1% (previously shown as a 6% fall) while applications for Registration certificates fell 1% compared with 2010 (previously shown as a 12% fall). The corresponding approvals for these schemes both fell in 2011 by 3% and 23% respectively (previously shown as 12% and 33% falls).
At the same time, approvals under the Sector Based Scheme (SBS) have increased 37% in 2011 (previously shown as 31%) and approvals under the Seasonal Agricultural Workers Scheme (SAWS) were at similar levels to 2010. In Q1 2012, 10,445 SAWS applications were approved, the second highest quarterly total recorded. This may be due to agricultural factors, such as weather conditions and harvest sizes leading scheme operators to issue documents earlier in the year.
Estimates of EEA admissions
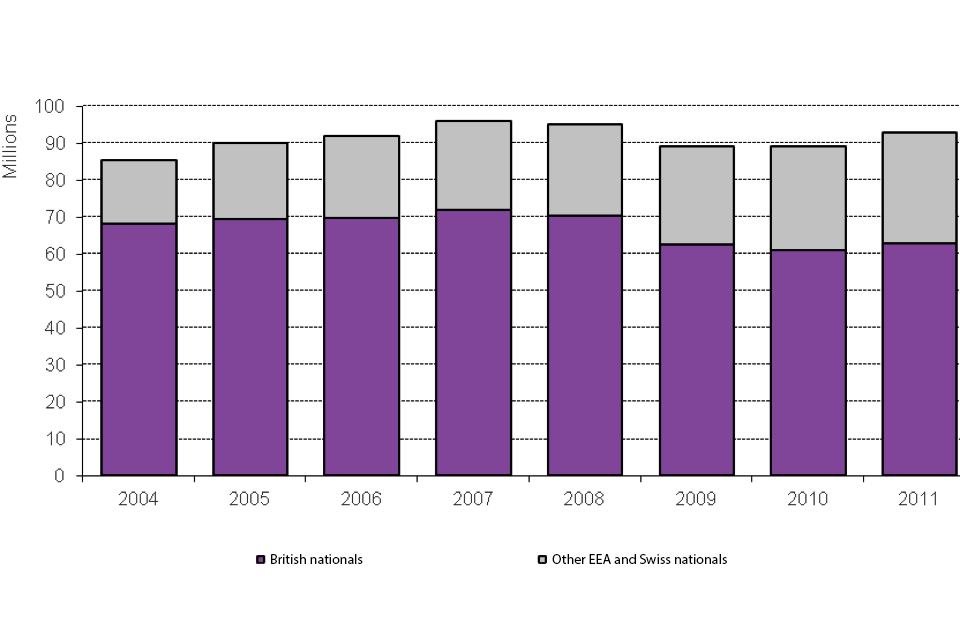
The chart shows numbers of passengers arriving who are nationals of the European Economic Area or Switzerland between 2004 and the latest calendar year available, from Home Officer admissions data, available in Table ad.01.
Chart notes
Source: Home Office, immigration statistics January – March 2012, EEA Table ad.01.
The reason for entry for British, other EEA and Swiss nationals is not known from Home Office admissions data as these passengers are not required to complete a Landing Card. However, estimates from the International Passenger Survey (IPS) provide EU nationals’ reasons for entry. The large majority are either visitors or individuals returning to the United Kingdom (Source: ONS, Travel Trends).
13.3 Data tables
Further data on EEA nationals are available in Admissions Tables ad.01 and EEA Tables ee.01 to ee.04.
13.4 Admissions of EEA nationals
The number of British passenger arrivals rose from 68.2 million in 2004 to 71.9 million in 2007 and then fell to 60.9 million in 2010 before rising to 62.9 million in 2011.
Between 2000 and 2003, the number of EEA passenger arrivals was relatively stable; however, there was an increase in 2004, which coincided with ten countries joining the EU / EEA. The number of EEA passenger arrivals rose from 17.0 million in 2004 to 29.8 million in 2011. These numbers will, in part, have been boosted by nationals of Bulgaria and Romania, following these countries becoming part of the EEA in 2007.
13.5 Immigration of EU nationals
Provisional estimates of Long Term International Migration (LTIM) group nationalities into British, other EU and non-EU rather than British, other EEA and non-EEA. These estimates define immigrants as individuals who intend to stay for at least a year in the UK (or abroad for emigrants). There were an estimated 165,000 other EU national immigrants in the year ending September 2011, compared with 182,000 for the previous 12 months.
An estimated 47% and 57% of British and other EU national immigrants came for work-related reasons. By contrast only 16% of non-EU immigrants came for work; 62% came for study. While the proportions of British nationals and non-EU nationals coming with a definite offer of work is similar to a year ago, the proportion of other EU nationals who came for work who had a definite job offer has fallen from 41% to 35%.
In the year to September 2011, the estimates indicate that 60,000 more British nationals emigrated than immigrated (i.e. a net migration of -60,000). However, the opposite is true for other EU nationals, with estimated net migration of %2B74,000.
Source: ONS, Long-Term International Migration.
13.6 ‘EU2’ countries – Bulgaria and Romania
Between 2007 (when Bulgaria and Romania joined the EEA) and the end of 2009, the number of approvals for accession worker cards and for registration certificates fell. After rising slightly in 2010 to 2,623 and 26,910 respectively, approvals have fallen again in 2011 to 2,547 accession worker cards and 20,661 registration certificates.
Approvals for registration certificates and for accession worker cards in the first quarter of 2012 are substantially lower than figures for the same period in previous years due to the number of applications received that have yet to be dealt with. It is expected that these figures will be revised upward in future publications.
Between 2007 and 2011, approved applications for the Sector Based Scheme (SBS) have fallen overall, although not consistently. There were 1,407 approved applications for SBS during 2007, rising to 1,569 in 2008, before falling to 775 in 2009 and to 601 in 2010 then rising to 822 in 2011.
Approved applications under the Seasonal Agricultural Workers Scheme (SAWS) rose sharply in 2008 and 2009 but have been relatively stable between 2010 and 2011, with 19,798 in 2010 and 20,456 in 2011.
Upward revisions to the data for 2011 were anticipated in previous editions. For both accession worker cards and registration certificates there are 2 reasons why initial figures underestimate the final position.
- Decisions data relate to the corresponding cohort of applications, e.g. for applications made in the latest quarter, more decisions will be made in the following quarters.
- As decisions are made, and data is entered on administrative systems, the initial figures for the number of applications are likely to increase slightly.
13.7 Residence document decisions
Data on residence document decisions in 2011 are planned to be published in immigration statistics April – June 2012, due to be released in August 2012, when data are available.
EEA nationals and their family members are not obliged to apply for residence documentation, but can do so if they wish. The family members are not necessarily EEA nationals.
The number of decisions on applications for EEA residence documents in 2010 (81,984) was similar to that seen in 2009 (82,927). The number of decisions had risen compared to 2008 following a number of operational and procedural measures introduced to improve performance (in terms of the quantity and quality of decisions made) within the UK Border Agency during 2009 and 2010.
Although the total numbers of decisions were similar in 2009 and 2010, the proportions issued with the 2 types of documentation had changed; issues of initial-right-to-reside documents had fallen, while issues of documents recognising permanent residence rose. Grants of initial-right-to-reside documents had fallen for all regions other than Africa, with grants to Nigerian family members rising by 1,102. A large proportion of the fall in grants of initial right to reside documents is due to a fall of 8,862 in grants to nationals of Poland, from 16,211 in 2009 to 7,349 in 2010.
In contrast to this, grants of documents recognising permanent residence rose for all regions and almost all nationalities, with the exception of Portugal which fell by 221. Poland was the nationality with the largest increase, rising from 1,097 in 2009 to 2,660 in 2010.
The numbers of applications refused in 2010 for both initial-right-to-reside documents and documents certifying permanent residence increased. The largest increase for an individual nationality is in refusals of Nigerian nationals’ applications for initial-right-to-reside documents, increasing from 2,522 in 2009 to 5,778 in 2010.
In 2008 there were more applications rejected prior to substantive consideration than in other years. These applications (included in ‘Other outcome’ in Table ee.02) were rejected because they were based on sections of European law that were irrelevant to the applicant’s existing immigration status.
13.8 Other related data
EEA nationals do not require an entry clearance visa. Just under 500 visas were recorded as issued to EEA nationals in 2011, with 89% of these recorded as Cyprus or from the northern part of Cyprus. The ‘Before Entry’ data tables and section of the user guide provide more information.
Passenger arrivals figures for 2000 to 2003, referred to in the ‘Key points’ above, can be found in Table 1.2 of ‘Control of immigration statistics United Kingdom 2009’.
Small numbers of EEA nationals seek asylum (17 main applicants and dependants in 2011) and relatively small numbers of EEA nationals (1,782, up 15% on 1,544 in 2010) are removed or depart voluntarily. European legislation generally sets higher thresholds for deporting EEA nationals than exist for other foreign nationals.