Work
Published 27 August 2015

© Crown copyright 2015
This publication is licensed under the terms of the Open Government Licence v3.0 except where otherwise stated. To view this licence, visit nationalarchives.gov.uk/doc/open-government-licence/version/3 or write to the Information Policy Team, The National Archives, Kew, London TW9 4DU, or email: psi@nationalarchives.gov.uk.
Where we have identified any third party copyright information you will need to obtain permission from the copyright holders concerned.
This publication is available at https://www.gov.uk/government/statistics/immigration-statistics-april-to-june-2015/work
Valid: 27 August 2015 to 25 November 2015
Back to ‘Immigration statistics April to June 2015’ content page.
This is not the latest release. View latest release.
This section includes figures on work-related visas granted, passenger arrivals, extensions granted and permissions to stay permanently (settlement) for non-EEA nationals. It also includes figures on long-term immigration to work (i.e. those intending to stay for at least 12 months for work) for non-EU nationals.
Data include dependants as well as main applicants unless stated otherwise. Estimates of long term immigration for work from the ONS International Passenger Survey (IPS) relate to those whose main reason for migration is to work and so are likely to exclude dependants (who would be more likely to say their main reason was to ‘accompany or join’ rather than to work).
All data below relate to the year ending June 2015 and all comparisons are with the year ending June 2014, unless indicated otherwise.
1. Key facts
There were 168,544 work-related visas granted in the year ending June 2015, up 6% (+9,313) compared with the previous year. There were increases in Tier 2 skilled work (+7,977) and Tier 5 Youth mobility (+2,679 main applicants) as well as a reduction in the number of dependants in routes now closed to new applicants (Tier 1 General -1,779; Tier 1 Post Study -1,141).
In the year ending March 2015, the ONS estimate that there were 64,000 non-EU long-term immigrants for work, a statistically significant increase of a third (+33%; +16,000) compared with the previous 12 months. Over the same period long-term (1 year or more) work-related visas granted to main applicants also rose, by 21% (+12,572) to 72,144. There are a range of potential reasons why long-term immigration estimates, which include considerable sampling variation, and visas data, may show different trends; details are given below.
There was a 10% increase in sponsored visa applications for skilled work (to 55,664 in the year ending June 2015, main applicants). Most of the increase was accounted for by for the four largest sectors: Information and Communication (23,518; +8%), Professional, Scientific and Technical Activities (10,728; +15%), Financial and Insurance Activities (6,695; +10%) and Human Health and Social Work Activities (3,349; +32%).
Work-related grants of extensions fell by 9% (-8,020) in the year ending June 2015 to 84,012. This fall was mainly accounted for by 5,013 fewer Tier 1 General grants (closed to new entrants since December 2010) as well as 2,980 fewer Tier 1 Entrepreneur category grants reflecting changes to the rules on eligibility for individuals seeking to switch to Tier 1 Entrepreneur which were intended to reduce the potential for non-compliance in this particular visa category. For further information see Statement of changes in Immigration Rules.
Work immigration: latest trends
| Year ending June 2014 | Year ending June 2015 | Change | Percentage change | |
|---|---|---|---|---|
| Work-related visas granted | 159,231 | 168,544 | +9,313 | +6% |
| of which: | ||||
| High value (Tier 1) visas | 10,308 | 7,922 | - 2,386 | -23% |
| Skilled (Tier 2) visas | 84,613 | 92,590 | +7,977 | +9% |
| Youth mobility and temporary workers (Tier 5) visas | 42,378 | 44,660 | +2,282 | +5% |
| Non-PBS/Other work visas | 21,932 | 23,372 | +1,440 | +7% |
| Year ending March 2014 | Year ending March 2015 | Change | Percentage change | |
| Long-term immigration for work (1), excluding dependants | 48,000 | 64,000 | +16,000 | +33% |
| Long-term (1 year or more) work-related visas granted excluding dependants | 59,572 | 72,144 | +12,572 | +21% |
Table notes
Source: Home Office, Immigration Statistics April to June 2015 Visas table vi 04_q, International Passenger Survey, Office for National Statistics, Migration Statistics Quarterly Report.
(1) Immigration for work data are estimates of the number of non-EU nationals intending to change their residence to the UK for at least 12 months based on the International Passenger Survey.
2. Long-term trends in work-related immigration
There was a long-term reduction in work-related visas granted, admissions and non-EU immigration from 2006 to 2012. There have been increases more recently (and falls in extensions related to the previous closure of the Tier 1 General and Tier 1 Post Study categories to new applicants: see Extensions topic).
The chart below shows that work-related visas and admissions move in line with each other. International Passenger Survey (IPS) estimates of non-EU work immigration are substantially lower as these include only those migrants who state they intend to remain in the UK for a year or more. However the two series show broadly similar trends with falls from 2006 followed by increases from the middle of 2013. Data on just long-term work visas (1 year or more) for main applicants are much closer to the IPS series, and have become closer (the difference having reduced from 47,000 in 2007 and 2008 to within 1,000 for the year ending December 2014). This may in part reflect changes made as part of the introduction of the Points-Based System in 2008, such as the introduction of the short-term intra-company transfer route.
However, there are a range of potential reasons why IPS figures differ from figures for work visas granted or passenger arrivals, and hence why the trends in the different series do not always correspond, including:
- sampling variation in the IPS, (for example the increase of 16,000 in work-related immigration for the year ending March 2015 has an estimated confidence interval of +/-11,000)
- IPS data for work relate to individuals whose main reason for migration was work related so (unlike visas data) are likely to exclude their dependants i.e. the IPS data are likely to be more comparable with visa main applicants than with total visas data
- differences between intentions and visa length
- individuals may migrate for multiple different reasons
- timing differences between when visas are granted and when an individual actually travels
- visa and admissions data include dependants, and both short term and long-term migrants
Further comparisons of the data are described in the user guide.
Long-term trends in work-related immigration
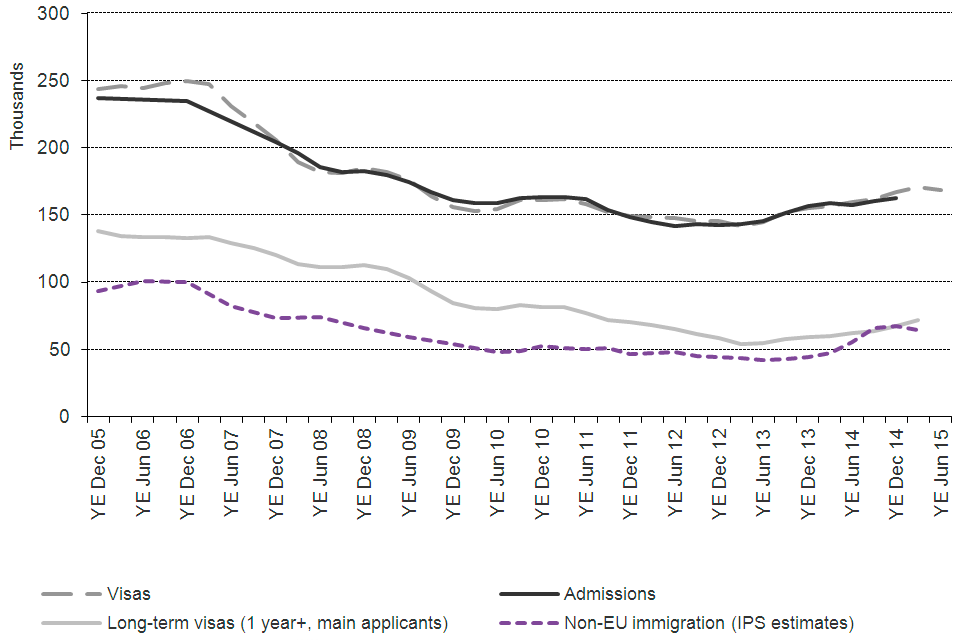
The chart shows the trends for work of visas granted, admissions and International Passenger Survey (IPS) estimates of non-EU immigration, between 2005 and the latest data published.
Chart notes
Source: Home Office, Immigration Statistics April to June 2015, Visas tables vi 04 q (Visas volume 1), Admissions table ad 02 q and corresponding datasets, Office for National Statistics, Migration.
3. Register of sponsoring employers
(Tier 2 Skilled workers and Tier 5 Youth mobility and temporary workers)
As part of the application process for visas and extensions for work reasons, main applicants must obtain a certificate of sponsorship from an employer. Sponsorship tables cs 01 q to cs 06 q provide data on the number of employers registered and their sponsor rating, the nationality of main applicants, and the corresponding numbers of main applicants for different industry sectors.
An employer may be counted more than once in the total if registered separately to sponsor both Tier 2 and Tier 5 individuals or registered for more than one sub-Tier. Altogether there were 29,307 employers on the register on 30 June 2015, 4% more than on 30 June 2014 (28,302).
4. Sponsored work visas and extensions, by industry and by nationality
4.1 Skilled individuals (Tier 2)
There were 55,664 sponsored visa applications (main applicants) for skilled work (+10% or +5,046). Over half of these applications were for Indian nationals (30,889 or 55% of the total), with the next largest source nationalities being US (6,536 or 12%), Australian (2,042 or 4%), Chinese (1,802 or 3%) and Japanese (1,784 or 3%) nationals.
The majority of the 55,664 applications related to skilled work in the following sectors:
- Information and Communication (23,518, +8%)
- Professional, Scientific and Technical Activities (10,728, +15%)
- Financial and Insurance Activities (6,695, +10%)
- Human Health and Social Work Activities (3,349, +32%)
- Education (2,712, +5%)
- Manufacturing (2,692, +7%)
There were 31,656 sponsored applications for extensions (main applicants) for skilled work (-7%). The majority of these related to the following sectors:
- Information and Communication (6,211, -4%)
- Human Health and Social Work Activities (5,138, -9%)
- Professional, Scientific and Technical Activities (4,922, -3%)
- Education (3,822, +1%)
- Financial and Insurance Activities (3,768, +3%)
4.2 Youth mobility and temporary workers (Tier 5)
There were 44,377 sponsored visa applications (main applicants) for Youth mobility and temporary workers (0% change). Over two-thirds (67%) of these applications were for US (21,904 or 49% of the total), Canadian (2,445 or 6%), Indian (2,163 or 5%), Chinese (1,671 or 4%) or Australian (1,660 or 4%) nationals.
The large majority of the 44,377 applications related to the Arts, Entertainment and Recreation (31,005, down 4%) and Education (4,943, up 3%) sectors. There were a total of 833 sponsored applications for extensions for Tier 5, the relatively small numbers reflecting the rules relating to extensions for such workers.
5. Unsponsored work visas and extensions: Tier 1 (high value)
The 2010 report ‘Points-based system Tier 1: an operational assessment’ indicated that only small minorities of those in the Tier 1 Post Study and Tier 1 General categories at that time were found to be in skilled work. Tier 1 General route was closed to new “out of country” entry clearance visa applicants from 23 December 2010 and to those applying inside the UK to switch from most categories from 6 April 2011. The Tier 1 Post-study route was closed to new applicants from 6 April 2012.
More recently (July 2014) the rules for the Tier 1 Entrepreneur category have also been tightened for extensions in order to reduce the non-compliance in that route (see Changes to the immigration rules will clamp down on visa abuse). As a consequence, the total level of Tier 1 visas granted has continued to fall (-2,386 to 7,922) as have Tier 1 extensions (-7,515 to 13,752). Visas granted for the other categories in Tier 1, particularly those which have been introduced to facilitate the migration of exceptionally talented professionals have increased although from relatively low levels (Tier 1 Investor up 8% to 2,205, Tier 1 Entrepreneurs up 8% to 3,369, Tier 1 Exceptional Talent up 41% to 138).
6. EU accession countries
In the 2 years from accession to the EU on 1 July 2013, 1,362 applications were received from Croatians either for authorisation to work (i.e. for an accession registration certificate) or for a registration certificate confirming that the applicant was exercising a right to reside on a basis other than authorised employment. Of these, 584 were for accession worker registration certificates and 778 were for other registration certificates. As at 16 July 2015, 488 of the accession worker registration certificate applications and 610 other registration certificates had been approved.
European Economic Area tables ee 01 and ee 01 q show a full breakdown of decisions by type in applications for EU2 accession worker cards and registration certificates between 2007 and 2013 along with cases outstanding as at 16 July 2015.
7. Extensions to stay for work, and permission to stay permanently (settlement)
There were 84,012 work-related grants of extensions in the year ending June 2015, 9% lower (-8,020). This largely reflected falls in two categories that had been closed to new entrants: Tier 1 General (from 12,736 to 7,723) and Post-Study work (from 368 to 34). There was also a 43% decrease in grants in the Tier 1 Entrepreneur category (from 6,951 to 3,971) reflecting tightening of eligibility for individuals seeking to switch to Tier 1 Entrepreneur. For further information see Statement of changes in Immigration Rules.
The number of grants of extensions for Tier 2 Skilled Workers was 60,379 in the year ending June 2015, similar to the previous 12 months (60,622).
Looking at individuals’ previous category in the latest available statistics, an estimated 7,043 former students (main applicants) were granted extensions for work in 2014 (5,639 for Tier 2 skilled work), compared with 6,238 in 2013 (correspondingly 4,176).
There were 40,954 work-related grants to stay permanently in the year ending June 2015, 15% (-7,505) lower than the previous 12 months (48,459). The decrease partly reflects reductions in work-related arrivals 5 years earlier. Settlement granted after 5 years with a work permit fell from 8,128 to 854, reflecting the replacement of the work permit scheme by the Points-Based System in 2008. Grants to Tier 1 High Value individuals fell from 24,257 to 20,445 whilst grants in the Tier 2 Skilled Work category rose from 10,125 to 15,551.
The Extensions topic and Settlement topic provide further detail on those granted work-related extensions of stay in the UK or work-related permission to stay permanently in the UK.
8. UK nationals and non-UK nationals: Employment levels
Estimates from the Labour Force Survey, UK Labour Market August 2015, published by the ONS, show that the number of UK nationals in employment in April to June 2015 was 27.8 million, up 84,000 (0.3%) compared with the same quarter in 2014.
The number of non-UK nationals in employment in April to June 2015 was 3.2 million, up 257,000 (+9%) compared with the same quarter in 2014. The 257,000 increase was almost entirely accounted for by higher employment of EU nationals (up 250,000 or 14% to 2.0 million). There were increases in each of the EU14 (up 116,000 or +16% to 838,000), EU8 (up 100,000 or +12%, to 959,000) and EU2 (up 40,000 or +29%, to 178,000) groups.
The number of non-EU nationals in employment remained at 1.2 million (with a slight increase of 7,000 or +0.6%).
The total growth in employment over the last year was 342,000; around a quarter (+84,000) of this growth can be accounted for by UK nationals and three quarters (+257,000) by non-UK nationals. The latter increase was driven by the rise in EU nationals in employment.
9. Reason for migration and the labour market
IPS statistics and visa statistics represent flows of people, only a proportion of whom will remain for longer periods. A recent Home Office research report, ‘The reason for migration and labour market characteristics of UK residents born abroad’ (September 2014), uses ONS data from the Labour Force Survey to provide estimates of the number of residents born abroad by the reason for original migration.
A key finding of this was that the distribution of original purposes given for migrating by people resident in the UK who were born abroad is different from that produced when looking at the migration flows reported in the IPS. For example, the proportion of people who come for family purposes or as a dependant takes greater significance, because of the higher likelihood of people who come for relationship reasons to stay longer. Similarly, although many foreign students are temporary the analysis confirmed findings in other studies that a number of foreign students do stay on as residents.
10. Staying in the UK
In February 2015 the Home Office published its ‘Migrant Journey: Fifth Report’, which shows how non-EEA migrants change their immigration status or achieve settlement in the UK. Key results included:
- 20% (18,359) of those issued skilled work visas (with a potential path to settlement) in the 2008 cohort had been granted settlement 5 years later and a further 8% (6,912) still had valid leave to remain
- Indian nationals were issued the largest proportion (39%) of skilled work visas in the 2008 cohort and, of these skilled Indian nationals, 19% had received settlement after 5 years, while a further 7% still had valid leave to remain
Source: Home Office, Migrant Journey Fifth Report.
11. Review of Tier 2
The Home Secretary commissioned the Migration Advisory Committee on 10 June 2015 to conduct a review of the Tier 2 route. This commission is split into two calls for evidence, as follows:
- early advice on Tier 2 salary thresholds by 21 July 2015. Details at Call for evidence: minimum salary thresholds for Tier 2 (now closed)
- a wider review of the Tier 2 routes by mid-December 2015. Details are at Call for evidence review: Tier 2 route (closing date 25 September 2015)
12. Data tables
Data on immigration for work, sourced from Home Office administrative systems, can be found in the following tables:
Visas vol. 1: tables vi 01 q, vi 04 and vi 04 q
vi 01 q Entry clearance visa applications and resolution by category
vi 04 Entry clearance visas granted by category
vi 04 q Entry clearance visas granted by category
Visas vol. 2: Table vi 06 q w
vi 06 q w Entry clearance visas granted by category and country of nationality: Work
Sponsorship: tables cs 01 q to cs 06 q
Admissions: tables ad 02 to ad 03 and ad 03 w
Extensions: tables ex 01 to ex 02 and ex 02 w