Extensions of stay
Published 27 August 2015

© Crown copyright 2015
This publication is licensed under the terms of the Open Government Licence v3.0 except where otherwise stated. To view this licence, visit nationalarchives.gov.uk/doc/open-government-licence/version/3 or write to the Information Policy Team, The National Archives, Kew, London TW9 4DU, or email: psi@nationalarchives.gov.uk.
Where we have identified any third party copyright information you will need to obtain permission from the copyright holders concerned.
This publication is available at https://www.gov.uk/government/statistics/immigration-statistics-april-to-june-2015/extensions-of-stay
Valid: 27 August 2015 to 25 November 2015
Back to ‘Immigration statistics April to June 2015’ content page.
This is not the latest release. View latest release.
The figures in this section relate to individuals inside the UK extending or changing the status of their stay in the UK. An individual may make more than one application in any given year. Data include dependants unless stated otherwise.
The numbers of decisions made are not always fully comparable over time. This is because, as well as reflecting past changes in the levels of those entering the UK, the figures are influenced by policy and legislative changes, for example, when new categories are introduced or when there are changes to the length of leave granted. In addition, the level of decisions made may be affected by the resources available in the Home Office.
All data below relate to the year ending June 2015 and all comparisons are with the year ending June 2014, unless indicated otherwise.
1. 1. Key facts
There were 284,189 decisions on extensions in the year ending June 2015, 13% fewer than in the previous 12 months. Four-fifths of decisions were grants (228,348) and a fifth (55,841) were refusals.
Grants of extensions fell by 27,365 (-11%), with 26,183 fewer study-related grants and 8,020 fewer work-related grants. The fall in work-related grants was largely accounted for by a 5,013 fall for Tier 1 General, this category having been closed to new entrants, and a 2,980 fall for Tier 1 Entrepreneurs where eligibility has been tightened. By contrast family-related grants increased by 3,419 with a 3,402 increase in grants for partners.
Refusals of extensions fell by 16,622, with 15,580 fewer refusals in the Other category reflecting relatively high previous levels of decisions in the Other category for the year ending June 2014.
1.1 Grants of extensions by reason, and refusals
| Year | Total decisions | Total grants | Work | Study | Family (1) | Other (1) | Refusals |
|---|---|---|---|---|---|---|---|
| Year ending June 2011 | 361,609 | 304,308 | 125,203 | 135,947 | 18,463 | 24,695 | 57,301 |
| Year ending June 2012 | 308,785 | 270,817 | 134,168 | 93,287 | 16,392 | 26,970 | 37,968 |
| Year ending June 2013 | 348,484 | 291,814 | 145,904 | 100,470 | 30,788 | 14,652 | 56,670 |
| Year ending June 2014 | 328,176 | 255,713 | 92,032 | 96,249 | 36,742 | 30,690 | 72,463 |
| Year ending June 2015 | 284,189 | 228,348 | 84,012 | 70,066 | 40,161 | 34,109 | 55,841 |
| Change: latest 12 months | -43,987 | -27,365 | -8,020 | -26,183 | +3,419 | +3,419 | -16,622 |
| Percentage change | -13% | -11% | -9% | -27% | +9% | +11% | -23% |
Table notes
Source: Home Office, Immigration Statistics April to June 2015, Extensions table ex 01 q.
(1) The introduction of the new Family Life (10-year) route in July 2012 means that the total number of Family and Other grants are not fully comparable over time.
1.2 Long-term trends in grants and refusals of extensions of stay
The chart below illustrates longer-term trends in grants and refusals to extend stay by calendar year.
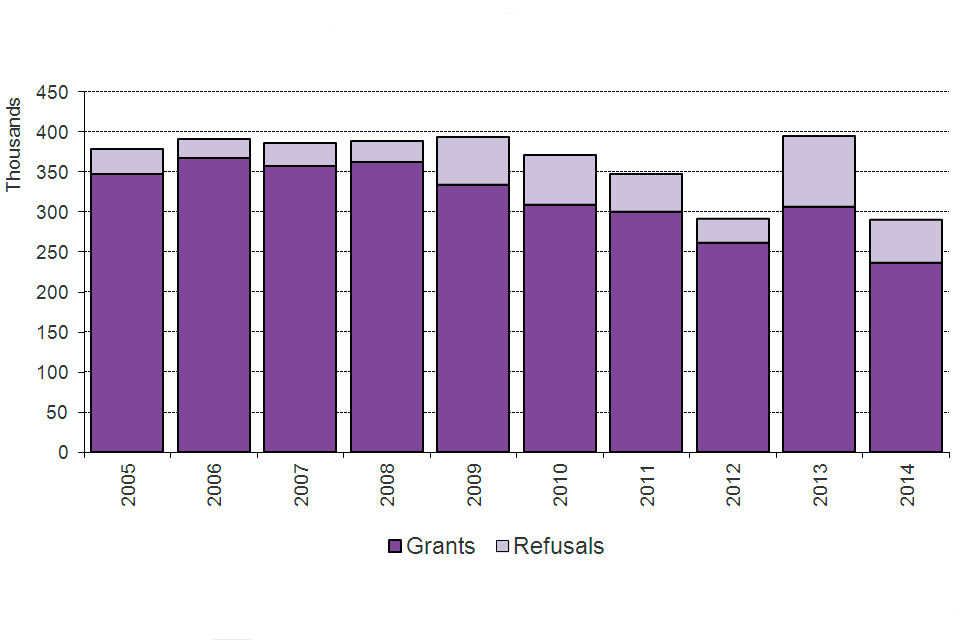
The chart shows grants and refusals of an extension of stay between 2005 and the latest calendar year. The chart is based on data in Table ex 01.
Chart notes
Source: Home Office, Immigration Statistics April to June 2015, Extensions table ex 01.
The high number of decisions in 2013 is likely to partly reflect additional resources applied to decision making in 2013 and higher numbers of applications for study (ahead of the introduction of genuineness assessments and interviews).
2. 2. Grants of extensions for work
There were 84,012 work-related grants of extensions in the year ending June 2015, 9% lower than in the previous 12 months (92,032). Grants in Tier 1 High Value and Tier 2 Skilled Work account for a large majority (74,131) of the 84,012 work-related grants.
Grants of extensions to Tier 1 High Value individuals for work fell by 35% to 13,752 in the year ending June 2015. This reflected falls in grants in 2 categories that had been closed to new entrants: Tier 1 General (from 12,736 to 7,723) and Post-Study work (from 368 to 34). There was also a 43% decrease in grants in the Tier 1 Entrepreneur category (from 6,951 to 3,971) reflecting tightening of eligibility for individuals seeking to switch to Tier 1 Entrepreneur. For further information see Statement of changes in Immigration Rules.
There was little change in grants of extensions for Tier 2 Skilled Workers with 60,379 grants in the year ending June 2015.
2.1 Grants of extensions: Tiers 1 and 2
| Category | Year ending June 2014 | Year ending June 2015 | Change | Percentage change |
|---|---|---|---|---|
| Total Tier 1 & pre-PBS equivalent | 21,267 | 13,752 | -7,515 | -35% |
| of which: | ||||
| Tier 1 - Entrepreneurs | 6,951 | 3,971 | -2,980 | -43% |
| Tier 1 - General | 12,736 | 7,723 | -5,013 | -39% |
| Tier 1 - Post-Study | 368 | 34 | -334 | -91% |
| Total Tier 2 & pre-PBS equivalent | 60,622 | 60,379 | -243 | 0% |
| of which: | ||||
| Tier 2 - General | 42,267 | 42,052 | -215 | -1% |
| Tier 2 - Intra-Company Transfers | 17,001 | 17,212 | +211 | +1% |
Table notes
Source: Home Office, Immigration Statistics April to June 2015, Extensions table ex 01 q.
3. 3. Grants of extensions for study
Study-related grants of extensions fell by over a quarter (-27% or -26,183) to 70,066 in the year ending June 2015. Similarly, decisions on study-related extensions fell 22% to 84,377.
The number of sponsored applications for study-related extensions (main applicants) fell 28% from 87,539 to 63,314, largely due to fewer applications for universities and for the further education sectors. For further details see the Study topic.
4. 4. Grants of extensions for family reasons
Family-related grants of extensions increased by 9% to 40,161 in the year ending June 2015. There was an increase in grants to partners, from 17,733 to 21,135. This increase is likely to reflect a change in the probationary period before an individual can apply to stay in the UK permanently (settlement) and a requirement for individuals to renew their temporary leave after two and a half years under the new family Immigration Rules implemented from 9 July 2012. (For further details see the family section of the user guide.) Those granted an extension will therefore include those granted an initial period of limited leave to remain in the UK as a partner on the family route as well as those granted a subsequent period of limited leave to remain.
Grants in the Family Life (10-year) category rose slightly from 18,931 to 18,951.
5. 5. Grants of extensions for other reasons
Grants of extensions in other categories increased by 11% (+3,419) to 34,109 in the year ending June 2015. Further analysis shows a significant part of the increase was accounted for by grants of discretionary leave outside the rules on compassionate grounds, which increased by 2,370 to 12,206.
6. 6. Refusals of extensions by category
There were 55,841 refusals of applications for extensions in the year ending June 2015, a decrease compared with 72,463 in the year ending June 2014. The decrease is accounted for by falls in the Other category (-15,580 to 16,664), work-related (-1,953 to 8,126) and family-related (-1,182 to 16,740) refusals. The level of refusals in the Other category was relatively high in the year ending June 2014 (32,244). This may partly reflect additional resource deployed to decision making in the second half of 2013.
Refusals of study-related extensions increased by 17% (+2,093 to 14,311) in the year ending June 2015.
7. 7. Nationalities granted an extension
(excludes dependants)
Of the total 179,033 extensions of stay in 2014, 31% (55,886) were granted to nationals of South Asia and 22% (39,610) were granted to East Asia.
7.1 Top 5 nationalities granted an extension to stay, 2014
(Total number of grants 179,033, excludes dependants)
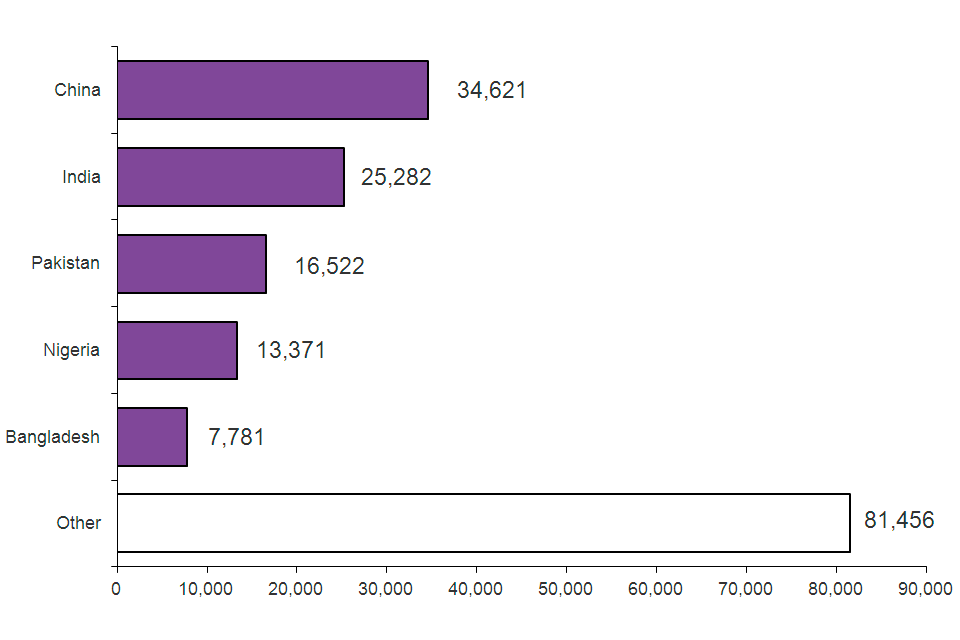
The chart shows grants of extension of stay by nationality in 2014. The chart is based on data in Table ex 02.
Chart notes
Source: Home Office, Immigration Statistics April to June 2015, Extensions table ex 02.
The top 5 nationalities accounted for over half (55%) of total grants in 2014.
8. 8. Data tables
Further data on extensions are available in Extensions tables ex 01 to expc 01 o.
A short statistical article on ‘Extensions of stay by previous category’ was published alongside the Immigration Statistics April to June 2013 release to provide further detailed information. Updates of the more detailed tables provided in the article are included in the <hyperlink Extensions tables.
More detailed analysis on family extensions and additional tables for years ending June were included in the ‘Immigration Statistics July to September 2014’ release to assist users in understanding the trends in family data before and after the changes to the Immigration Rules in July 2012. Updates of the additional tables and analysis are included in the Family tables and Family topic.