Annual epidemiological spotlight on HIV in the South East: 2023 data
Updated 20 October 2026
Applies to England

© Crown copyright 2026
This publication is licensed under the terms of the Open Government Licence v3.0 except where otherwise stated. To view this licence, visit nationalarchives.gov.uk/doc/open-government-licence/version/3 or write to the Information Policy Team, The National Archives, Kew, London TW9 4DU, or email: psi@nationalarchives.gov.uk.
Where we have identified any third party copyright information you will need to obtain permission from the copyright holders concerned.
This publication is available at https://www.gov.uk/government/publications/hiv-south-east-annual-data-spotlight/annual-epidemiological-spotlight-on-hiv-in-the-south-east-2023-data
Summary
HIV remains an important public health problem in the South East. In 2023, 12,350 people were living with diagnosed HIV in the South East. There were 880 new HIV diagnoses in South East residents in 2023, representing 15% of all new diagnoses in England. In the South East, 22% of new diagnoses were in gay, bisexual and other men who have sex with men (GBMSM), and 61% of new diagnoses were in Black Africans. Between 2021 and 2023, 47% of diagnoses were defined as late. In 2023, 99% of those living with diagnosed HIV in England and outside of London were on antiretroviral therapy (ART), and 98% of those on ART were virally suppressed.
New diagnoses
In 2023, 880 South East residents were newly diagnosed with HIV, accounting for 15% of new diagnoses in England. This represents a rise of 66% from 2022. Nationally, there has been a long-term trend for a decline in the overall number of new diagnoses, although there was a substantial upturn since 2021.
The new diagnosis rate for South East residents (10 per 100,000) was the same as for England overall in 2023 (10 per 100,000).
In 2023, 22% of all new diagnoses in South East residents were in GBMSM (compared to 32% in 2022 and 51% in 2014). The number of GBMSM residents in the South East newly diagnosed with HIV (193, adjusted for missing information) was 33% lower than in 2014. Of the GBMSM newly diagnosed with HIV 52% were White and 40% were UK-born.
Heterosexual contact was the most common infection route for new diagnoses in South East residents in 2023 (72%). Infections in Africa-born persons accounted for 85% of all heterosexually acquired cases in 2023 (n=489, of which 362 were previously diagnosed abroad), compared to 46% (n=103, of which 13 were previously diagnosed abroad) in 2014. Infections in UK-born persons accounted for 8% of all heterosexually acquired cases in 2023.
Injecting drug use accounted for 2% of new diagnoses in South East residents.
Black Africans represented 60% of all newly diagnosed South East residents in 2023 (compared to 38% in 2022 and 21% in 2014). A small proportion of new diagnoses in 2023 were in Black Caribbeans (1%).
The number of new diagnoses was highest in the 25 to 34 year age group in males and the 35 to 44 year age group in females in 2023.
Late diagnoses
Reducing late HIV diagnoses is one of the indicators in the Public Health Outcomes Framework and HIV Action Plan Monitoring and Evaluation Framework1. People who are diagnosed late have a tenfold increased risk of mortality within one year of diagnosis compared to those diagnosed promptly and they have increased healthcare costs.
It is of particular concern that a large proportion of South East residents with HIV are diagnosed late (47% from 2021 to 2023, compared to 43% in England), as defined by a CD4 count of less than 350 cells/mm at diagnosis.
In the South East, heterosexuals were more likely to be diagnosed late (57% of males, 50% of females) than GBMSM (39%). The proportion of individuals diagnosed late was similar in different ethnic groups (Black African 47% and White 46%).
People living with diagnosed HIV
The number of people living with diagnosed HIV in the South East in 2023 (12,350) was 5% higher than in 2022 and 33% higher than in 2014. This increase is partly due to the effectiveness of HIV treatment, which has reduced the number of deaths from HIV.
The diagnosed prevalence rate of HIV in the South East in 2023 was 2 per 1,000 residents aged 15 to 59 years. This was the same as that observed in England as a whole (small differences may be hidden by rounding). Six local authorities in the South East had a diagnosed HIV prevalence in excess of 2 per 1,000 population aged 15 to 59 in 2023, which is the threshold for expanded HIV testing. They were Brighton and Hove (6.9), Medway (2.1), Portsmouth (2.7), Reading (2.8), Slough (3.2) and Southampton (3.1).
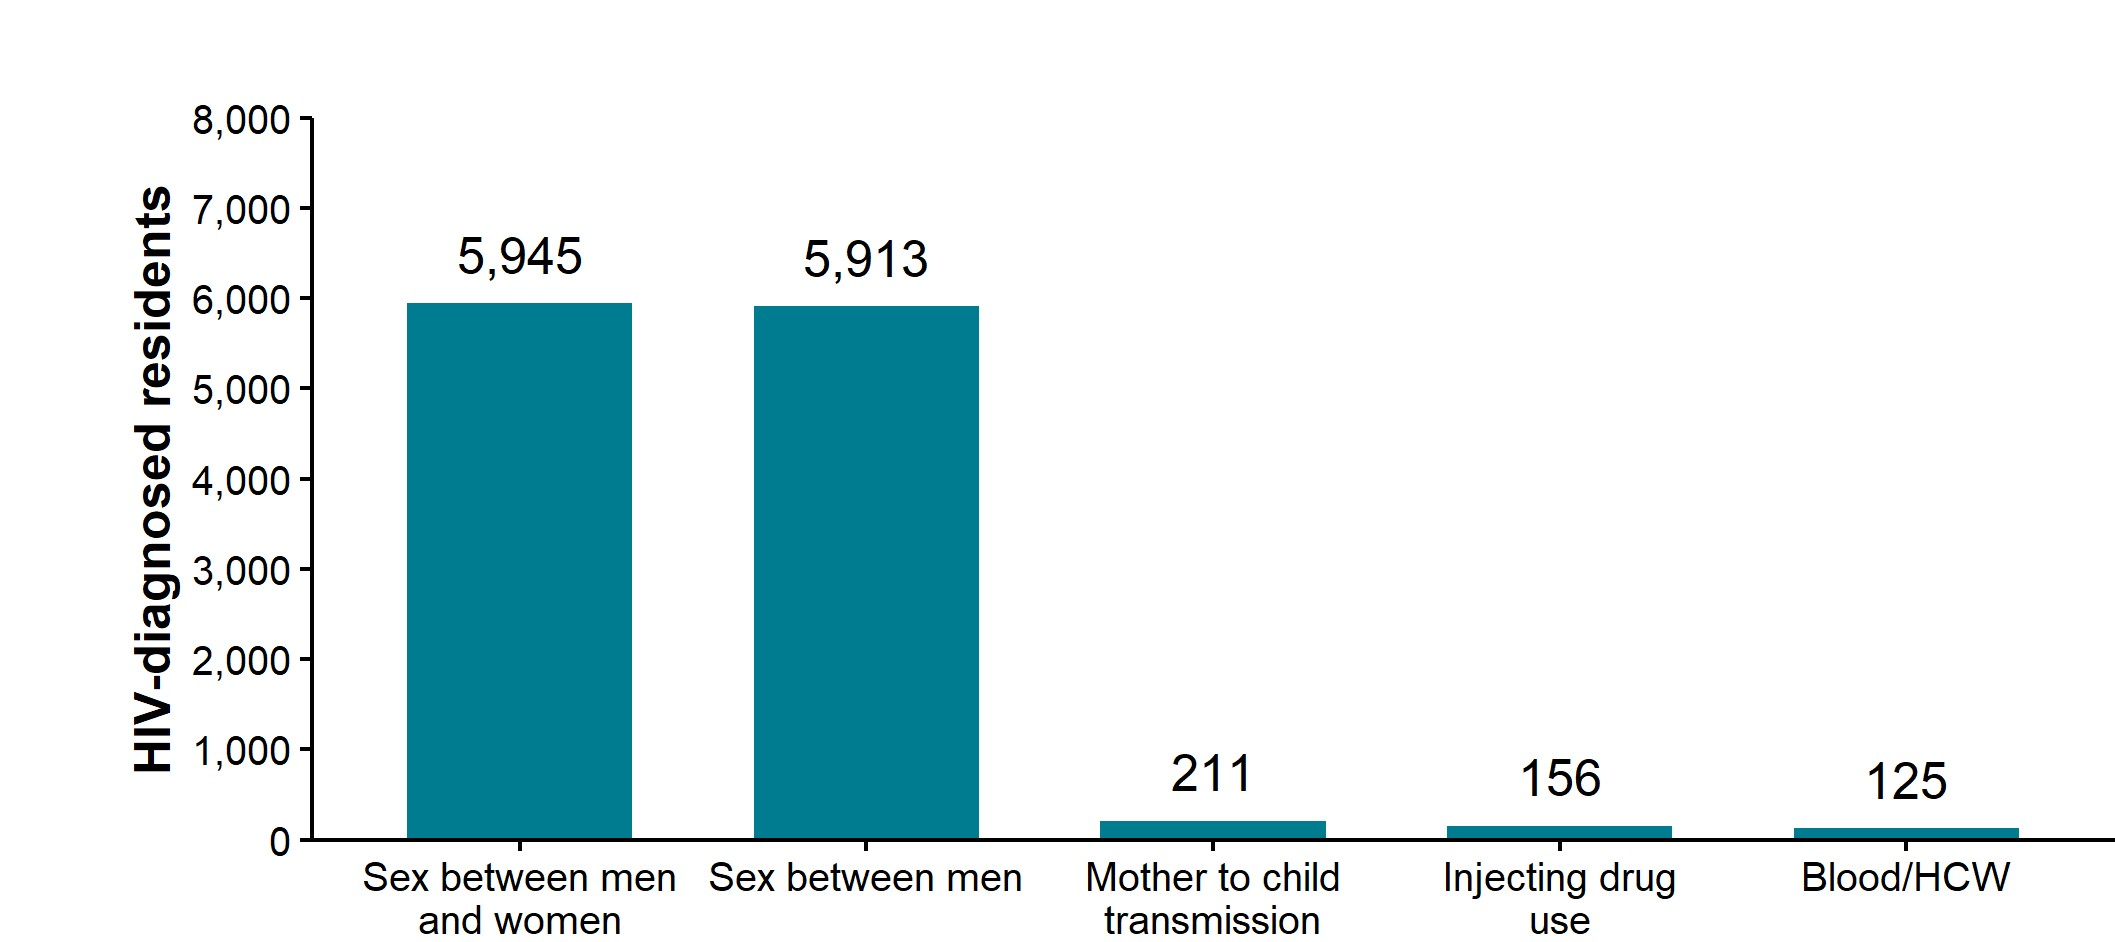
The 2 most common probable routes of acquisition for South East residents living with diagnosed HIV in 2023 were sex between men and women (48%) and sex between men (also 48%).
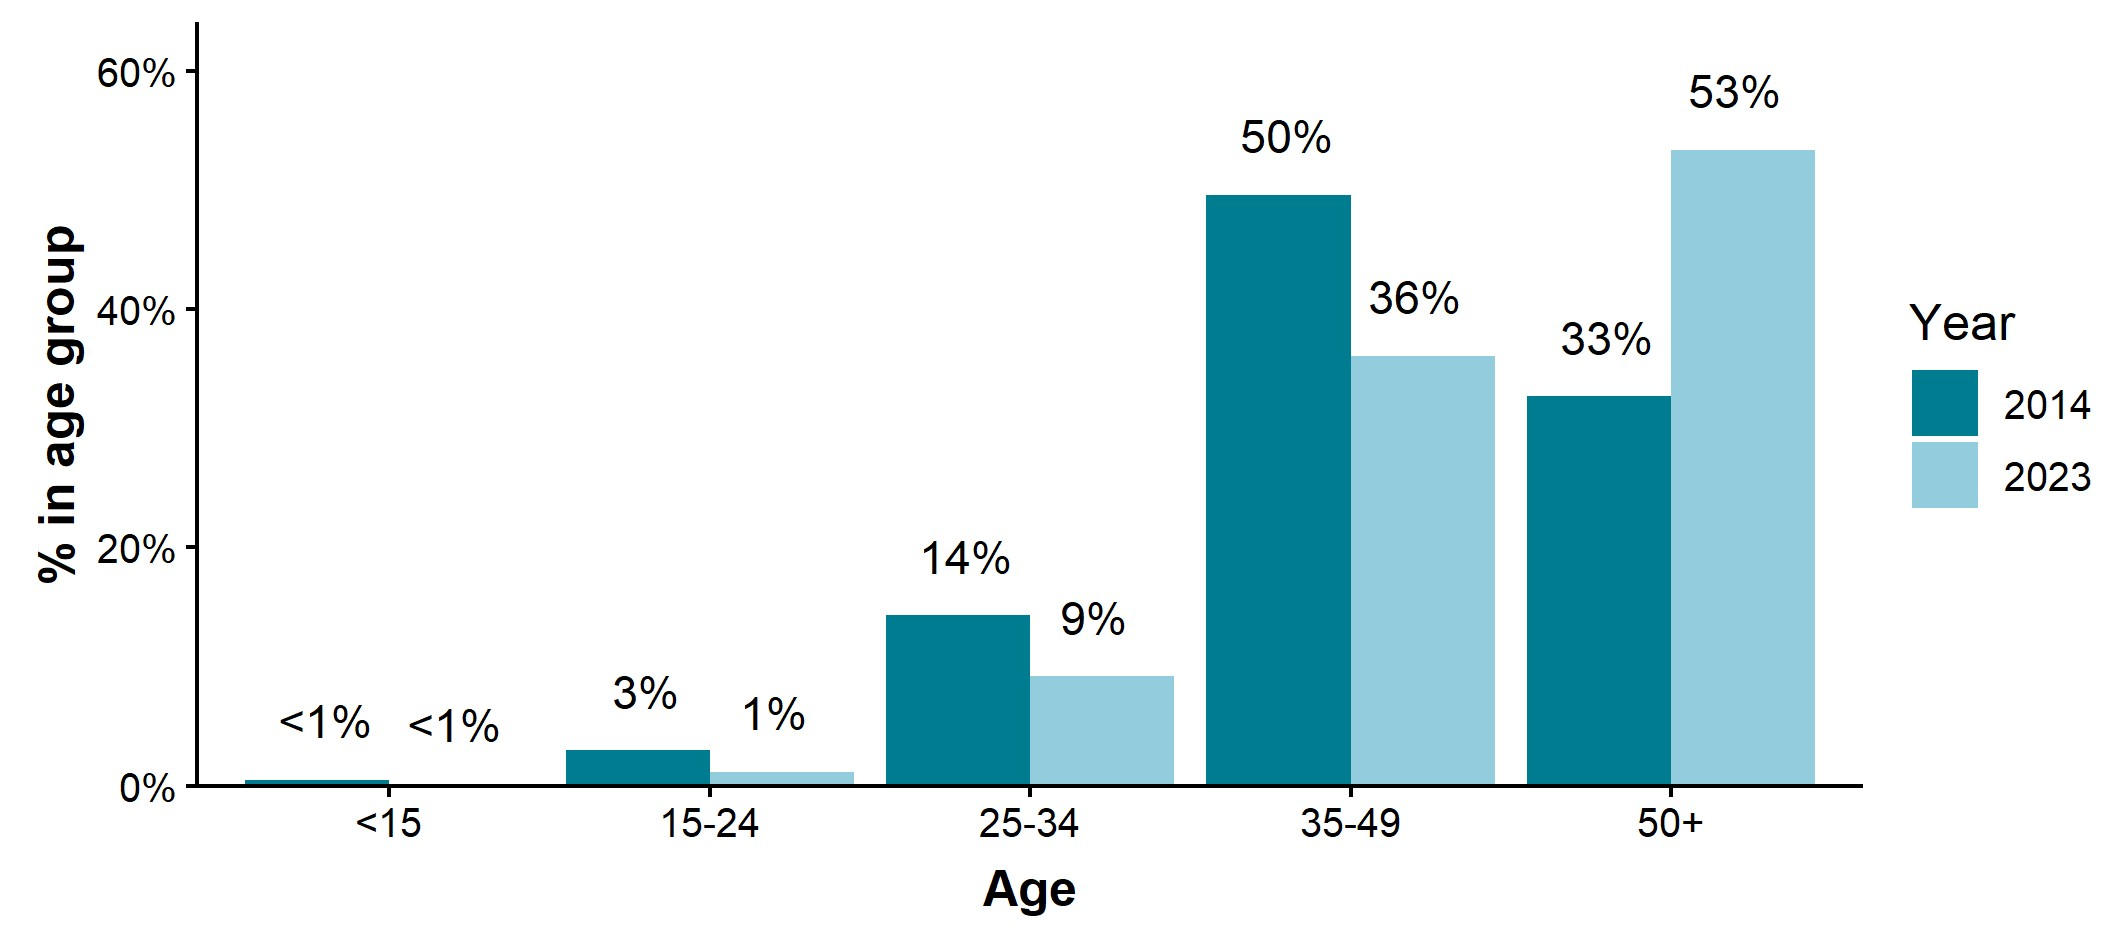
In 2023, 36% of those living with diagnosed HIV in the South East were aged between 35 and 49 years, and 53% were aged 50 years and over (up from 33% in 2014). Males represented 68% of South East residents living with diagnosed HIV in 2023 and females represented 32%.
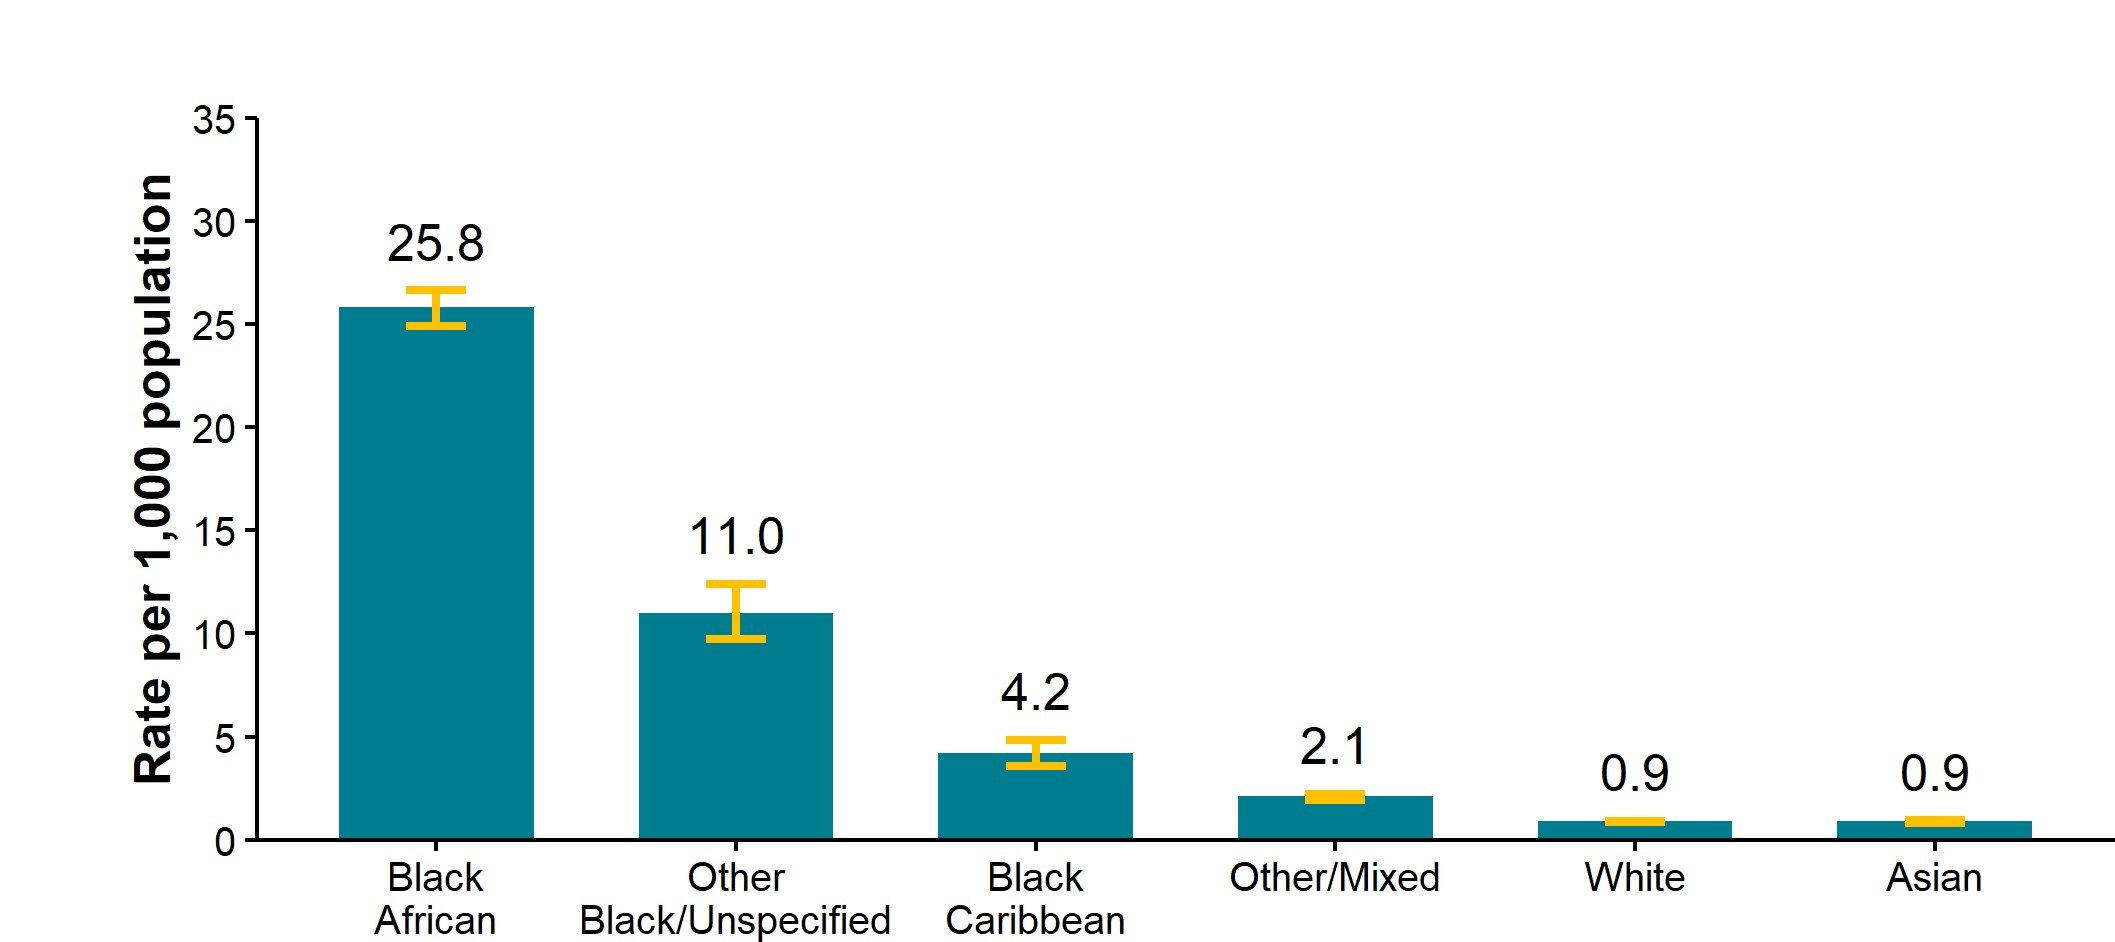
In 2023, 58% of South East residents living with diagnosed HIV were White and 27% were Black Africans. However, due to the relative sizes of the White and Black African populations the rate per 1,000 population aged 15 to 59 years was much higher in Black Africans (26 per 1,000) than in the White population (1 per 1,000).
Continuum of HIV care
In England excluding London, 99% of HIV diagnosed residents were receiving anti-retroviral treatment in 2023. Of these, 98% were virally suppressed (viral load <200 copies/ml) and were very unlikely to pass on HIV, even if having sex without condoms (untransmissible virus). This compares to 98% in England as a whole receiving ART and 98% of these virally suppressed.
For South East residents, the proportion starting treatment within 91 days of diagnosis for the period 2021 to 2023 was 87%. This compares to 84% for England.
People living with undiagnosed HIV
In 2023, it is estimated that 5% (Credible Interval (CrI) 4 to 7%) of people living with HIV in England, excluding London were undiagnosed. This equates to an estimated 3,407 (CrI 2,627 to 4,787) undiagnosed people.
It is estimated that 1,100 GBMSM in England, outside London, are undiagnosed (CrI 600 to 2,100) and 2,200 heterosexuals (CrI 1,700 to 3,200), including 1,200 Black Africans. In England, outside London, the proportion undiagnosed varied by exposure group with the highest proportion undiagnosed among people living with HIV who inject drugs (9%, CrI 2 to 20%), non-Black African heterosexual women (7%, 5 to 11%), and non-Black African heterosexual men (7%, 5 to 11%).
HIV testing
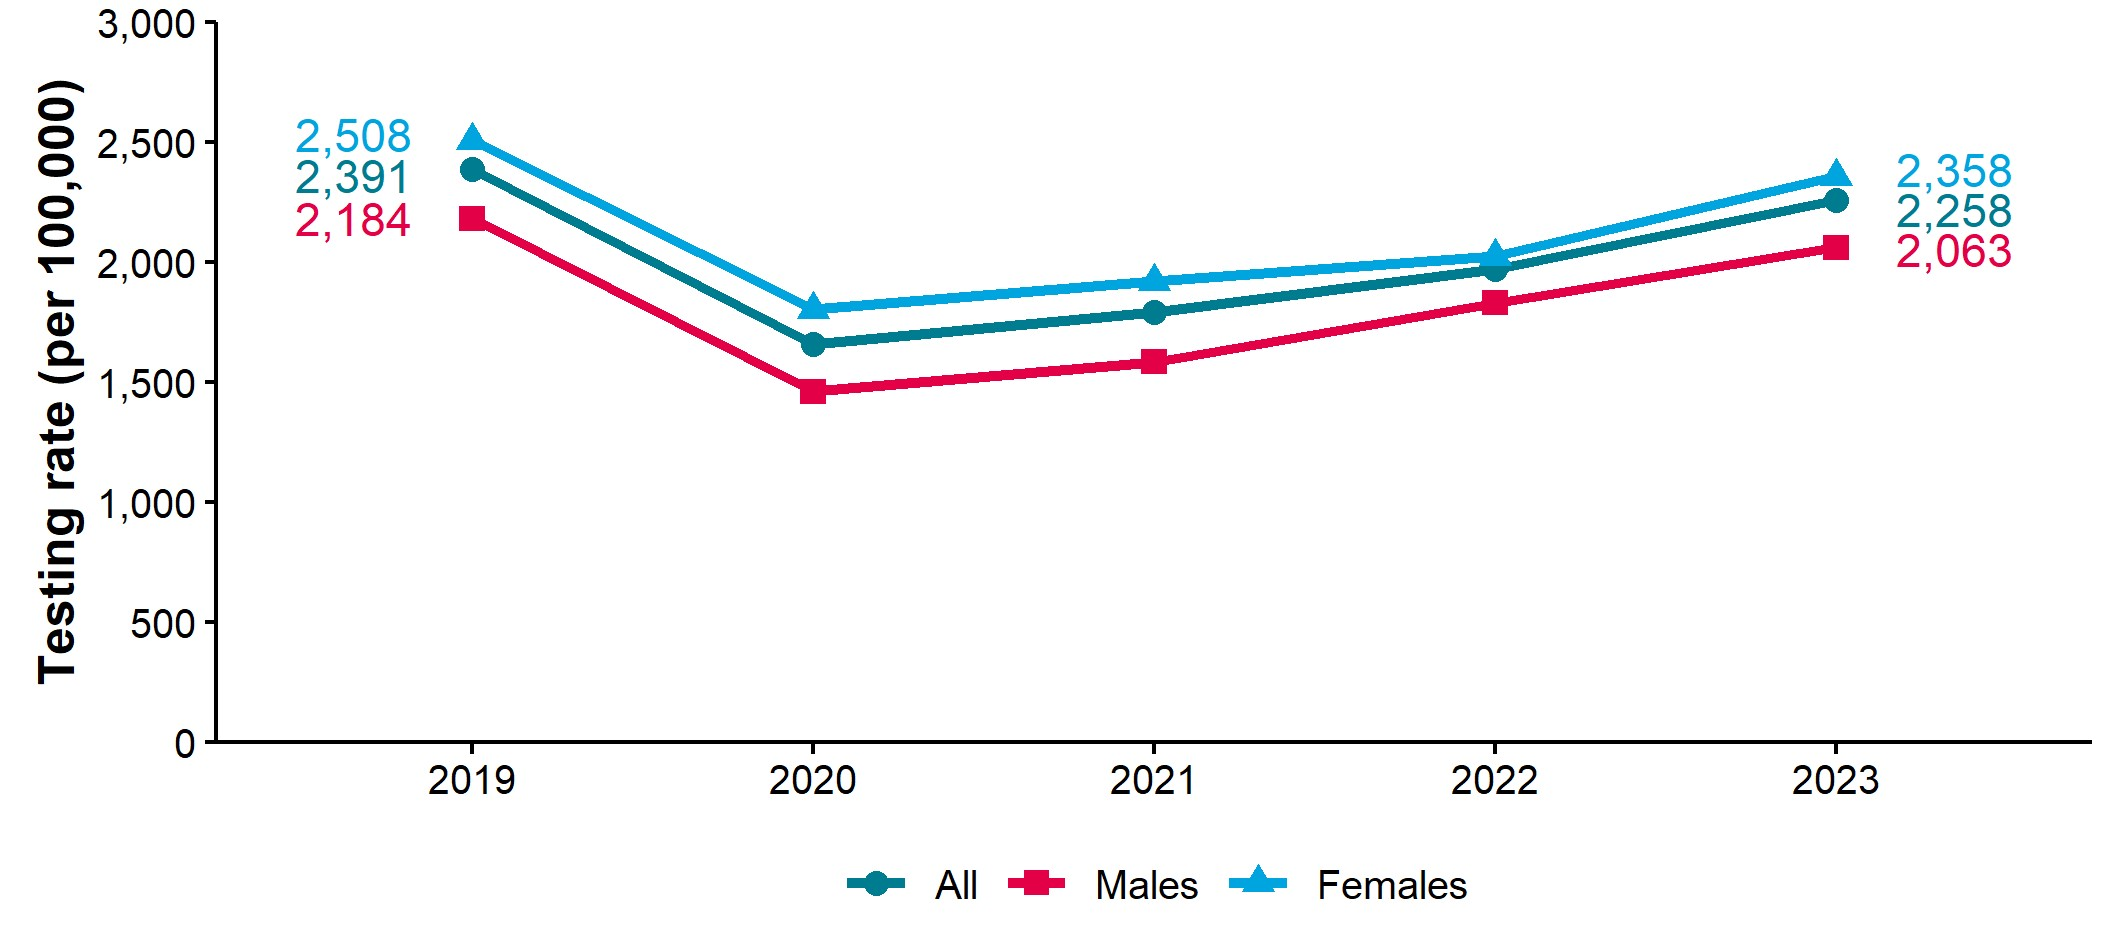
A total of 97,775 people were tested for HIV in specialist sexual health services (SHSs) in the South East in 2023, a decrease of 30% since 2019 and an increase of 11% since 2022. The HIV testing rate (per 100,000 population) at all SHSs in the South East was 2,258, which compares to 2,771 across England. HIV testing rates in all SHSs (specialist and non-specialist services) in the South East are lower in men (2,063) than in women (2,358).
Pre-exposure prophylaxis (PrEP)
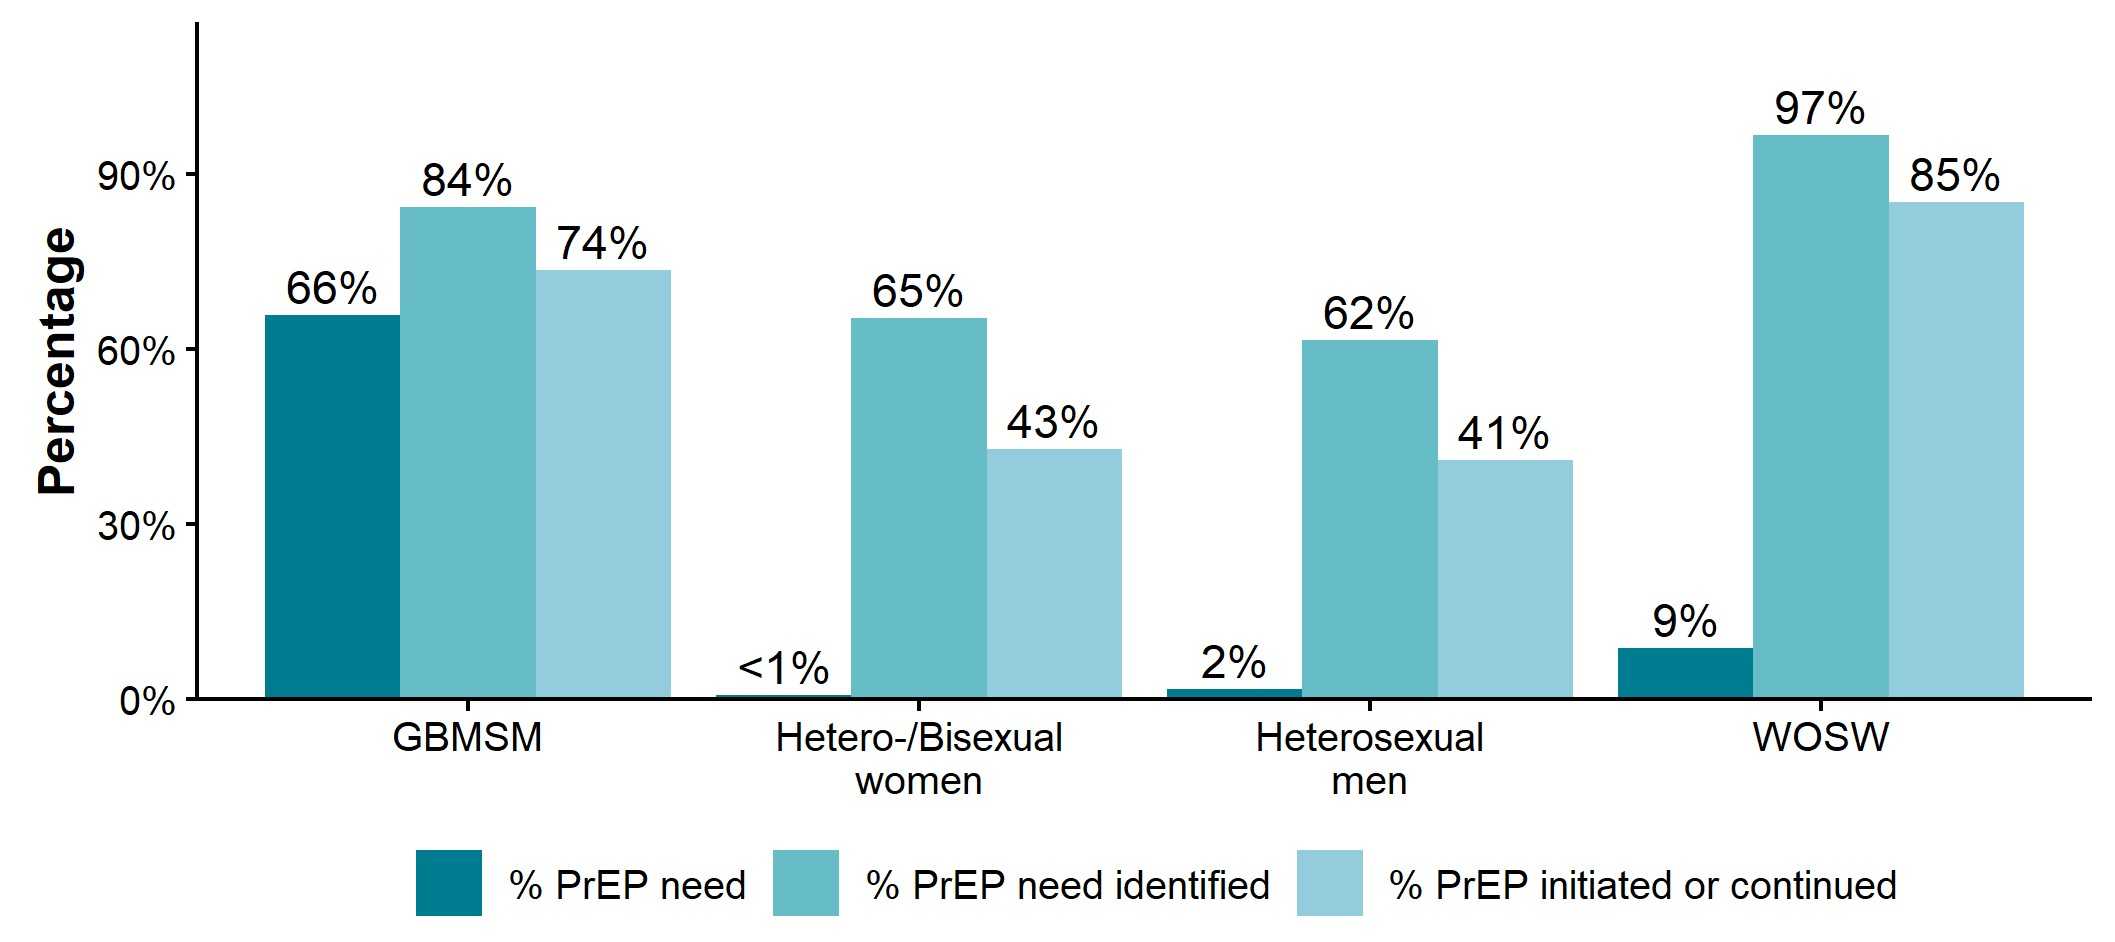
In 2023, 8% of HIV-negative South East residents accessing SHSs in England were defined as having a PrEP need, among whom 71% initiated or continued PrEP. Of those with PrEP need, 83% had this need identified at a clinical consultation. Among GBMSM, the group with greatest need, these proportions were: 66%, 74% and 84%. Consistent use of PrEP can be an efficacious and effective intervention to prevent HIV acquisition. Despite PrEP being routinely available through specialist SHS, awareness, accessibility and uptake of primary prevention initiatives is variable for different population groups. Addressing this disparity is key to HIV prevention.
HIV in England
The 2021 HIV Action Plan for England1 sets an ambition to reduce HIV transmission by 80% between 2019 and 2025. The HIV Action Plan monitoring and evaluation framework report published in November 2024 further summarises progress made towards the ambitions of the HIV Action Plan2. Although considerable progress has been made, it is unlikely that the 2025 interim ambitions will be met.
The number of people first diagnosed with HIV in England has risen by 15% in 2023 and there is further evidence of widening inequalities3. Most of the increase in HIV diagnoses between 2022 and 2023 in England was among adults exposed through sex between men and women living outside London (increase of 51% among men exposed through sex with women and 44% among women exposed through sex with men). For both GBMSM and heterosexual adults, the 2023 rise has disproportionately affected ethnic minority groups. Further provision of services that are culturally competent and accessible to diverse key populations is needed.
Overall testing rates have increased substantially since 2022 in England but have not fully recovered to those observed in 2019 for some demographic groups (3). The increasing levels of testing and fall in positivity over the past 5 years may be suggestive of an overall fall in HIV transmission in GBMSM, but not a continued reduction. The rise in HIV testing together with a higher and sustained positivity in Black African heterosexuals may be suggestive of ongoing transmission. However, this number is likely affected by changing patterns of migration with a recent rise in people diagnosed with HIV abroad arriving in England.
In England in 2023, for the first time, over half of all HIV diagnoses were among those previously diagnosed abroad (3). Most of those previously diagnosed with HIV abroad have evidence of existing treatment in the form of viral suppression within a month of their England presentation and are rapidly linked to care following presentation in England, ensuring good clinical outcomes and prevention of onward transmission. Services need resilience to ensure appropriate and accessible capacity for recently-arrived populations.
Migration patterns for the UK support this observed shift in the HIV burden in England. However, although immigration into the UK increased sharply following the COVID-19 pandemic, provisional estimates for July 2022 to June 2023 show a slowing of immigration during this period (4). Most people arriving in the UK for the period July 2022 to June 2023 were non-EU nationals, mainly migrants coming for work, largely using health and care visas (4).
The implementation of an NHS England funded programme of emergency departments (ED) opt-out testing for bloodborne viruses in April 2022 has contributed to the increase in HIV diagnoses in 20232. The increase in HIV diagnoses seen in 2023 is only partially due to the increase in testing effort including ED opt-out testing. This is particularly apparent outside of London, where there was a 21% increase in diagnoses after adjustment for ED opt-out testing (2).
Access to PrEP has been increasing on an annual basis since 2020. However, inequalities in access remain with unmet needs in specific exposure groups.
The rising number of late diagnoses, particularly among Black African populations demonstrates an urgent need to improve access to testing and the full implementation of HIV testing guidelines.
For those diagnosed and linked to services, HIV care remains excellent with 98% of people with diagnosed HIV being treated and 98% of people on treatment virally suppressed (3). People seen for HIV care are ageing, with over half aged 50 years and over in 2023 compared to a quarter 10 years ago. This highlights the need for joined up health and social care services to meet the needs of this ageing population.
HIV prevention messages
Using condoms consistently and correctly protects against HIV and other STIs such as chlamydia, gonorrhoea and syphilis. They can also be used to prevent unplanned pregnancy.
HIV testing is central to HIV prevention since it provides access to PrEP and health advice for those testing HIV negative, while a positive result leads to essential HIV treatment and care, preventing onward transmission. Everyone having condomless sex with new or casual partners should have an STI screen, including an HIV test, on at least an annual basis. GBMSM should have tests for HIV and STIs annually, or every 3 months if having condomless sex with new or casual partners.
HIV pre-exposure prophylaxis (PrEP) is available for free from specialist SHS and can be used to reduce an individual’s risk of acquiring HIV. Consistent use of PrEP can be an efficacious and effective intervention to prevent HIV acquisition. Despite PrEP being routinely available through specialist SHS, awareness, accessibility and uptake of primary prevention initiatives is variable for different population groups (3).
HIV post-exposure prophylaxis (PEP) can be used to reduce the risk of acquiring HIV following some sexual exposures. PEP is available for free from specialist SHS and most emergency departments.
Symptoms due to HIV and AIDS may not appear for many years, and people who are unaware of living with HIV may not feel themselves to be a risk to others. Prevention messages should reinforce that anyone can acquire HIV regardless of age, gender, ethnicity, sexuality or religion, and it is important to challenge assumptions about who is at risk of acquiring HIV.
People living with diagnosed HIV infection who are on treatment and have an undetectable viral load are unable to pass on the virus to others during sex, even without PrEP or condoms. This is known as Undetectable = Untransmittable or U=U.
Stigma, anxiety and depression experienced by people with HIV affect their ability to seek healthcare, engage in treatment and remain in care5. Reducing stigma in healthcare services will encourage people from seeking the healthcare services they need.
Specialist SHS are free and confidential. They offer testing and treatment for HIV and STIs, condoms, vaccination, HIV PrEP and PEP. Clinic-based services are commissioned by local authorities for residents of all areas in England and online self-sampling for HIV and STIs is widely available. Information and advice about sexual health including how to access services is available at NHS.UK and from the national sexual health helpline on 0300 123 7123.
Local and regional prevention strategies
HIV prevention strategies at a local and regional level should consider inclusion of the following areas from the national HIV Action plan monitoring and evaluation framework (2):
- implementation and monitoring of the British HIV Association (BHIVA), British Association for Sexual Health and HIV (BASHH) and British Infection Association (BIA) Adult HIV testing guidelines 2020, including opt-out in sexual health services, subject to agreed support mechanisms for implementation
- continuation of ED opt-out testing in very high and high prevalence HIV areas
- scaling up community testing focusing on those groups that are more likely to benefit from HIV testing in these settings such as ethnic minority populations
- understanding reasons behind the decline of HIV testing in women
- scaling up of partner notification activities
- understanding the drivers of late diagnosis in order to better focus interventions
- reducing inequalities in access to and uptake of PrEP through implementation of the PrEP roadmap
Charts, tables and maps
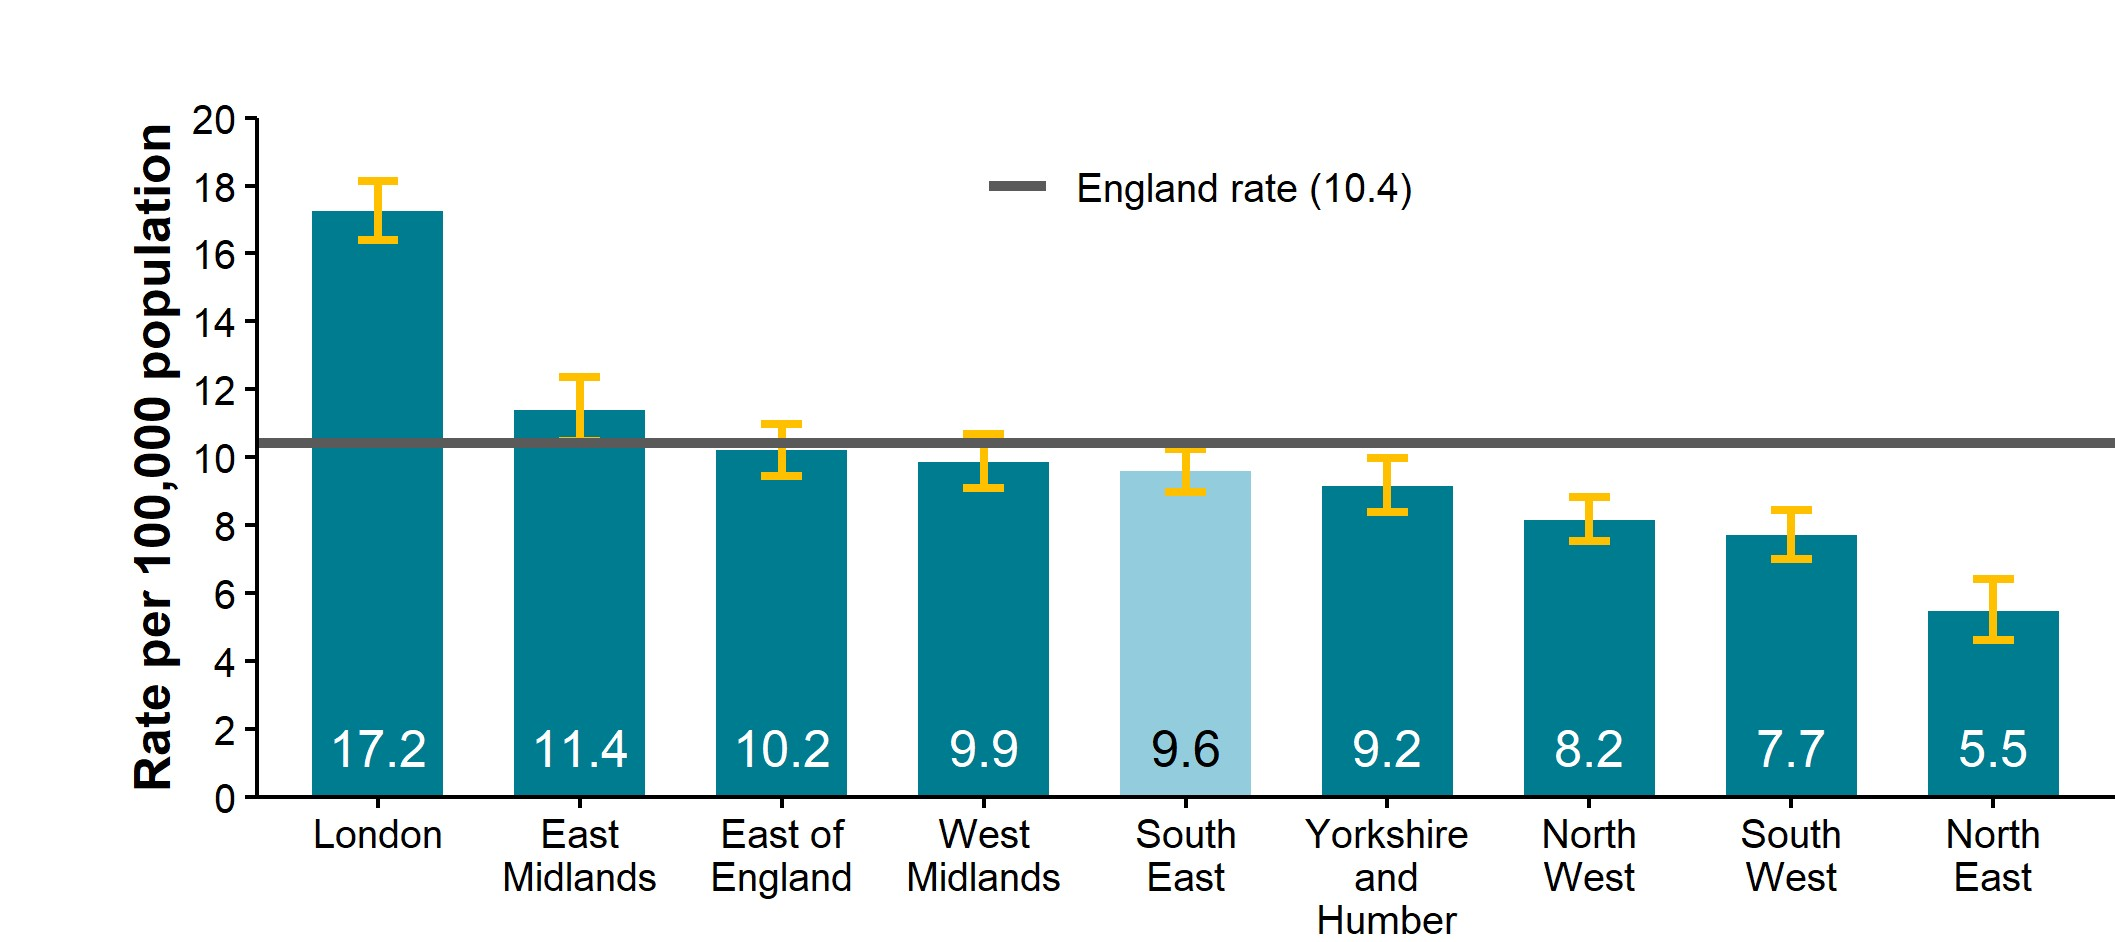
Figure 1. Rate of new HIV diagnoses per 100,000 population (all ages) by UKHSA region of residence, 2023
Sources: UKHSA, HIV and AIDS New Diagnoses and Deaths (HANDD).
The number of new diagnoses will depend on accessibility of testing as well as infection and transmission.
Figure 1 is a column chart showing the rate of new HIV diagnoses per 100,000 population by region of residence for the year 2023. The overall England rate (10.4) is represented as a solid horizontal line.
The chart shows that the rate of new HIV diagnoses in the South East was the fifth highest of the 9 regions, and below the average for England as a whole.
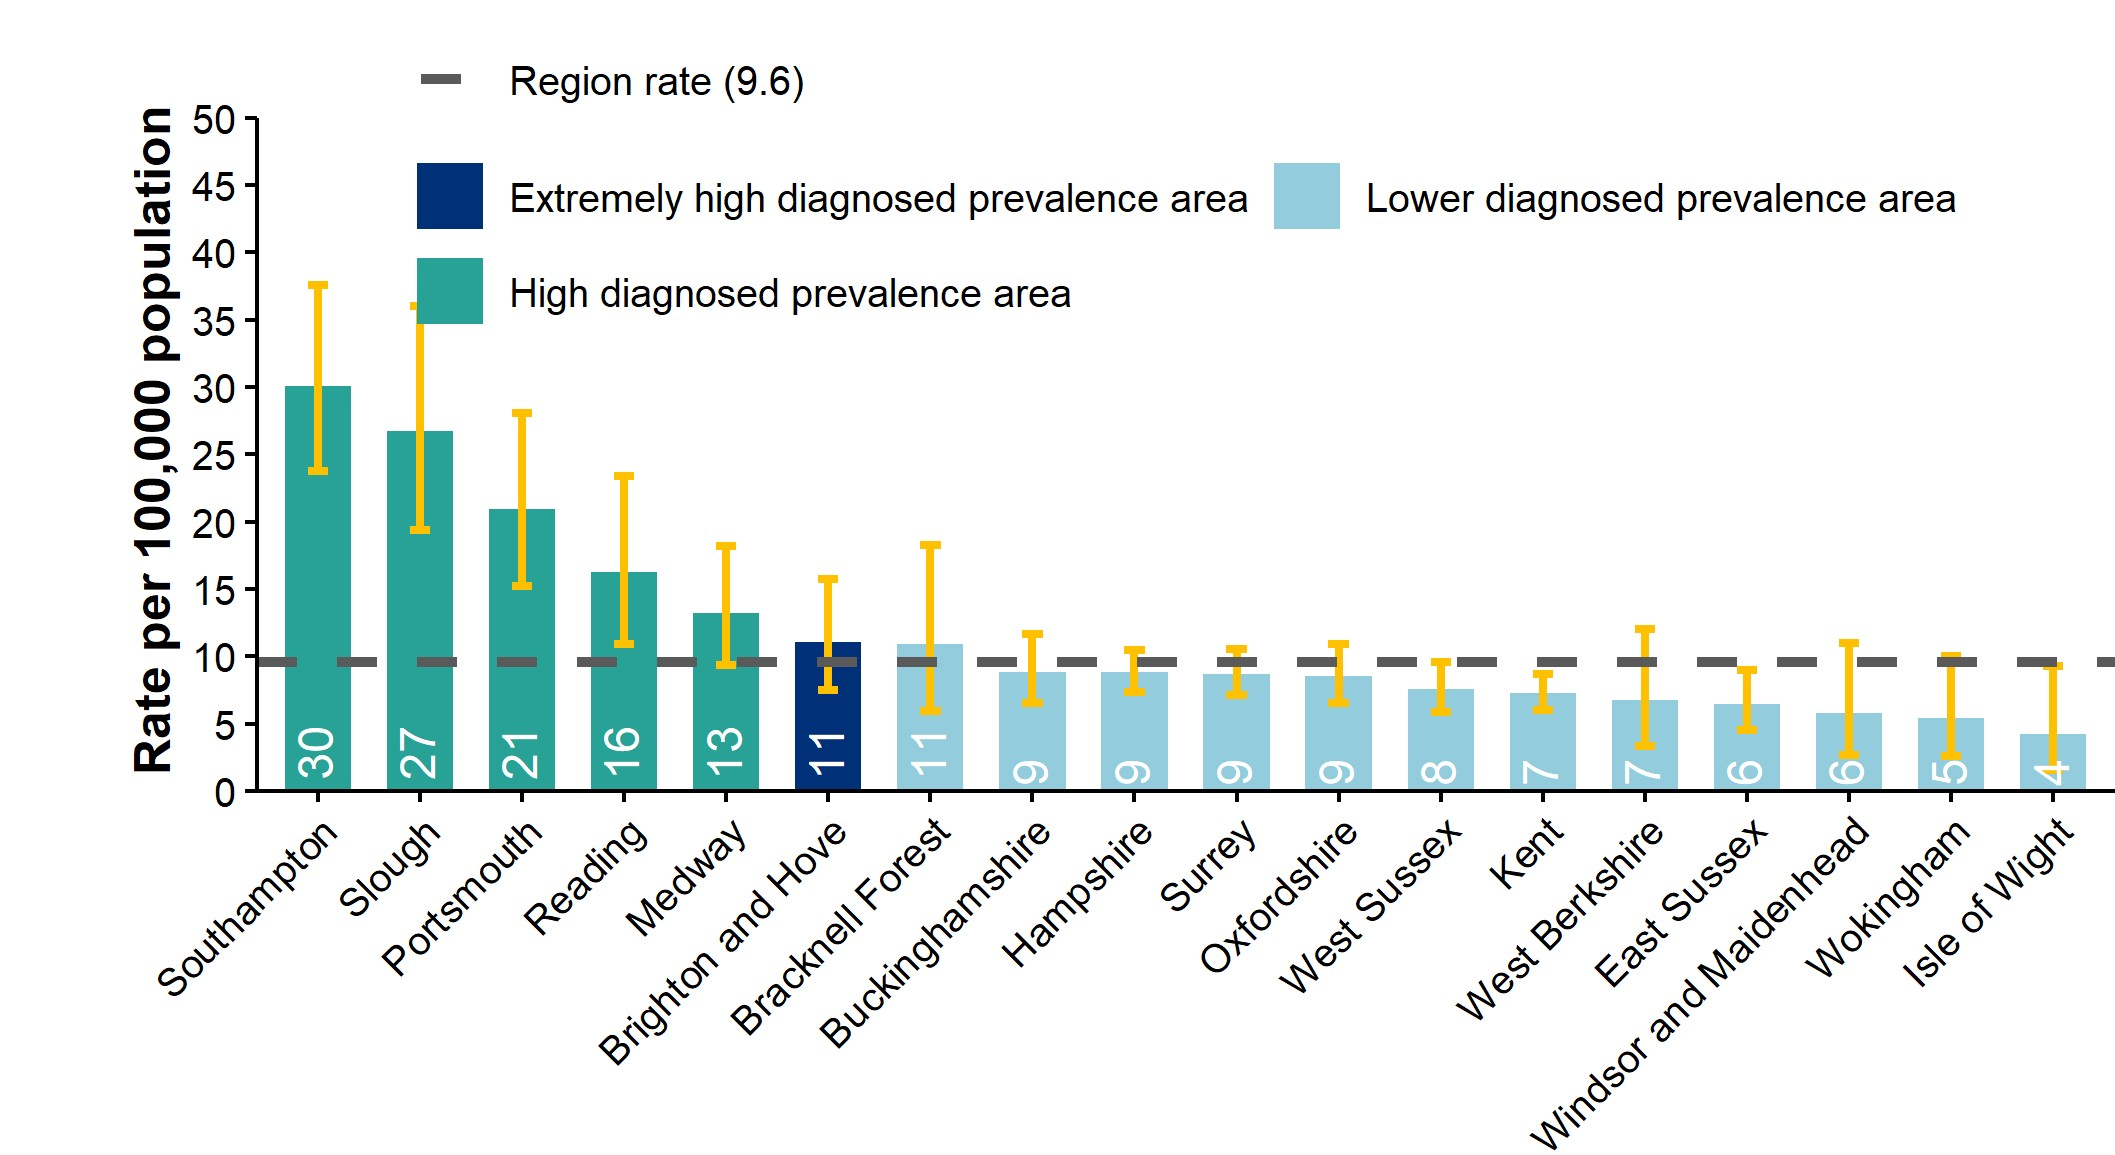
Figure 2. Rate of new HIV diagnoses per 100,000 population (all ages) by upper tier local authority of residence, South East residents, 2023
Sources: UKHSA, HIV and AIDS New Diagnoses and Deaths (HANDD).
The number of new diagnoses will depend on accessibility of testing as well as infection and transmission. HIV diagnosed prevalence (rate per 1,000 aged 15 to 59 years as per NICE testing guidelines). Lower diagnosed prevalence less than 2, high diagnosed prevalence 2 to 5, Extremely high diagnosed prevalence more than 5. Note: the colour coding does not relate to new diagnosis but to the data in the diagnosed prevalence section (see Figures 16 to 24, below).
Figure 2 is a column chart showing rates of new HIV diagnoses per 100,000 population by South East local authority of residence for the year 2023. Local authorities are shown in descending order in relation to their rate of new HIV diagnoses. The overall rate for the South East (9.6) is represented as a dashed horizontal line.
Southampton (30), Slough (27), Portsmouth (21), Reading (16), and Medway (13) were the 5 local authorities with the highest rate of new HIV diagnoses in the South East, and were also classified as high diagnosed prevalence areas. Brighton and Hove (11) was classified as an extremely high diagnosed prevalence area, and was, along with Bracknell Forest (11), one of the 2 other local authorities with higher rates than the South East regional rate.
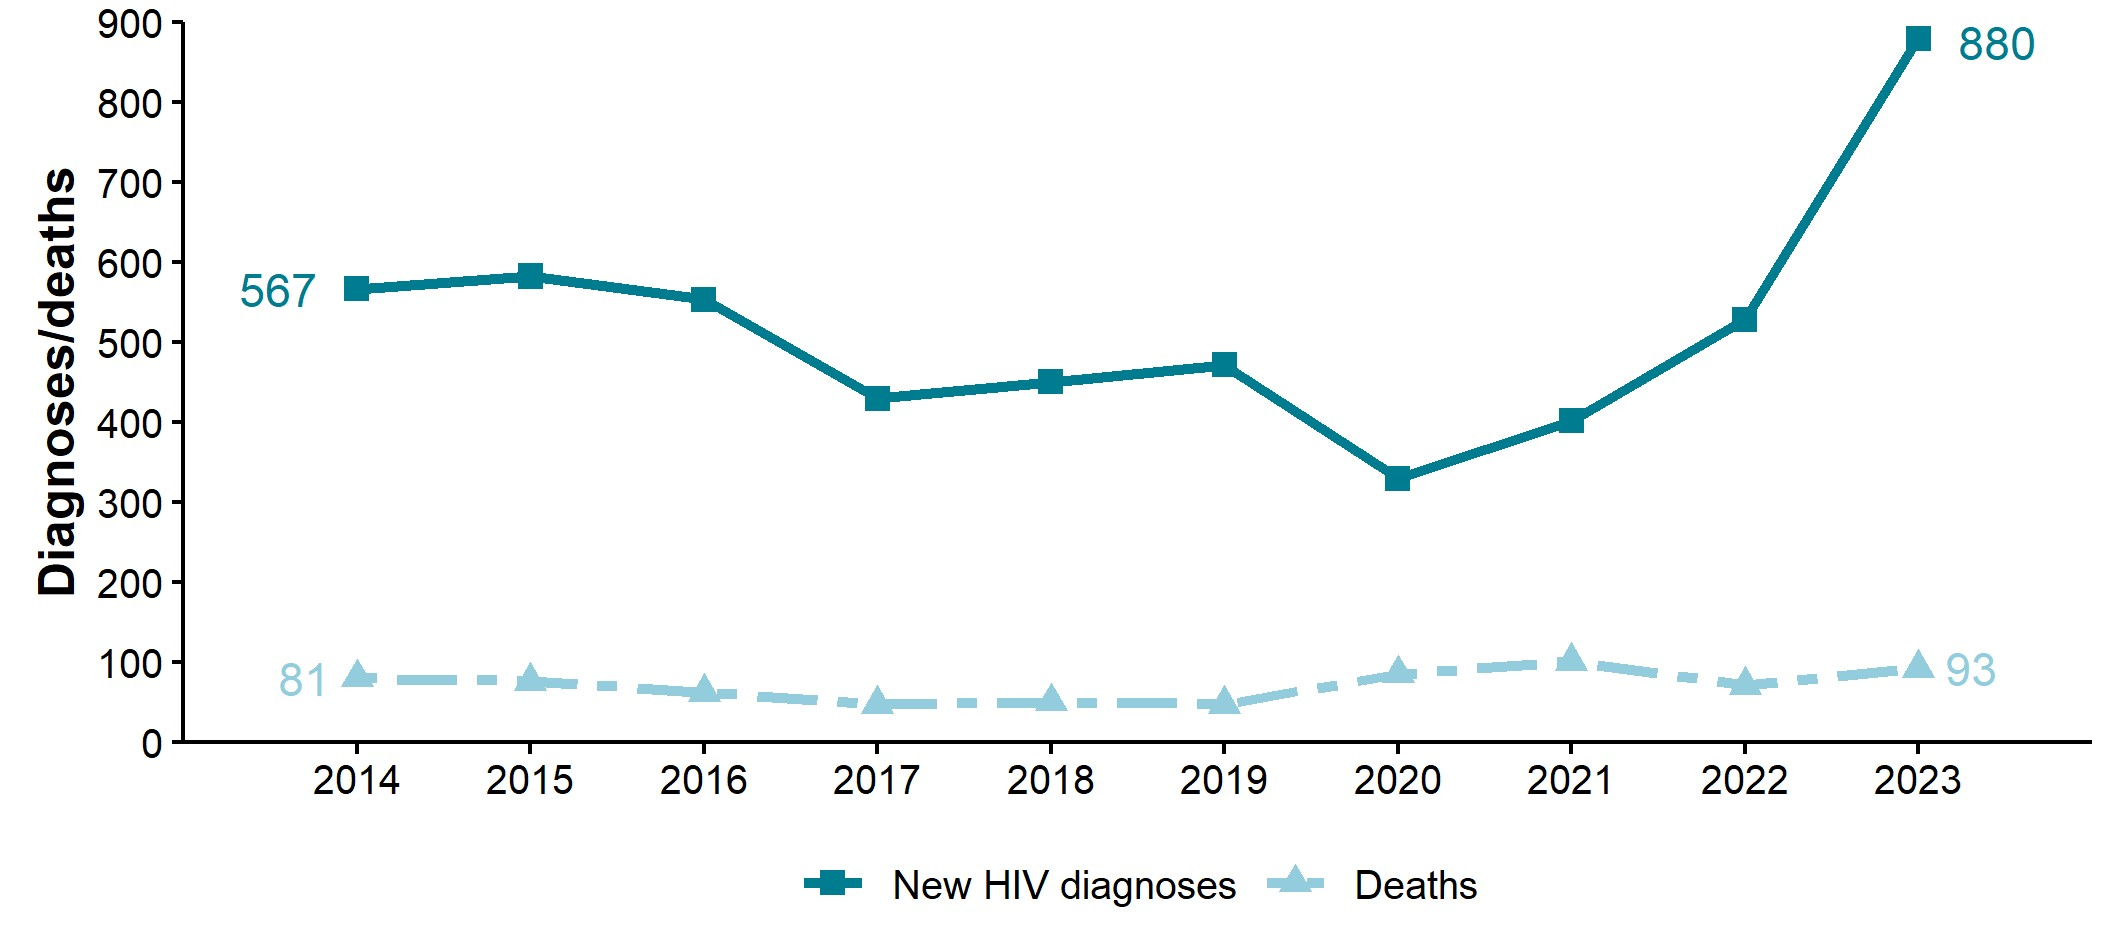
Figure 3. New HIV diagnoses and deaths, the South East, 2014 to 2023 [note 1]
Sources: UKHSA, HIV and AIDS New Diagnoses and Deaths (HANDD).
The number of new diagnoses will depend on accessibility of testing as well as infection and transmission. Numbers may rise as we receive more reports and more information. This will impact on interpretation of trends in more recent years. New HIV diagnoses are shown by UK region of residence at diagnosis. Deaths are shown by UK region of death which in some instances may not be the same as UK region of residence at diagnosis. Region of death may not be known for all deaths, particularly for those in the most recent years. Numbers for these years should be interpreted as minimum numbers (deaths reported and allocated to a region of death to date) and not as a trend.
Note 1: numbers may rise as further reports are received and more information is obtained. This is more likely to affect more recent years, particularly 2023.
Figure 3 is a line chart showing the trend in number of new HIV diagnoses and deaths in HIV-diagnosed South East residents between the years 2014 and 2023.
The chart shows that there were 880 new HIV diagnoses and 93 deaths in HIV-diagnosed South East residents in 2023, compared to 567 new HIV diagnoses and 81 deaths in 2014. The number of new HIV diagnoses was 66% higher and the number of deaths were 29% higher in 2023 than in 2022 (529 new HIV diagnoses and 72 deaths). The number of deaths increased after 2019, coinciding with improved ascertainment of deaths following the introduction of the National HIV Mortality Review. Moreover, additional deaths due to COVID-19 were reported during the pandemic in people living with HIV. Deaths tend to be subject to a greater reporting delay than diagnoses, and it is important to be aware of this when interpreting the number of deaths currently reported for the most recent year.
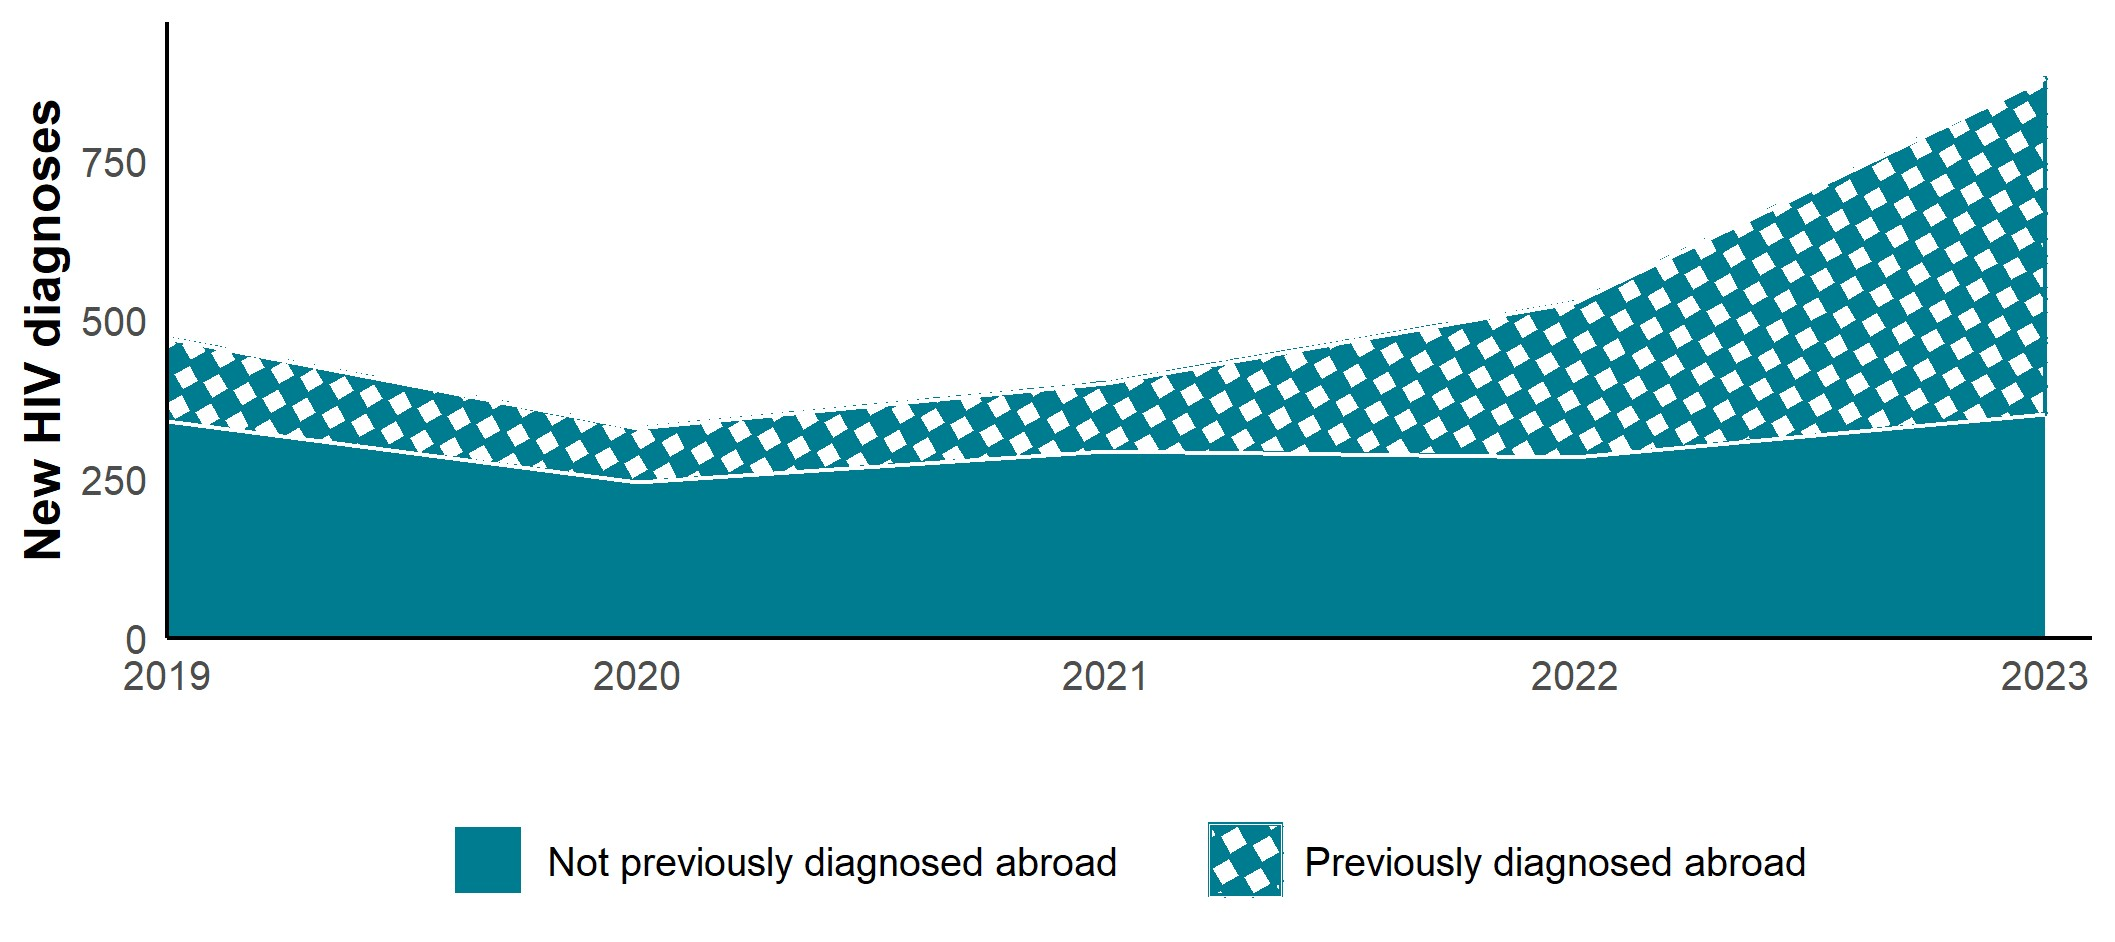
Figure 4. New HIV diagnoses by whether a person had been previously diagnosed abroad, the South East, 2019 to 2023 [note 1]
Sources: UKHSA, HIV and AIDS New Diagnoses and Deaths (HANDD).
The number of new diagnoses will depend on accessibility of testing as well as infection and transmission.
Note 1: numbers may rise as further reports are received and more information is obtained. This is more likely to affect more recent years, particularly 2023.
Figure 4 is an area chart showing the trend in new HIV diagnoses in South East residents between 2019 and 2023 by whether a person had been previously diagnosed abroad. The solid-shaded area represents new HIV diagnoses where there had been no report of a prior diagnosis abroad, and the pattern-shaded area represents the portion of diagnoses where a prior diagnosis abroad had been recorded. Identifying patients who have been previously diagnosed abroad has become an issue of increasing importance as access to testing and treatment has improved worldwide. Including those previously diagnosed abroad in all analyses can lead to distortions in our understanding of which groups remain exposed to the greatest risk of transmission in the UK.
The chart shows that the proportion of South East residents newly diagnosed with HIV who were previously diagnosed abroad has increased over the 5-year period from 28% in 2019 (131 new HIV diagnoses) to 60% in 2023 (527 new HIV diagnoses).
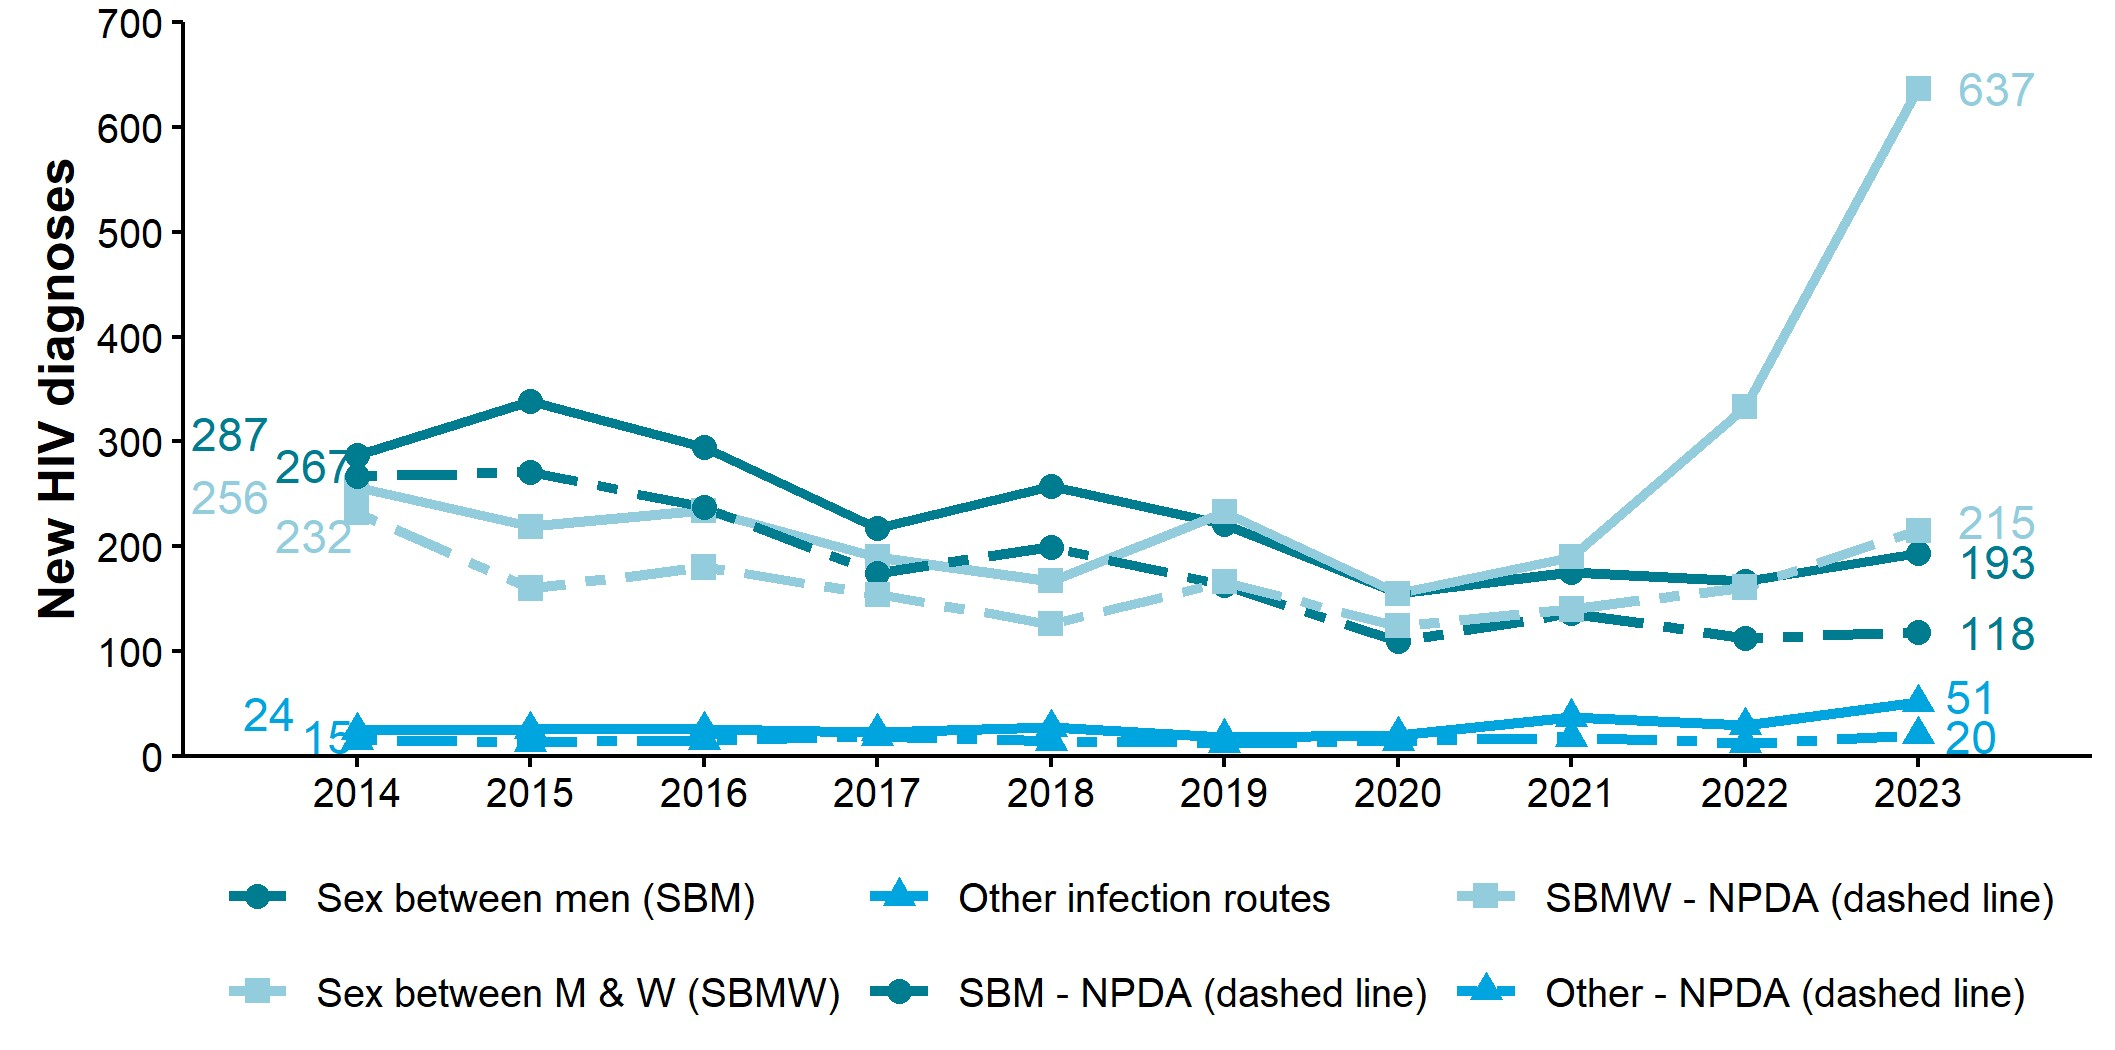
Figure 5a. New HIV diagnoses by probable route of acquiring HIV (adjusted for missing route information), South East residents, 2014 to 2023 [note 1]
Sources: UKHSA, HIV and AIDS New Diagnoses and Deaths (HANDD).
NPDA = Not previously diagnosed abroad.
The number of new diagnoses will depend on accessibility of testing as well as infection and transmission.
Note 1: numbers may rise as further reports are received and more information is obtained. This is more likely to affect more recent years, particularly 2023.
Figure 5a is a line chart showing the trend in new HIV diagnoses in South East residents by probable transmission route, grouped as sex between men, sex between men and women, and other infection routes, from 2014 to 2023. HIV exposure categories are arranged in a risk hierarchy, reflecting what we know about transmission risk and the prevalence of HIV in different communities. If people have multiple exposures, they are allocated to the group highest in the risk hierarchy. For example, a woman who reported sex with men and with women would be allocated to the sex between men and women group, while a man who reported sex between men and injecting drug use would be allocated to the sex between men group. Numbers have been adjusted for missing transmission route allocation, and diagnoses where this information is unknown have been proportionately allocated to the 3 transmission groups. For each group, an additional dashed line shows the trend when people known to have been previously diagnosed abroad are excluded.
The chart shows that the number of new HIV diagnoses in those who probably acquired their diagnoses through sex between men and women has increased since 2020. The number of new HIV diagnoses in this group in 2023 (637 new HIV diagnoses) was 149% higher than it was in 2014 (256 diagnoses). The same trend was not seen when limiting the group to only those who were not previously diagnosed abroad, and the number of new HIV diagnoses was 7% lower over the 10-year period. Hence, the increase in new HIV diagnoses in those who probably acquired their diagnoses through sex between men and women is driven by people who have been previously diagnosed abroad.
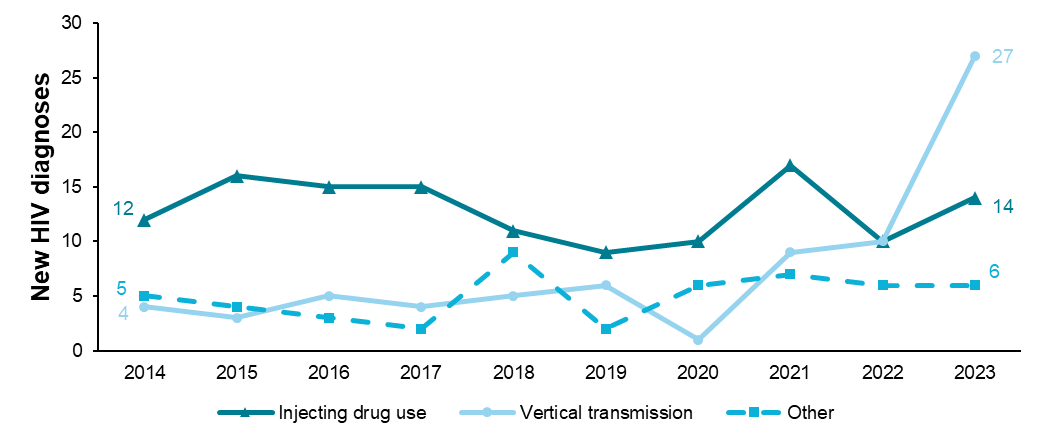
Figure 5b. New HIV diagnoses detailed ‘other’ route of acquiring HIV (not adjusted for missing information), South East residents, 2014 to 2023 [note 1]
Sources: UKHSA, HIV and AIDS New Diagnoses and Deaths (HANDD).
The number of new diagnoses will depend on accessibility of testing as well as infection and transmission.
Note 1: numbers may rise as further reports are received and more information is obtained. This is more likely to affect more recent years, particularly 2023.
Figure 5b is a line chart providing additional information on the HIV transmission routes grouped into ‘Other infection routes’ in Figure 5a. The chart is showing trends in new HIV diagnoses acquired through injecting drug use, vertical (mother-to-child) transmission, and other transmission routes, such as via blood or tissue, in South East residents from 2014 to 2023.
The chart shows that the number of new HIV diagnoses in South East residents whose probable route of HIV acquisition belonged to any of these subcategories remained low throughout the 10-year period. An increase has been seen in vertical transmission since 2020, and the number of new HIV diagnoses in this group in 2023 (27 new HIV diagnoses) was 575% higher than it was in 2014 (4 diagnoses). Of the 74 HIV diagnoses acquired vertically between 2014 and 2023, 38% (28) were first diagnosed in the UK and 62% (46) were continuing care in the UK after being diagnosed abroad.
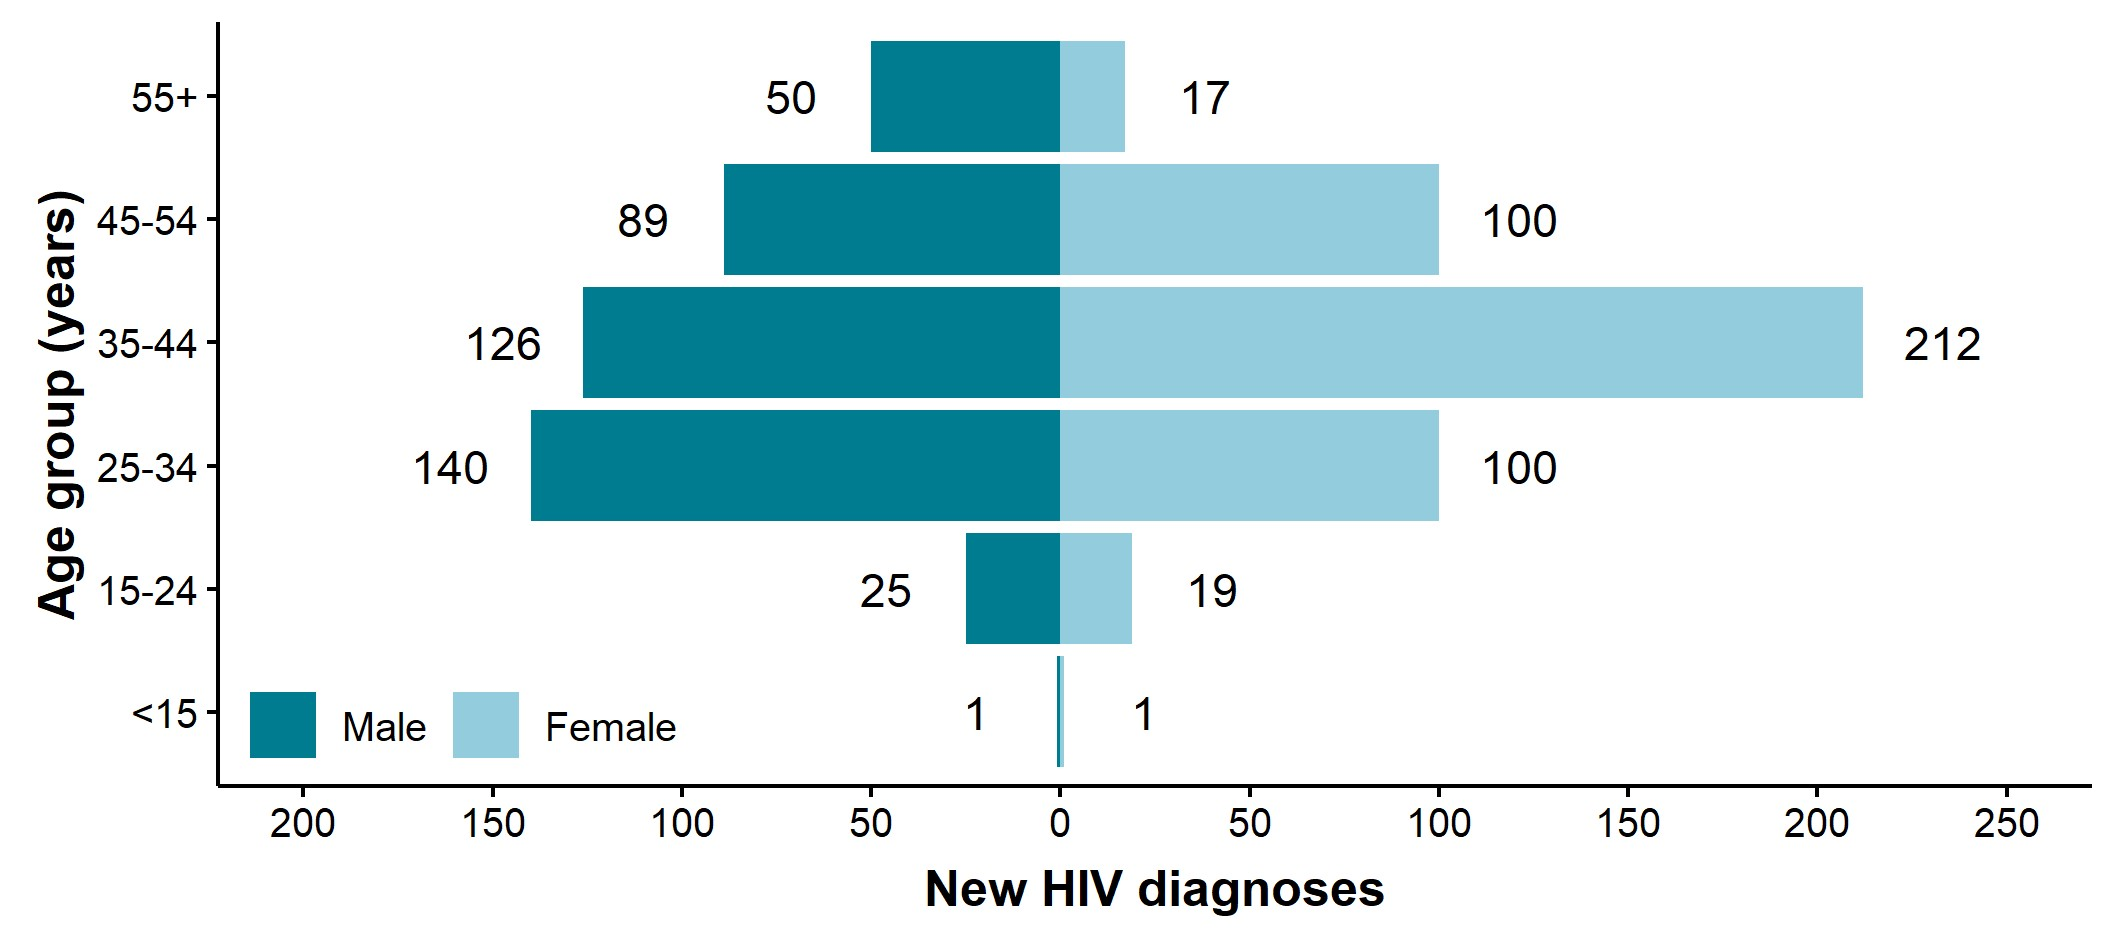
Figure 6a. Number of new HIV diagnoses by age group and gender, South East residents, 2023
Sources: UKHSA, HIV and AIDS New Diagnoses and Deaths (HANDD).
The number of new diagnoses will depend on accessibility of testing as well as infections and transmission.
Figure 6a is a pyramid chart showing the number of new HIV diagnoses by age group and sex in South East residents in 2023.
For females, the 35 to 44 year age group had the highest number of new HIV diagnoses (212). For males, the 25 to 34 year age group had the highest number of new HIV diagnoses (140), followed by the 35 to 44 year age group (126).
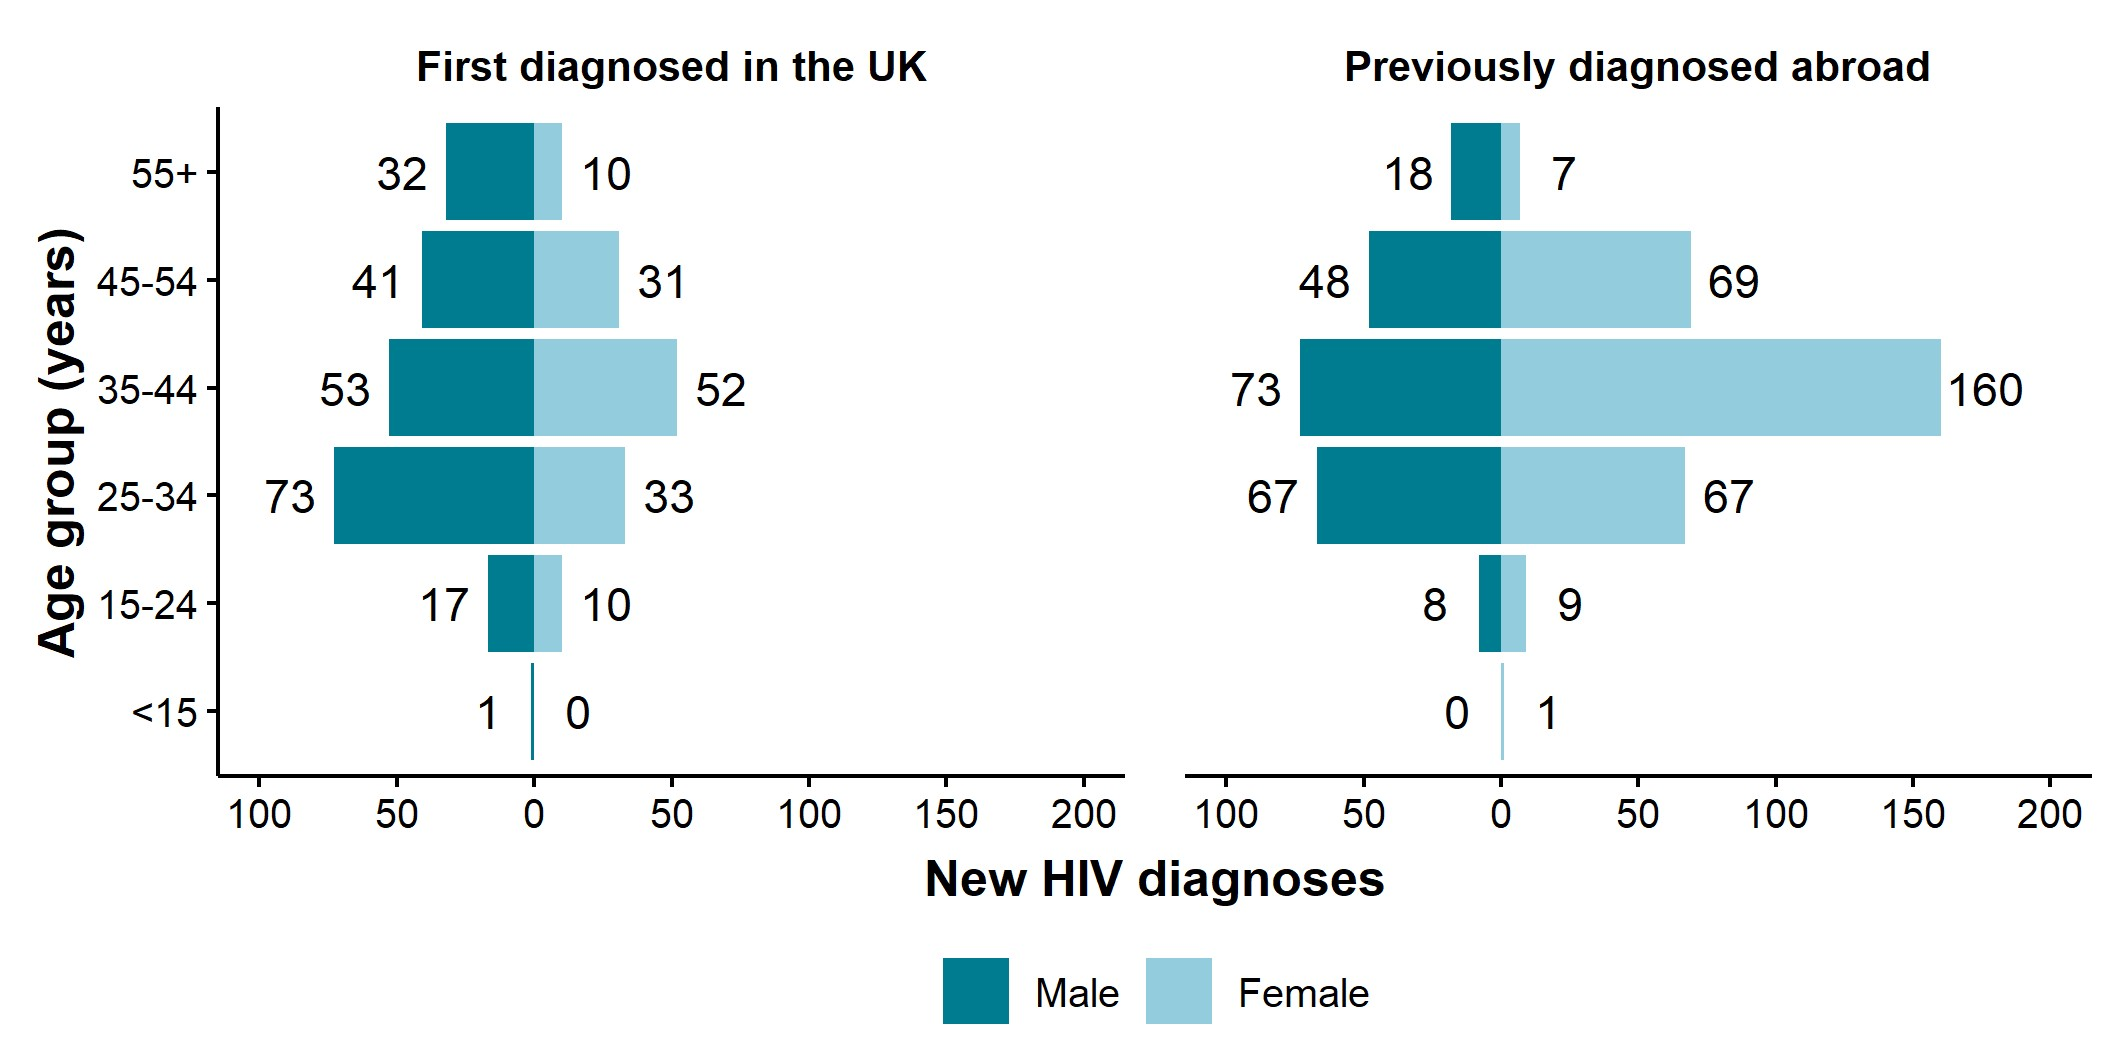
Figure 6b. Number of new HIV diagnoses by age group and gender, split by whether first diagnosed in the UK or abroad, South East residents, 2023
Sources: UKHSA, HIV and AIDS New Diagnoses and Deaths (HANDD).
The number of new diagnoses will depend on accessibility of testing as well as infections and transmission.
Figure 6b is a pair of pyramid charts showing the number of new HIV diagnoses in South East residents in those first diagnosed in the UK and in those previously diagnosed abroad by age group and sex in 2023.
Among those first diagnosed in the UK, males in the 25 to 34 year age group had the highest number of new HIV diagnoses (73). Among those previously diagnosed abroad, females in the 35 to 44 year age group had the highest number of new HIV diagnoses (160).
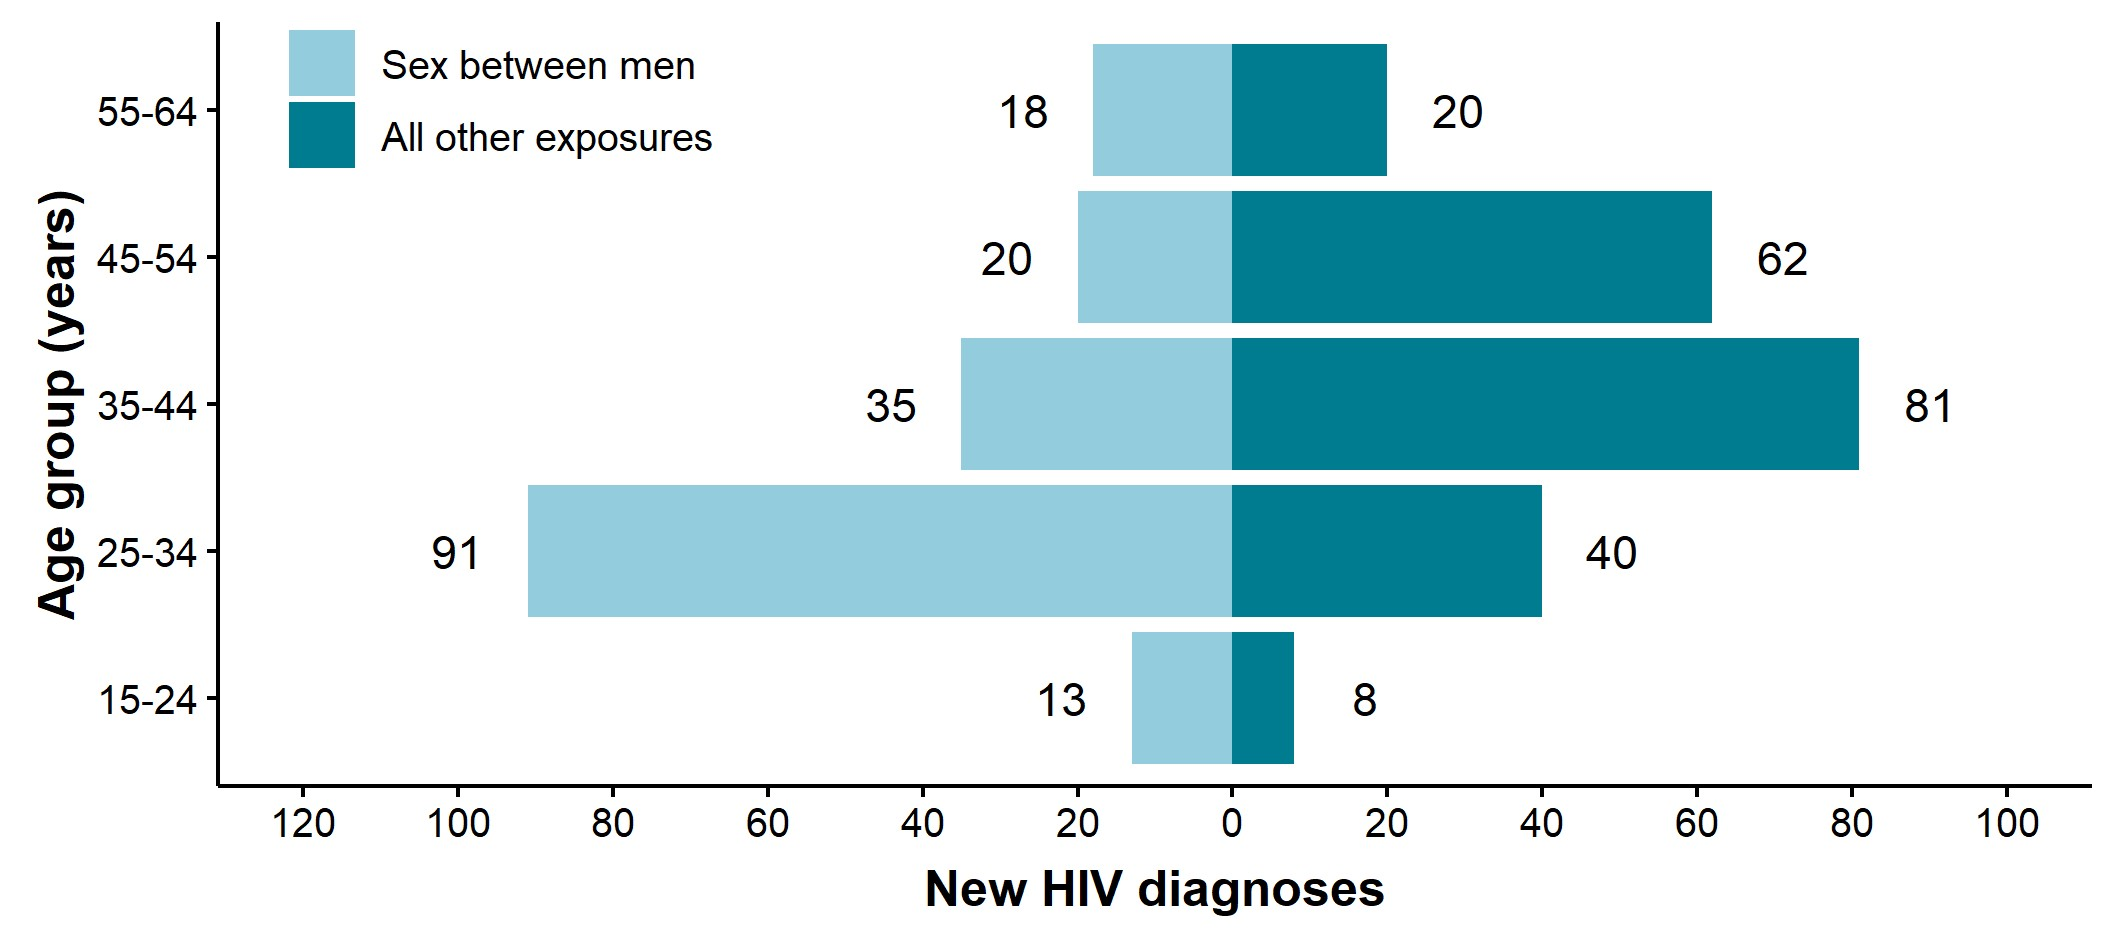
Figure 6c. Number of new HIV diagnoses by age group and probable route of acquiring HIV, male South East residents aged 15 to 64 years, 2023
Sources: UKHSA, HIV and AIDS New Diagnoses and Deaths (HANDD).
The number of new diagnoses will depend on accessibility of testing as well as infection and transmission.
Figure 6c is a pyramid chart showing the number of new HIV diagnoses for male South East residents aged 15 to 64 years by age group and probable route of acquiring HIV in 2023.
For those who probably acquired HIV through sex between men, the 25 to 34 year age group accounted for the highest number of new HIV diagnoses (91). For those who probably acquired HIV through all other exposures, the 35 to 44 year age group had the highest number of new HIV diagnoses (81), followed by the 45 to 54 year age group (62). It is important to note that the left side of the pyramid is skewed towards the younger ages as they have a markedly higher proportion identifying as lesbian, gay, bisexual or another minority sexual orientation (LGB+) than the overall population (6).
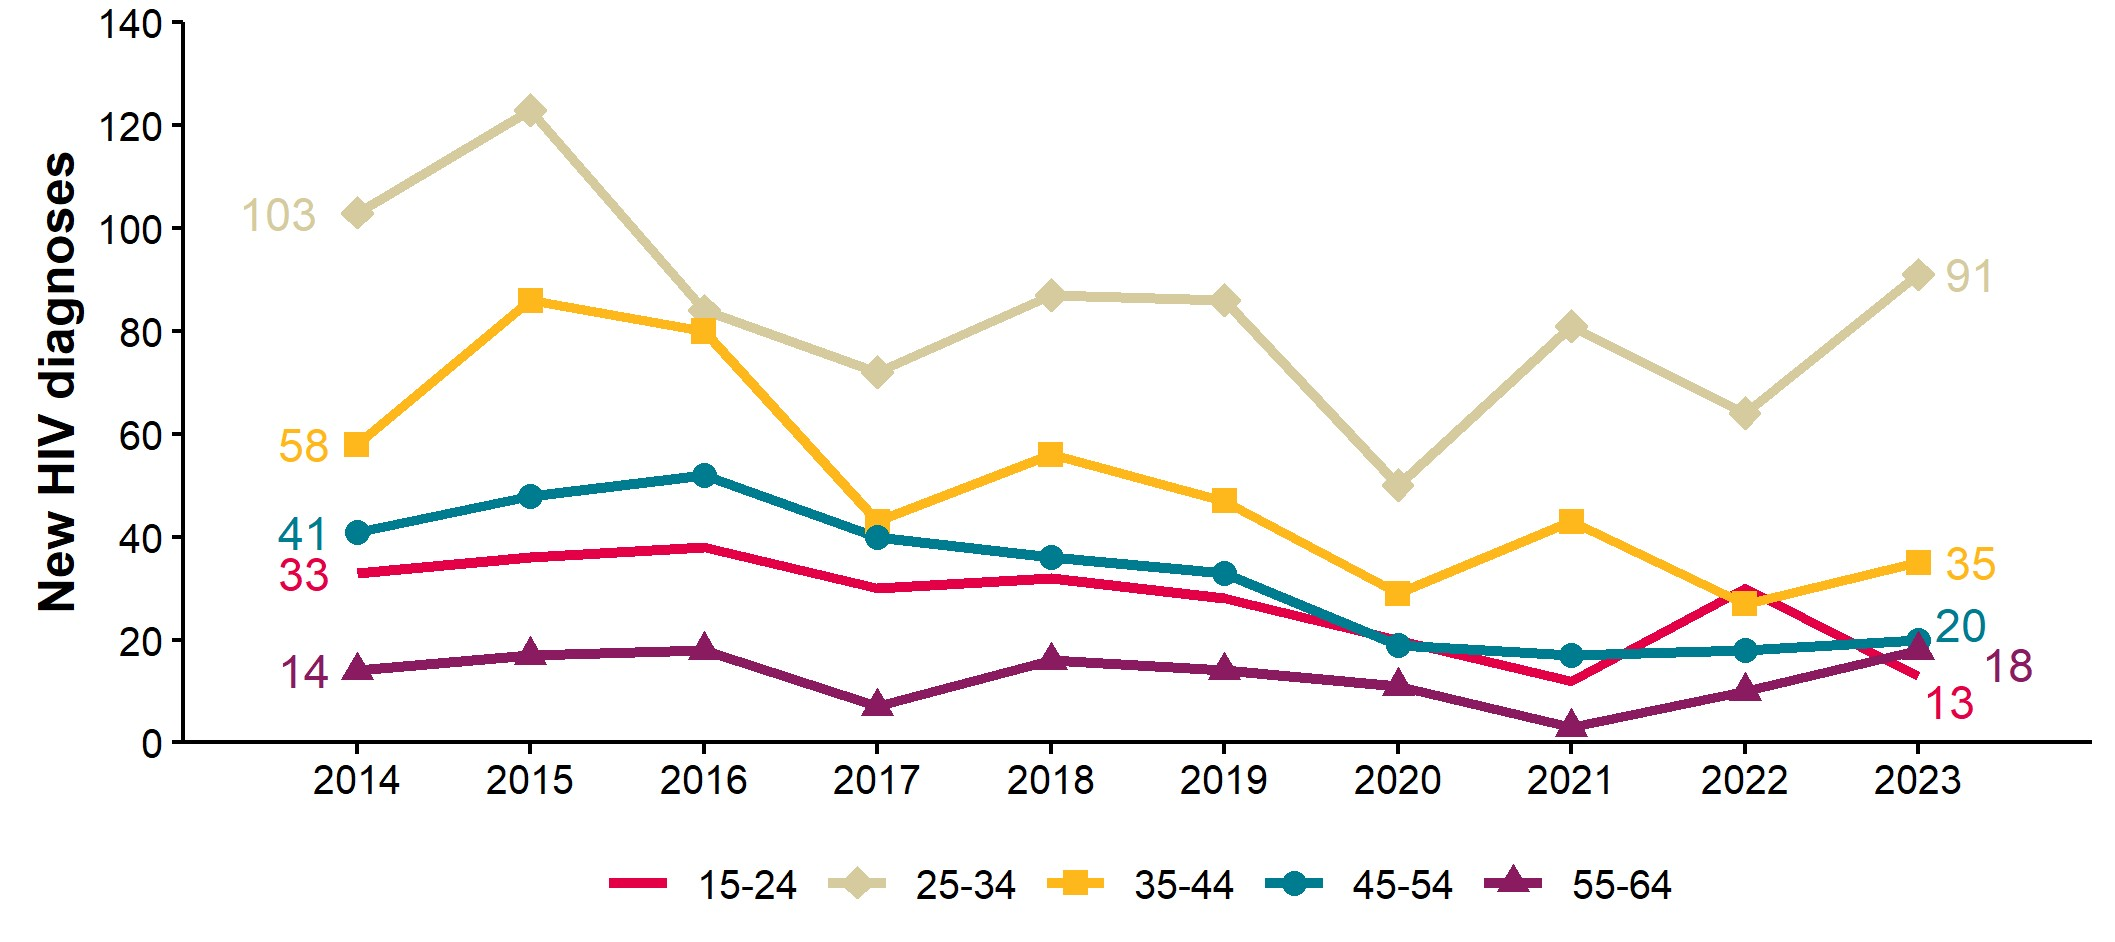
Figure 7a. Number of new HIV diagnoses probably acquired through sex between men by age group and year of first UK HIV diagnosis, South East residents aged 15 to 64 years, 2014 to 2023 [note 1]
Sources: UKHSA, HIV and AIDS New Diagnoses and Deaths (HANDD).
The number of new diagnoses will depend on accessibility of testing as well as infection and transmission.
Note 1: numbers may rise as further reports are received and more information is obtained. This is more likely to affect more recent years, particularly 2023.
Figure 7a is a line chart showing the number of new HIV diagnoses acquired through sex between men for male South East residents aged 15 to 64 years from 2014 to 2023.
Between 2014 and 2023, the number of new diagnoses decreased for all age groups apart from a 29% increase in the 55 to 64 year age group. Between 2023 and 2022, the number of new diagnoses increased for all age groups apart from the 15 to 24 year age group. The 25 to 34 year age group had the highest number of new diagnoses every year from 2014 to 2023, and accounted for 51% of the new diagnoses in GBMSM aged 15 to 64 years in 2023.
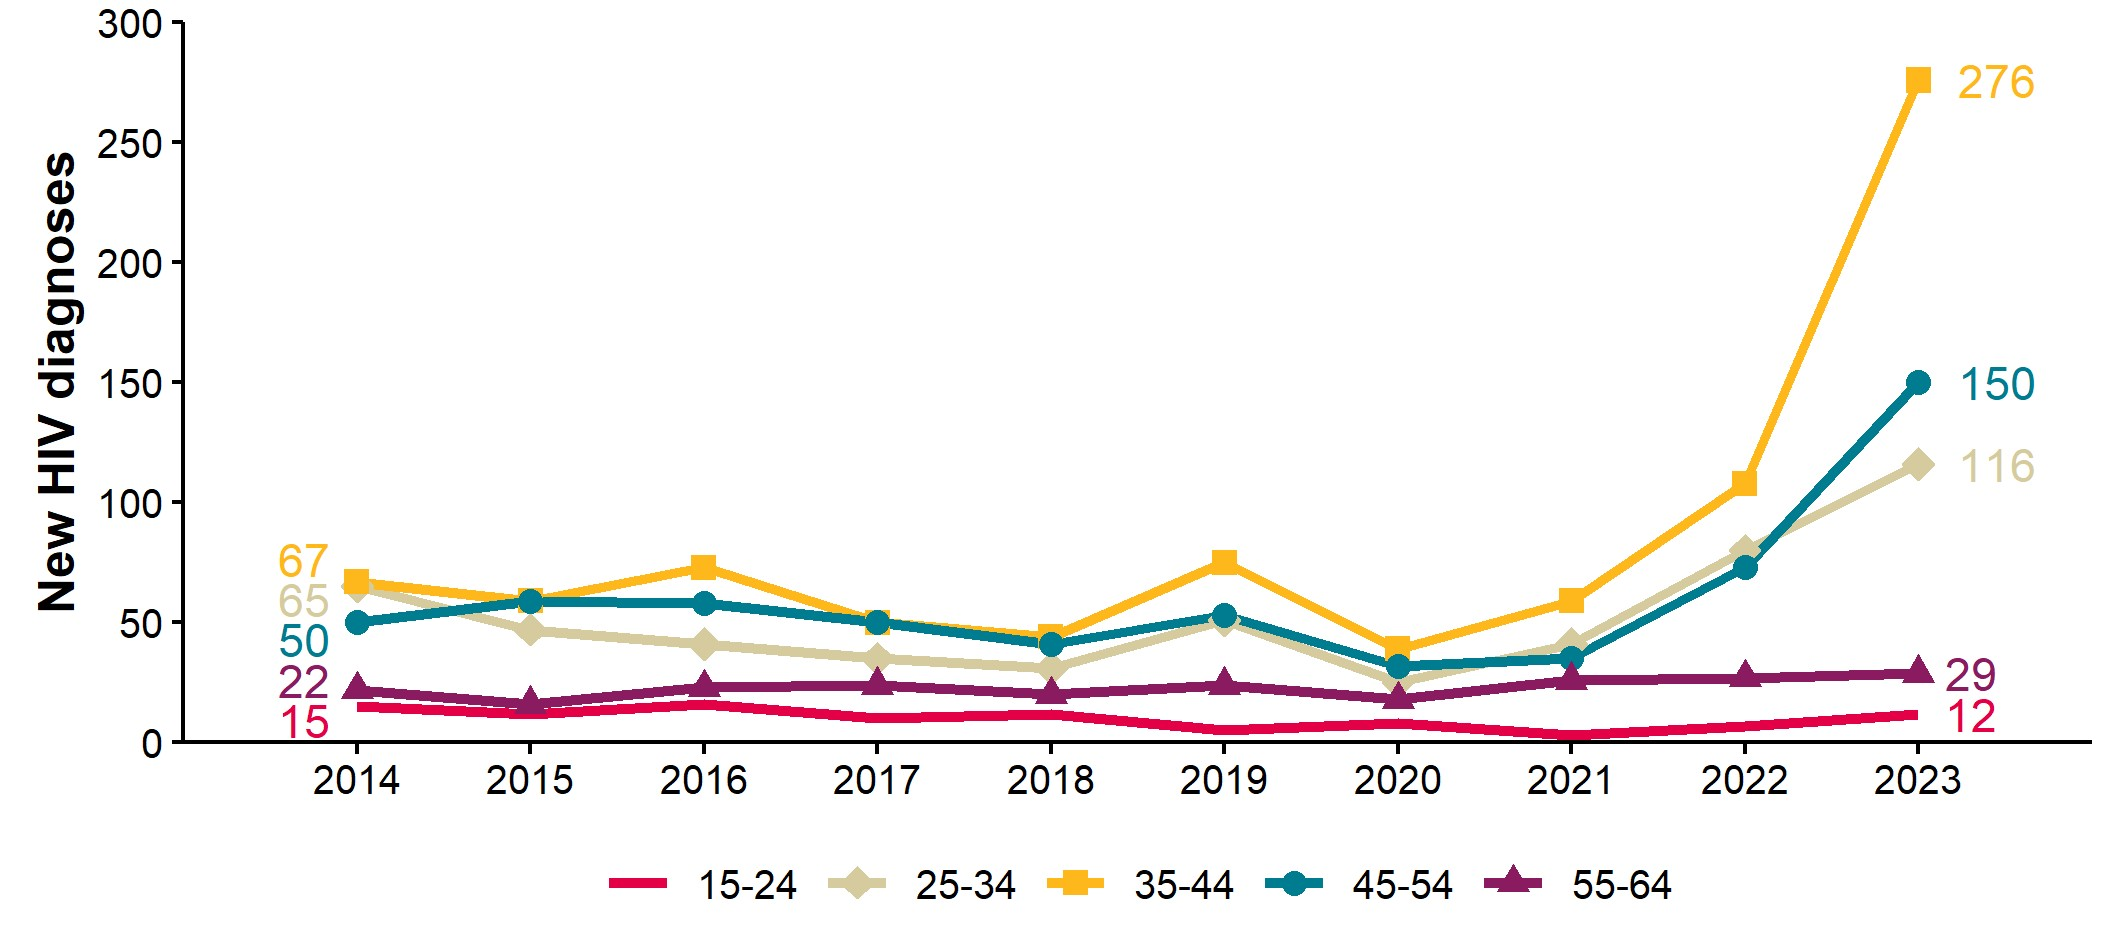
Figure 7b. Number of new HIV diagnoses probably acquired through sex between men and women by age group (in years) and year of first UK HIV diagnosis, South East residents aged 15 to 64 years, 2014 to 2023 [note 1]
Sources: UKHSA, HIV and AIDS New Diagnoses and Deaths (HANDD).
The number of new diagnoses will depend on accessibility of testing as well as infection and transmission.
Note 1: numbers may rise as further reports are received and more information is obtained. This is more likely to affect more recent years, particularly 2023.
Figure 7b is a line chart showing the number of new HIV diagnoses acquired through sex between men and women for South East residents aged 15 to 64 years for 2014 to 2023.
Between 2014 and 2023, the number of new HIV diagnoses acquired through sex between men and women increased for all age groups apart from a 20% decrease in the 15 to 24 year age group. The largest increase was of 312% in the 35 to 44 year age group, followed by 200% in the 45 to 54 year age group, and 78% in the 25 to 34 years age group. Those aged between 25 and 54 saw a dip in the number of diagnoses from 2019 to 2020 due to the COVID-19 pandemic, followed by a larger increase between 2020 and 2023 to the highest numbers in the last 10 years.
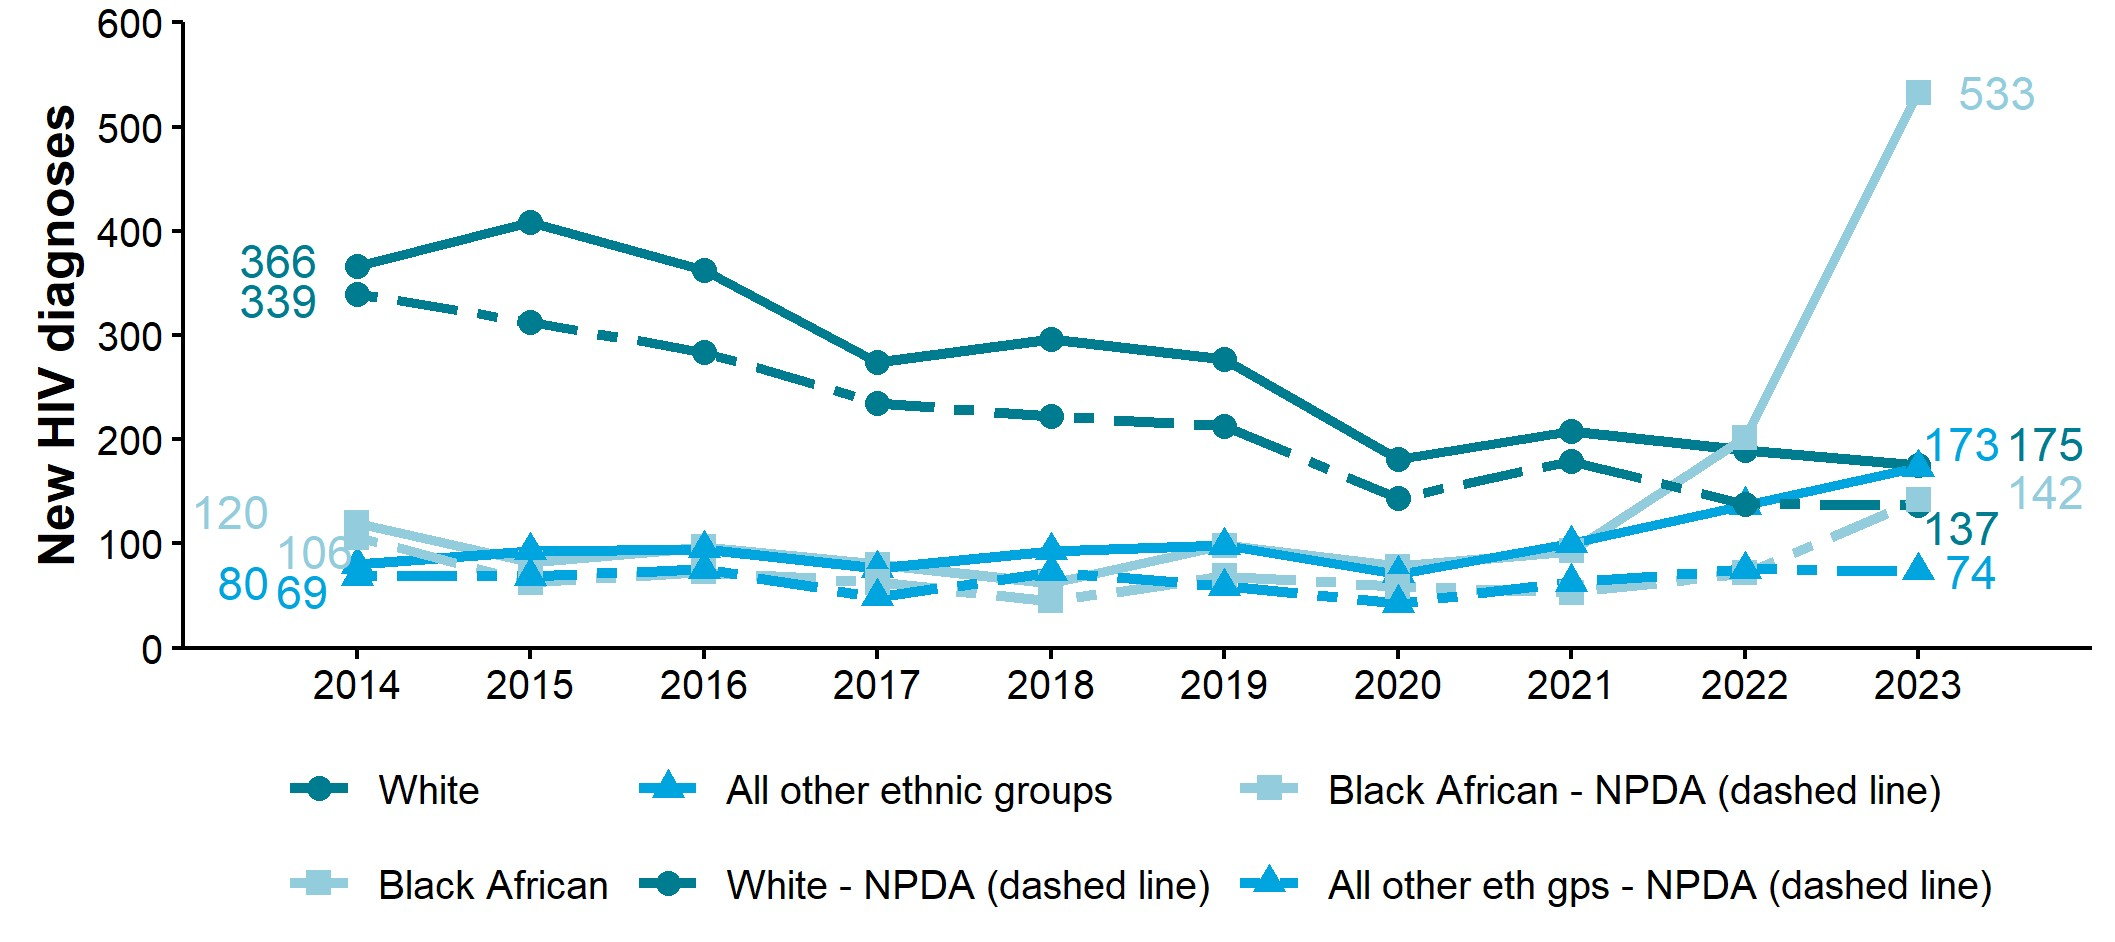
Figure 8. Number of new HIV diagnoses by ethnic group (adjusted for missing ethnic group information), South East residents, 2014 to 2023 [note 1]
Sources: UKHSA, HIV and AIDS New Diagnoses and Deaths (HANDD).
NPDA = Not previously diagnosed abroad.
The number of new diagnoses will depend on accessibility of testing as well as infection and transmission.
Note 1: numbers may rise as further reports are received and more information is obtained. This is more likely to affect more recent years, particularly 2023.
Figure 8 is a line chart showing the number of new HIV diagnoses in South East residents by ethnic group from 2014 to 2023. White and Black African ethnic groups are represented as distinct categories, while all other ethnic groups have been combined into ‘All other ethnic groups’. For each group, an additional dashed line shows the trend when people known to have been previously diagnosed abroad are excluded.
Between 2014 and 2023, the number of new HIV diagnoses in the White ethnic group decreased by 52% from 366 to 175 (or by 60% from 339 to 137 when excluding those previously diagnosed abroad), while it increased by 344% from 120 to 533 (or by 34% from 106 to 142 when excluding those previously diagnosed abroad) in the Black African ethnic group, and by 116% from 80 to 173 (or by 7% from 69 to 74 when excluding those previously diagnosed abroad) in All other ethnic groups.
Between 2022 and 2023, the number of new HIV diagnoses in the White ethnic group decreased by 8% from 190 to 175 (or by 1% from 138 to 137 when excluding those previously diagnosed abroad), while it increased by 164% from 202 to 533 (or by 97% from 72 to 142 when excluding those previously diagnosed abroad) in the Black African ethnic group.
The impact of migration patterns should be considered when interpreting changes in new HIV diagnoses in different ethnic groups. It is important to emphasise that ethnic group is not a proxy for country or world region of birth. Ethnicity is a complex concept and is self-identified and reported within the limitations of the available options provided. It may incorporate cultural, religious and linguistic differences as well as differences in physical attributes and world region of origin. People may identify their ethnic group differently in different contexts or over time.
Rates are for all ages and age distributions will differ by ethnic group. The White ethnic group has the oldest age distribution, which will depress its rate as numbers of HIV diagnoses in the oldest age groups are lower. Other important determinants, such as deprivation and issues of stigma, also vary by ethnic group. Charts and tables by ethnic group should always be interpreted in the wider context of determinants and never in isolation.
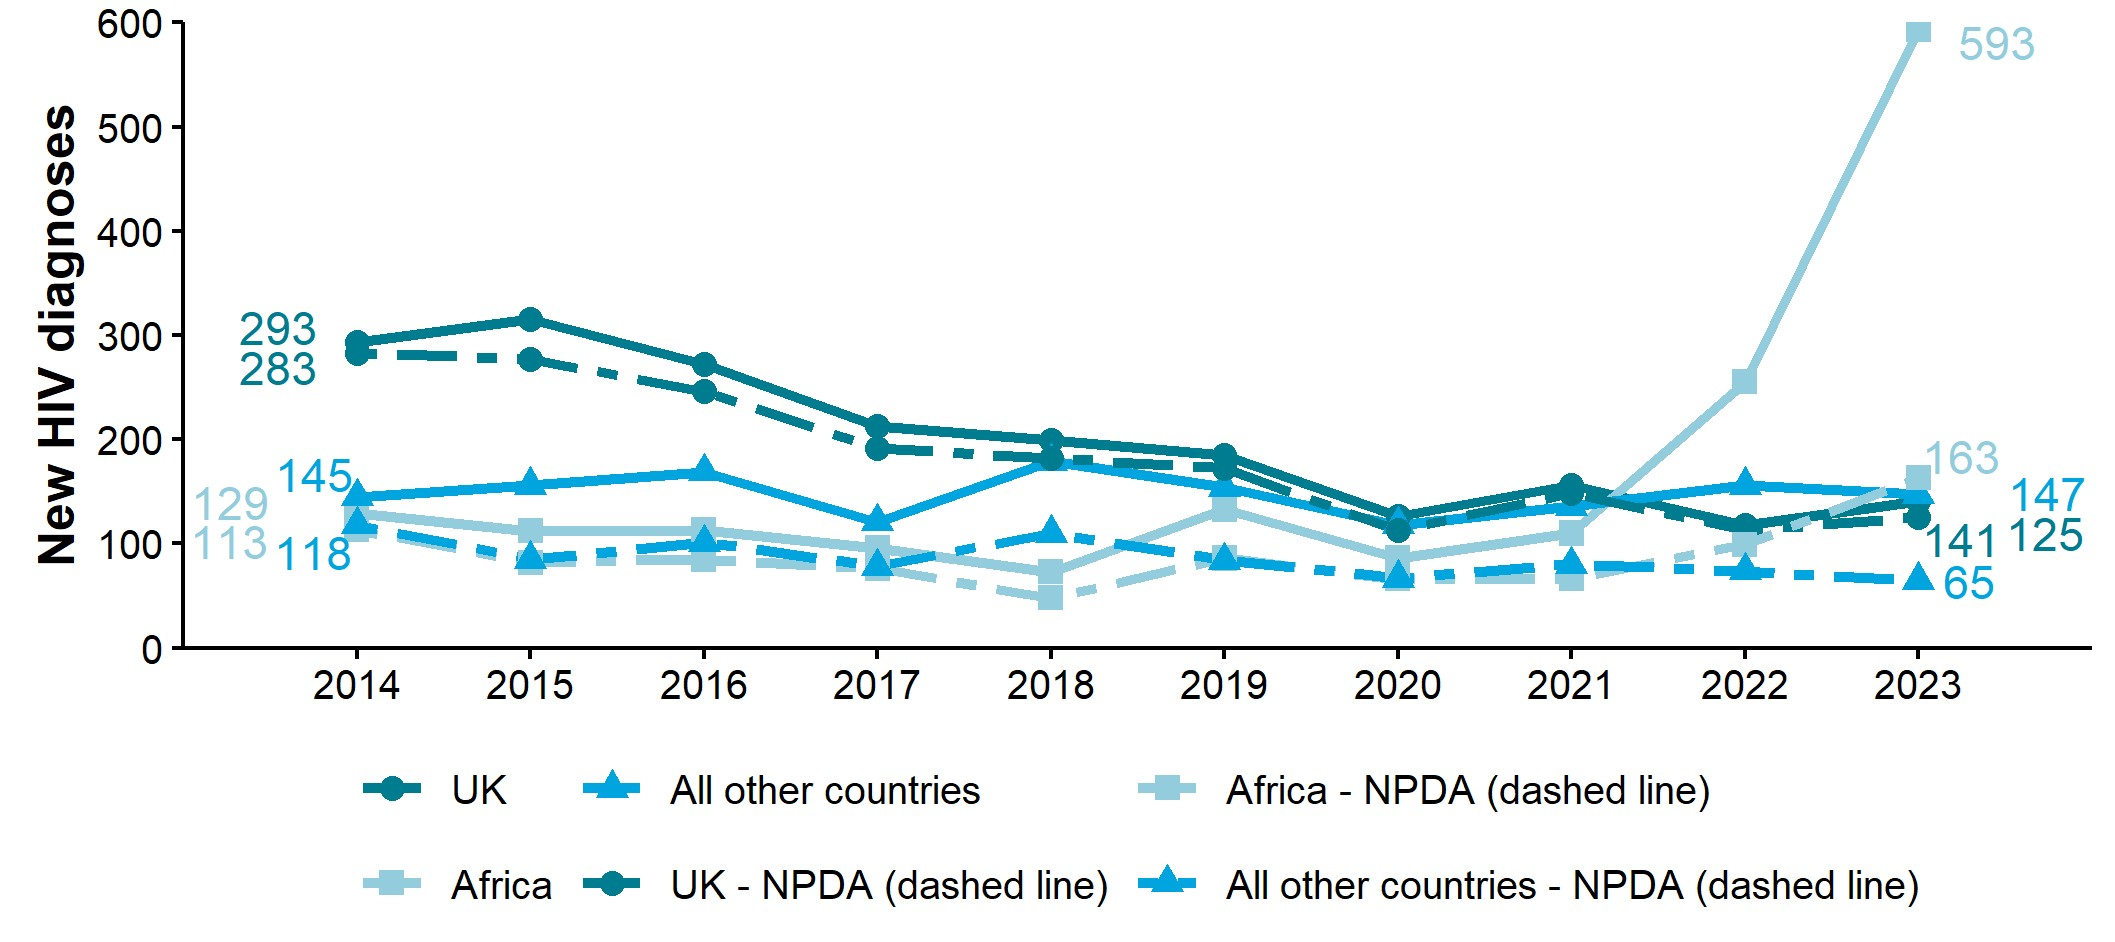
Figure 9. Number of new HIV diagnoses by world region of birth (adjusted for missing world region of birth information), South East residents, 2014 to 2023 [note 1]
Sources: UKHSA, HIV and AIDS New Diagnoses and Deaths (HANDD).
NPDA = Not previously diagnosed abroad.
The number of new diagnoses will depend on accessibility of testing as well as infection and transmission.
Note 1: numbers may rise as further reports are received and more information is obtained. This is more likely to affect more recent years, particularly 2023.
Figure 9 is a line chart showing the number of new HIV diagnoses in South East residents by world region of birth from 2014 to 2023. The UK and Africa are represented as distinct categories, and all other countries of birth are grouped into a single category. For each group, an additional dashed line shows the trend when people known to have been previously diagnosed abroad are excluded.
Between 2014 and 2023, the number of new HIV diagnoses in those born in the UK decreased by 52% from 293 to 141 (or by 56% from 283 to 125 when excluding those previously diagnosed abroad), while it increased by 360% from 129 to 593 (or by 44% from 113 to 163 when excluding those previously diagnosed abroad) in those born in Africa, and increased by 1% from 145 to 147 (or decreased by 45% from 118 to 65 when excluding those previously diagnosed abroad) in those born in All other countries.
Between 2022 and 2023, the number of new HIV diagnoses in those born in the UK increased by 19% from 118 to 141 (or by 11% from 113 to 125 when excluding those previously diagnosed abroad), and by 133% from 255 to 593 (or by 65% from 99 to 163 when excluding those previously diagnosed abroad) in those born in Africa, while it decreased by 6% from 156 to 147 (or by 12% from 74 to 65 when excluding those previously diagnosed abroad) in those born in All other countries.
Table 1. Number of new HIV diagnoses by ethnic group and whether born abroad, South East residents, 2019 to 2023 [note 1]
| Ethnic group | UK-born | Born abroad | Unknown country of birth |
|---|---|---|---|
| White | 525 | 169 | 41 |
| Black African | 10 | 327 | 23 |
| Black Caribbean | 5 | 10 | 0 |
| Other | 42 | 214 | 15 |
| Unknown | 15 | 40 | 83 |
Sources: UKHSA, HIV and AIDS New Diagnoses and Deaths (HANDD).
The number of new diagnoses will depend on accessibility of testing as well as infection and transmission.
Note 1: numbers may rise as further reports are received and more information is obtained. This is more likely to affect more recent years, particularly 2023.
Table 1 shows the number of new HIV diagnoses in South East residents by ethnic group and whether born abroad or not for the 5-year period 2019 to 2023. Those with a prior diagnosis abroad have been excluded. To make it clear that there are differences in completeness of ascertainment of country of birth for different ethnic groups, numbers in this table have not been adjusted for missing information. The number of diagnoses in any group containing a large proportion of people who were born abroad is sensitive to changes in migration patterns over time.
For the White ethnic group, country of birth was known for 94% of new HIV diagnoses. Of these, 76% were UK-born. For the Black African ethnic group, country of birth was known for 94% of new HIV diagnoses. Of these, 97% were born abroad. For the Black Caribbean ethnic group, country of birth was known for all new HIV diagnoses, and two-thirds were born abroad. For the Other ethnic group, country of birth was known for 94% of new HIV diagnoses. Of these, 84% were born abroad.
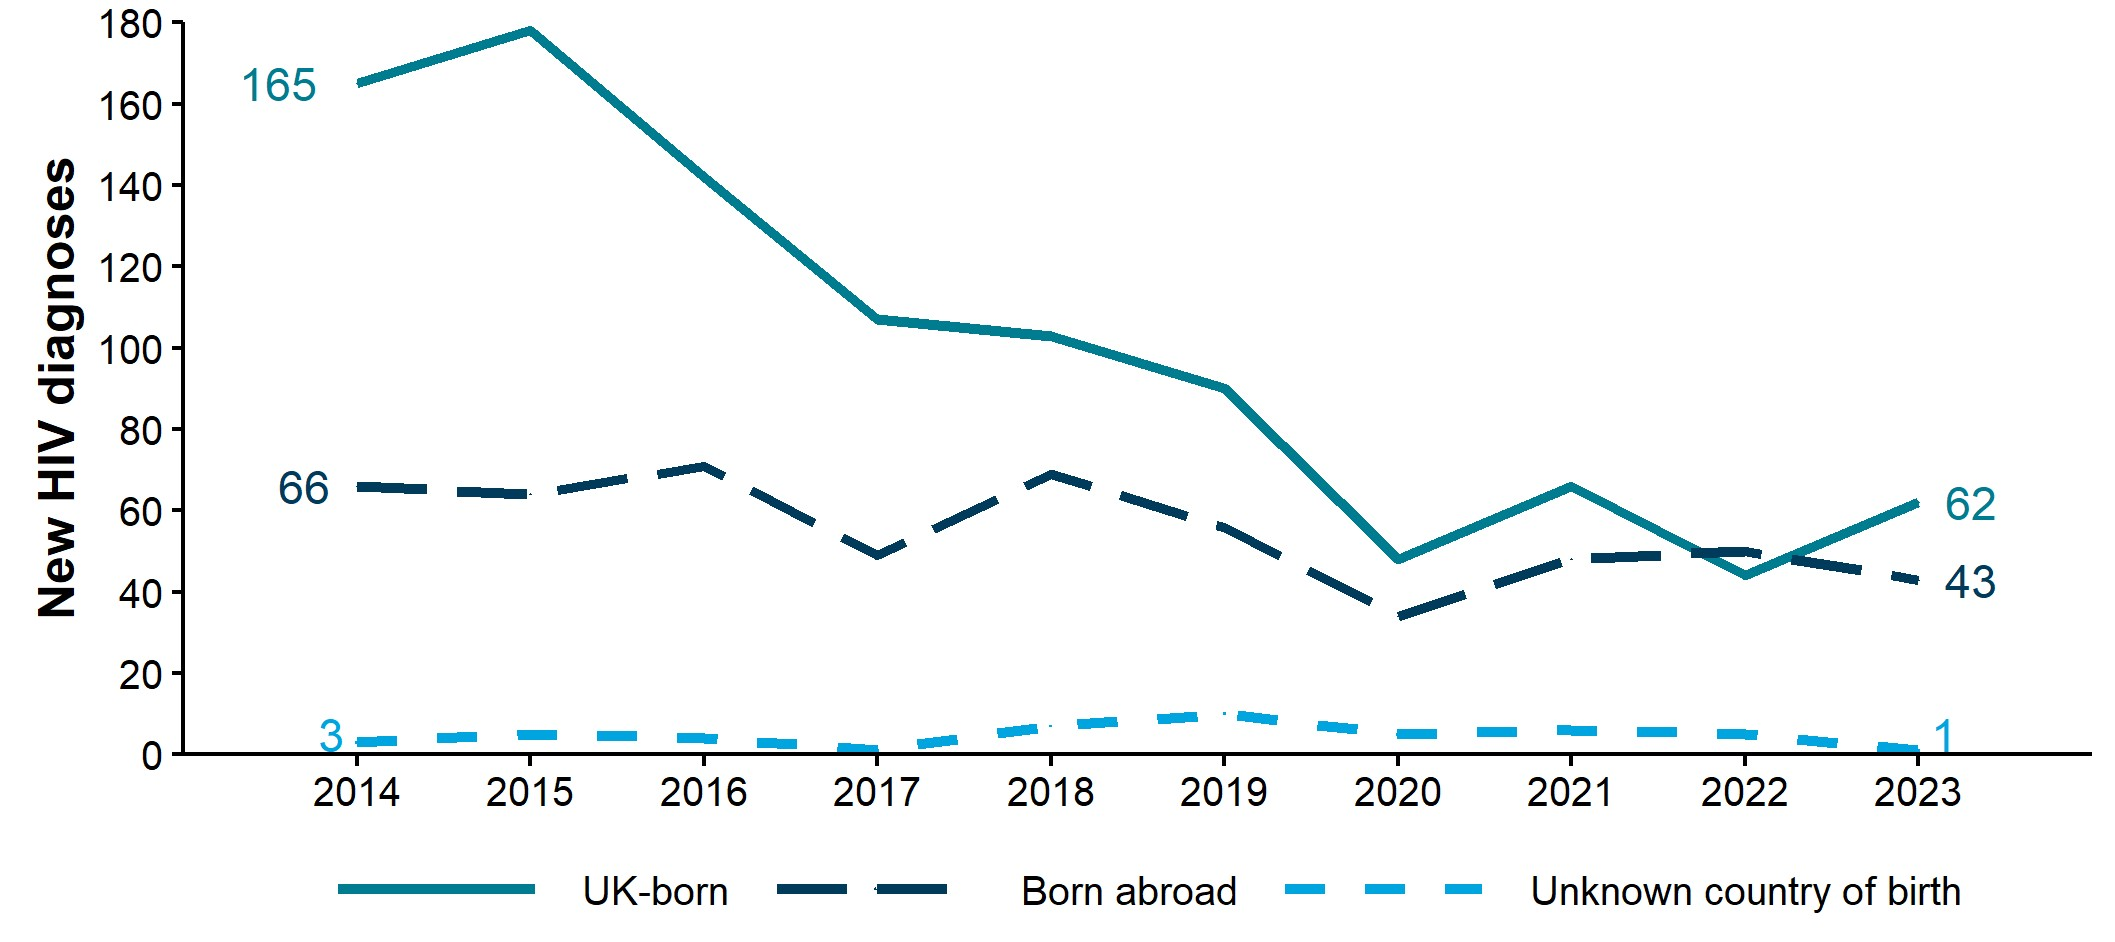
Figure 10a. New HIV diagnoses in GBMSM not previously diagnosed abroad by whether born abroad, South East residents, 2014 to 2023 [note 1]
Sources: UKHSA, HANDD.
The number of new diagnoses will depend on accessibility of testing as well as infection and transmission.
Note 1: numbers may rise as further reports are received and more information is obtained. This is more likely to affect more recent years, particularly 2023.
Figure 10a is a line chart showing the number of new HIV diagnoses in GBMSM South East residents not previously diagnosed abroad by whether born abroad or not for the 10-year period 2014 to 2023.
Between 2014 and 2023, all groups experienced a reduction in new HIV diagnoses. UK-born GBMSM had the highest number of new HIV diagnoses every year over the period apart from in 2022. The number of new HIV diagnoses for UK-born GBMSM decreased by 62%, from 165 in 2014 to 62 in 2023, and decreased by 35%, from 66 in 2014 to 43 in 2023, for GBMSM born abroad. Between 2022 and 2023, the number of new HIV diagnoses for UK-born GBMSM increased by 41%, from 44 to 62.
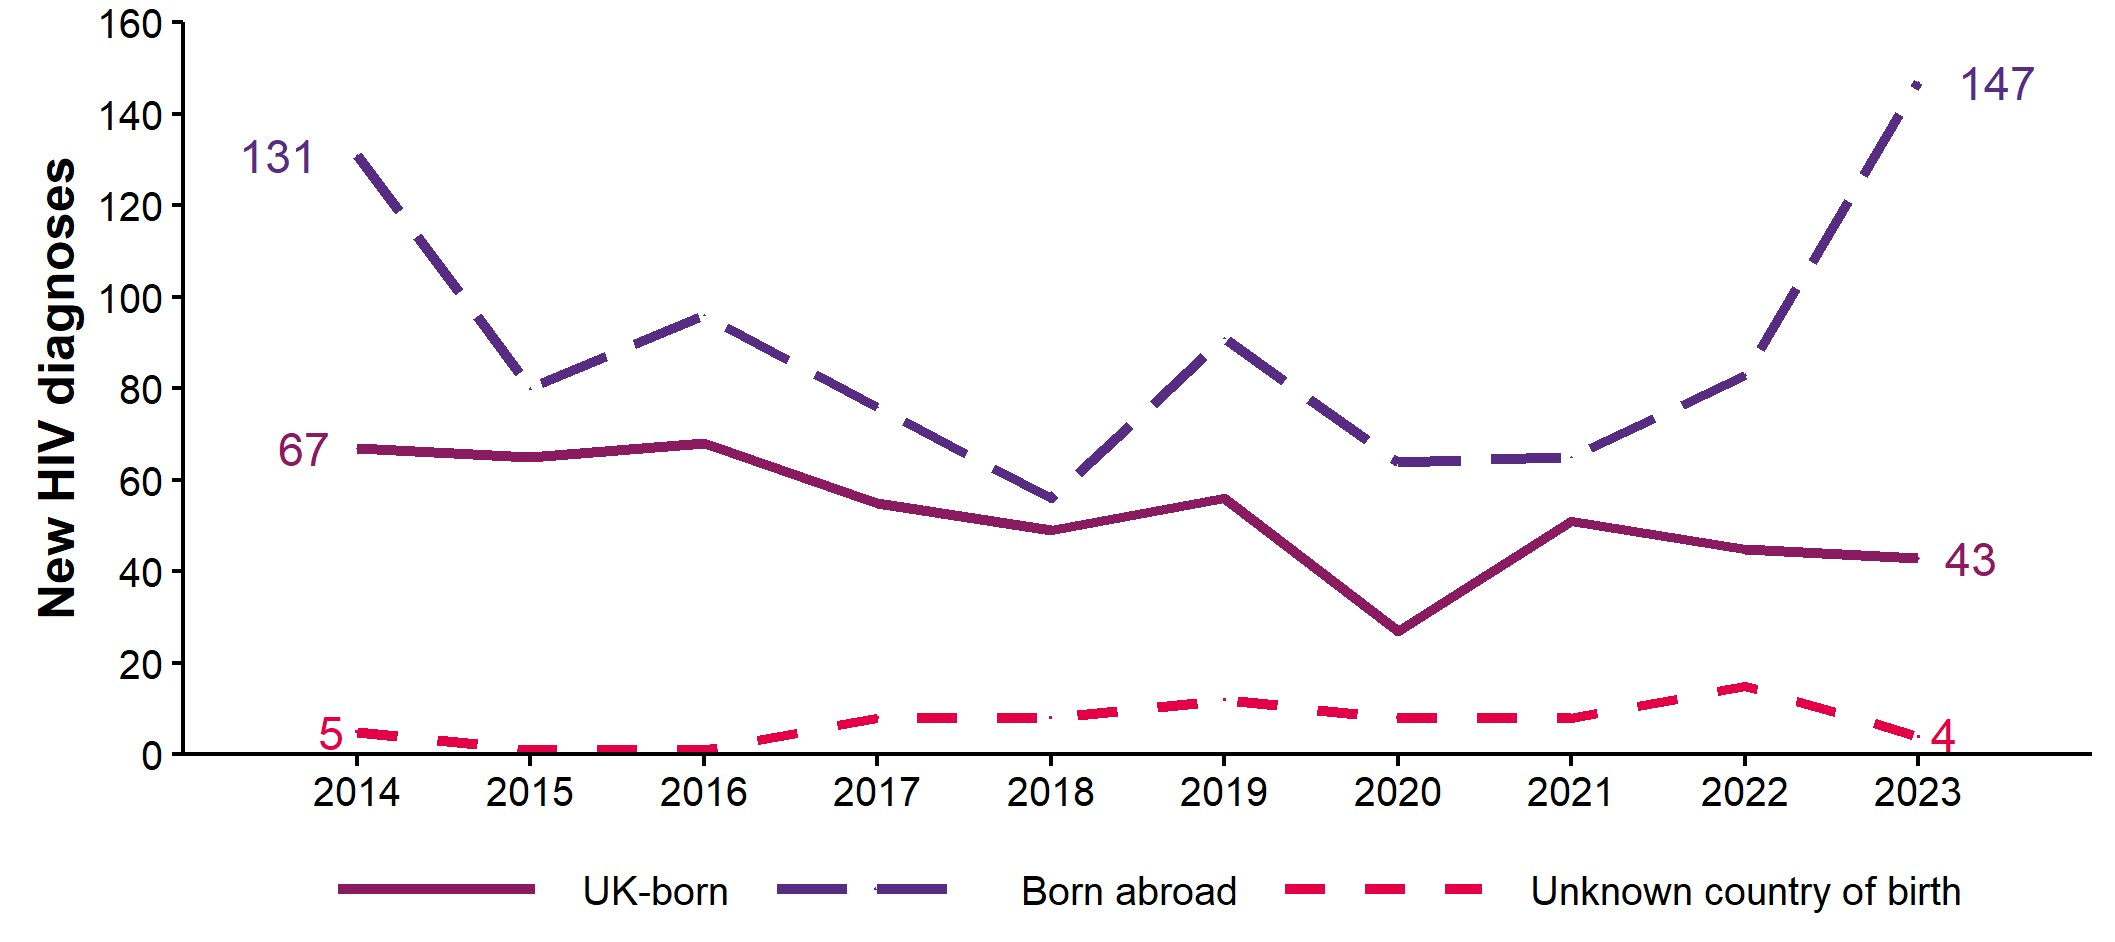
Figure 10b. New HIV diagnoses in heterosexuals not previously diagnosed abroad by whether born abroad, South East residents, 2014 to 2023 [note 1]
Sources: UKHSA, HANDD.
The number of new diagnoses will depend on accessibility of testing as well as infection and transmission.
Note 1: numbers may rise as further reports are received and more information is obtained. This is more likely to affect more recent years, particularly 2023.
Figure 10b is a line chart showing the number of new HIV diagnoses in heterosexual South East residents not previously diagnosed abroad by whether born abroad or not for the 10-year period 2014 to 2023.
For UK-born heterosexuals, the number of new HIV diagnoses decreased by 36% from 67 in 2014 to 43 in 2023, and by 4% from 45 in 2022. For heterosexuals born abroad, the number of new HIV diagnoses increased by 12% from 131 in 2014 to 147 in 2023, and by 77% from 83 in 2022.
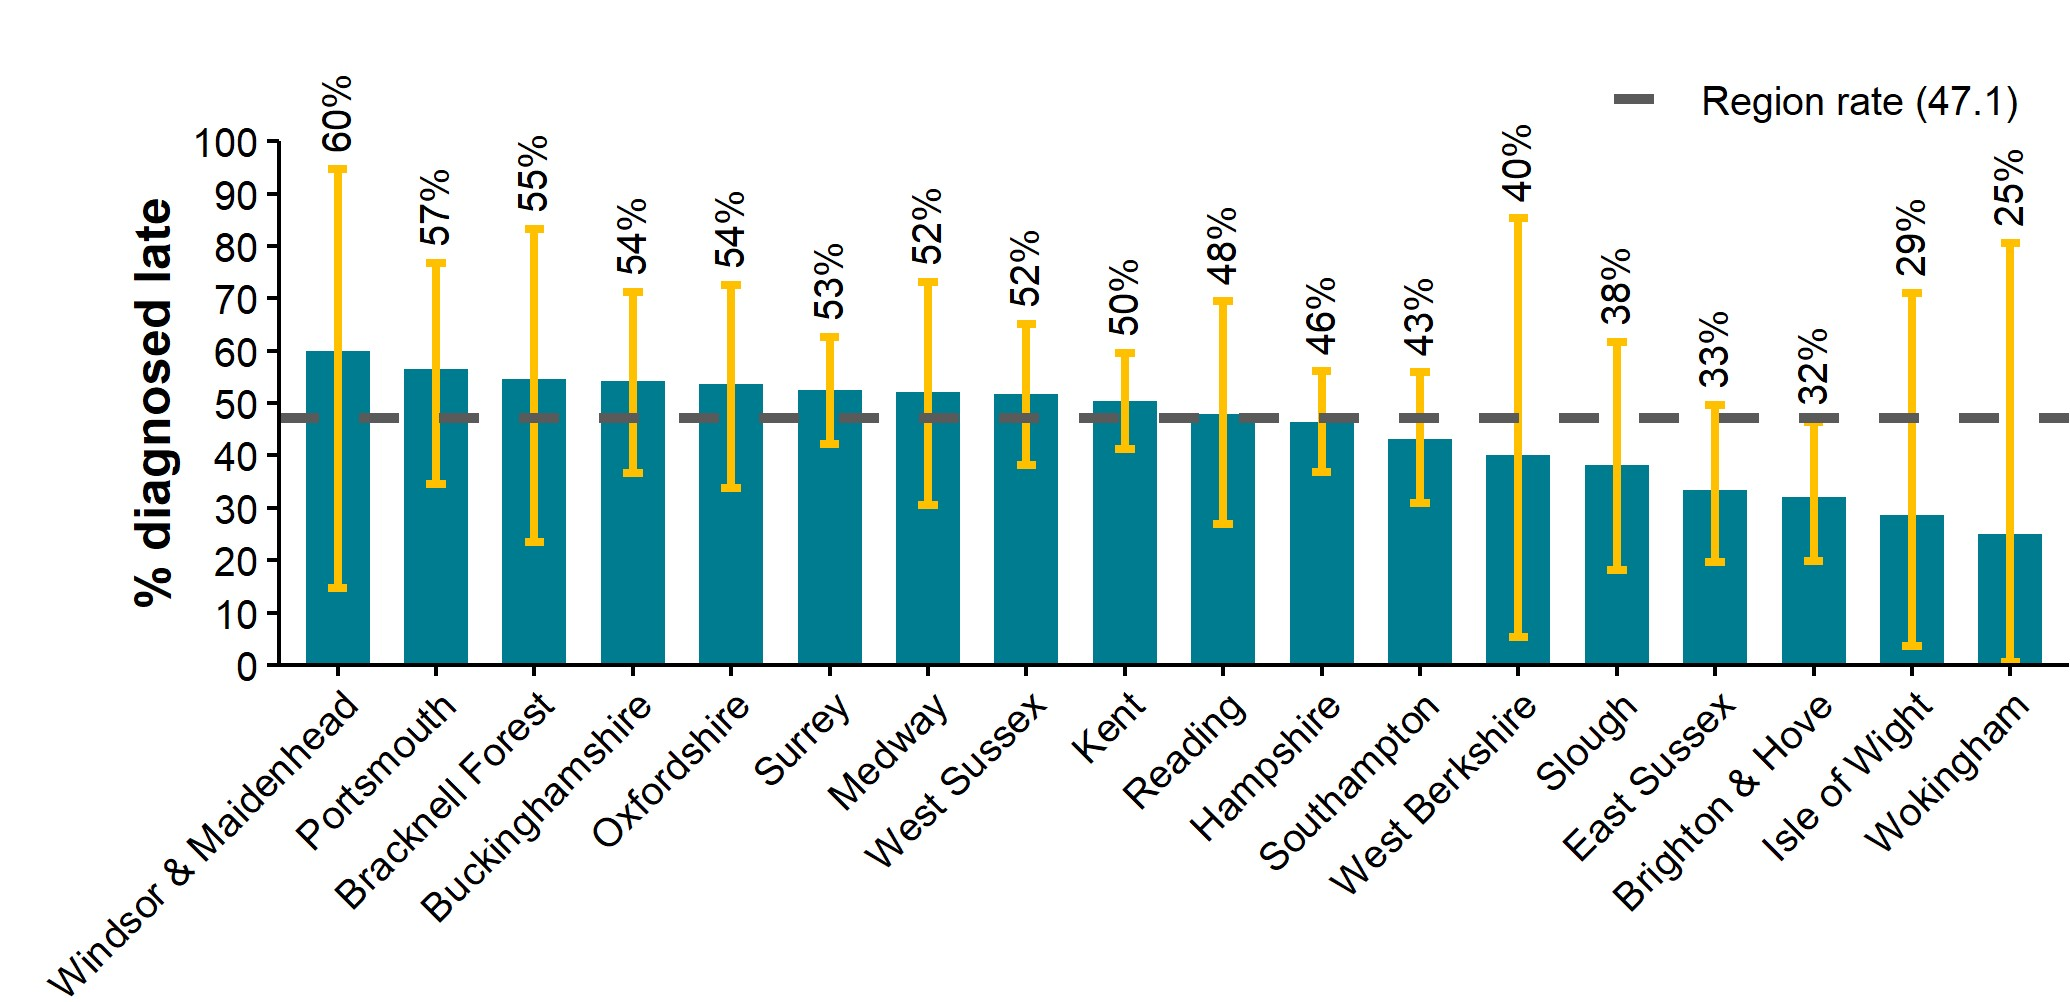
Figure 11. Percentage of new HIV diagnoses, by local authority of residence, that were diagnosed late, South East, aged 15 years and over, 2021 to 2023 [note 2]
Sources: UKHSA, HIV and AIDS New Diagnoses and Deaths (HANDD), HIV and AIDS Reporting System (HARS).
Note 2: only includes new diagnoses in those aged 15 years or older with no prior diagnosis abroad and for which a CD4 count was reported within 91 days of diagnosis; late diagnosis defined as CD4 count <350 cells/mm3. The underlying population will impact on the proportion diagnosed late, for example, GBMSM are less likely to be diagnosed late.
Figure 11 is a column chart showing the percentage of new HIV diagnoses that were diagnosed late in South East residents aged 15 years and over, by local authority, for the period 2021 to 2023. It is important to be aware that the proportions are sensitive to the geographical distribution of different acquisition groups. Local authorities with higher proportions of GBMSM tend to have a lower percentage of late diagnoses due to greater awareness of HIV and higher testing rates. In addition, confidence intervals are wide and tend to be wider for local authorities with fewer new HIV diagnoses.
Windsor and Maidenhead (60%) and Portsmouth (57%) had the highest percentages of late diagnoses, while Wokingham (25%) and Isle of Wight (29%) had the lowest percentages of late diagnoses.
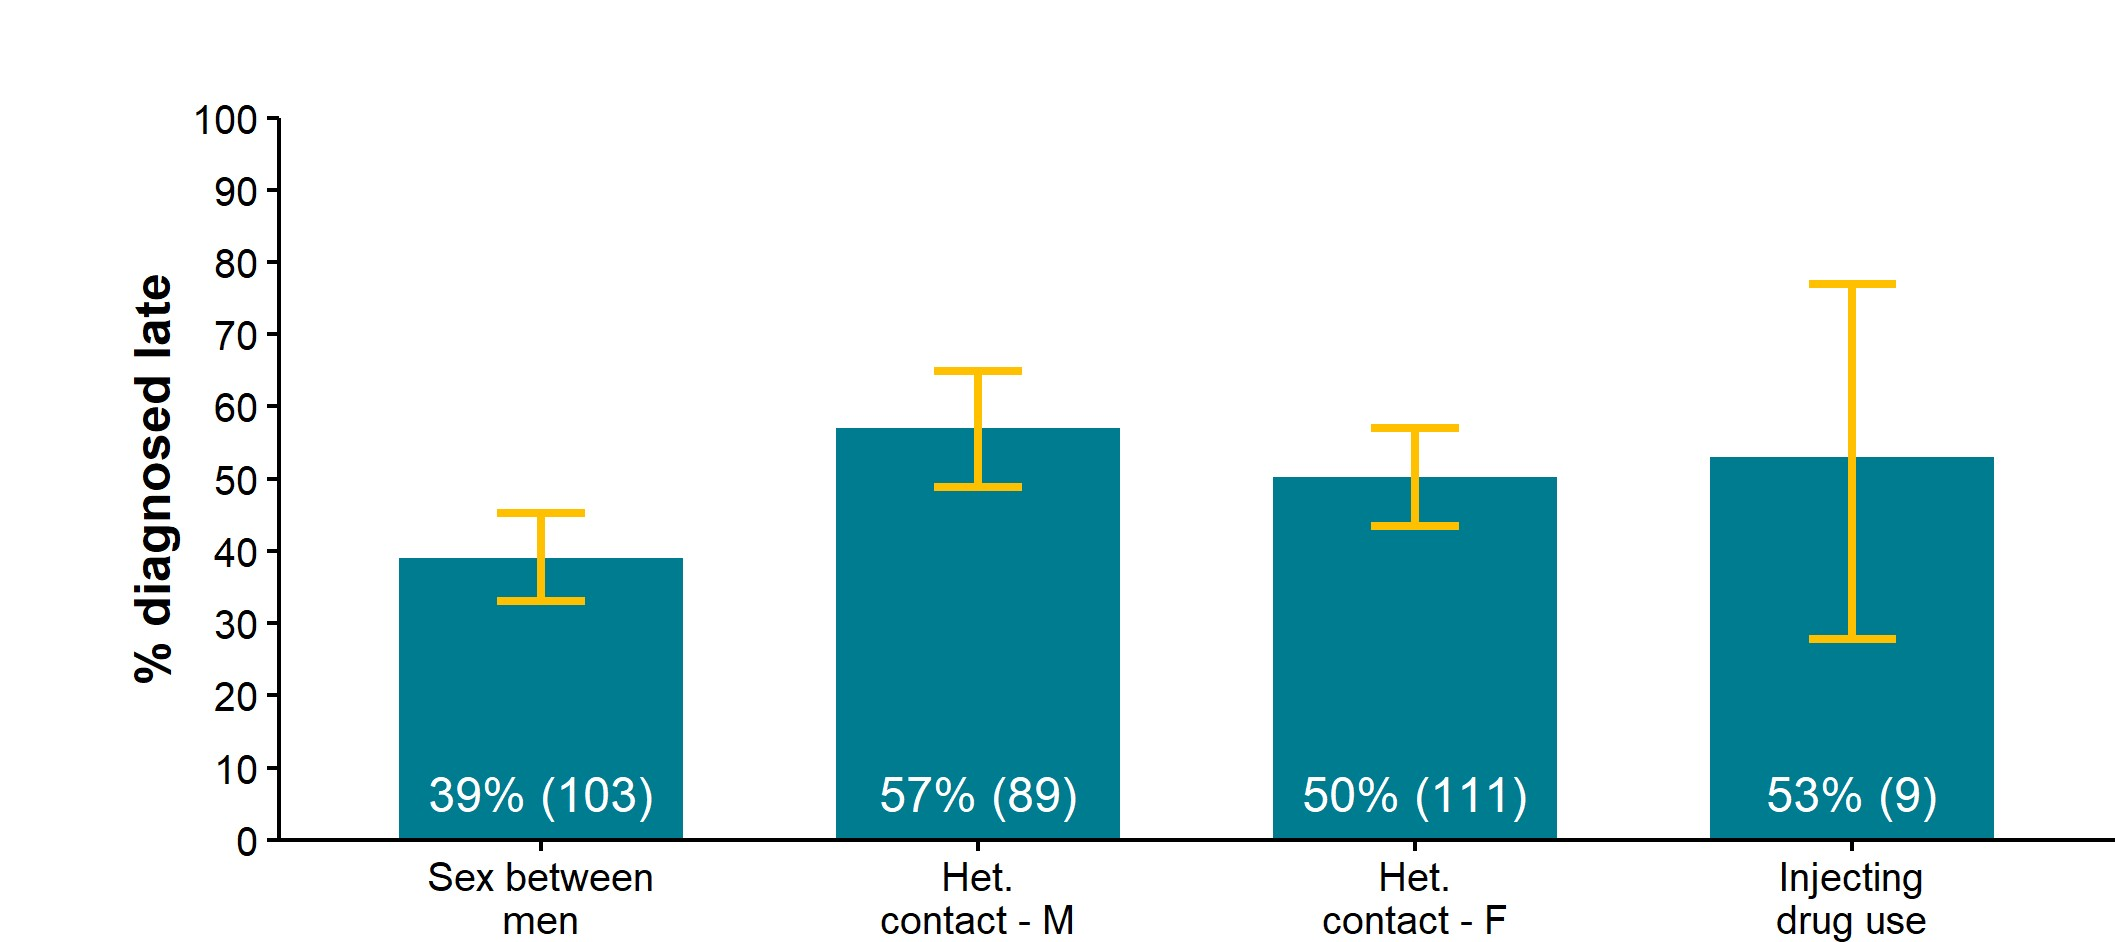
Figure 12a. Percentage and number of new HIV diagnoses by probable route of acquisition that were diagnosed late, South East residents, aged 15 years and over, 2021 to 2023 [note 3]
Sources: UKHSA, HIV and AIDS New Diagnoses and Deaths (HANDD), HIV and AIDS Reporting System (HARS).
Note 3: only includes new diagnoses in those aged 15 years or older with no prior diagnosis abroad and for which a CD4 count was reported within 91 days of diagnosis; late diagnosis defined as CD4 count <350 cells/mm3. Proportions are only shown for the sex between men, heterosexual contact (males), heterosexual contact (females) and injecting drug use exposure groups and are withheld for any of these categories if they contain fewer than 5 late diagnoses.
Figure 12a is a column chart showing the percentage and number of new HIV diagnoses, estimated to have been made late, by probable route of acquisition, in South East residents aged 15 years and over, for the period 2021 to 2023.
Men who likely acquired HIV via sex between men were least likely to be diagnosed late (39%). This reflects the greater engagement with sexual health services and higher testing rates among GBMSM. GBMSM residents in the South East were slightly more likely to be diagnosed late than those resident in the rest of England (34%).
A late diagnosis was more common for both men and women who likely acquired HIV through heterosexual contact, with men having a higher percentage (57%) than women (50%). There are additional opportunities to be diagnosed for some women (eg, via antenatal services), and this may contribute to some of the difference in the proportion of late diagnoses between heterosexual men and women.
Heterosexual men resident in the South East had the same likelihood of being diagnosed late as those resident in the rest of England (57% in the South East, compared to 57% elsewhere in England). Heterosexual women resident in the South East had a higher percentage of diagnoses being late than those resident in the rest of England (50% in the South East, compared to 46% elsewhere in England).
The percentage of late diagnoses was 53% for those who likely acquired HIV via injecting drug use. The number of new HIV diagnoses in this group is smaller and the confidence interval is much larger compared to the other groups.
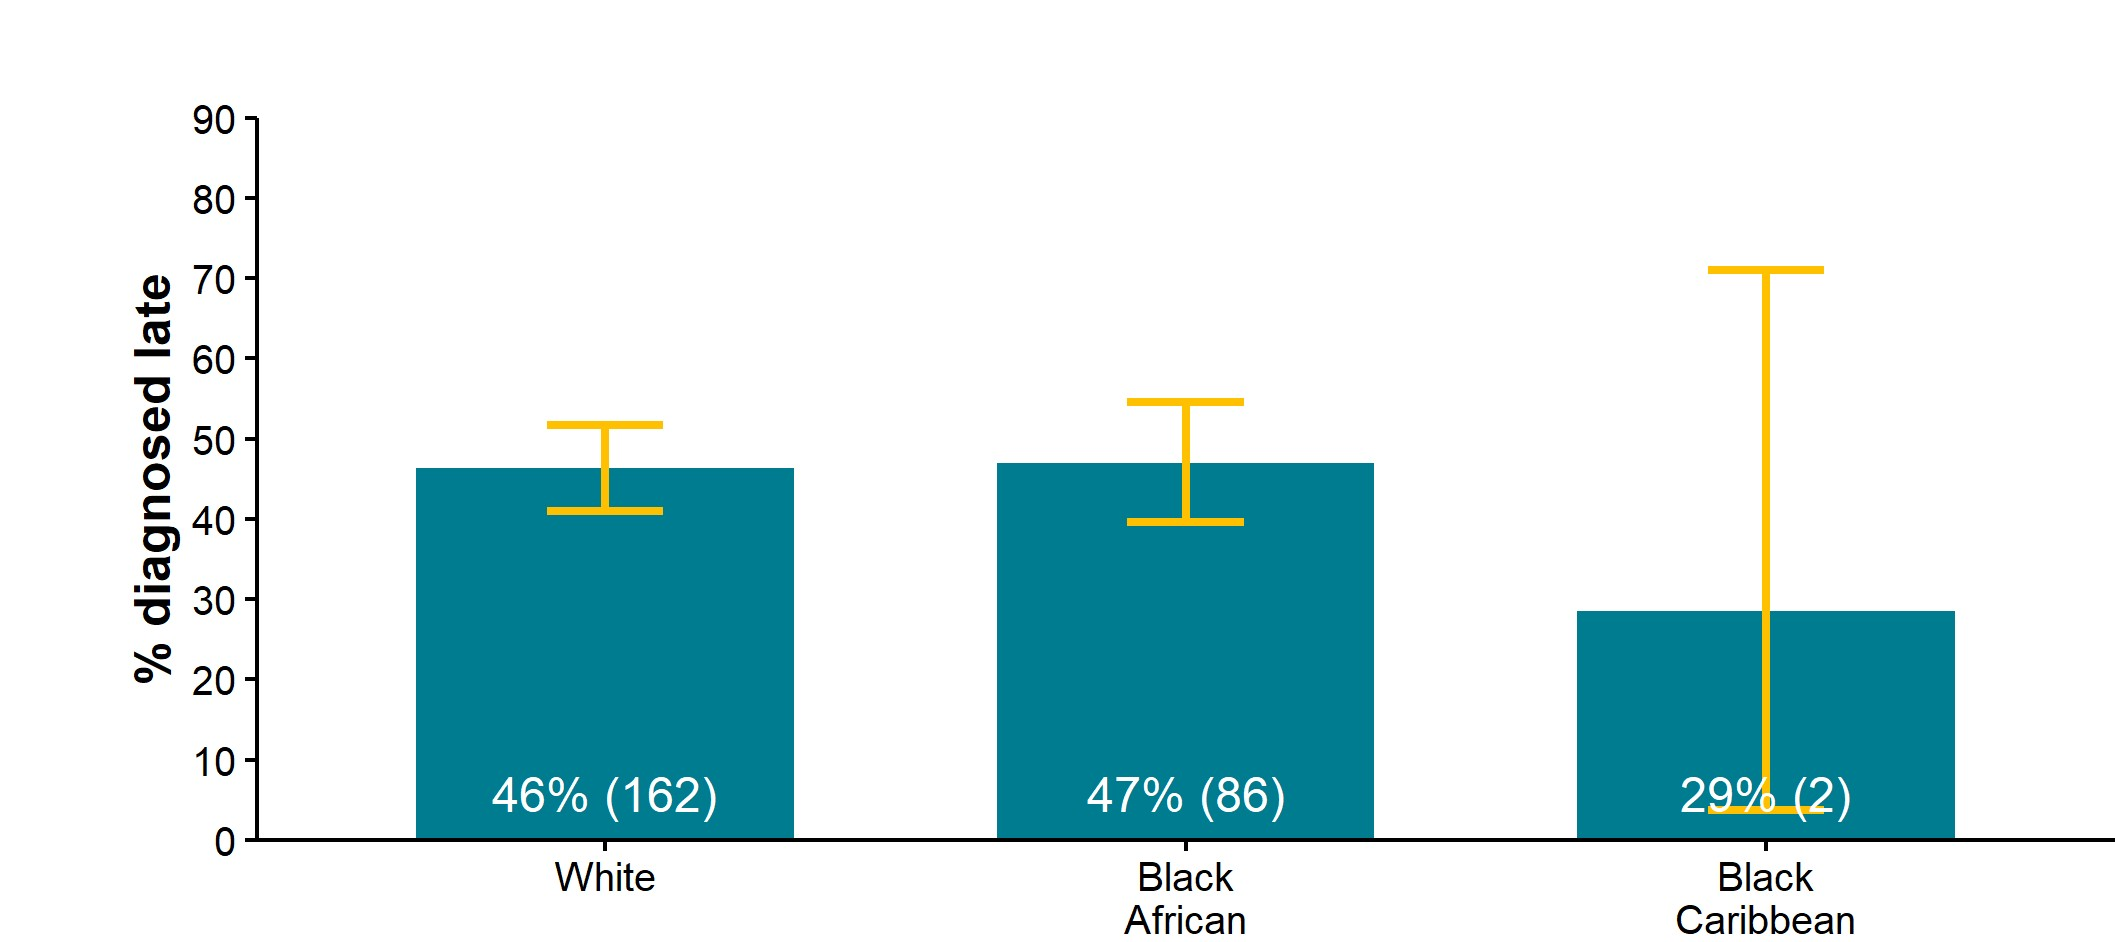
Figure 12b. Percentage and number of new HIV diagnoses by ethnic group that were diagnosed late, South East residents, aged 15 years and over, 2021 to 2023 [note 4]
Sources: UKHSA, HIV and AIDS New Diagnoses and Deaths (HANDD), HIV and AIDS Reporting System (HARS).
Note 4: only includes new diagnoses in those aged 15 years or older with no prior diagnosis abroad and for which a CD4 count was reported within 91 days of diagnosis; late diagnosis defined as CD4 count <350 cells/mm3. Proportions are only shown for the White, Black African and Black Caribbean ethnic groups and are withheld for any of these ethnic group categories if they contain fewer than 5 late diagnoses. IPB means Indian/Pakistani/Bangladeshi.
Figure 12b is a column chart showing the percentage and number of new HIV diagnoses estimated to have been made late by ethnic group in South East residents aged 15 years and over for the period 2021 to 2023.
The Black African ethnic group and the White ethnic group had 47% and 46% of HIV diagnoses estimated to be late, respectively. The Black Caribbean ethnic group had 29% of diagnoses estimated to be late. However, the confidence interval for the Black Caribbean group is much wider than for the other ethnic groups due to fewer diagnoses.
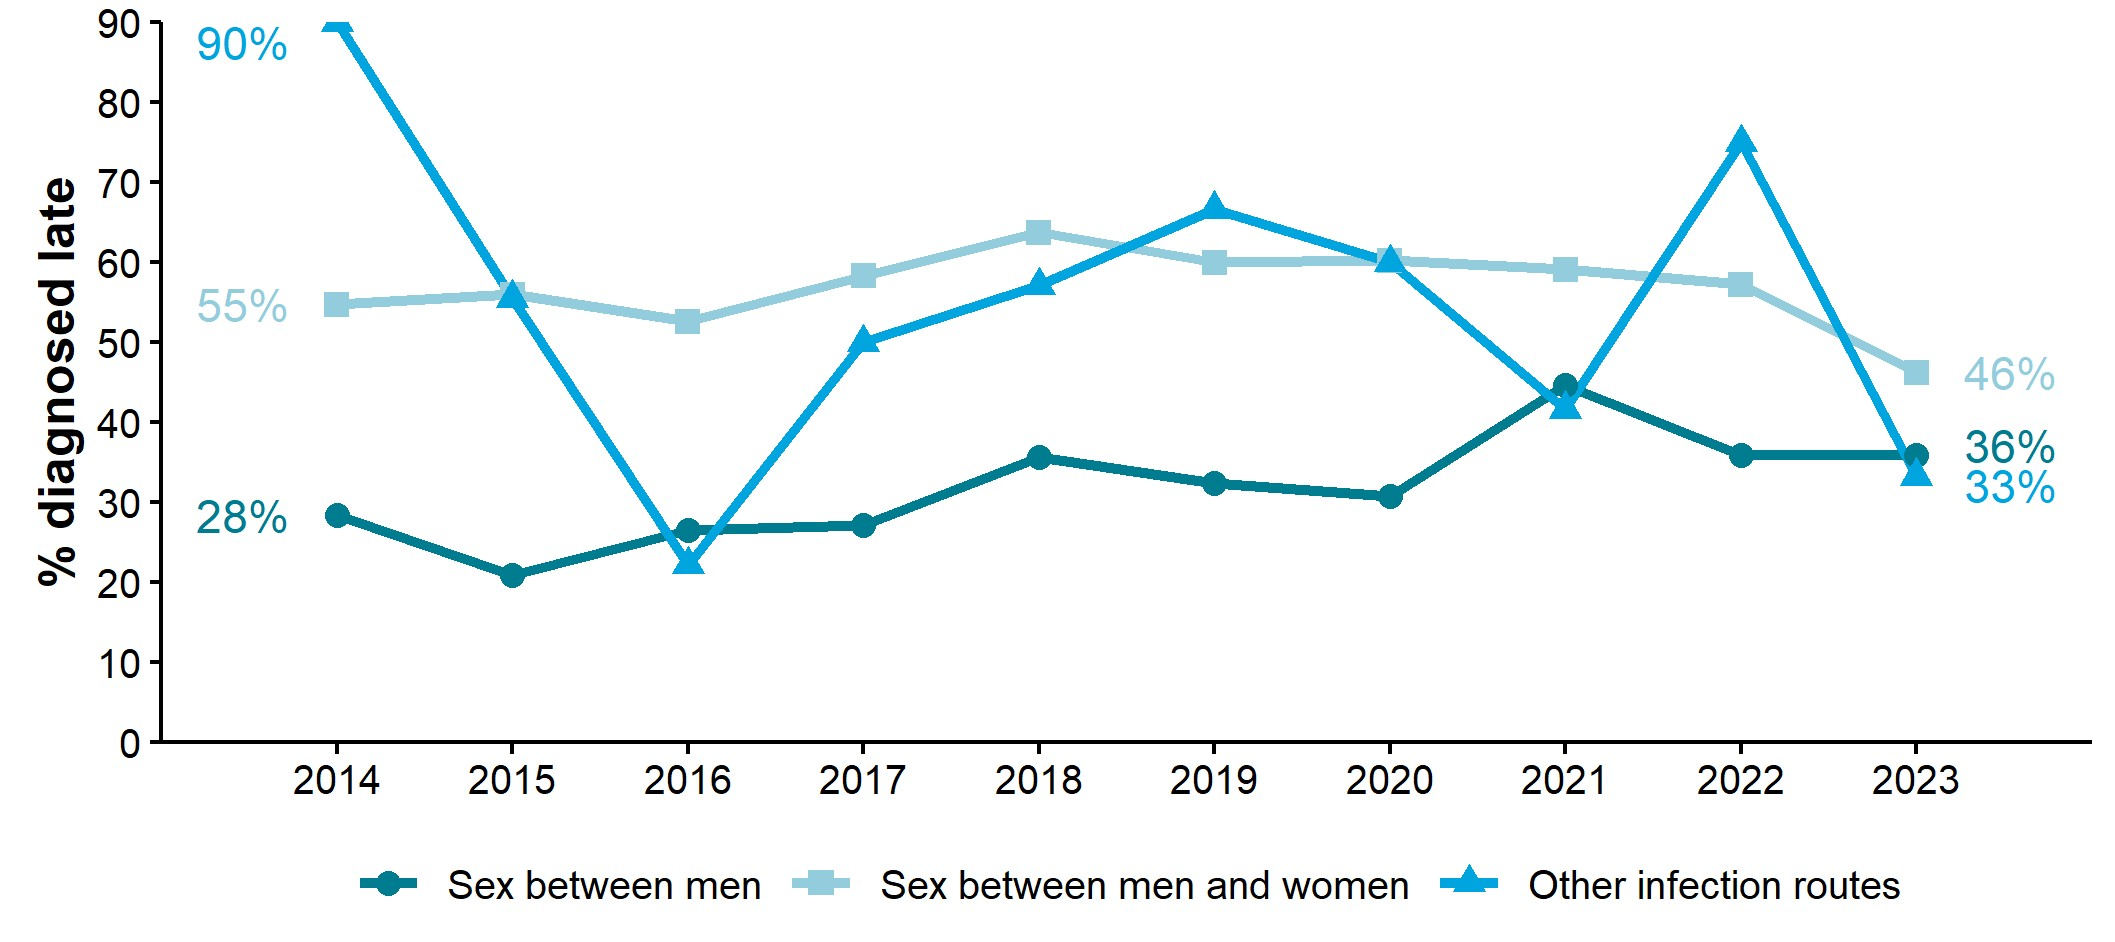
Figure 13. Percentage of new HIV diagnoses that were diagnosed late by probable route of acquisition and year of first UK HIV diagnosis, South East residents, aged 15 years and over, 2014 to 2023 [note 5]
Sources: UKHSA, HIV and AIDS New Diagnoses and Deaths (HANDD), HIV and AIDS Reporting System (HARS).
Note 5: only includes new diagnoses in those aged 15 years or older with no prior diagnosis abroad and for which a CD4 count was reported within 91 days of diagnosis; late diagnosis defined as CD4 count <350 cells/mm3.
Figure 13 is a line chart showing the percentage of new HIV diagnoses estimated to have been made late, by probable route of acquisition and year of first UK HIV diagnosis, in South East residents aged 15 years and over, between 2014 and 2023. Percentages in this chart can be less robust and should be interpreted as indicative of broad trends only as numbers in individual years are sometimes small.
For the period 2014 to 2023, a CD4 count within 91 days of diagnosis was available for 82% of diagnoses where the route of acquisition was likely to be sex between men, 82% of diagnoses where it was likely to be sex between men and women, and 75% of diagnoses where HIV was likely to have been acquired through other routes.
The percentage of late diagnoses for likely HIV acquisition via sex between men increased from 28% in 2014 to 36% in 2023. The percentage of late diagnoses for HIV acquisition via sex between men and women decreased from 55% in 2014 to 46% in 2023. The percentage of late diagnoses for HIV acquisition through other infection routes fluctuated over the period, and decreased from 90% in 2014 to 33% in 2023.
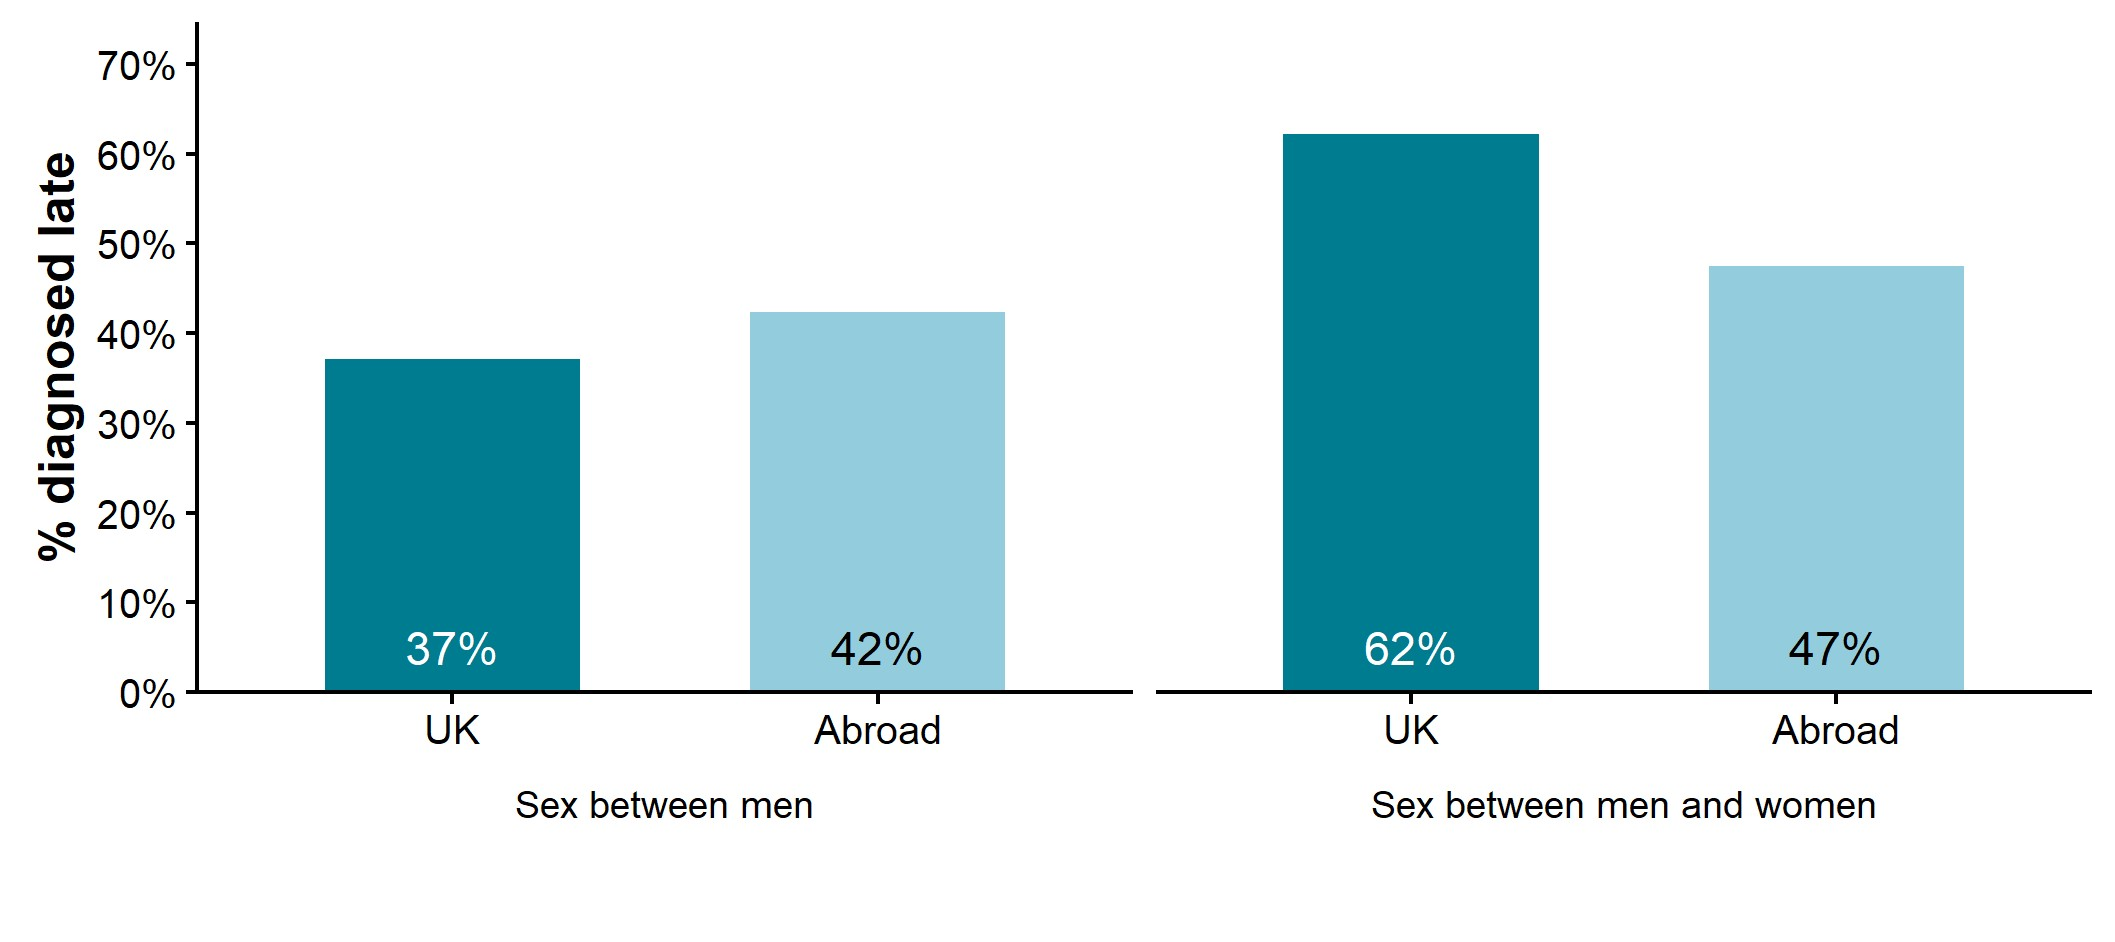
Figure 14. Percentage of new HIV diagnoses that were diagnosed late in GBMSM and heterosexuals by whether born abroad, South East residents, aged 15 years and over, 2021 to 2023 [note 5]
Sources: UKHSA, HIV and AIDS New Diagnoses and Deaths (HANDD), HIV and AIDS Reporting System (HARS).
Note 5: only includes new diagnoses in those aged 15 years or older with no prior diagnosis abroad and for which a CD4 count was reported within 91 days of diagnosis; late diagnosis defined as CD4 count <350 cells/mm3.
Figure 14 is a column chart showing the percentage of new HIV diagnoses estimated to have been made late by whether born in the UK or abroad, for GBMSM and heterosexual South East residents aged 15 years and over, between 2021 and 2023.
Among GBMSM, 37% of diagnoses were estimated to have been made late in those born in the UK and 42% of diagnoses in those born abroad. Among heterosexuals, 62% of diagnoses were estimated to have been made late in those born in the UK and 47% of diagnoses in those born abroad.
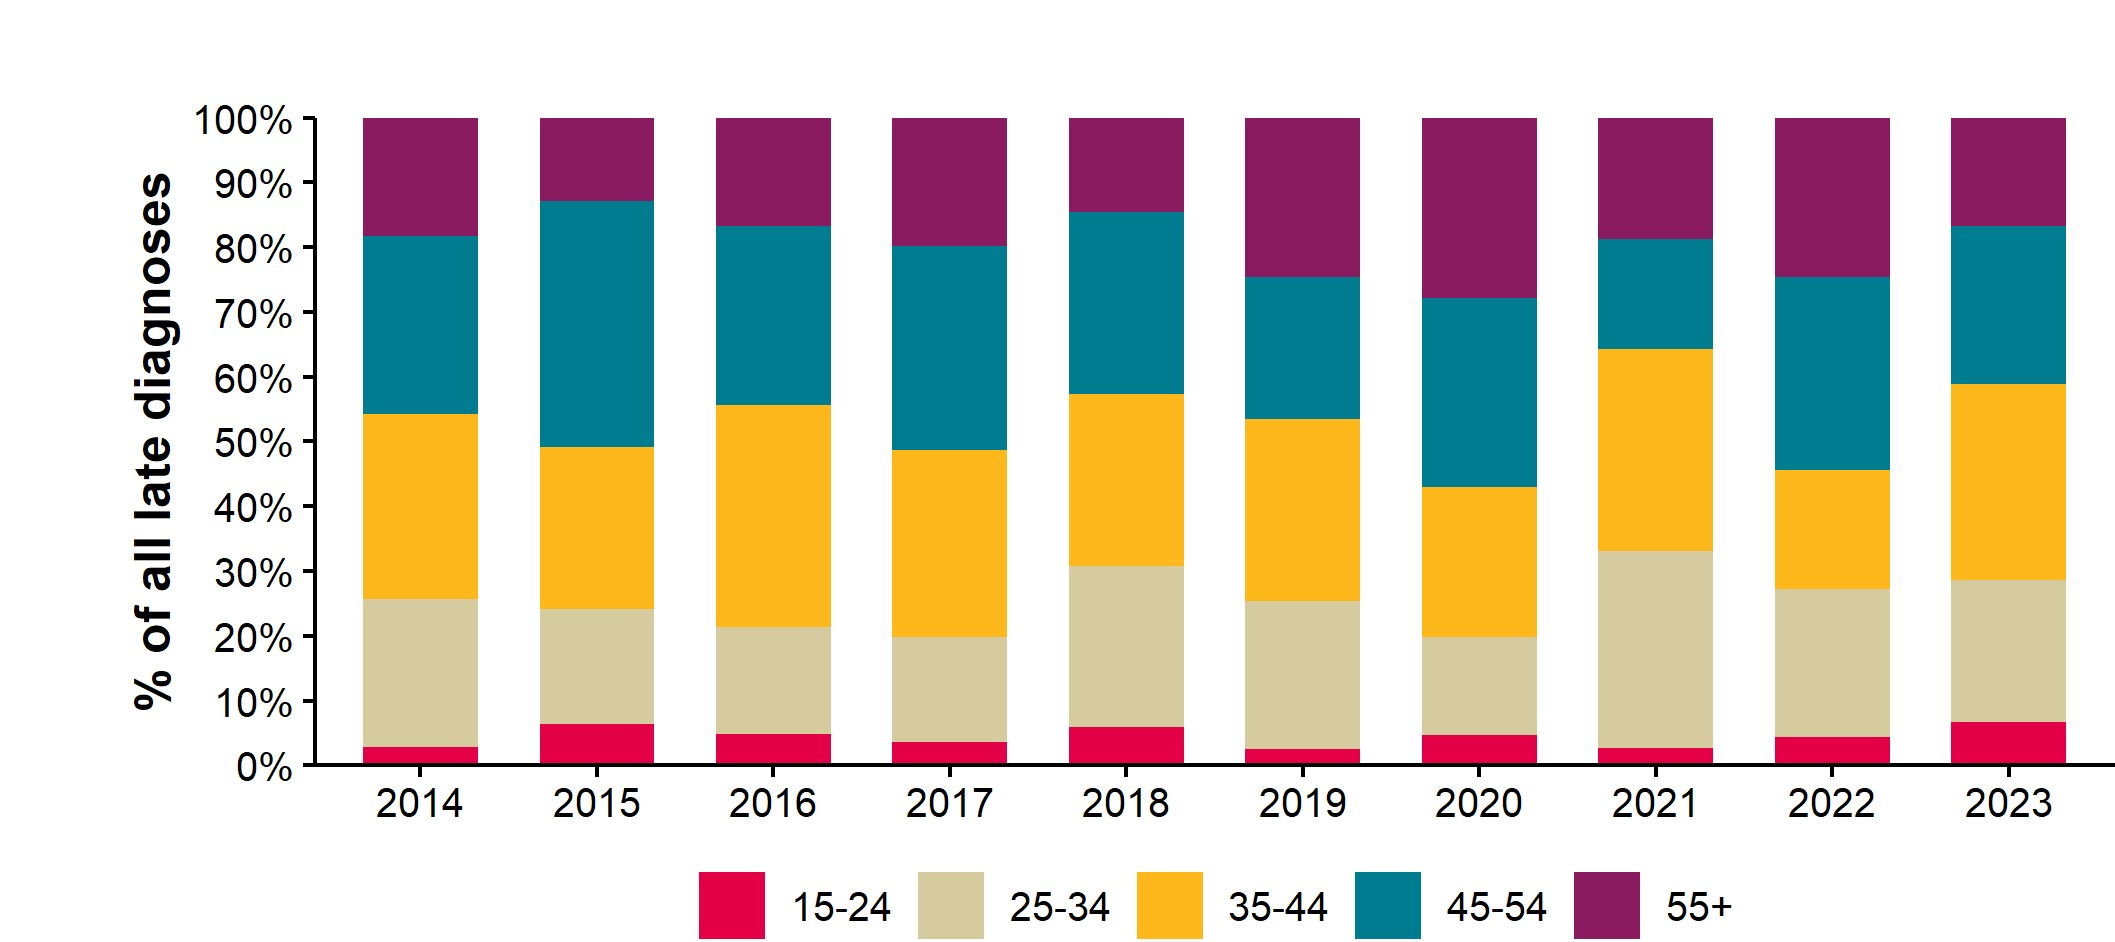
Figure 15a. Age distribution of new HIV diagnoses that were diagnosed late by year of first UK HIV diagnosis, South East residents, aged 15 years and over, 2014 to 2023 [note 5]
Sources: UKHSA, HIV and AIDS New Diagnoses and Deaths (HANDD), HIV and AIDS Reporting System (HARS).
Note 5: only includes new diagnoses in those aged 15 years or older with no prior diagnosis abroad and for which a CD4 count was reported within 91 days of diagnosis; late diagnosis defined as CD4 count <350 cells/mm3.
Figure 15a is a column chart showing the percentage of new HIV diagnoses estimated to have been made late, by age distribution and year of first UK HIV diagnosis, in South East residents aged 15 years and over, between 2014 and 2023. Unlike the previous charts showing late HIV diagnoses, the percentages in this chart indicate the proportion of late diagnoses by age distribution rather than showing the proportion of all diagnoses that were diagnosed late. Percentages in this chart are less robust and should be interpreted as indicative of broad trends only as they are by single year and numbers may be small when broken down by age group.
Those aged 15 to 24 years accounted for the smallest proportion of late diagnoses in each year over the 10-year period. In 2023, those aged 35 to 44 years represented the largest proportion of late diagnoses, followed by those aged 45 to 54 years and 25 to 34 years. Those aged 55 years and above represented the second smallest proportion.
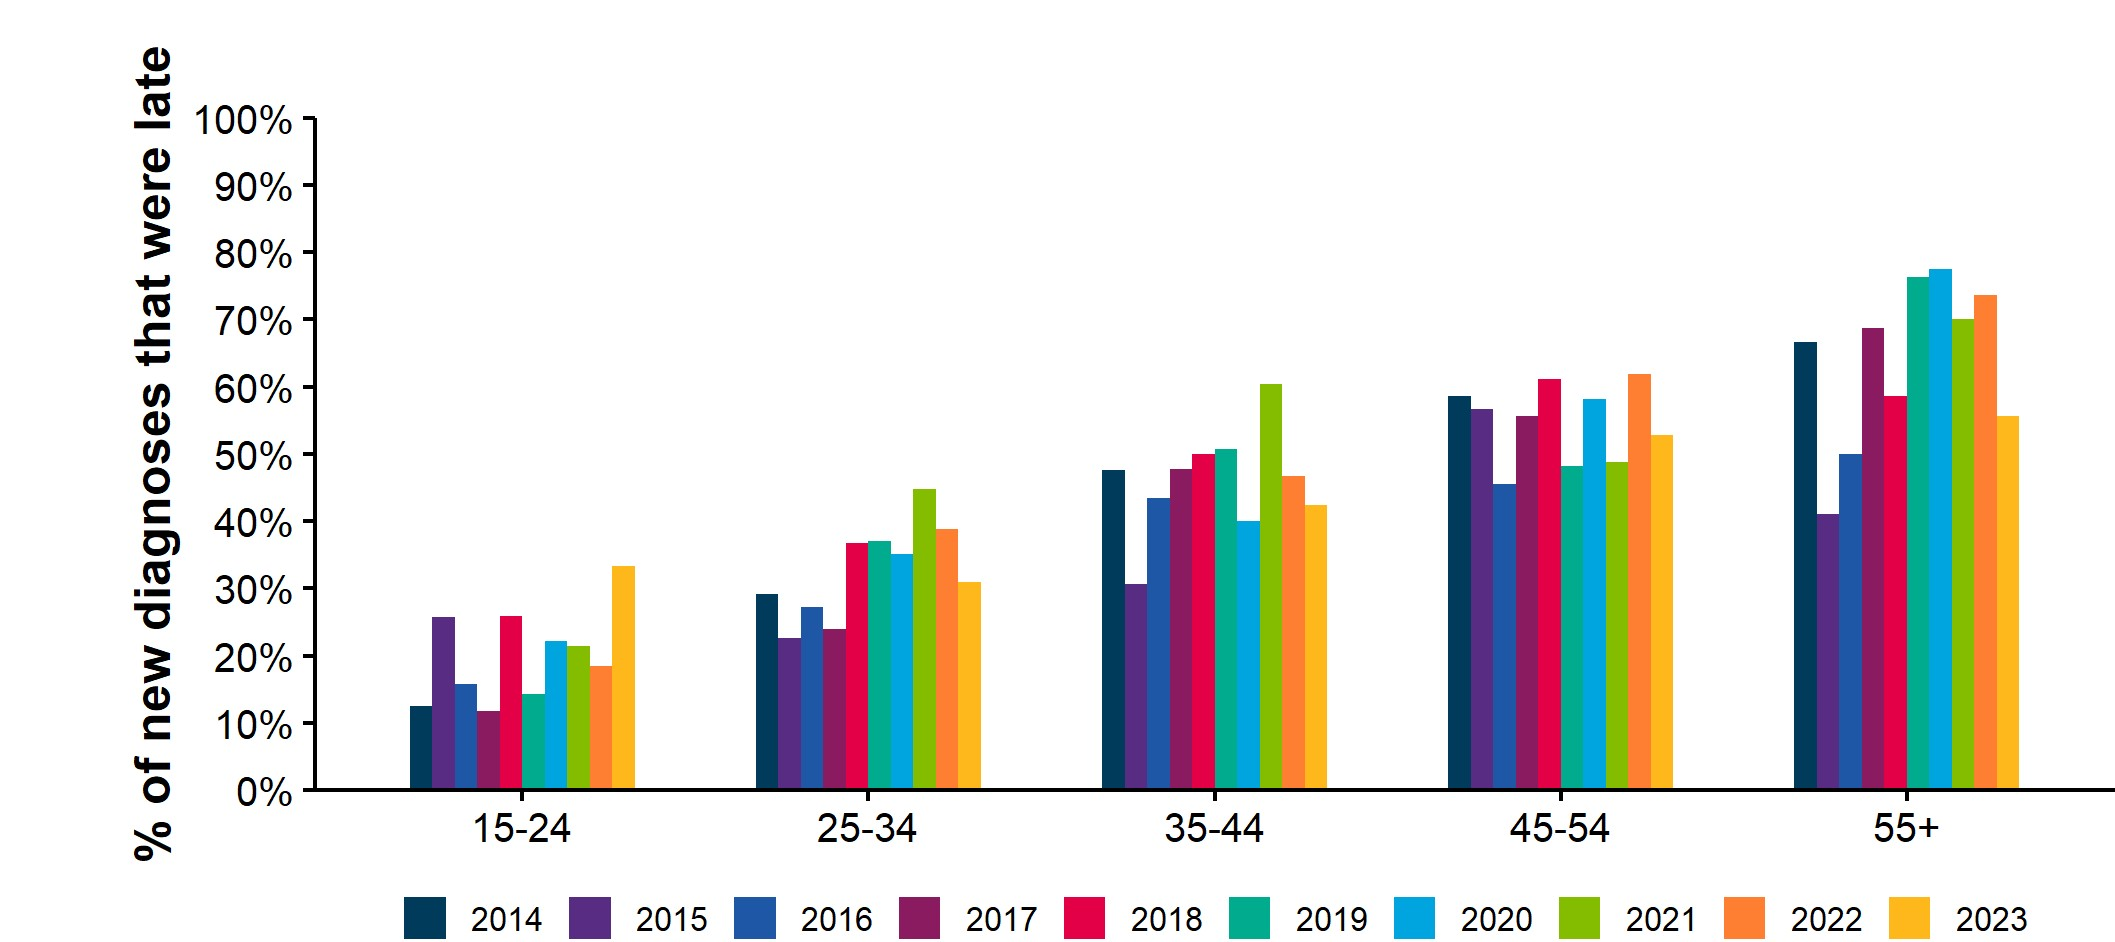
Figure 15b. Percentage of all new diagnoses that were late by age by year of first UK HIV diagnosis, South East residents, aged 15 years and over, 2014 to 2023 [note 5]
Sources: UKHSA, HIV and AIDS New Diagnoses and Deaths (HANDD), HIV and AIDS Reporting System (HARS).
Note 5: only includes new diagnoses in those aged 15 years or older with no prior diagnosis abroad and for which a CD4 count was reported within 91 days of diagnosis; late diagnosis defined as CD4 count <350 cells/mm3.
Figure 15b is a column chart showing the percentage of new HIV diagnoses estimated to have been made late, by age distribution and year of first UK HIV diagnosis, in South East residents aged 15 years and over, between 2014 and 2023. Percentages in this chart are less robust and should be interpreted as indicative of broad trends only as they are by single year and numbers may be small when broken down by age group.
All the age groups showed some fluctuation over the 10-year period. The older age groups tended to have a higher percentage of diagnoses being late. Only the 15 to 24 year age group and the 25 to 34 year age group had a higher percentage of late diagnoses in 2023 compared to 2014.
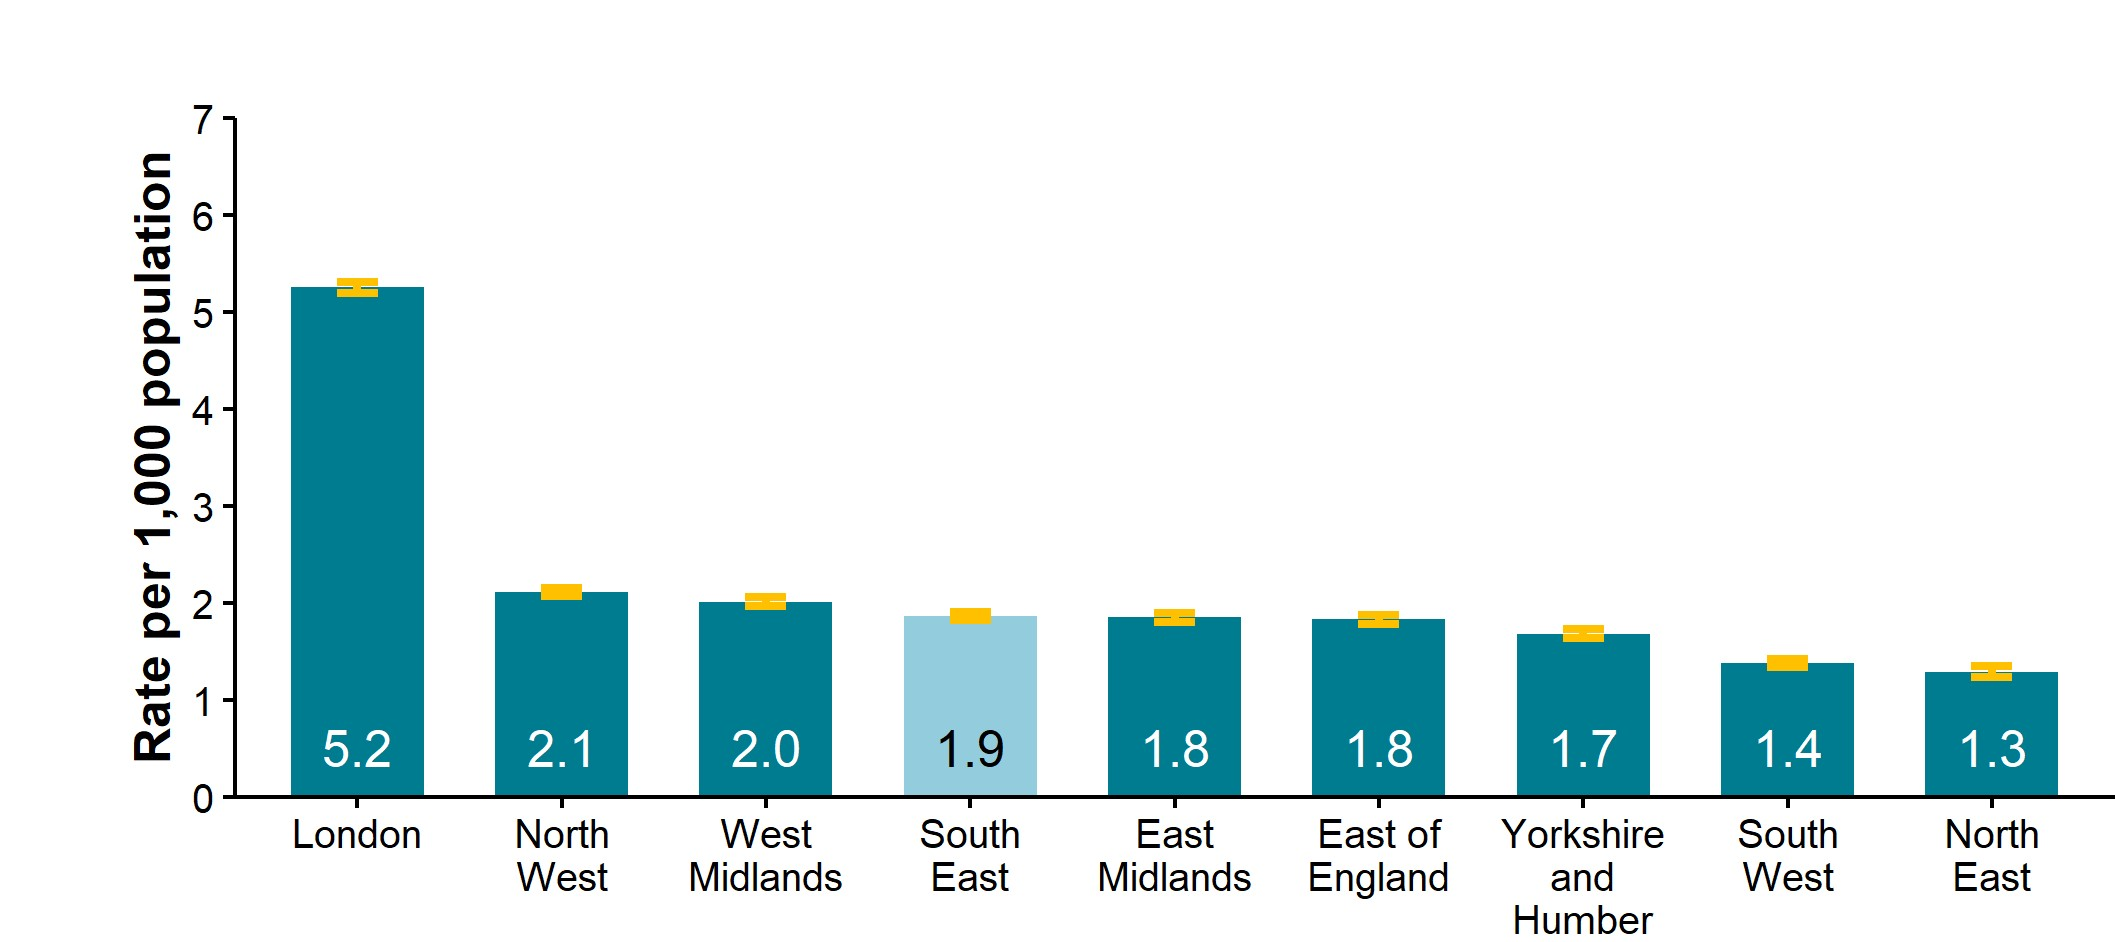
Figure 16. Diagnosed HIV prevalence per 1,000 residents aged 15 to 59 years by UKHSA region, 2023
Sources: UKHSA, HIV and AIDS Reporting System (HARS).
Figure 16 is a column chart showing the prevalence of diagnosed HIV as a rate per 1,000 residents aged 15 to 59 years by English region in 2023.
The South East had the fourth highest rate (1.9). London had the highest rate (5.2), followed by the North West (2.1) and the West Midlands (2.0). The North East had the lowest rate (1.3) and the South West had the second lowest rate (1.4).
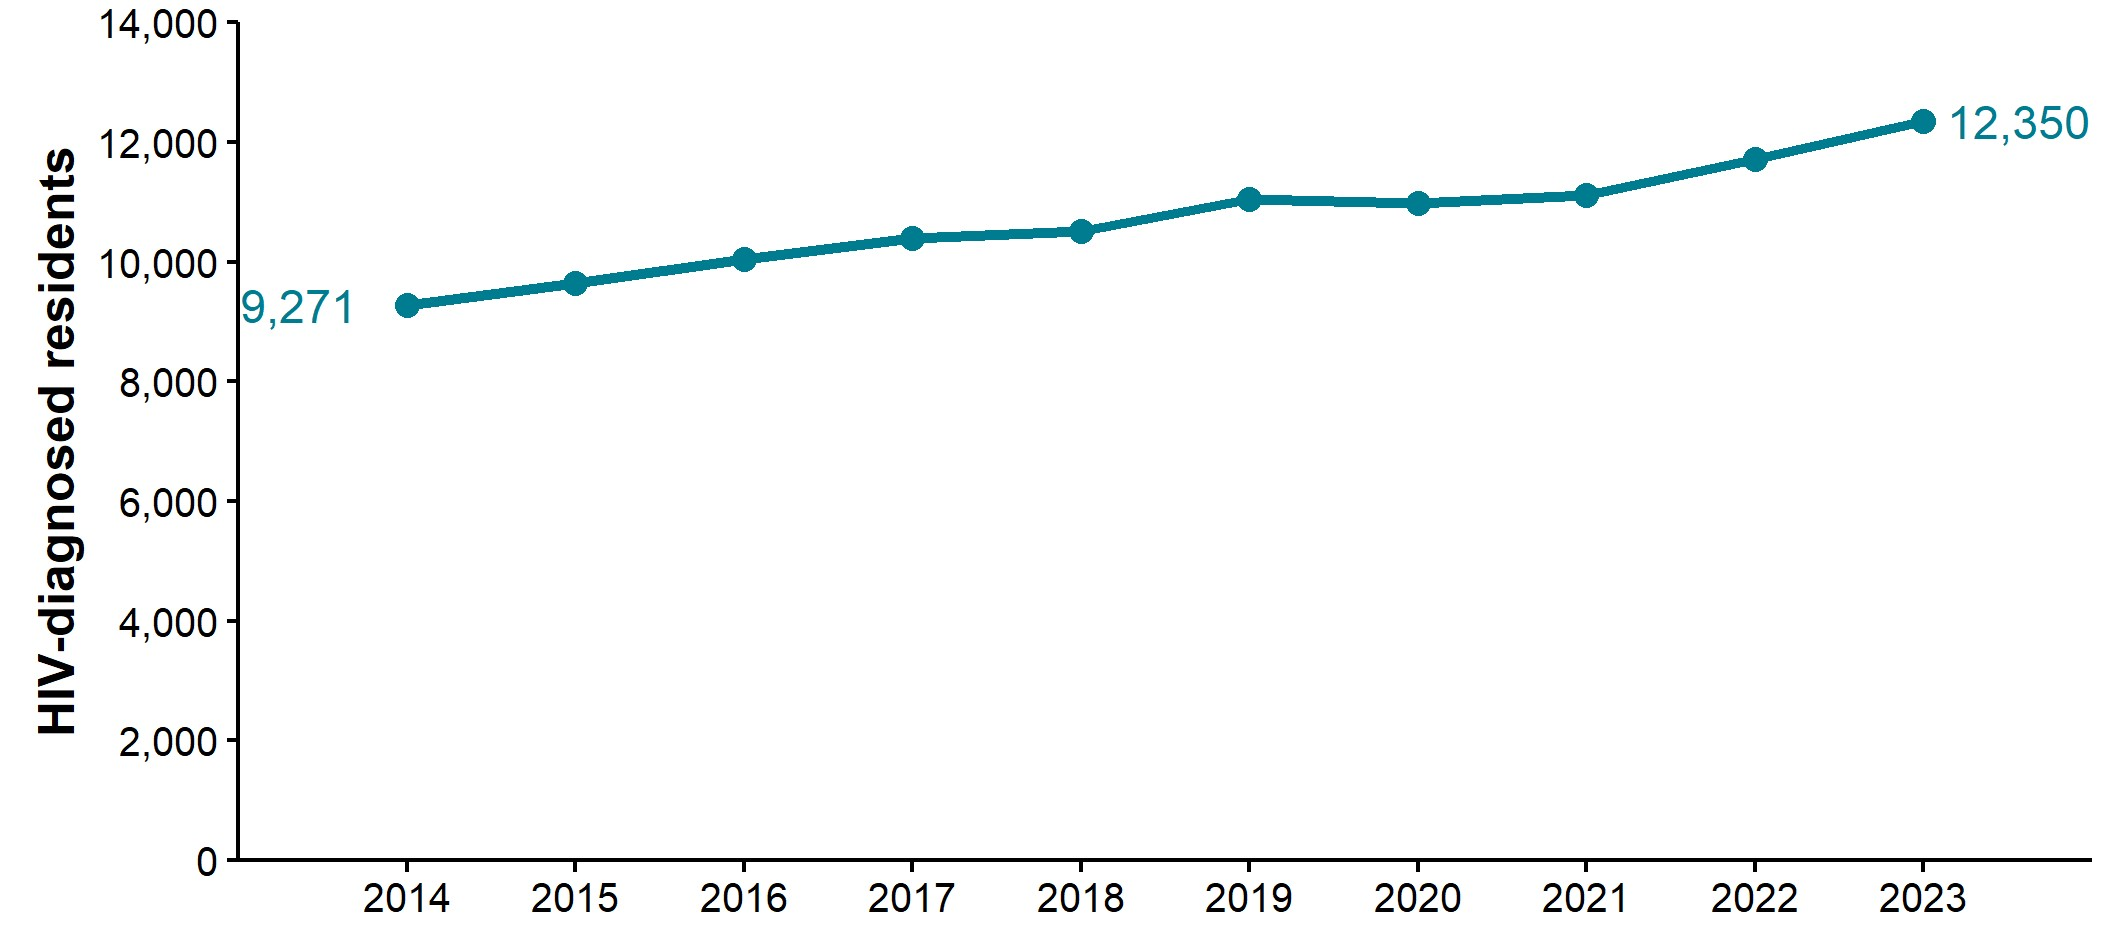
Figure 17. Number of residents living with diagnosed HIV and accessing care, the South East, 2014 to 2023
Sources: UKHSA, HIV and AIDS Reporting System (HARS).
Figure 17 is a line chart showing the number of South East residents living with diagnosed HIV and accessing HIV-related care between 2014 and 2023. This number acts as a proxy for the number of people living with diagnosed HIV as everyone living with diagnosed HIV in the UK can access care for free.
The line reflects changes in new HIV diagnoses, mortality in those living with diagnosed HIV and immigration patterns. The number may also have been affected by disruptions to care and changes in residence during the main COVID-19 pandemic year 2020. The number of residents living with HIV and accessing care increased from 9,271 in 2014 to 12,350 in 2023. This represents a 33% increase over the 10-year period. The number has mostly been increasing year-on-year, apart from a small reduction in 2020.
Figure 18. Number of residents living with diagnosed HIV and accessing care by probable route of acquisition (adjusted for missing route information), the South East, 2023
Sources: UKHSA, HIV and AIDS Reporting System (HARS).
Figure 18 is a column chart showing the number of South East residents living with diagnosed HIV and accessing HIV-related care by probable route of acquisition in 2023. The columns are arranged in descending order with regards to the number of residents.
In the South East, the most common routes of acquisition were sex between men and women (5,945) and sex between men (5,913). 211 South East residents likely acquired HIV through mother to child transmission (before or at birth or via breastfeeding), while 156 likely acquired HIV through injecting drug use, and 125 through blood products or as a healthcare worker.
Figure 19. Percentage of residents with diagnosed HIV who are accessing care in each age group, the South East, 2014 and 2023
Sources: UKHSA, HIV and AIDS Reporting System (HARS).
Figure 19 is a column chart showing the percentage of South East residents living with diagnosed HIV and accessing HIV-related care by age group in 2014 and 2023.
In 2014, the 35 to 49 year age group was the largest and accounted for 50% of people diagnosed and living with HIV. In 2023, the 50 years and over age group was the largest and accounted for 53% of people diagnosed and living with HIV. The 10-year comparison shows an ageing cohort as only the 50 years and over age group experienced an increase. Due to decreased transmission, fewer people acquire HIV, and due to effective treatment, fewer people diagnosed and living with HIV die prematurely.
Figure 20. Diagnosed HIV prevalence per 1,000 residents by ethnic group (all ages), the South East, 2023
Sources: UKHSA, HIV and AIDS Reporting System (HARS).
Figure 20 is a column chart showing the prevalence of diagnosed HIV as a rate per 1,000 South East residents in 2023. The data for this chart is not age-standardised and is thus sensitive to differences in age distribution.
The ethnic group with the highest rate was the Black African ethnic group (25.8 per 1,000), followed by the other Black and unspecified ethnic group (11.0), the Black Caribbean ethnic group (4.2), and the other and mixed ethnic group (2.1). The ethnic groups with the lowest rates were the Asian ethnic group (0.9) and the White ethnic group (0.9).
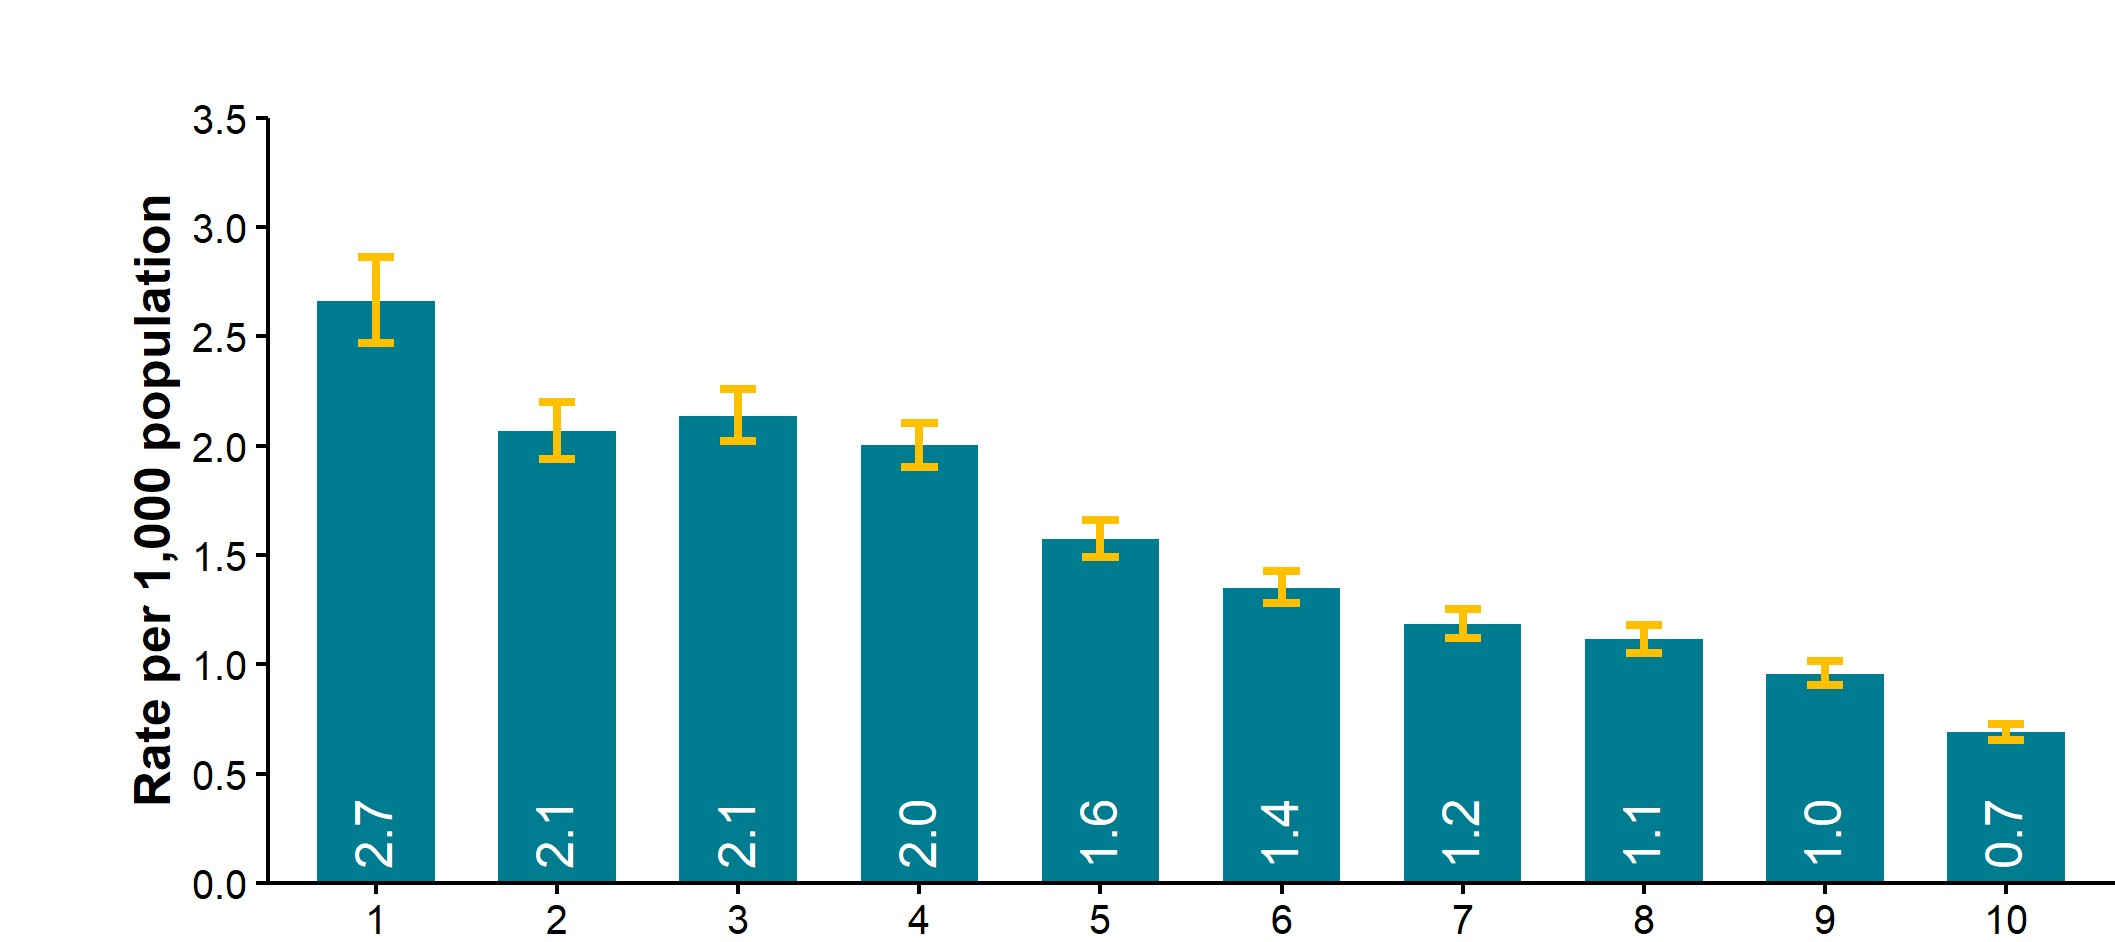
Figure 21. Diagnosed HIV prevalence per 1,000 residents by Index of Multiple Deprivation decile, the South East, 2023
Sources: UKHSA, HIV and AIDS Reporting System (HARS).
Figure 21 is a column chart showing diagnosed HIV as a rate per 1,000 South East residents by Index of Multiple Deprivation (IMD) decile in 2023. The deciles are calculated for England as a whole and use lower super output area (LSOA) of residence. The data for this chart is not age-standardised and is thus sensitive to differences in age distribution.
The diagnosed prevalence was higher for the more deprived areas and lower for the less deprived areas. The rate was 2.7 for IMD decile 1 and 0.7 for IMD decile 10. While not everyone who lives in an area of higher deprivation may be deprived, the differences in rates suggest that people living with diagnosed HIV are also at higher risk of additional stresses such as financial pressures. For some people this may have an impact on their ability to access HIV-related care and other services.
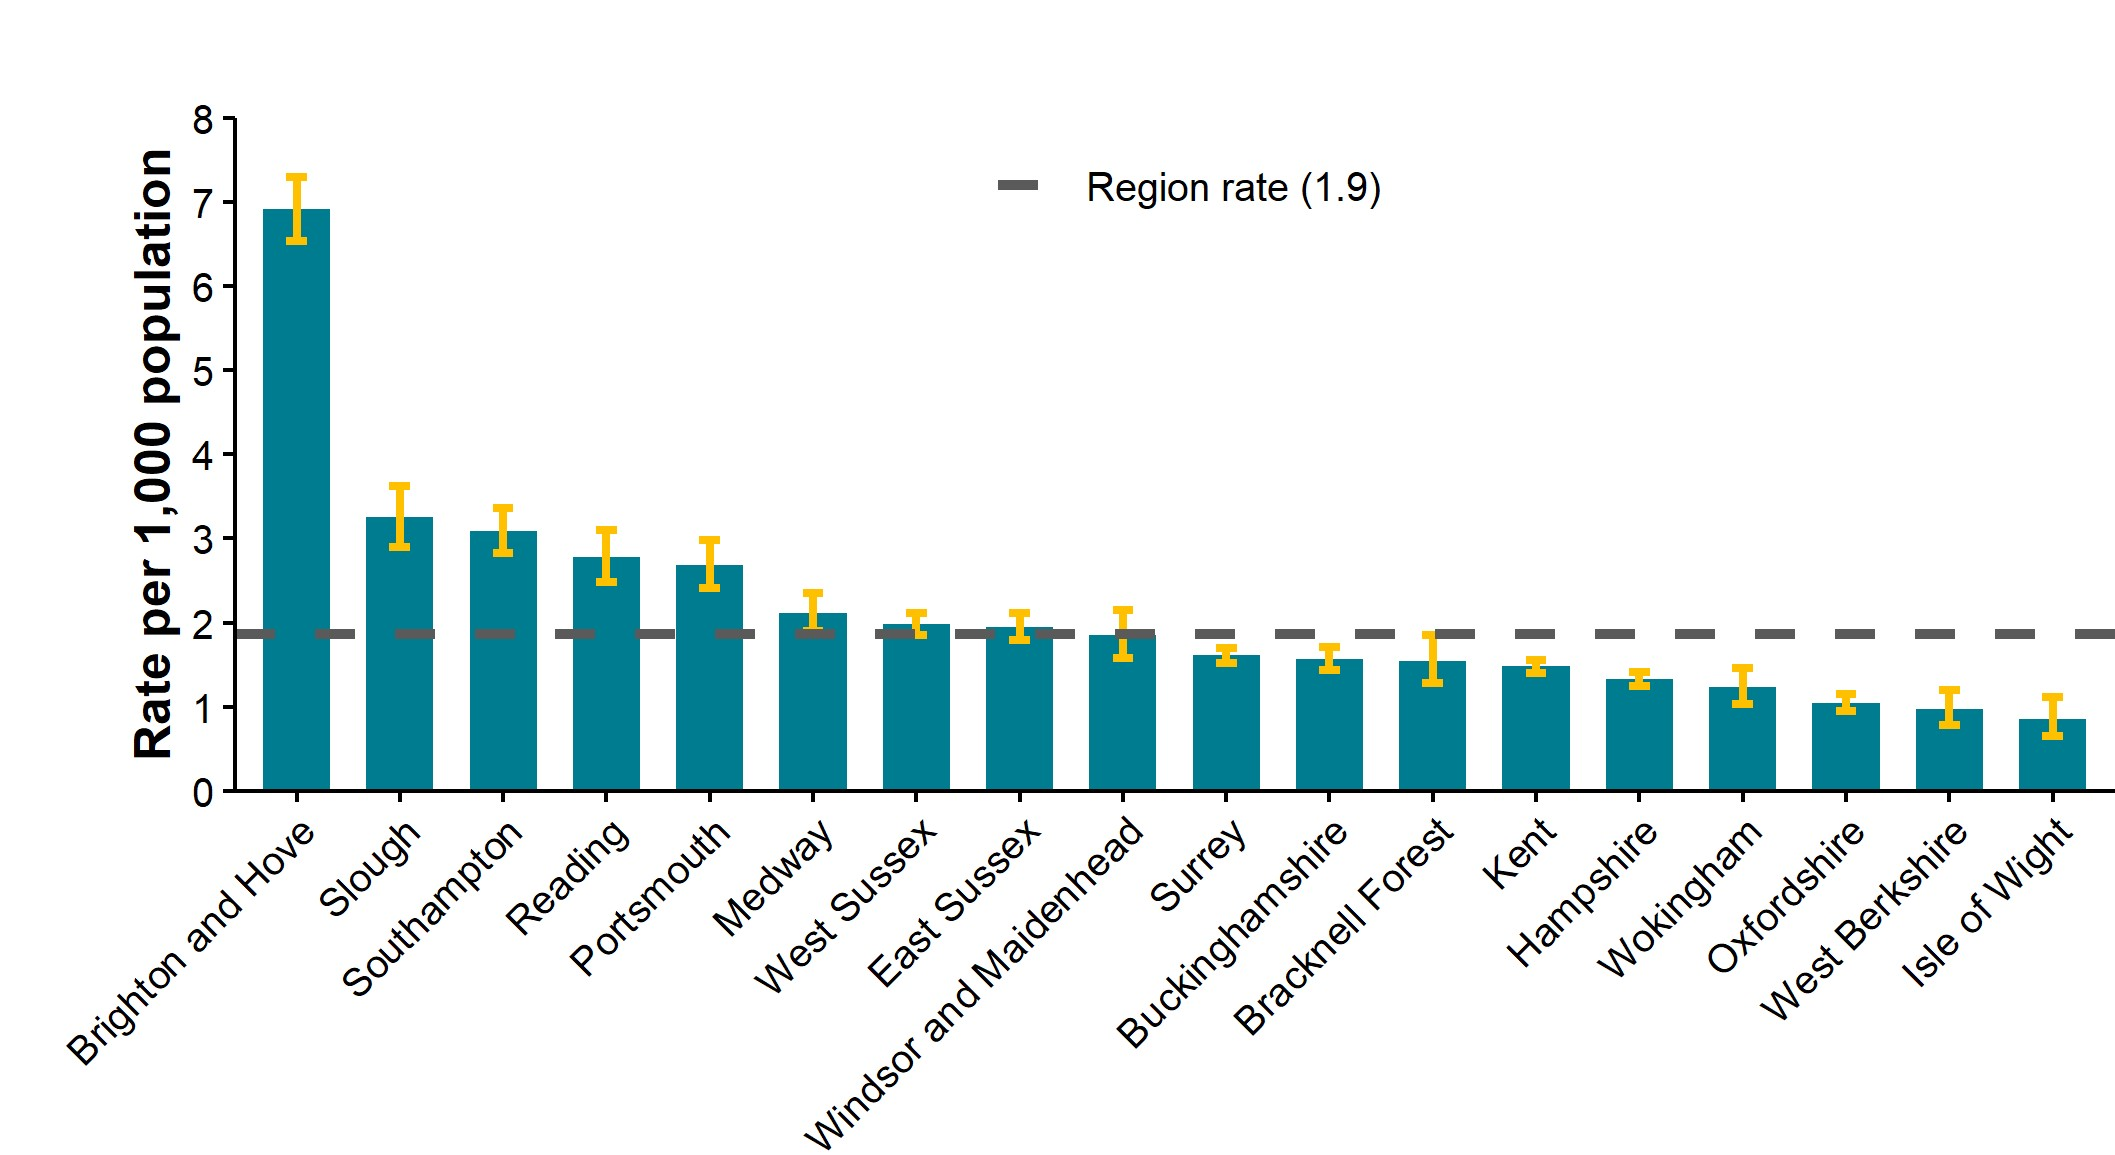
Figure 22. Diagnosed HIV prevalence per 1,000 residents aged 15 to 59 years by local authority, the South East, 2023
Sources: UKHSA, HIV and AIDS Reporting System (HARS).
Figure 22 is a column chart showing the prevalence of diagnosed HIV as a rate per 1,000 South East residents aged 15 to 59 years by local authority in 2023.
The local authority with the highest rate was Brighton and Hove (7 per 1,000 residents aged 15 to 59 years), with more than twice the rate of the local authority with the second highest rate, Slough (3). The local authority with the lowest rate was Isle of Wight (1), followed by West Berkshire (1) and Oxfordshire (1).
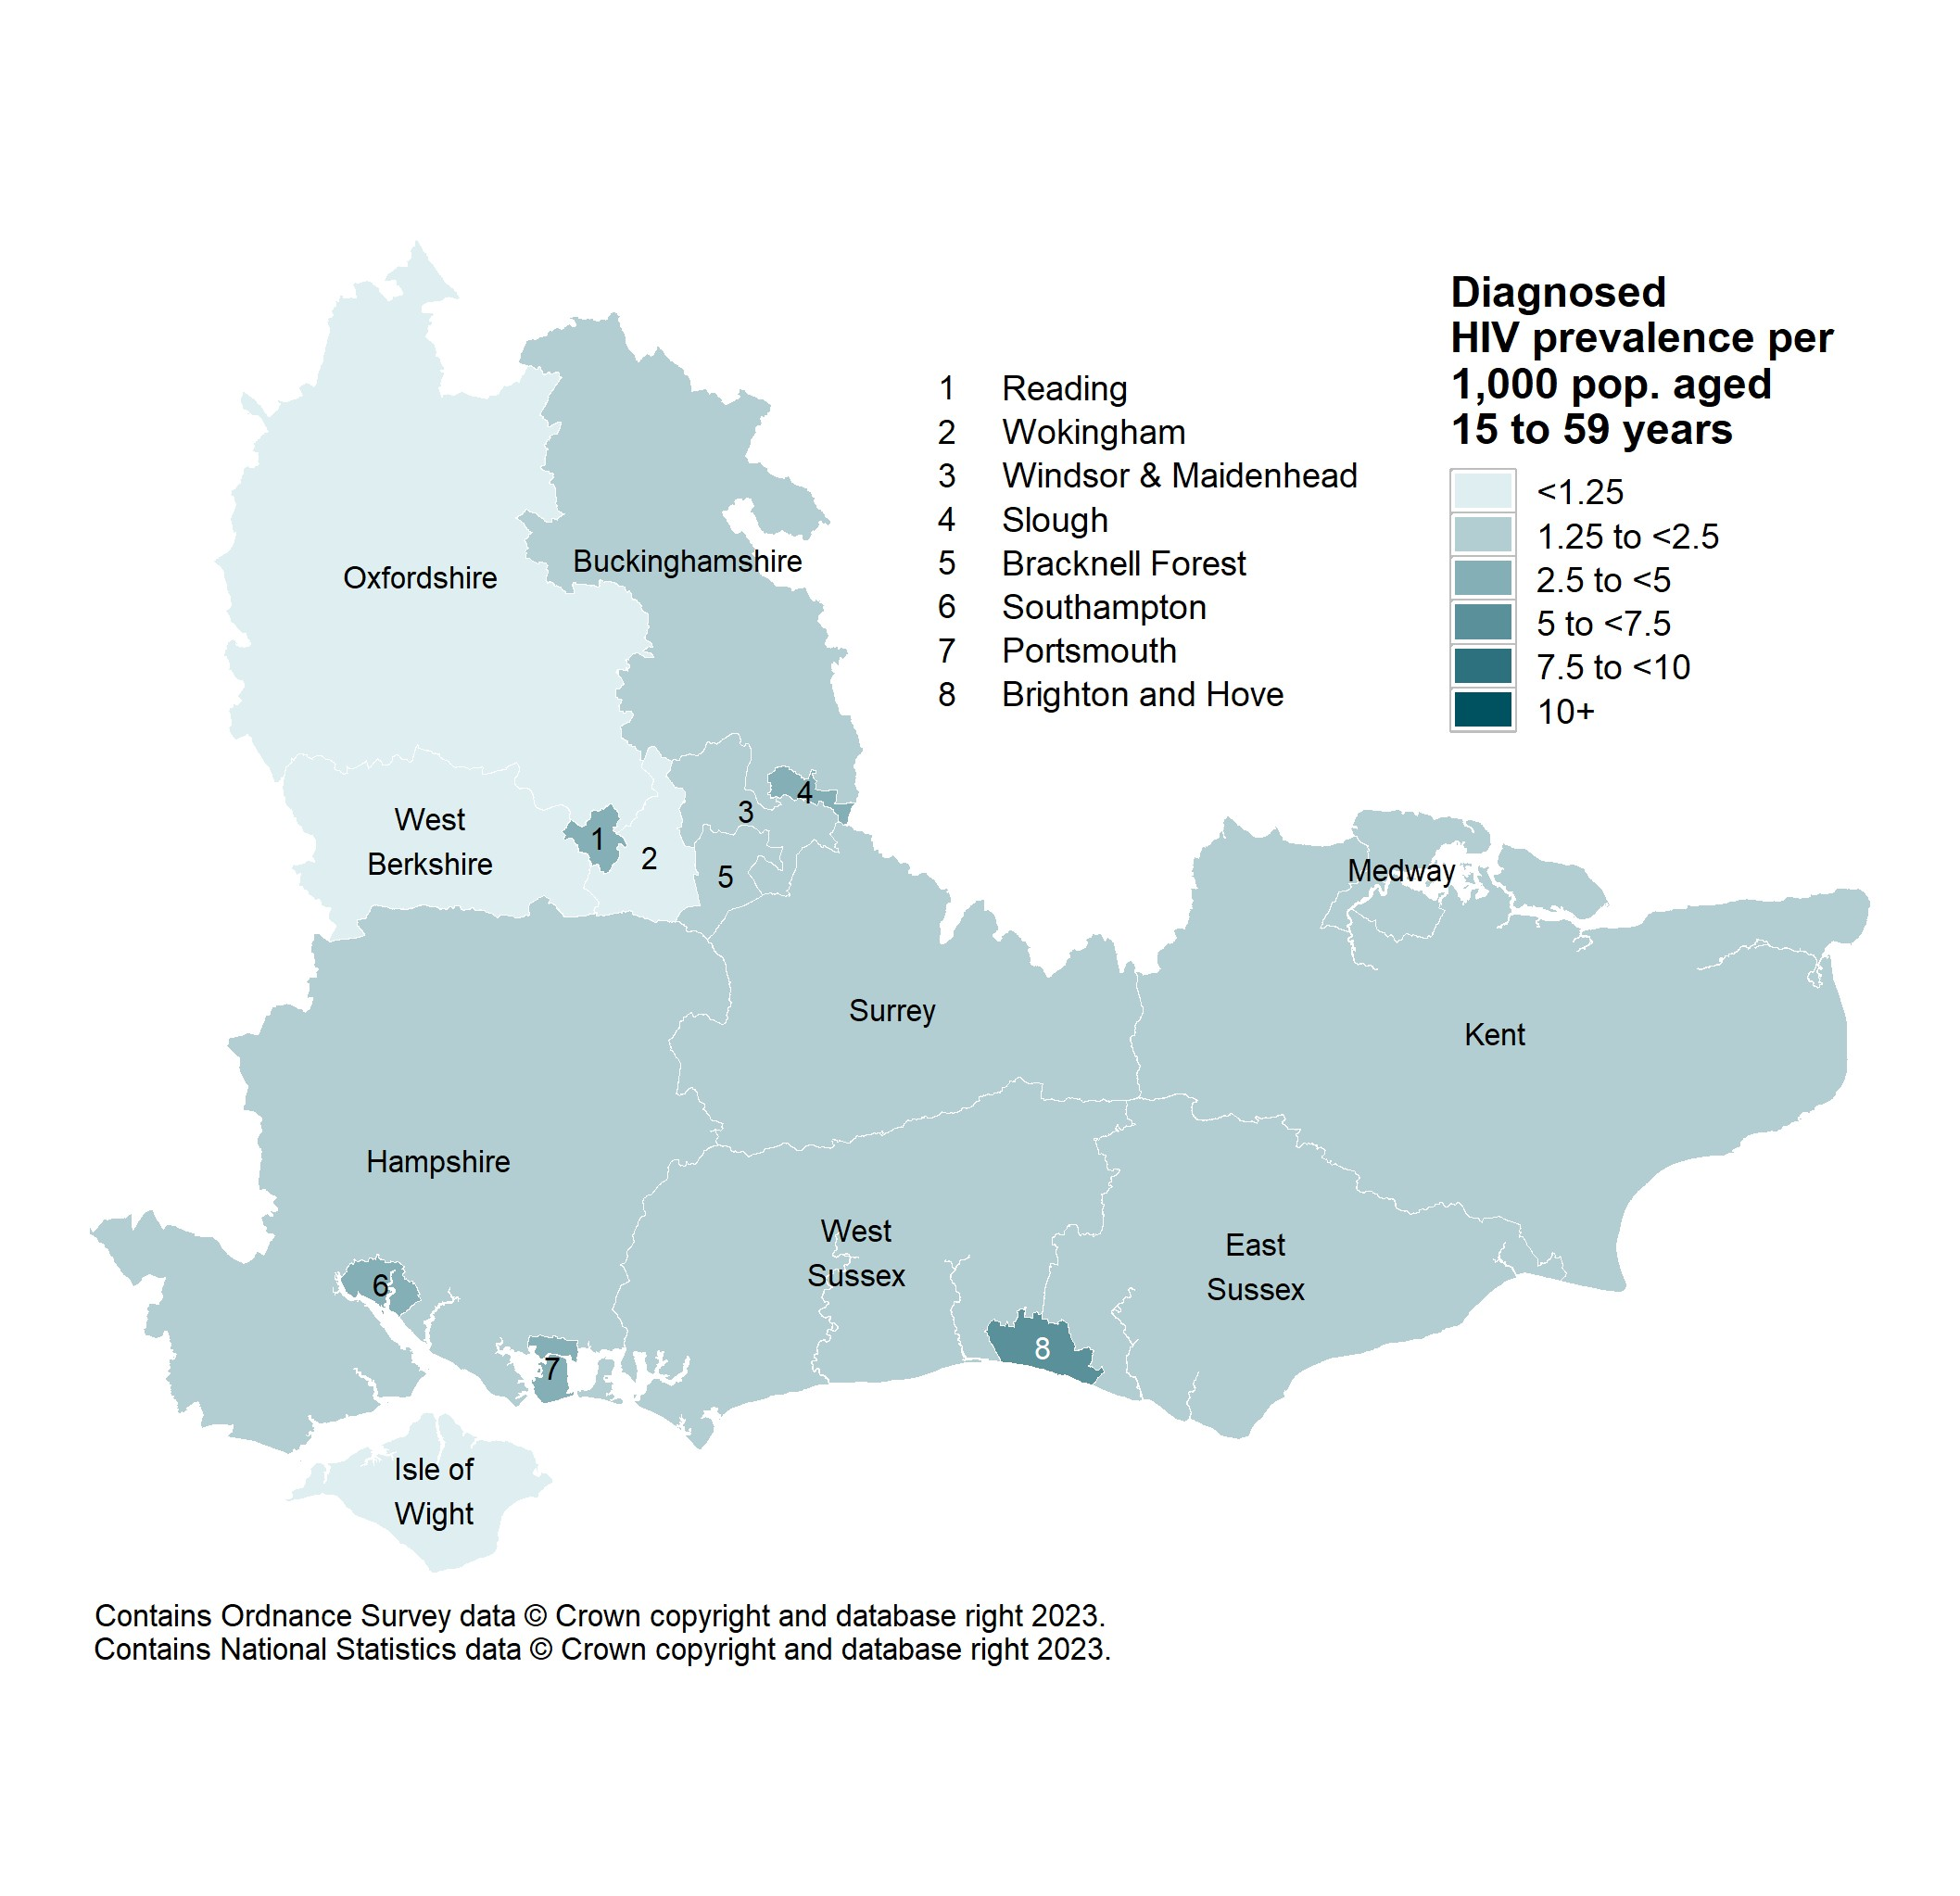
Figure 23. Diagnosed HIV prevalence per 1,000 residents aged 15 to 59 years by local authority, the South East, 2023
Sources: UKHSA, HIV and AIDS Reporting System (HARS).
Figure 23 is a map showing the prevalence of diagnosed HIV as a rate per 1,000 South East residents aged 15 to 59 years by local authority in 2023. The map is shaded in relation to 6 rate bands, from below 1.25 to 10 and above.
In the South East, no local authorities have rates in the 2 highest bands, and only Brighton and Hove have a rate in the third highest band of 5 to less than 7.5. Slough, Reading, Southampton and Portsmouth have rates in the third lowest band of 2.5 to less than 5. The remaining local authorities have rates in the 2 lowest bands.
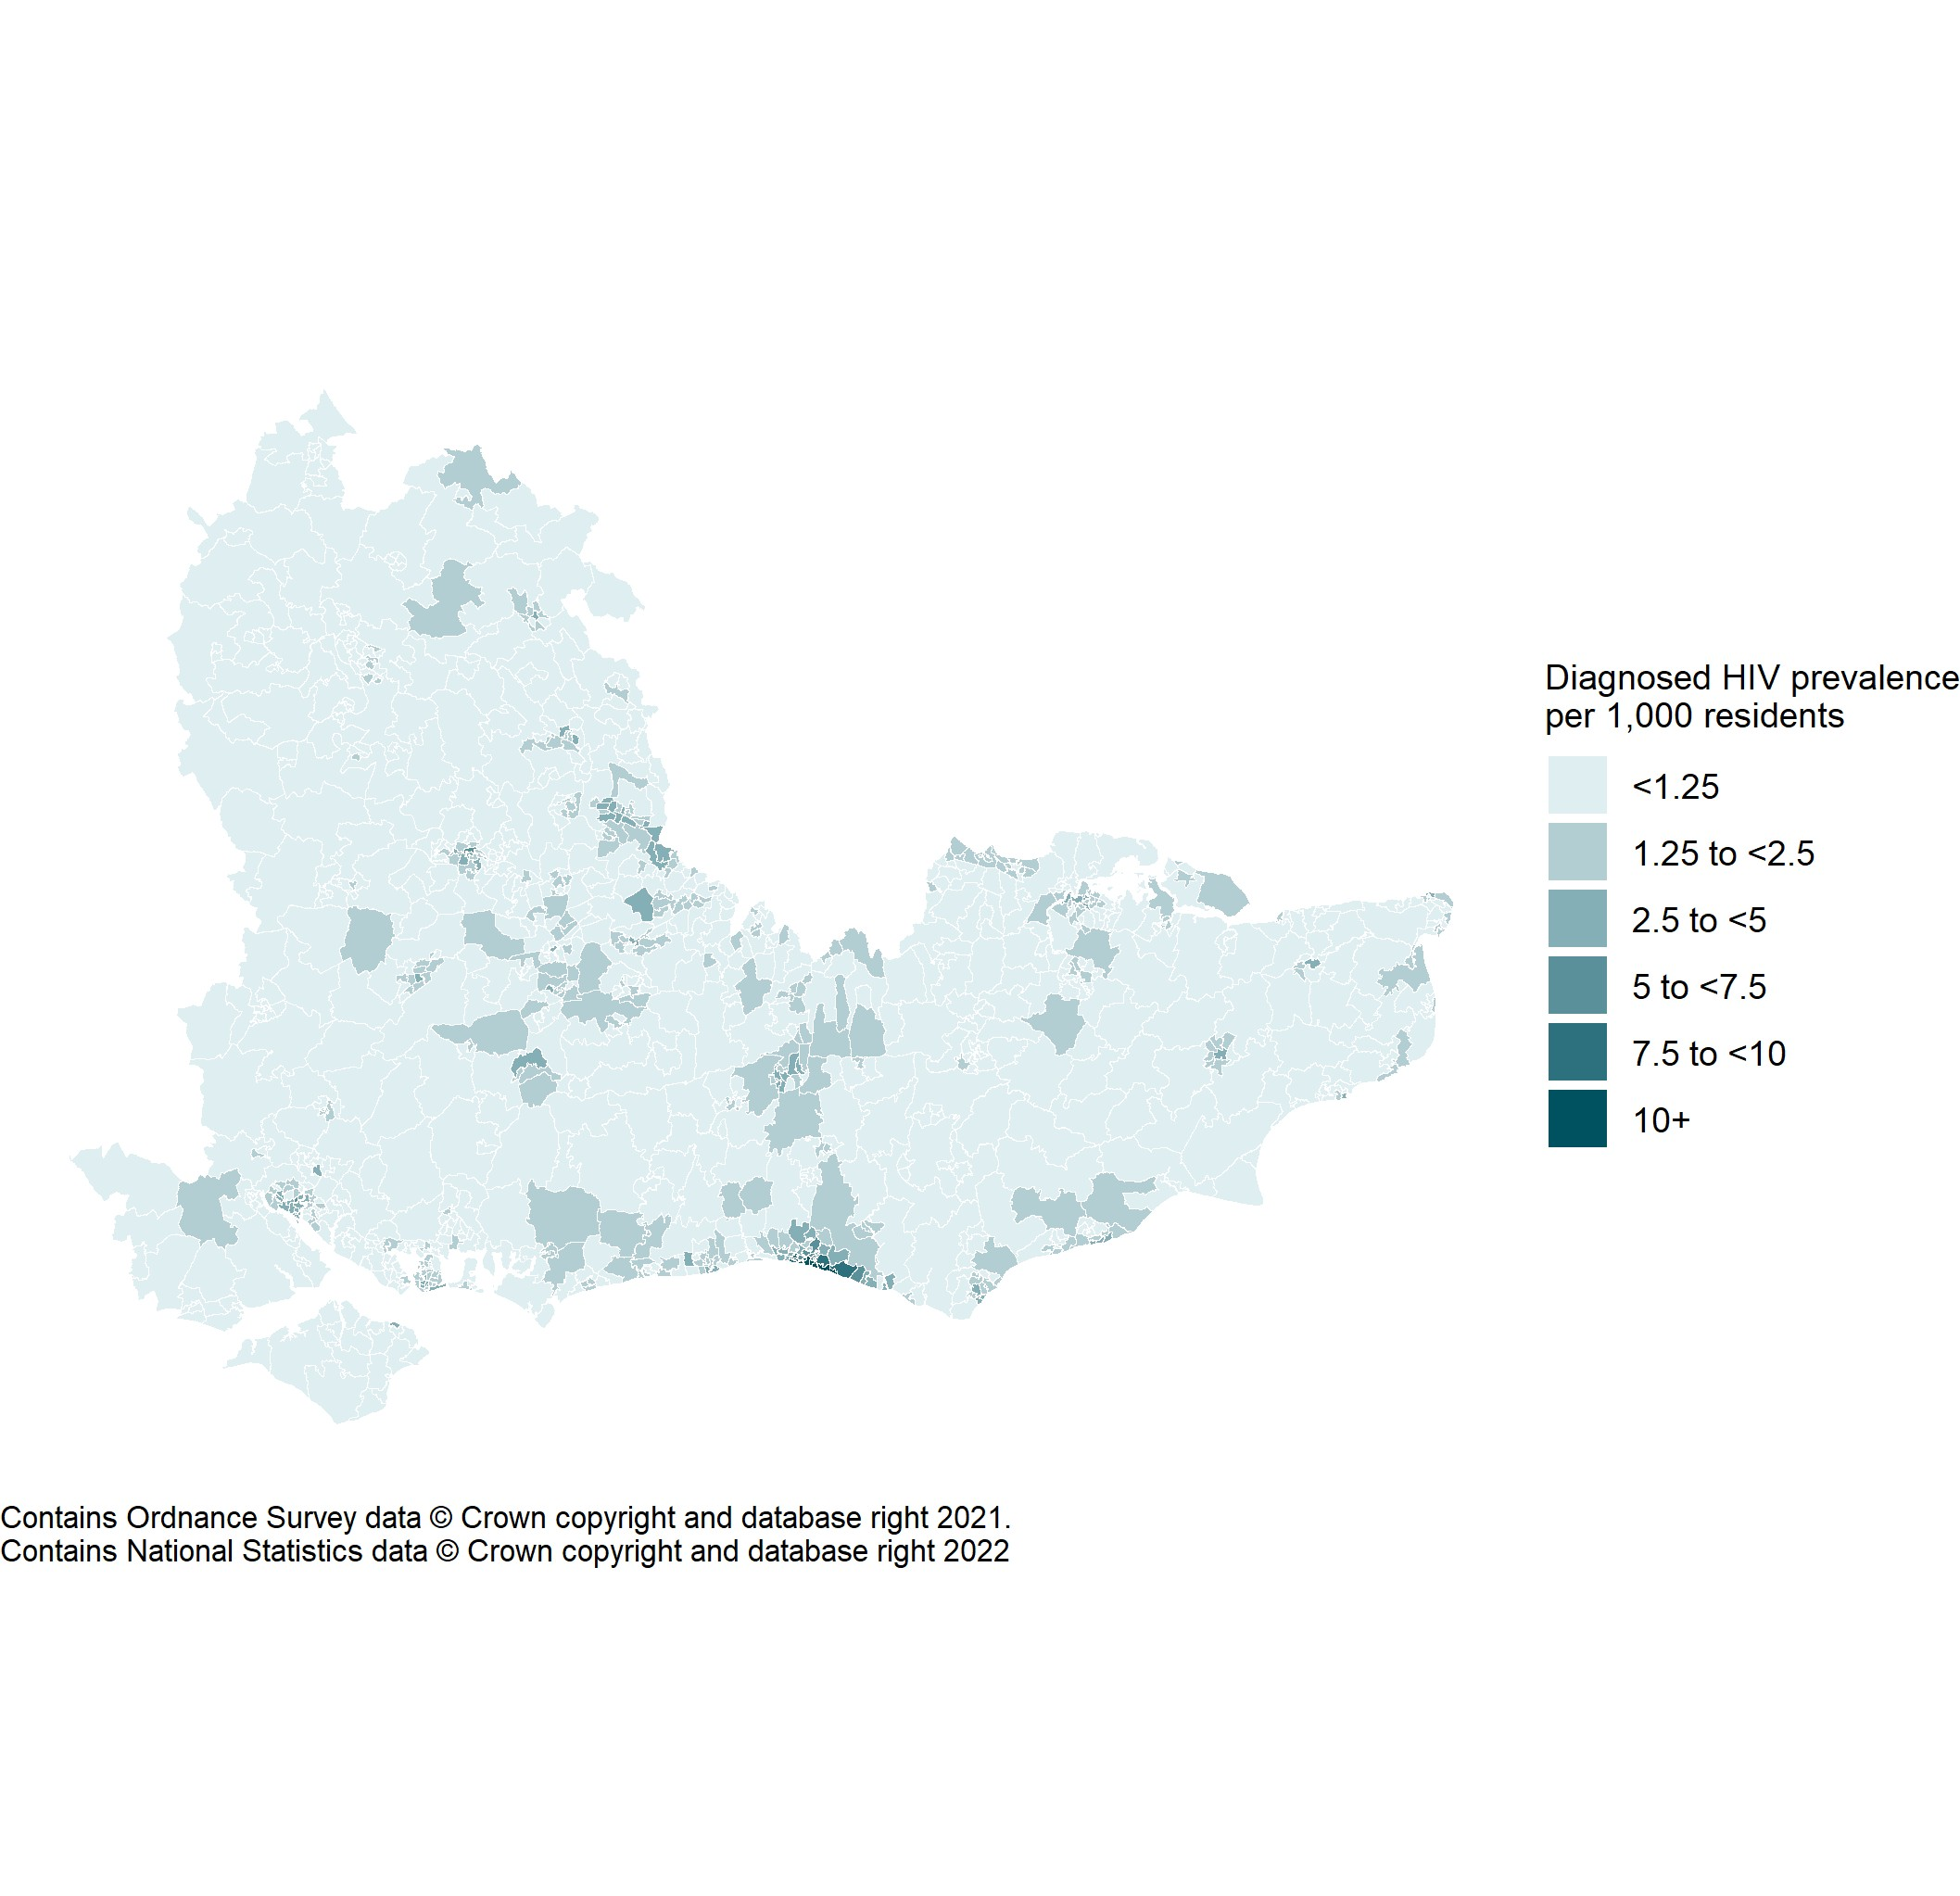
Figure 24. Diagnosed HIV prevalence per 1,000 residents (all ages) by middle layer super output area of residence the South East, 2023
Sources: UKHSA, HIV and AIDS Reporting System (HARS).
Figure 24 is a map showing the prevalence of diagnosed HIV as a rate per 1,000 South East residents by middle-layer super output area (MSOA) in 2023. The map is shaded in relation to 6 rate bands, from below 1.25 to 10 and above. Unlike the local authority level map, all ages are included in the rates. MSOAs consist of groups of lower-layer super output areas (LSOAs), have a consistent size, and a population of between 5,000 and 15,000 people. The map shows a more detailed picture of the rates of diagnosed HIV across the South East.
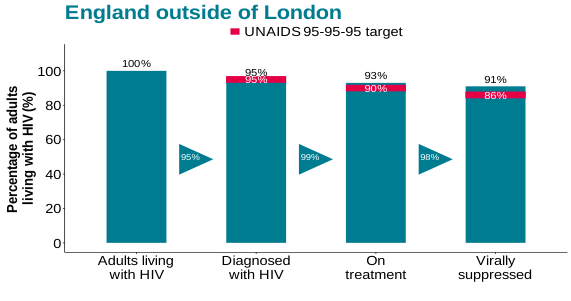
Figure 25. The continuum of HIV care, 2023
Sources: UKHSA, HIV and AIDS Reporting System (HARS, MPES model).
Figure 25 is a column chart showing the continuum of HIV care for residents of England outside London in 2023. The red line across each column represents the UNAIDS 95-95-95 target. The UNAIDS 95-95-95 strategy strives to end the AIDS epidemic by 2030 and aims for 95% of people living with HIV to know their status, 95% of those diagnosed to be on antiretroviral treatment, and 95% of those on treatment to be virally suppressed7. The target can also be expressed as a cascade where the denominator remains the same for each indicator. In this chart the cascade representation is used, aiming for 95% of people living with HIV to know their status, 90% of those diagnosed to be on antiretroviral treatment, and 86% of those on treatment to be virally suppressed. Virally suppressed means that an antiretroviral therapy (ART) regimen has decreased the amount of HIV in the blood to such a low level that it is either undetectable or less than 200 copies per millilitre8. People living with HIV that are virally suppressed cannot pass on HIV to sexual partners, even without using condoms or HIV pre-exposure prophylaxis (PrEP). This is known as Undetectable = Untransmittable (U = U).
The chart shows that England outside of London is meeting the UNAIDS targets (note: London is also meeting the target). The first column represents all adults living with HIV and is therefore set to 100%. The second column shows the percentage of adults living with HIV who were diagnosed (95%), the third column the percentage on treatment (93%), and the fourth column the percentage that were virally suppressed (91%). The triangular arrows represent the percentages when using the numerator of the previous column as the denominator, instead of using the cascade representation.
Figure 26. HIV testing rate per 100,000 by population group, South East residents, 2019 to 2023
Sources: UKHSA, GUMCAD.
The proportion of eligible attendees at specialist sexual health services (SHS) who accepted a HIV test. An eligible attendee is defined as a patient attending specialist SHS at least once during a calendar year. Patients known to be HIV positive, or for whom a HIV test was not appropriate, or for whom the attendance was related to Sexual and Reproductive Health (SRH) care only, are excluded.
Figure 26 is a line chart showing the HIV testing rate per 100,000 population for all, male, and female South East residents between 2019 and 2023.
The HIV testing rate is lower than it was in 2019, but it has increased in the last 3 years and is almost back to pre-pandemic levels. Throughout the 5-year period, females had a higher HIV testing rate. The HIV testing rate in the South East was 6% lower in 2023 than in 2019.
Table 2. People tested for HIV by population group, South East residents attending all SHSs, 2019 to 2023
| Gender or sexual orientation | 2019 | 2020 | 2021 | 2022 | 2023 | % change 2019 to 2023 | % change 2022 to 2023 |
|---|---|---|---|---|---|---|---|
| Heterosexual men | 51,321 | 29,661 | 28,904 | 34,056 | 39,101 | -24% | 15% |
| GBMSM | 15,159 | 14,333 | 17,149 | 18,090 | 19,375 | 28% | 7% |
| Subtotal (men) | 83,301 | 57,988 | 60,984 | 67,587 | 75,598 | -9% | 12% |
| Hetero/bisexual women | 77,088 | 55,508 | 58,656 | 61,267 | 71,555 | -7% | 17% |
| WOSW | 575 | 640 | 812 | 751 | 828 | 44% | 10% |
| Subtotal (women) | 105,739 | 77,501 | 81,376 | 84,454 | 97,731 | -8% | 16% |
| Total (all genders) | 192,312 | 137,205 | 145,272 | 155,646 | 176,977 | -8% | 14% |
Sources: UKHSA, GUMCAD.
Note: GBMSM = Gay, bisexual, and other men who have sex with men; WOSW = women who only have sex with women
Table 2 shows information on the number and percentage change in South East population groups attending all sexual health services between 2019 and 2023.
Testing increased for all groups in 2023 compared to 2022, and by 14% overall. Compared to 2019, the numbers for 2023 were lower for all groups apart from women who only have sex with women (WOSW) and GBMSM. HIV testing is still lower than pre-pandemic in the South East; however, total testing numbers have increased year-on-year since the 29% decrease from 2019 to 2020, and the number in 2023 is merely 8% lower than it was in 2019.
Figure 27. HIV pre-exposure prophylaxis (PrEP) need and initiation/continuation in residents attending specialist sexual health services (SHSs), the South East, 2023
Sources: UKHSA, GUMCAD.
Figure 27 is a column chart showing information on PrEP need and usage by gender and sexual orientation in the South East in 2023. The first column represents the percentage of South East residents attending specialist SHSs who were determined to be in need of PrEP based on clinical and other information. The second column shows the percentage of those in need of PrEP whose PrEP need was identified by the service, and the third column shows the percentage of those in need of PrEP for whom PrEP was initiated or continued. The second and third columns for each group must be looked at in relation to the first column. It is important to bear in mind that the chart represents percentage of need identified among attendees of the groups, and that the absolute numbers for the groups differ substantially.
GBMSM attending specialist SHSs had the highest need for PrEP (66%), of whom 84% had their PrEP need identified and of those 74% initiated or continued PrEP. WOSW had the second highest need for PrEP (9%), albeit much lower than GBMSM, and of whom 97% had their PrEP need identified and of those 85% initiated or continued PrEP. Heterosexual men had a 2% need for PrEP, of whom 62% had their PrEP need identified and of those 41% initiated or continued PrEP. Heterosexual and bisexual women had the lowest need for PrEP (<1%), of whom 65% had their PrEP need identified and of those 43% initiated or continued PrEP.
Information on data sources
- HIV and AIDS New Diagnoses and Deaths (HANDD) collects information on new HIV diagnoses, AIDS at diagnosis and deaths among people diagnosed with HIV. Information is received from laboratories, specialist SHSs, GPs and other services where HIV testing takes place in England, Wales and Northern Ireland. The Recent Infection Testing Algorithm (RITA) and CD4 surveillance scheme are linked to HANDD to assess trends in recent and late diagnoses. Data is deduplicated across regions and therefore figures may differ from country-specific data.
- The Survey of Prevalent HIV Infections Diagnosed (SOPHID) began in 1995 and was a cross-sectional survey of all adults living with diagnosed HIV infection who attend for HIV care in England, Wales and Northern Ireland. SOPHID collected information about the individual’s place of residence along with epidemiological data including clinical stage and antiretroviral therapy (ART). In 2015, SOPHID reporting in England was replaced by the HIV and AIDS Reporting System (HARS) which captures information at every attendance for HIV care.
- Date of data extract: October 2024. Updates to HANDD and SOPHID/HARS made after this date will not be reflected in this report.
- Confidence intervals for rates in the figures have been calculated to the 95% level using the Byar’s method; confidence intervals for percentages have been calculated to the 95% level using the Wilson Score method. Confidence intervals presented in the text are produced by Bayesian analysis.
- The most recent ONS mid-year estimates at the time of analysis were used as denominators for rates. For UTLAs 2023 estimates were used (published June 2024), for MSOAs 2022 estimates were used (published November 2024), for LTLAs 2021 estimates were used (published November 2022), and for LSOAs 2022 estimates were used (published November 2024).
- The data behind charts showing absolute numbers may have been adjusted for missing information; however, unless stated otherwise, the numbers in the summary section are the numbers as reported, that is, unadjusted counts. Where charts are displaying adjusted data this is indicated in the chart title. Where figures have been ‘adjusted for missing information’, this means that when unknown values are present (for example, route of probable infection = ‘unknown’), they are proportionally distributed amongst other groups for the purposes of analysis (for example, if A = 12, B = 4, C = 2, and unknown = 6, the 6 ‘unknown’ values are distributed proportionally among groups A, B, and C to give A = 15, B = 6, C = 3).
- The denominators for all percentages exclude records for which information was unknown, that is, the proportion of new diagnoses where probable route of acquisition was sex between men would be calculated using new diagnoses for which route of acquisition was known as the denominator.
All analyses in this report are residence-based and reflect the patient’s place of residence at diagnosis.
Numbers may change as more information becomes available to assign area of residence to cases and historical data is refreshed accordingly.
More information
For more information on a whole range of sexual health indicators, see:
For more information on local sexual health data sources, see
For the annual epidemiological spotlight on STIs in South East 2023, see:
For the national HIV report: 2023 data, see:
Local authorities have access to additional HIV and STI intelligence via the Data Exchange and the HIV and STI web portal. They should also have received a set of tables containing HIV data specific to their authority. If they do not have access to this information, they should contact FES.SEaL@ukhsa.gov.uk
About the Field Service
The Field Service was established in 2018 as a national service comprising geographically dispersed multi-disciplinary teams integrating expertise in Field Epidemiology, Real-time Syndromic Surveillance and Public Health Microbiology to strengthen the surveillance, intelligence and response functions of UKHSA.
You can contact your local Field Service team at FES.SEaL@ukhsa.gov.uk
If you have any comments or feedback regarding this report or the Field Service, contact josh.forde@ukhsa.gov.uk or tobias.martinsen@ukhsa.gov.uk
Acknowledgements
We would like to thank:
- local sexual health and HIV clinics for supplying the HIV data
- Institute of Child Health
- UKHSA Blood Safety, Hepatitis, Sexually Transmitted Infections and HIV Division (BSHSH) for collection, analysis and distribution of data
References
1. Department of Health and Social Care UK. ‘Towards Zero - An action plan towards ending HIV transmission, AIDS and HIV-related deaths in England 2022 to 2025’ UK Government White Paper 2022
2. Schoemig V, Martin V, Shah A, Okumu-Camerra K, Mackay N, Bera S, Kitt H, Kelly C, Kolawole T, Ratna N, Chau C, Duretić T, Brown A and contributors. ‘HIV Action Plan monitoring and evaluation framework 2024 report: report summarising progress from 2019 to 2023’ UKHSA November 2024
3. Kitt H, Shah A, Chau C, Okumu-Camerra K, Bera S, Schoemig V, Mackay N, Kolawole T, Ratna N, Martin V, Đjuretić T, Brown A. ‘HIV testing, PrEP, new HIV diagnoses, and care outcomes for people accessing HIV services: 2024 report’ UKHSA October 2024
4. Office for National Statistics (ONS) (2023) ’Long-term international migration, provisional: year ending June 2023’
5. Aghaizu A, Martin V, Kelly C, Kitt H, Farah A, Latham V, Brown AE, Humphreys C. ‘Positive Voices: The National Survey of People Living with HIV. Findings from 2022. Report summarising data from 2022 and measuring change since 2017’ UKHSA 2023
6. ONS (2023). ‘Sexual orientation by age and sex, England and Wales: Census 2021’
7. The Joint United Nations Programme on HIV/AIDS (UNAIDS). ‘Understanding measures of progress towards the 95–95–95 HIV testing, treatment and viral suppression targets’