Annual epidemiological spotlight on HIV in the North East: 2024
Updated 15 October 2026
Applies to England

© Crown copyright 2026
This publication is licensed under the terms of the Open Government Licence v3.0 except where otherwise stated. To view this licence, visit nationalarchives.gov.uk/doc/open-government-licence/version/3 or write to the Information Policy Team, The National Archives, Kew, London TW9 4DU, or email: psi@nationalarchives.gov.uk.
Where we have identified any third party copyright information you will need to obtain permission from the copyright holders concerned.
This publication is available at https://www.gov.uk/government/publications/hiv-north-east-annual-data-spotlight/annual-epidemiological-spotlight-on-hiv-in-the-north-east-2024
Introduction
This report provides an update on the latest HIV surveillance data in the North East. It presents data on new diagnoses, late diagnoses, people living with diagnosed HIV, continuum of care, and HIV testing and pre-exposure prophylaxis (PrEP). Data is mostly focused on activity in 2024. Where appropriate, data for the past 5 or 10 years is presented to examine trends over time. For a broader geographical context see HIV: annual data.
During 2024, UKHSA engaged in a stakeholders’ review on language use for HIV. Consequently, a number of changes have been made to the language used in this report. These include reference to gender identity, sexual orientation and probable route of exposure:
- for gay, bisexual and all men who have sex with men, the abbreviation is gay and bisexual men (instead of GBMSM or sex between men)
- for heterosexual men or men who acquired HIV through sex with women, we abbreviate as heterosexual men (instead of men exposed through sex with women)
- for heterosexual and bisexual women or women who acquired HIV through sex with men, we use heterosexual women (instead of women exposed through sex with men)
In previous HIV Spotlights reports, counts of new HIV diagnoses included people diagnosed with HIV before continuing care in England (referred to as ‘previously diagnosed abroad’). These cases do not reflect HIV acquired in England and most of them are rapidly linked to care shortly after arrival, making the majority extremely unlikely to pass on HIV in England (1). For this report, reflecting changes in national HIV statistics, reference to new HIV diagnoses now only includes diagnoses first made in England.
Summary
Main points
HIV remains an important public health problem in the North East. In 2024, 85 people were newly diagnosed (3 per 100,000), with rates remaining below the England average and showing a slight decline from 2023. Transmission patterns continue to shift, with heterosexual contact now the most common route (59%), while sex among gay and bisexual men has declined over time (35%).
Late diagnosis remains a key challenge, affecting 41% of individuals in the North East, with higher rates among heterosexuals (53%) and Black African populations (47%).
The number of people living with diagnosed HIV continues to increase (2,575 in 2024), reflecting effective treatment and an ageing population, with nearly half aged 50 years and over.
HIV testing has increased substantially since 2020 but remains below the England average, with lower uptake among men. While PrEP uptake is relatively high among gay and bisexual men, inequalities persist: among those with identified need, 66% of gay and bisexual men initiated or continued PrEP compared with 15% of heterosexual men and 14% of heterosexual women.
Overall, while HIV prevalence in the North East remains lower than in other regions, ongoing inequalities in late diagnosis, testing and prevention highlight the need for continued targeted action to reduce transmission and improve outcomes.
New diagnoses
In 2024, 85 North East residents were newly diagnosed with HIV, accounting for 3% of new diagnoses in England. This represents a fall of 1% from 2023.
The new diagnosis rate for North East residents (3 per 100,000) was below that of England in 2024 (5 per 100,000).
In 2024, 35% of all new diagnoses in North East residents were in gay and bisexual men (compared to 52% in 2023 and 56% in 2015). The number of gay and bisexual men resident in the North East newly diagnosed with HIV (29, adjusted for missing information) was 52% lower than in 2015. Of the gay and bisexual men newly diagnosed with HIV 95% were White and 90% were UK born.
Heterosexual contact was the most frequent route of exposure for new diagnoses in North East residents in 2024 (59%). Infections in UK born persons accounted for 47% of all heterosexually acquired cases in 2024. Infections in African born persons accounted for 44% of all heterosexually acquired cases in 2024 (n=14).
Injecting drug use accounted for 6% of new diagnoses in North East residents.
The number of new diagnoses was highest in the 25 to 34 year age group in both males and females in 2024.
Late diagnoses
Reducing late HIV diagnoses is one of the indicators in the Public Health Outcomes Framework and HIV Action Plan Monitoring and Evaluation Framework. People who are diagnosed late have a tenfold risk of mortality within one year of diagnosis compared to those diagnosed promptly and they have increased healthcare costs.
It is of particular concern that a large proportion of North East residents with HIV are diagnosed late (41% from 2022 to 2024, compared to 43% in England), as defined by a CD4 count of less than 350 cells/mm at diagnosis.
In the North East, heterosexuals were more likely to be diagnosed late (51% of males, 49% of females) than gay and bisexual men (30%). By ethnic group, Black Africans were more likely to be diagnosed late than the White population (47% and 39% respectively).
People living with diagnosed HIV
In 2024, there were 2,575 people living with diagnosed HIV and receiving care in the North East in 2024. This was 6% higher than in 2023 and 50% higher than in 2015. This reflects advances in testing programmes as well as HIV treatments and care and, consequently, reductions in mortality associated with HIV.
The diagnosed prevalence rate of HIV in the North East in 2024 was 1 per 1,000 residents aged 15 to 59 years. This was below that of the 2 per 1,000 observed in England as a whole (small differences may be hidden by rounding). One local authority in the North East had a diagnosed HIV prevalence in excess of 2 per 1,000 population aged 15 to 59 in 2024, which is the threshold for expanded HIV testing / definition of ‘high prevalence’ area. This was Newcastle upon Tyne (2.4).
The 2 most common probable routes of exposure for North East residents living with diagnosed HIV in 2024 were sex among gay and bisexual men (49%) and heterosexual sex (48%).
In 2024, 37% of those living with diagnosed HIV in the North East were aged between 35 and 49 years, and 48% were aged 50 years and over (up from 31% in 2015). Males represented 70% of North East residents living with diagnosed HIV in 2024 and females represented 30%.
In 2024, 65% of North East residents living with diagnosed HIV were White and 25% were Black Africans. However, due to the relative sizes of the White and Black African populations the rate per 1,000 population aged 15 to 59 years was much higher in Black Africans (27 per 1,000) than in the White population (1 per 1,000).
HIV testing
A total of 34,777 people were tested in specialist sexual health services (SHSs) in the North East in 2024, an increase of 2% since 2023. The HIV testing rate (per 100,000 population) across all SHSs in the North East was 2,135, which compares to 2,843 across England. However, HIV testing rates in all SHSs (specialist and non-specialist services) varied across local authorities from 1,345 in Sunderland to 3,544 in Newcastle upon Tyne. HIV testing rates in all SHSs (specialist and non-specialist services) in the North East is lower in men (1,981) than women (2,162).
PrEP
In 2024, 7% of HIV-negative North East residents accessing SHSs in England were defined as having a PrEP need. Of these, 78% had this need identified at a clinical consultation and 56% initiated or continued PrEP. Among gay and bisexual men, the group with greatest need, these proportions were: 60%, 79% and 66%. Among heterosexual men these proportions were: 2%, 64% and 15%. Among heterosexual women these proportions were: 1%, 74% and 14%. Consistent use of PrEP can be an efficacious and effective intervention to prevent HIV acquisition. Despite PrEP being routinely available through specialist SHS, awareness, accessibility and uptake of primary prevention initiatives is variable for different population groups. Addressing this disparity is key to HIV prevention.
HIV in England
The HIV Action Plan for England, 2025 to 2030 was published on 1 December 2025. It sets UNAIDS 2025 ambitions to reduce HIV transmission (measured by new HIV diagnoses) and AIDS-related deaths by 90% between 2010 and 2030. New diagnoses among White gay and bisexual men are on track to reach the ambition, however further work is needed over the next 5 years for other population groups such as ethnic minorities gay and bisexual men, Black African and other ethnic minorities heterosexual populations. This is why HIV Official Statistics this year highlight progress along the HIV pathway for 5 population groups.
The number of people first diagnosed with HIV in England decreased by 2% in 2024 (2,838 in 2023 to 2,773) (2). Gay and bisexual men accounted for almost 30% of new HIV diagnoses (810 of 2,773), with heterosexual men 23% (634) and heterosexual women 27% (749). Within and between these population groups, there remains evidence of considerable inequalities (2). Further provision of services that are culturally competent and accessible to diverse populations is needed.
The number of new HIV diagnoses in England decreased by 6% (859 to 810) in 2024 for gay and bisexual men2. However, this reduction was not seen consistently among all ethnic groups. While a reduction of 6% was observed among White gay and bisexual men (488 to 461), new HIV diagnoses increased among Black (15%, 80 to 92) and Asian (6%, 101 to 107) gay and bisexual men. Nearly half (48%, 386 of 810) of the gay and bisexual men newly diagnosed in England in 2024 were born abroad.
For heterosexuals, the number of new HIV diagnoses were similar in 2024 compared to 2023 (1,371 to 1,383), although numbers increased for heterosexual men (by 3%, 615 to 634) and decreased marginally for heterosexual women (by 1%, 755 to 749) (2). As with gay and bisexual men, for heterosexuals, there was considerable variation between ethnic groups. Notably, new HIV diagnoses among Black African heterosexual men increased by 15% (231 to 265) but decreased by 5% among Black African heterosexual women (441 to 418). Of the heterosexual men newly diagnosed in 2024, 27% (170 of 634) were known to be born in the UK and 68% (431 of 634) abroad. Among women, 15% (116 of 749) were known to be born in the UK and 77% (580 of 749) abroad.
Overall, the number of people tested for HIV in sexual health services (SHSs) in England was 3% higher in 2024 than 2023 but has not fully recovered to pre-pandemic (2019) levels for all groups. Whereas testing increased markedly within specialist SHSs (9%), non-specialist online testing declined by 4% in 2024. The proportion of people tested through online consultations at all SHSs (compared to face-to-face) fell by 3%, continuing a year-on-year reduction in this proportion since a peak in 2021. There was a 7% decrease in the HIV testing rate in all SHSs in people aged 15 to 24 years. This compares to a continued increase in the HIV testing rate in all other age groups.
Testing increases were observed across gender identity and sexual orientation groups (gay and bisexual men, 2%; heterosexual men, 5%; heterosexual woman, 2%). Consistently increased testing for gay and bisexual men, coupled with an overall decline in HIV test positivity (0.3% in 2020 to 0.2% in 2024) suggests that there may be a reduction in transmission in this community. HIV test positivity in heterosexual men and women has remained similar in 2023 and 2024 (0.05% to 0.06%, and 0.08% to 0.08%, respectively). The programme of emergency departments (ED) opt-out testing for bloodborne viruses continues to be a successful approach for HIV diagnoses, contributing to 8% of all new HIV diagnoses in 2024.
The number of people diagnosed with HIV before continuing care in England fell markedly in 2024 (3,363 to 2,525) with a corresponding 15% drop in all HIV diagnoses (6,201 to 5,298). The reduction in the number of people diagnosed before continuing care in England was most pronounced in heterosexual women (33%), compared to reductions in heterosexual men (11%) and gay and bisexual men (21%). The decline in the number of people diagnosed before continuing care in England in 2024 varied by ethnic group. The largest proportionate reductions in numbers (compared to 2023) were seen in people of Black Other (30%; 79 to 55), Black African (28%; 2,196 to 1,587), Asian (25%; 228 to 172), Other or Mixed (25%; 288 to 216) and White (22%; 326 to 253) ethnicities.
The number of people receiving HIV pre-exposure prophylaxis (PrEP) via SHSs has been increasing on an annual basis since 2020, increasing by 7.7% between 2023 and 2024 (111,123 in 2024 vs. 103,138 in 2023). However, inequalities in access remain. While the overall number of gay and bisexual men with unmet HIV PrEP need was highest, there is proportionally greater unidentified and unmet PrEP need among heterosexual men and women.
Despite a 2% decrease in the number of adults being diagnosed late between 2023 and 2024 (950 to 928), 42% (928 of 2,196) of the new HIV diagnoses were made at a late stage in England in 2024. Reductions in the number of late HIV diagnoses fell most among gay and bisexual men (11%) compared with heterosexual women (4%) and heterosexual men (1%). The percentage of new diagnoses that were late for all 3 groups remained similar to 2023 (45% to 46%, 53% to 52%, 31% to 30% for heterosexual women, heterosexual men, and gay and bisexual men, respectively). In 2024, half of adult Black African heterosexuals newly diagnosed with HIV were diagnosed late (285 of 572; 50%). People diagnosed late with HIV in England in 2023 were ten times more likely to die within a year of their diagnosis, compared to those diagnosed promptly.
Provisional estimates are that 95% of all adults living with HIV in England are diagnosed, with 99% of diagnosed adults receiving treatment, and 98% of adults on treatment having suppressed viral loads.
HIV prevention messages
Using condoms consistently and correctly protects against HIV and other STIs such as chlamydia, gonorrhoea and syphilis. They can also be used to prevent unplanned pregnancy.
HIV testing is central to HIV prevention since it provides access to PrEP and health advice for people testing HIV negative, while a positive result leads to essential HIV care and treatment, supporting a long healthy life whilst preventing onwards transmission. Everyone should have an STI screen, including an HIV test, on at least an annual basis, if having condomless sex with new or casual partners. Gay and bisexual men should have tests for HIV and STIs annually, or every 3 months if having condomless sex with new or casual partners.
HIV PrEP is available for free from specialist SHSs and can be used to reduce an individual’s risk of acquiring HIV. Consistent use of PrEP can be an efficacious and effective intervention to prevent HIV acquisition. Despite PrEP being routinely available through specialist SHSs, awareness, accessibility and uptake of primary prevention initiatives such as HIV PrEP is variable for different population groups.
HIV post-exposure prophylaxis (PEP) can be used to reduce the risk of acquiring HIV following some sexual exposures. PEP is available for free from specialist SHSs and most emergency departments. Symptoms due to HIV may not appear for many years, and people who are unaware of living with HIV may not feel themselves to be a risk to others. Prevention messages should reinforce that anyone can acquire HIV regardless of age, gender, ethnicity, sexuality or religion, and it is important to challenge assumptions about who is at risk of acquiring HIV.
People living with diagnosed HIV who are on treatment and have an undetectable viral load are unable to pass on the virus to others during sex, even without PrEP or condoms. This is known as Undetectable = Untransmittable or U=U.
Stigma, anxiety and depression experienced by people with HIV affect their ability to seek healthcare, engage in treatment and remain in care. Reducing stigma in healthcare services will encourage people to seek the healthcare services they need.
Specialist SHSs are free and confidential. They offer testing and treatment for HIV and STIs, condoms, vaccination, HIV PrEP and PEP. Clinic-based services are commissioned by local authorities for residents of all areas in England and online self-sampling for HIV and STIs is widely available. Information and advice about sexual health including how to access services is available at NHS.UK and from the national sexual health helpline on 0300 123 7123.
Local and regional prevention strategies
HIV prevention strategies at a local and regional level should consider inclusion of all actions published recently in the HIV Action Plan for England (HIVAP). Below are some examples of how this could be done, focusing on each of the 5 HIVAP priorities:
Prevent
- Drive forward HIV service improvements and innovation with a focus on reducing inequalities in HIV testing, access to HIV PrEP and PEP
- Ensure localities are aware that there is central funding for formula milk (and related sterilised equipment) for the infants of women living with HIV
- Collate evidence and best practice of HIV PrEP provision pilot studies
Test
- Implement and monitor BHIVA, British Association for Sexual Health and HIV (BASHH) and British Infection Association (BIA) Adult HIV testing guidelines 2020, including opt-out in SHSs and reduce inequalities in HIV testing
- Continue ED opt-out testing in very high and high prevalence HIV areas
- Work with GP practices to promote HIV testing into routine primary care pathways
- Scale up partner notification activities
- Understand the drivers of late diagnosis in order to better focus interventions
Treat
- Share learnings from UKHSA audits with local networks and encourage provision of peer support and psychological support within HIV treatment services
- Ensure commissioning arrangements are in place with local providers for HIV peer support provision
- Ensure local SHSs and HIV services engage with and learn from retention in care reviews to strengthen pathways
Thrive
- Ensure services provide a holistic approach to HIV care for women, signposting to other services, such as partner violence services and menopause clinics, when needed
- Improve the quality of life for people living with HIV, including promotion of U=U, particularly for older adults and people with complex health and care needs, by commissioning integrated, person-centred support services that address physical, mental and social wellbeing
Collaborate
- Share culturally competent education and awareness of new technologies as they become available to enhance national messaging
- Apply and promote the HIV Low Prevalence Toolkit to guide local planning, commissioning and evaluation and strengthen outreach, primary care partnerships and service visibility to ensure equitable access to prevention, treatment and care in low prevalence areas
Charts, tables and maps
Information on data sources and analytical methods used in this epidemiological report can be found below.
New HIV diagnoses
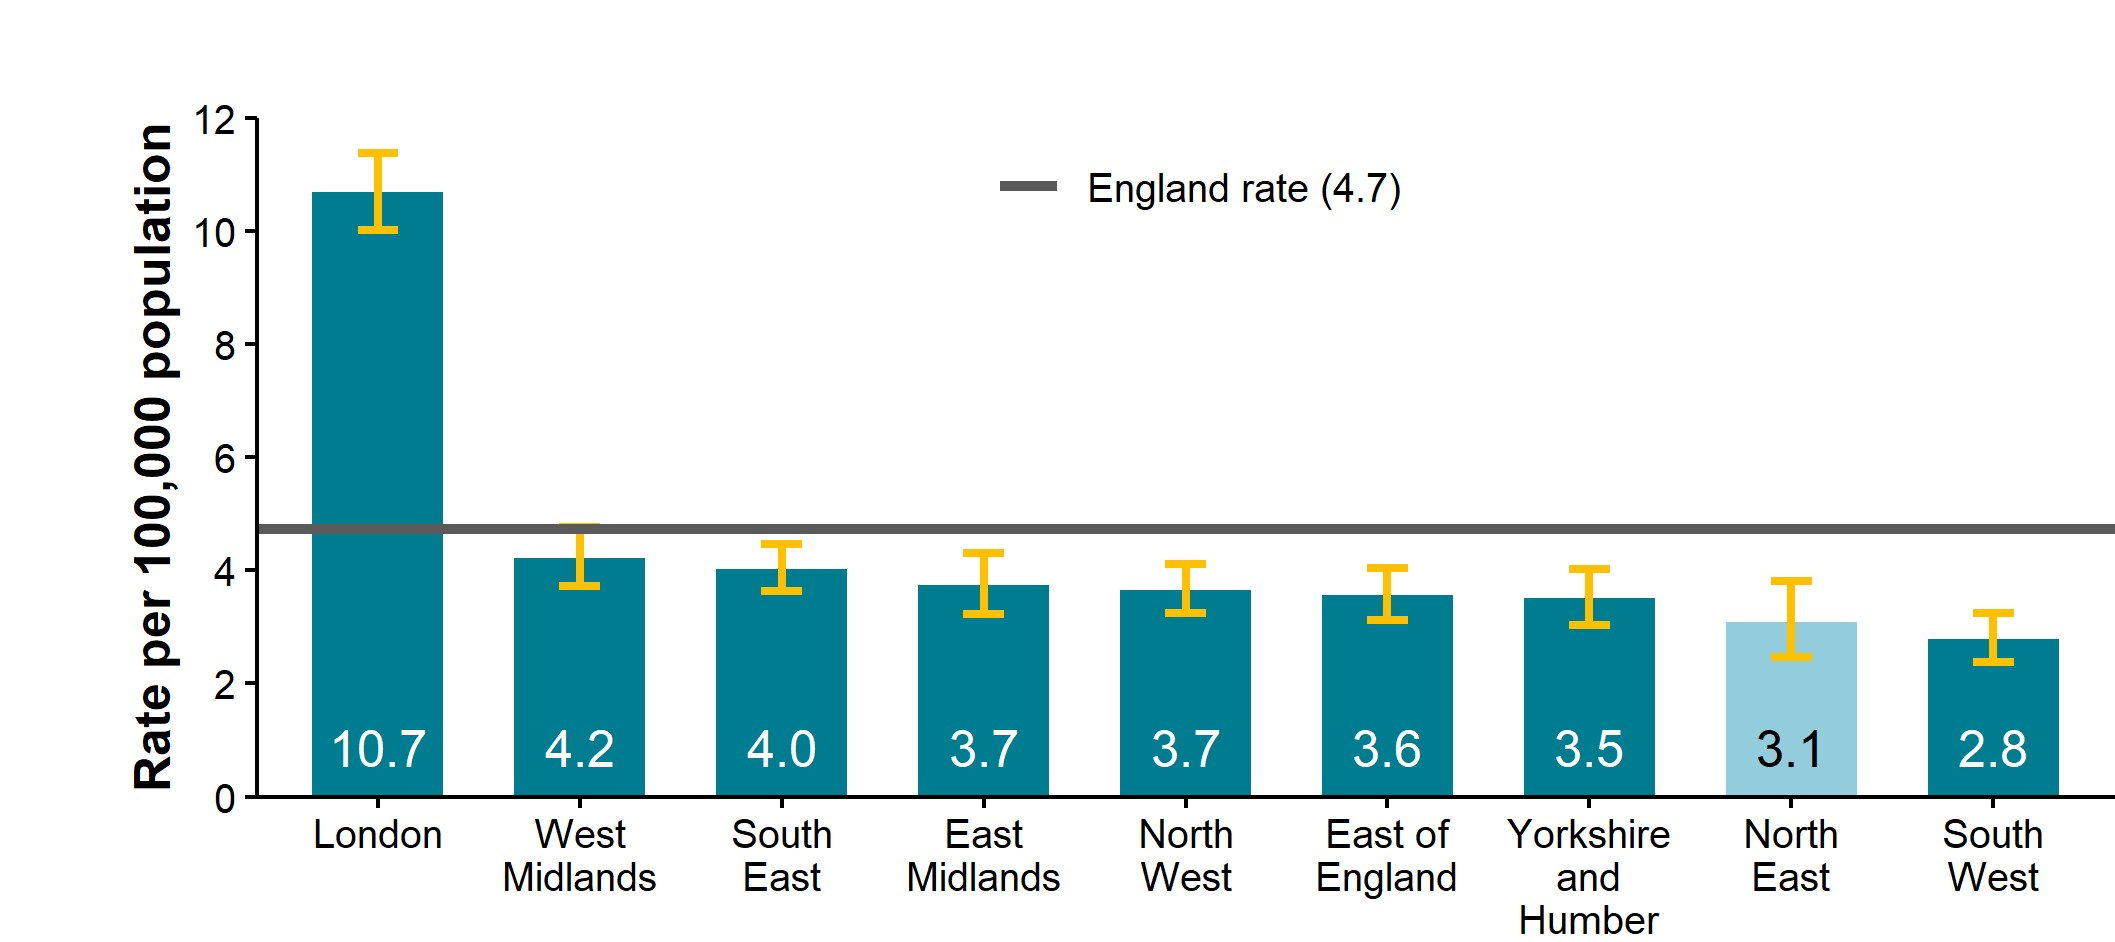
Figure 1. Rate of new HIV diagnoses per 100,000 population (all ages) by UKHSA region of residence, 2024
Sources: UKHSA, HIV and AIDS New Diagnoses and Deaths (HANDD).
The number of new diagnoses will depend on accessibility of testing as well as infection and transmission.
Due to a change in the definition of new HIV diagnoses, this figure no longer includes data for persons previously diagnosed abroad and differs from that included in previous reports.
Figure 1 is a column chart showing the rate of new HIV diagnoses by UKHSA region of residence for the year 2024. Rates are per 100,000 population and are not age-restricted. The overall England rate (4.7 per 100,000 population) is represented as a solid horizontal line.
The chart shows that the North East had the second lowest rate of all regions in England (3.1 per 100,000 population), with South West having the lowest rate (2.8 per 100,000 population). London had the highest rate (10.7 per 100,000 population), which was the only one greater than the national rate.
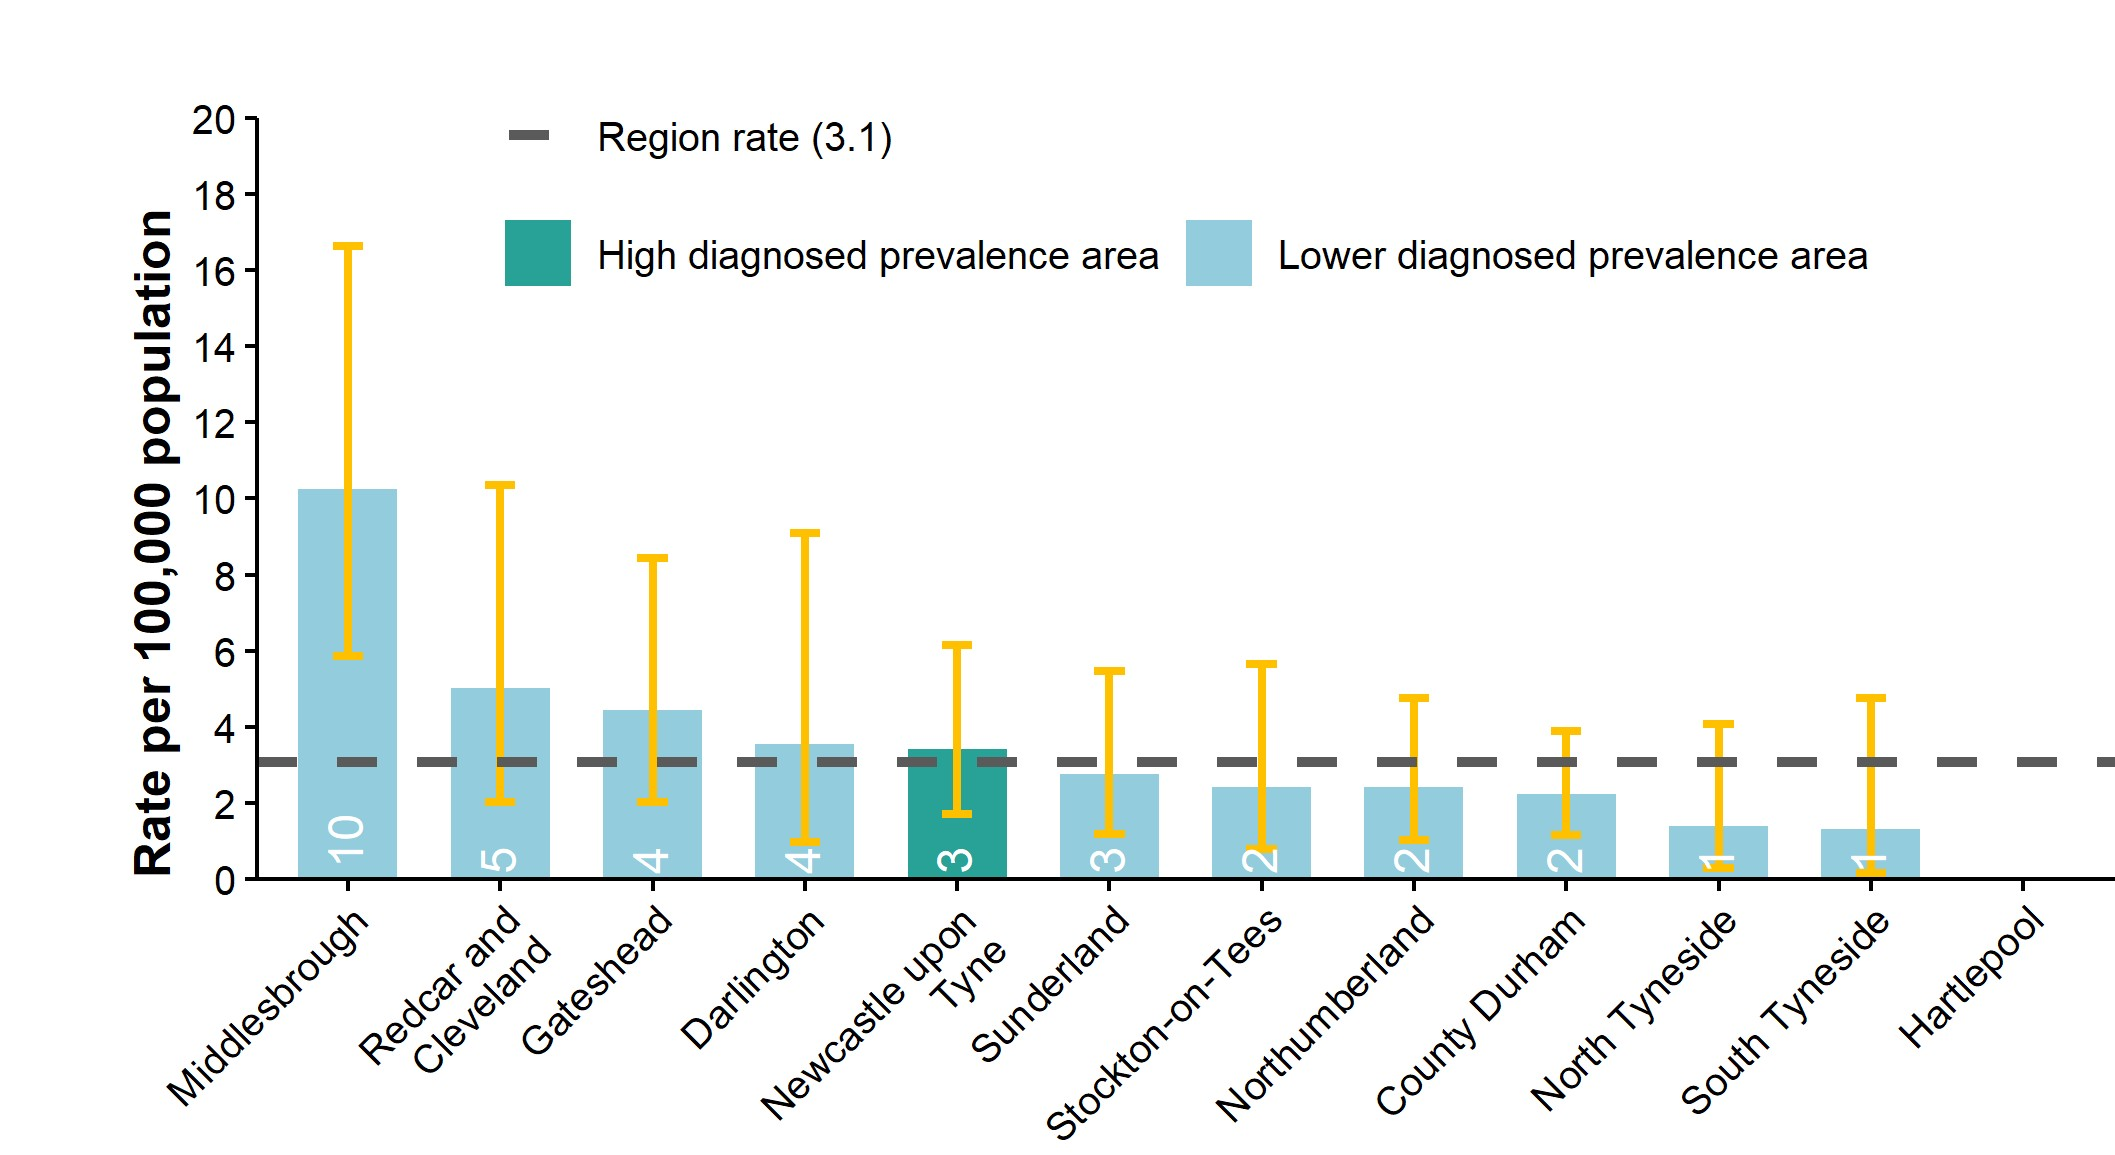
Figure 2. Rate of new HIV diagnoses per 100,000 population (all ages) by upper tier local authority of residence, North East residents, 2024
Sources: UKHSA, HIV and AIDS New Diagnoses and Deaths (HANDD).
The number of new diagnoses will depend on accessibility of testing as well as infection and transmission.
Colour coding of bars does not relate to rate of new diagnosis but to the diagnosed prevalence (see People living with diagnosed HIV). HIV diagnosed prevalence (rate per 1,000 aged 15 to 59 years) as per NICE testing guidelines: lower diagnosed prevalence less than 2, high diagnosed prevalence 2 to 5, extremely high diagnosed prevalence more than 5.
Due to a change in the definition of new HIV diagnoses, this figure no longer includes data for persons previously diagnosed abroad and differs from that included in previous reports.
Figure 2 is a column chart showing rates of new HIV diagnoses by North East local authority for the year 2024. LAs are shown in descending order in relation to their new HIV diagnosis rate. Rates are per 100,000 population and are not age-restricted. The overall North East rate (3.2 per 100,000 population) is represented as a dashed horizontal line. The colour coding of the columns is designed to help relate new HIV diagnosis rates to the HIV diagnosed prevalence (rate per 1,000 aged 15 to 59 years) as per NICE testing guidelines for each local authority.
The chart shows that the rate of new HIV diagnoses (for all ages) across the 12 North East local authorities ranged from 1 per 100,000 in North Tyneside and South Tyneside, to 10 per 100,000 population in Middlesbrough. In addition to Middlesbrough, Redcar and Cleveland, Gateshead, Darlington and Newcastle upon Tyne had rates above the North East regional rate of 3.2 per 100,000 population. Of these, Newcastle upon Tyne was classified as an area of high diagnosed prevalence in 2024 (2.35 per 1,000 aged 15 to 59 years) (Figure 30). No new HIV diagnoses were reported in Hartlepool in 2024.
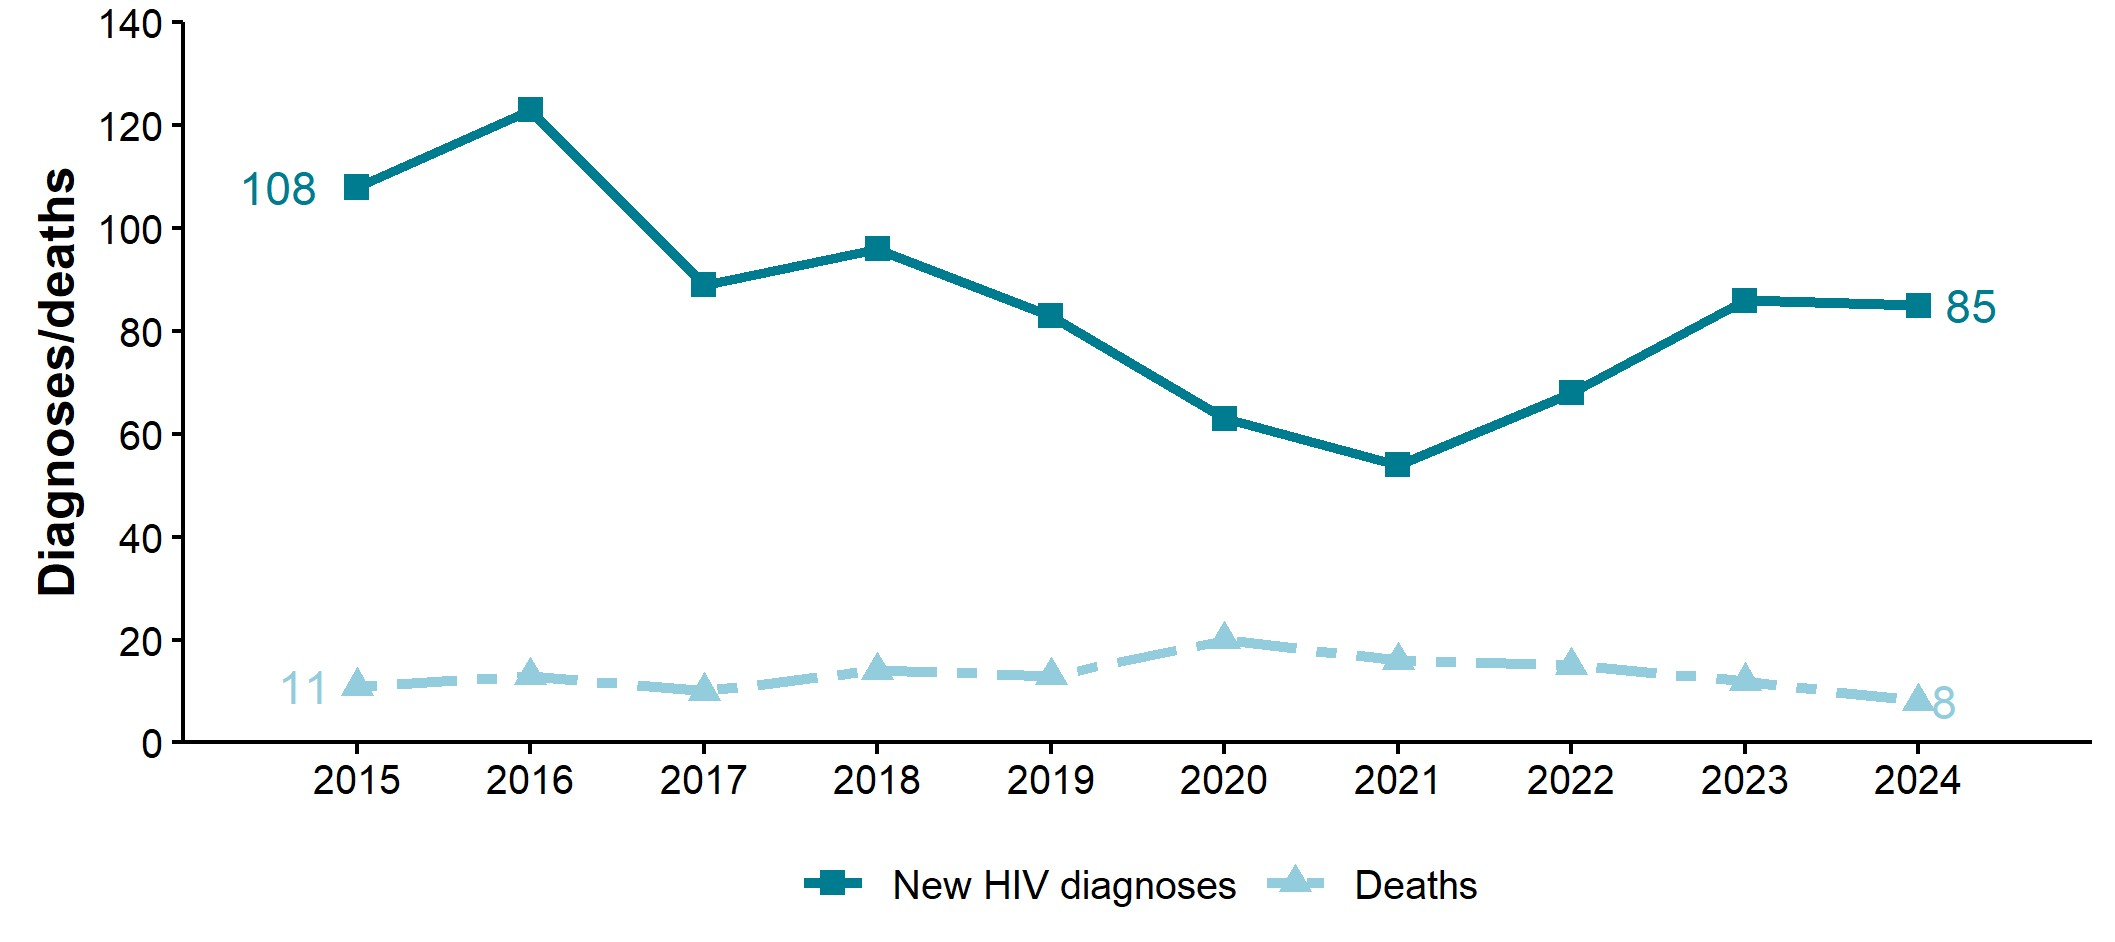
Figure 3. New HIV diagnoses and deaths, the North East, 2015 to 2024 [note 1]
Sources: UKHSA, HIV and AIDS New Diagnoses and Deaths (HANDD).
The number of new diagnoses will depend on accessibility of testing as well as infection and transmission. New HIV diagnoses are shown by UK region of residence at diagnosis. Deaths are shown by UK region of death which in some instances may not be the same as UK region of residence at diagnosis. Region of death may not be known for all deaths, particularly for those in the most recent years. Numbers for these years should be interpreted as minimum numbers (deaths reported and allocated to a region of death to date) and not as a trend.
Due to a change in the definition of new HIV diagnoses, this figure no longer includes data for persons previously diagnosed abroad and differs from that included in previous reports.
Note 1: numbers may rise as further reports are received and more information is obtained. This is more likely to affect more recent years, particularly 2024.
Figure 3 is a line chart showing the trend in number of new HIV diagnoses (solid line) and deaths in HIV-diagnosed North East residents (dashed line) between the years 2015 and 2024. Data is not age restricted.
The chart shows that the number of new diagnoses in 2024 was similar to that in 2023 (86 versus 85 new diagnoses, 1% decrease) and similar to that in 2019 (83 new diagnoses, 4% increase).
This trend mirrors that seen nationally with 2,773 people newly diagnosed with HIV in 2024, a 2% decrease from 2,838 in 2023 and a 2% decrease from 2,823 in 2019.
There were 8 deaths in North East residents living with HIV in 2024, a decline of 33% compared to 2023. Additional deaths due to COVID-19 were reported during the pandemic people in people living with HIV.
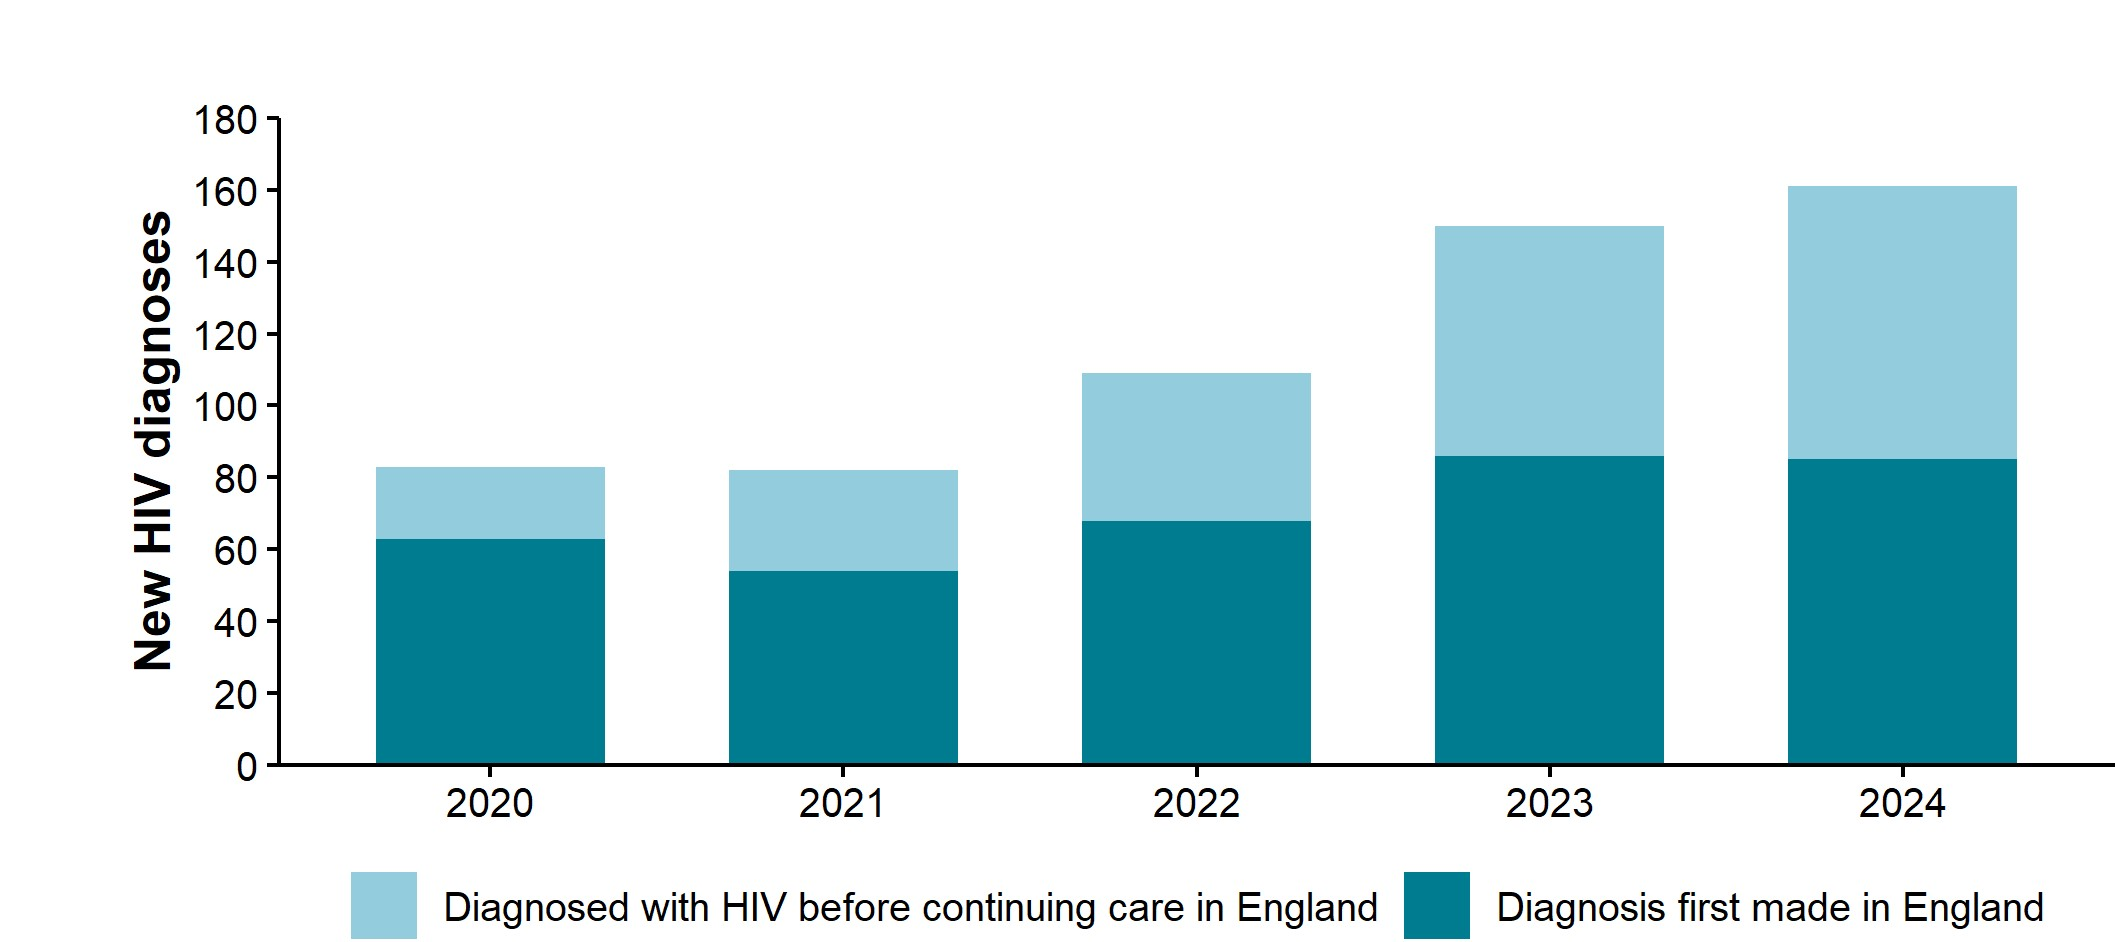
Figure 4. New HIV diagnoses by whether a person had been diagnosed with HIV before continuing care in England, the North East, 2020 to 2024 [note 1]
Sources: UKHSA, HIV and AIDS New Diagnoses and Deaths (HANDD).
The number of new diagnoses will depend on accessibility of testing as well as infection and transmission.
Note 1: numbers may rise as further reports are received and more information is obtained. This is more likely to affect more recent years, particularly 2024.
Figure 4 is a stacked bar chart displaying the trend in new HIV diagnoses in North East residents from 2020 to 2024 by whether a person had been diagnosed with HIV before continuing care in England. The dark-shaded bars represent new HIV diagnoses where there had been no prior diagnosis abroad recorded and the light-shaded bars above them represent the additional new HIV diagnoses where the person had previously been diagnosed with HIV before continuing care in England.
The chart shows that there were 161 all new HIV diagnoses in North East residents in 2024. Of these, 85 (53%) were among people whose diagnosis of HIV was first made in England and 76 (47%) were among people who had previously been diagnosed with HIV before continuing care in England.
The proportion of individuals previously diagnosed abroad has been increasing steadily over the past 10 years from 12% (14 out of 120 new diagnoses) in 2015 to 47% (76 out of 161 new diagnoses) in 2024. The number of individuals previously diagnosed before continuing care in England increased by 19% compared to 2023 (64) in North East residents.
Figure 5. New HIV diagnoses by probable route of exposure (adjusted for missing route information), North East residents, 2015 to 2024 [note 1]
Sources: UKHSA, HIV and AIDS New Diagnoses and Deaths (HANDD).
The number of new diagnoses will depend on accessibility of testing as well as infection and transmission.
Due to a change in the definition of new HIV diagnoses, this figure no longer includes data for persons previously diagnosed abroad and differs from that included in previous reports.
Note 1: numbers may rise as further reports are received and more information is obtained. This is more likely to affect more recent years, particularly 2024.
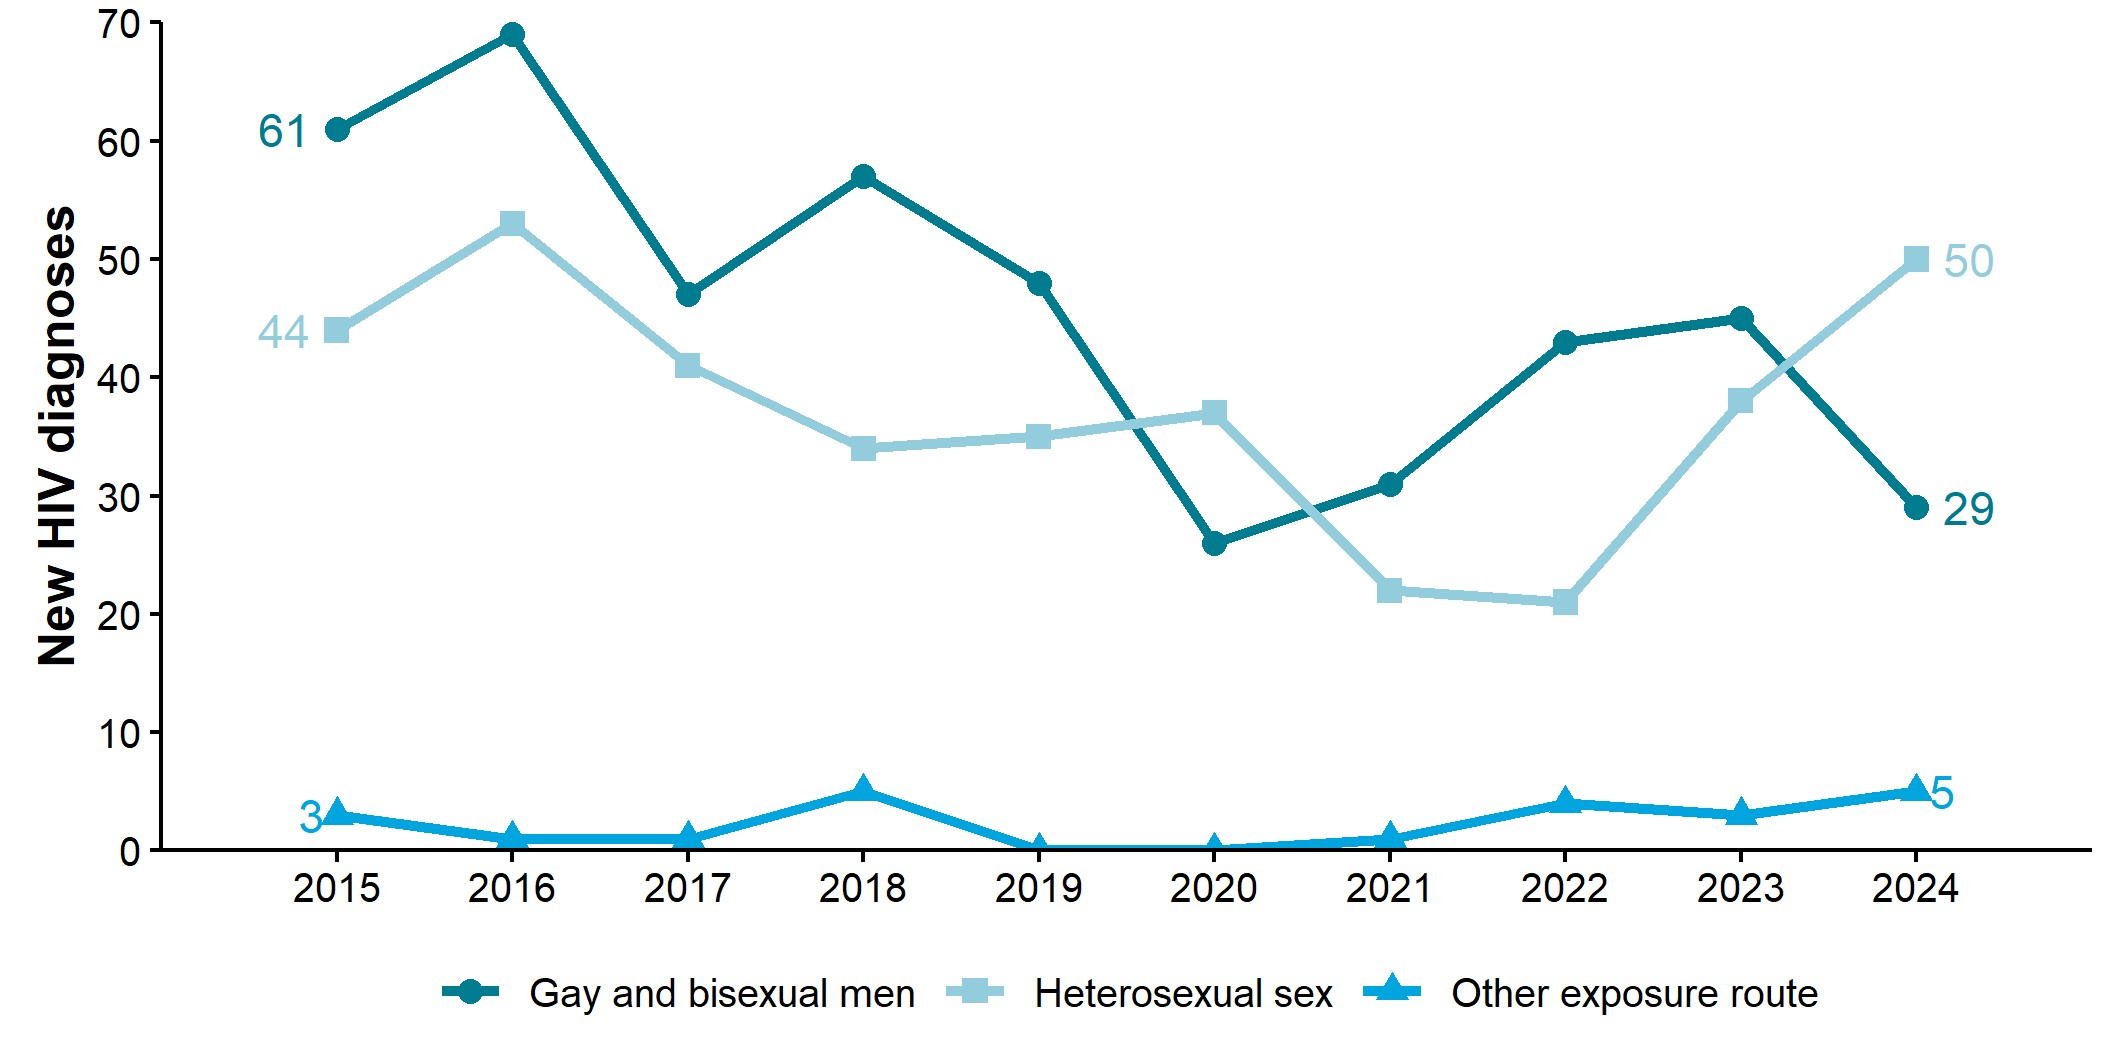
Figure 5 is a line chart showing the trend in new HIV diagnoses by probable route of acquiring HIV over the past 10 years. Three probable routes of infection are shown: gay and bisexual men, heterosexual sex, and other exposure routes.
The number of HIV diagnoses attributed to sex between gay and bisexual men generally declined between 2015 (61 diagnoses) and 2024 (29 diagnoses), despite some year-to-year fluctuation. Overall, this represents a 52% decrease over the 10-year period.
In contrast, the number of diagnoses attributed to heterosexual sex has continuously increased in the past 2 years (from 21 in 2022 to 38 in 2023, 81% increase; and 50 in 2024, 32% increase) and is now similar to the peak observed in 2016 (53).
Moreover, in 2024 heterosexual sex was the most common probable route of acquiring HIV accounting for 60% of new diagnoses followed by sex among gay and bisexual men, which accounted for 35% of new diagnoses.
All other probable routes of infection remain low in 2024, accounting for 5% of new diagnoses. These are broken down further in Figure 6.
Figure 6. New HIV diagnoses detailed ‘other’ route of exposure (not adjusted for missing information), North East residents, 2015 to 2024 [note 1]
Sources: UKHSA, HIV and AIDS New Diagnoses and Deaths (HANDD).
The number of new diagnoses will depend on accessibility of testing as well as infection and transmission.
Due to a change in the definition of new HIV diagnoses, this figure no longer includes data for persons previously diagnosed abroad and differs from that included in previous reports.
Note 1: numbers may rise as further reports are received and more information is obtained. This is more likely to affect more recent years, particularly 2024.
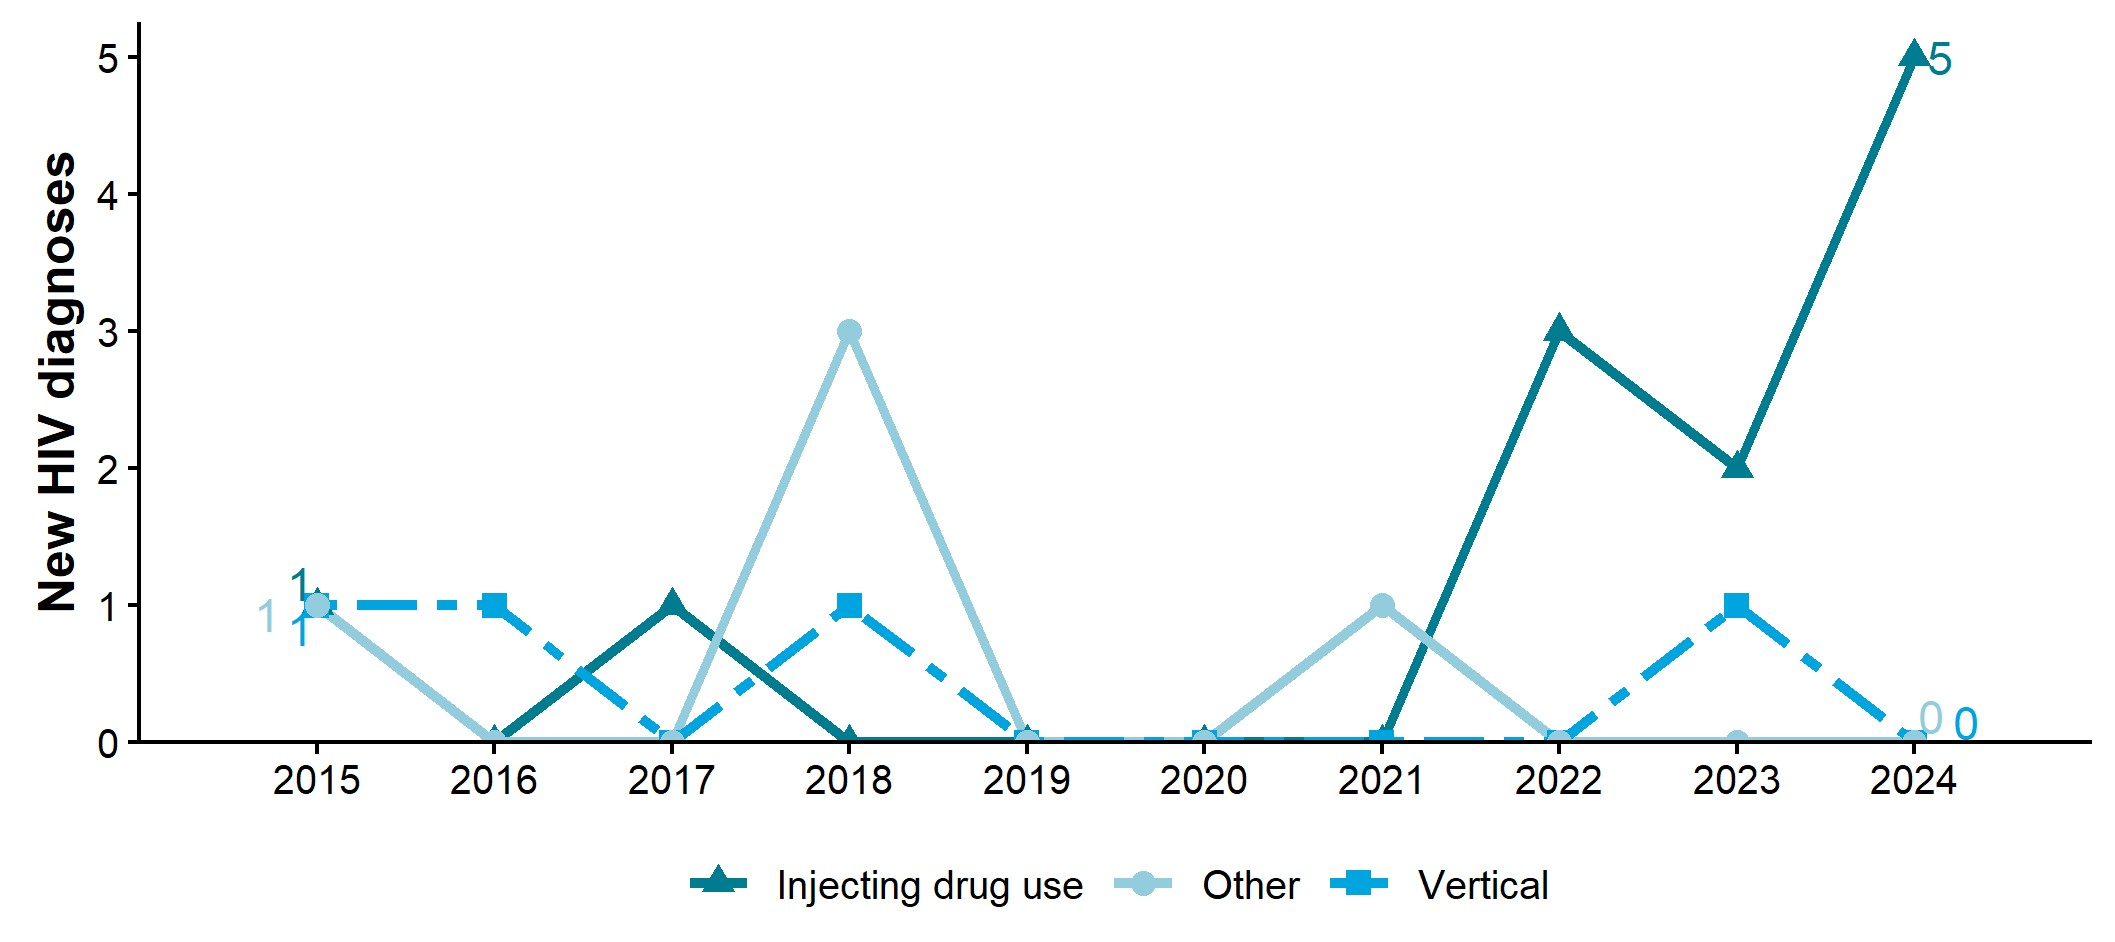
Figure 6 is a line chart showing new HIV diagnoses detailed by “other” routes of exposure. Three “other” routes of exposure are shown: injecting drug use, vertical transmission (mother-to-child) and other routes (including contaminated blood products and healthcare-related contact).
In 2024, there were 5 new HIV diagnoses from injecting drug use exposure and none from vertical or other routes of exposure. The number of new HIV diagnoses from injecting drug use exposure increased by 150% between 2023 and 2024. This is the highest yearly number of new HIV diagnoses from any ‘other’ route of exposure in the past decade.
Figure 7. Number of new HIV diagnoses by age group and gender identity, North East residents, 2024
Sources: UKHSA, HIV and AIDS New Diagnoses and Deaths (HANDD).
The number of new diagnoses will depend on accessibility of testing as well as infections and transmission.
Due to a change in the definition of new HIV diagnoses, this figure no longer includes data for persons previously diagnosed abroad and differs from that included in previous reports.
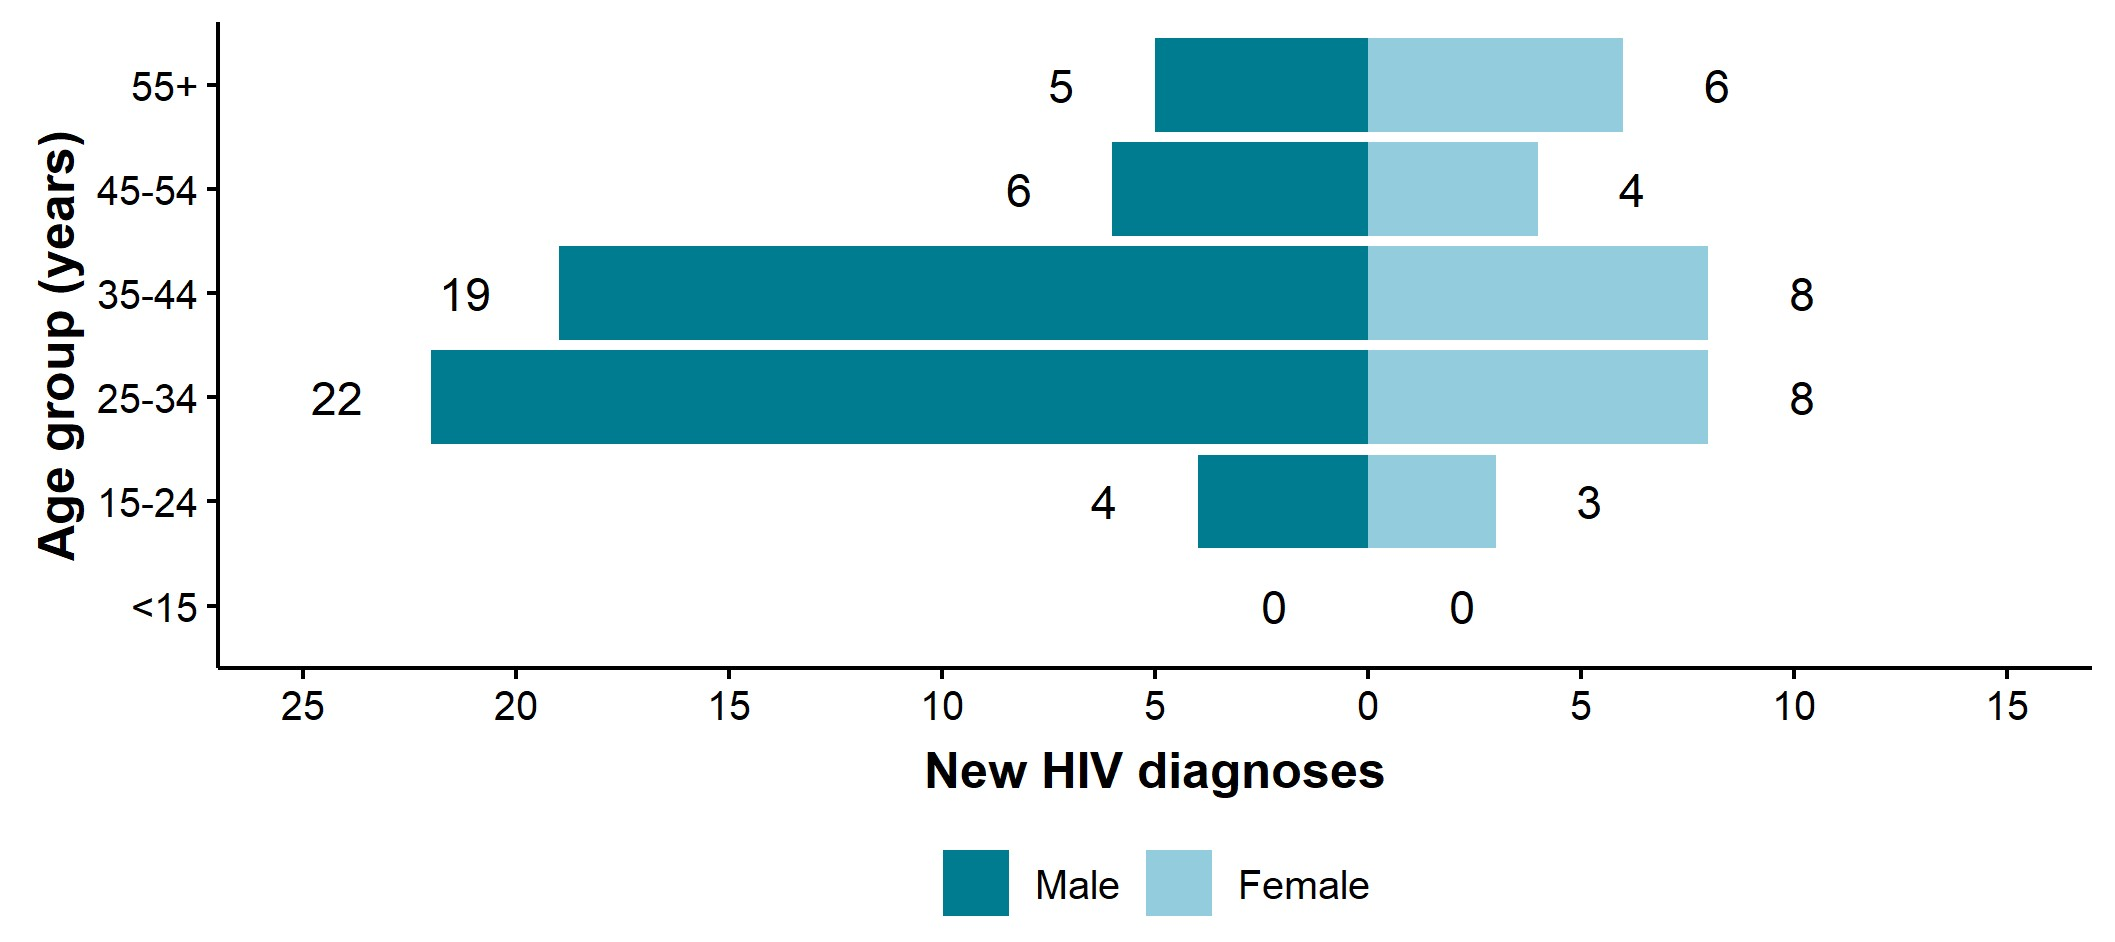
Figure 7 is a type of bar chart called an age-gender pyramid displaying the number of new HIV diagnoses in the North East in 2024 by age group and gender identity. Six age groups are displayed: under 15 years, 15 to 24 years, 25 to 34 years, 35 to 44 years, 45 to 54 years and 55 years and over.
Figure 7 shows that the highest number of new diagnoses among males in 2024 occurred in those aged 25 to 34 years (22 new diagnoses), closely followed by males aged 35 to 44 years (19), a difference of only 16%. In contrast, in 2023, diagnoses among men aged 25 to 34 years was 193% higher than among those aged 35 to 44 years. This suggest a shift in the distribution of new diagnoses between 2023 and 2024, with a decreasing burden among men aged 25 to 34 years and an increasing burden among those aged 35 to 44 years.
Among females, the highest number of new diagnoses was the same in those aged 25 to 34 and 35 to 44 years (8 new diagnoses each).
Figure 8. Number of new HIV diagnoses by age group and gender identity, split by whether first diagnosed in the UK or abroad, North East residents, 2024
Sources: UKHSA, HIV and AIDS New Diagnoses and Deaths (HANDD).
The number of new diagnoses will depend on accessibility of testing as well as infections and transmission.
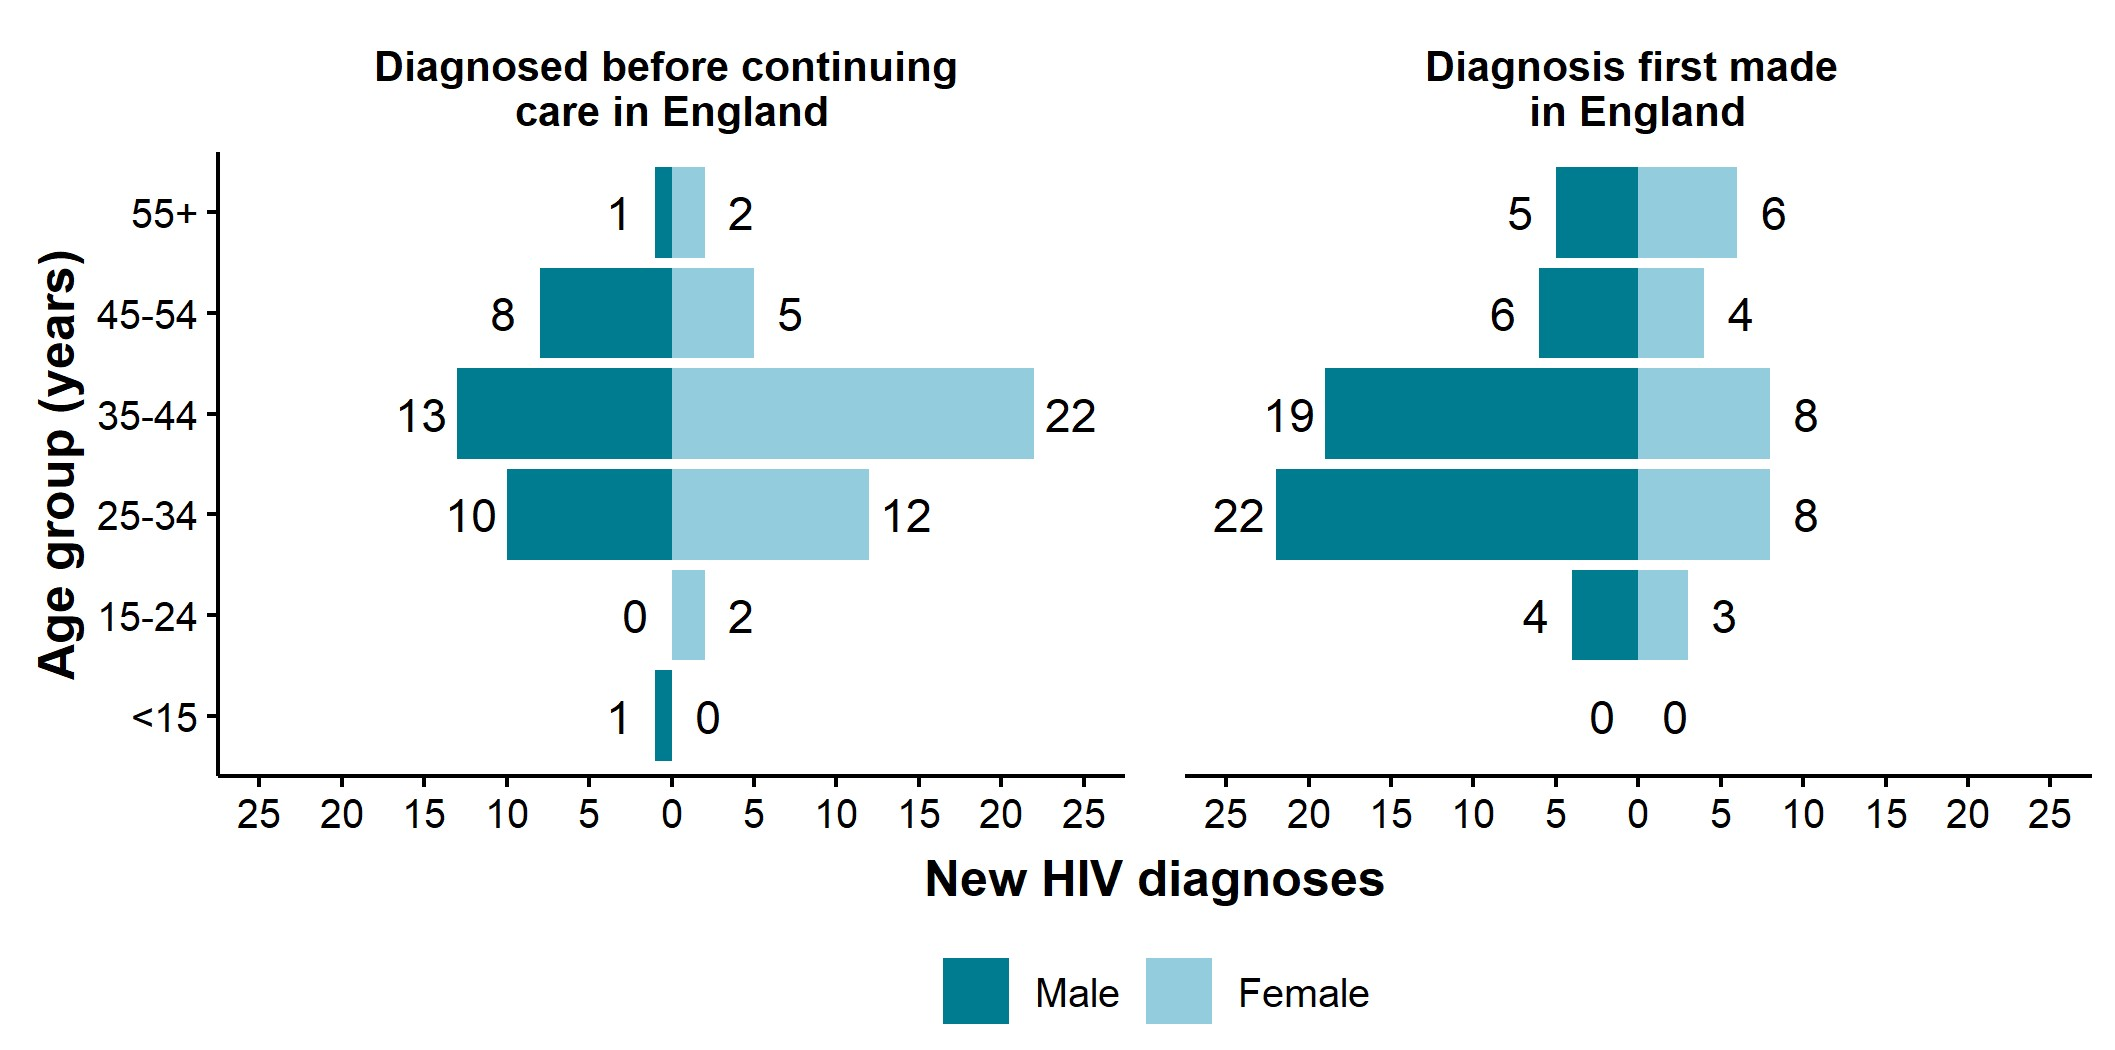
In Figure 8, age-gender pyramids are presented separately for the new HIV diagnoses that had been previously diagnosed abroad or not. This enables better understanding of which groups remain exposed to the greatest risk of transmission in the North East.
In contrast to the age-gender distribution of new HIV diagnoses made in England (right-hand chart above; and Figure 7), individuals previously diagnosed before continuing HIV care in England (left-hand chart) were predominantly females aged 25 to 54 years.
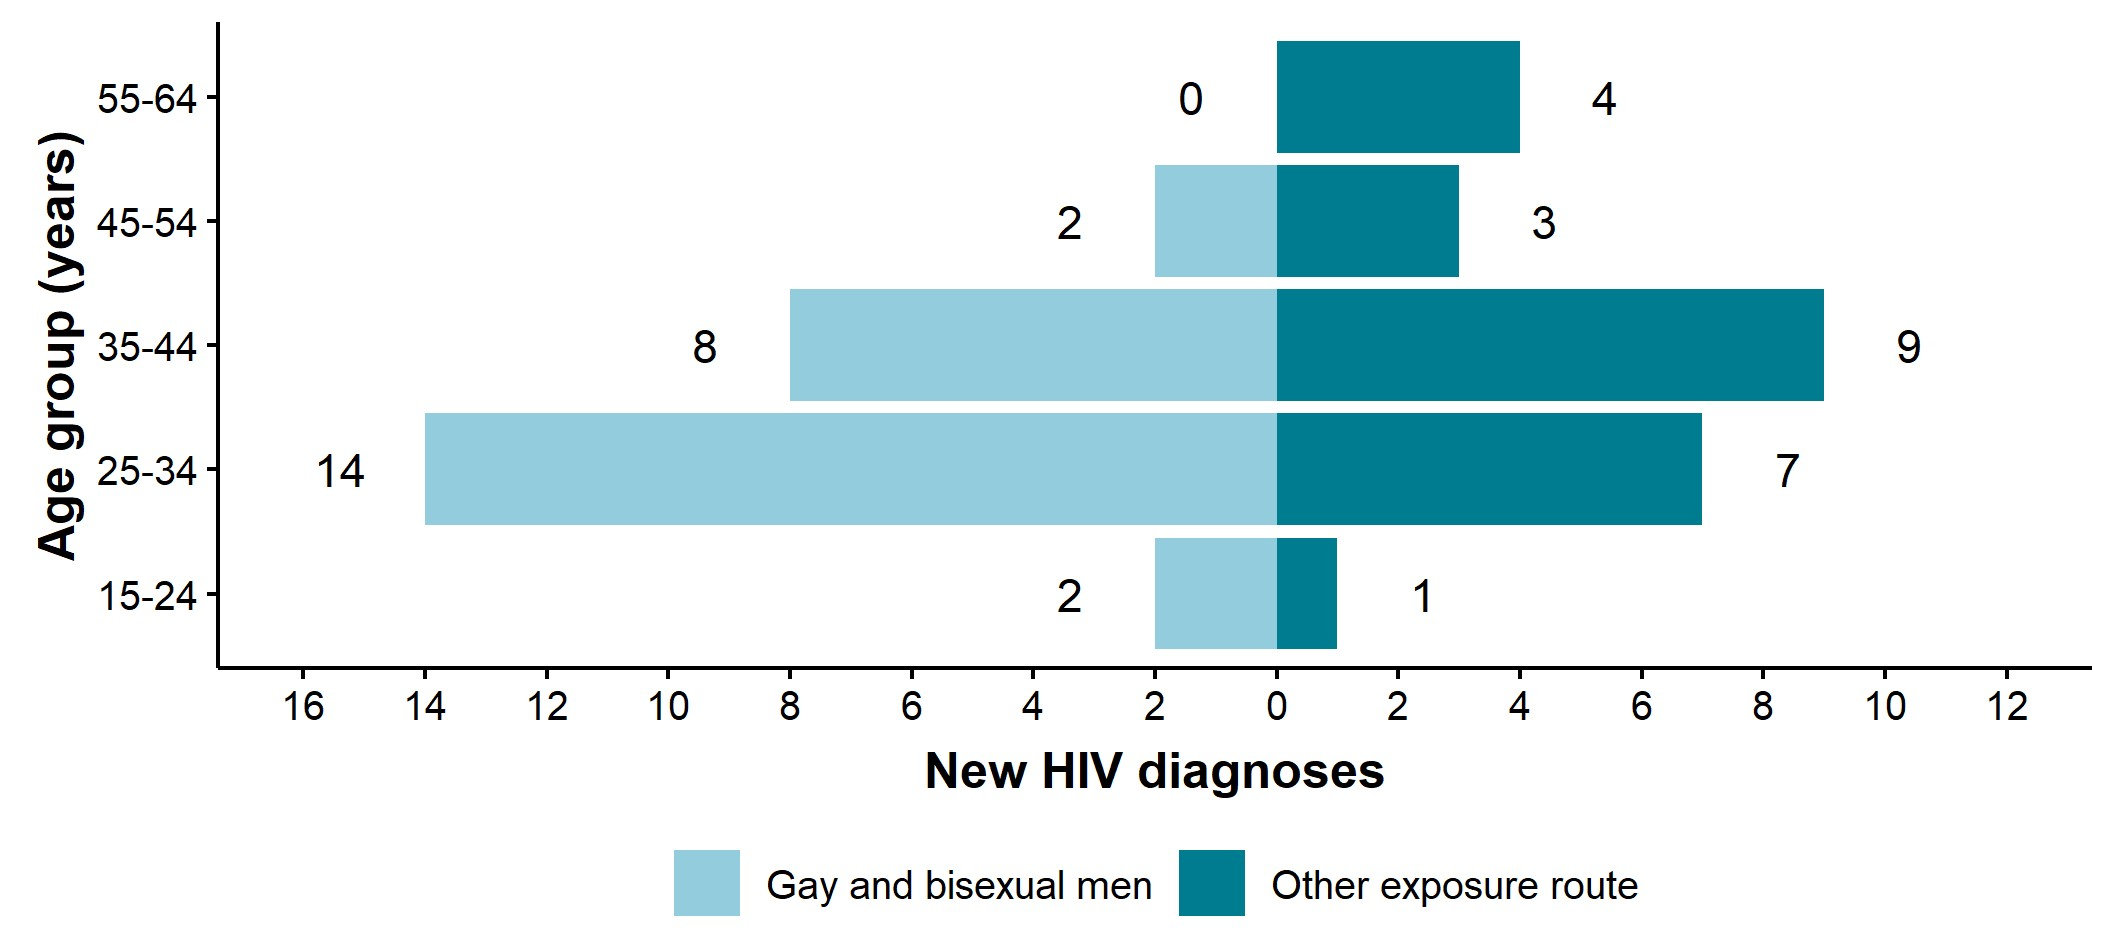
Figure 9. Number of new HIV diagnoses by age group and probable route of exposure, male North East residents aged 15 to 64 years, 2024
Sources: UKHSA, HIV and AIDS New Diagnoses and Deaths (HANDD).
The number of new diagnoses will depend on accessibility of testing as well as infection and transmission.
Due to a change in the definition of new HIV diagnoses, this figure no longer includes data for persons previously diagnosed abroad and differs from that included in previous reports.
Figure 9 is an age-gender pyramid displaying the number of new HIV diagnoses by age group and probable route of exposure (sex among gay and bisexual men vs. other exposure route) for male North East residents in 2024.
Sex among gay and bisexual men accounted for 52% of new diagnoses in males (26 out of 50, not adjusted for missing data) in 2024.
Among these, individuals aged 25 to 34 years were the most common age group (14 out of 26, 54%), followed by those aged 35 to 44 years (8 out of 26, 31%). Smaller proportions were seen in those aged 15 to 24 years (2 out of 26, 8%) and 45 to 54 years (2 out of 26, 8%), with no cases in those aged 55 to 64 years.
Individuals aged 35 to 44 years were the most common age group among males with ‘other exposure routes’ in 2024 (9 out of 24, 38%), followed by those aged 25 to 34 years (7 out of 24, 29%). Smaller proportions were seen in those aged 55 to 64 years (4 out of 24, 17%) and 45 to 54 years (3 out of 24, 13%), with the lowest proportion in those aged 15 to 24 years (1 out of 24, 4%).
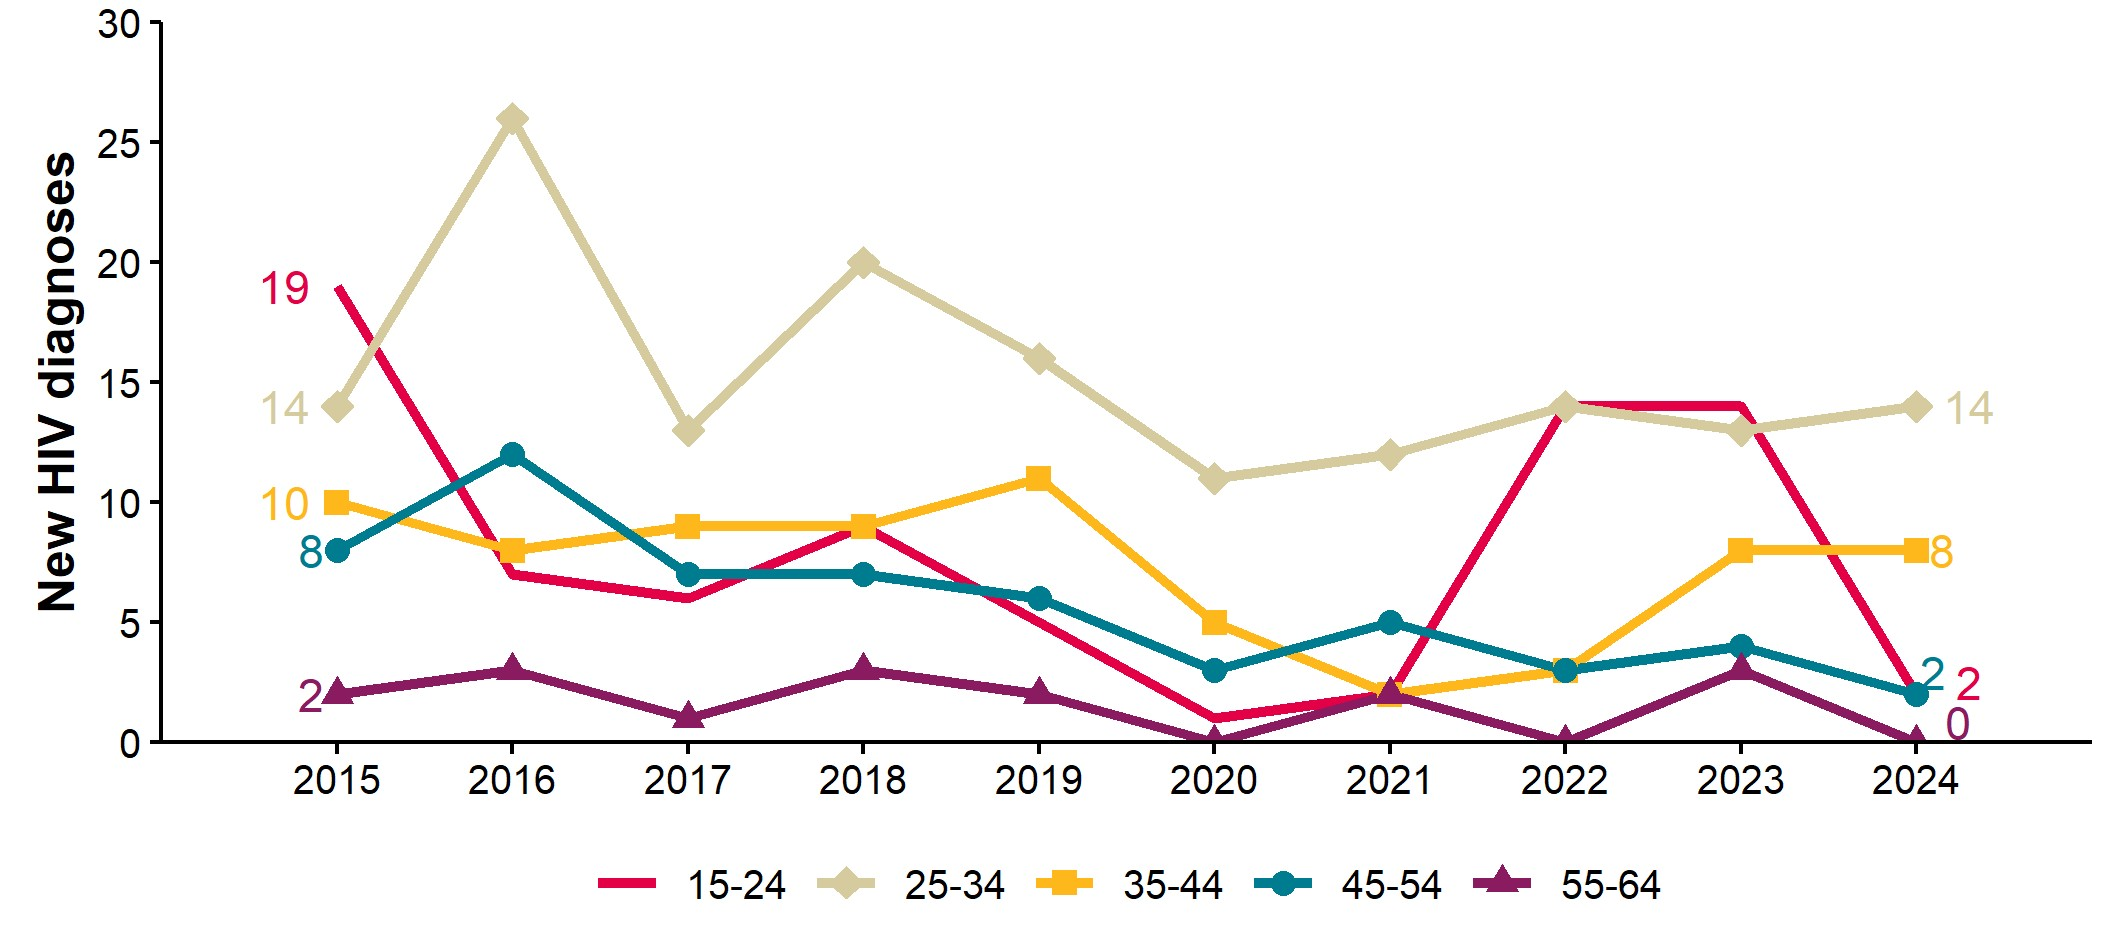
Figure 10. Number of new HIV diagnoses with a probable route of exposure through sex between gay and bisexual men by age group, North East residents aged 15 to 64 years, 2015 to 2024 [note 1]
Sources: UKHSA, HIV and AIDS New Diagnoses and Deaths (HANDD).
The number of new diagnoses will depend on accessibility of testing as well as infection and transmission.
Due to a change in the definition of new HIV diagnoses, this figure no longer includes data for persons previously diagnosed abroad and differs from that included in previous reports.
Note 1: numbers may rise as further reports are received and more information is obtained. This is more likely to affect more recent years, particularly 2024.
Figure 10 is a line chart displaying trend lines of the number of new HIV diagnoses in gay and bisexual men by age group in the North East over the past 10 years (2015 to 2024). Five age groups are displayed: 15 to 24 years, 25 to 34 years, 35 to 44 years, 45 to 54 years and 55 to 64 years. The final points on the lines correspond to the bars on the left hand side of Figure 9.
As shown in Figure 5, the number of new HIV diagnoses among gay and bisexual men generally declined between 2016 and 2024, despite some year-to-year fluctuation. When stratified by age, diagnoses among those aged 55 to 64 years remained consistently low throughout the period and fell to zero in 2024. New diagnoses among those aged 45 to 54 years continued to decline following the COVID-19 pandemic, reaching just 2 cases in 2024. While diagnoses among those aged 15 to 24 years increased after the pandemic, they declined sharply in 2024, falling by 86% compared with 2023 and remaining below 2015 levels. In contrast, diagnoses among men aged 25 to 34 and 35 to 44 years continued to increase following the pandemic and, by 2024, had returned to levels similar to those seen in 2015 (25 to 34 years: 14 versus 14; 35 to 44 years: 10 versus 8).
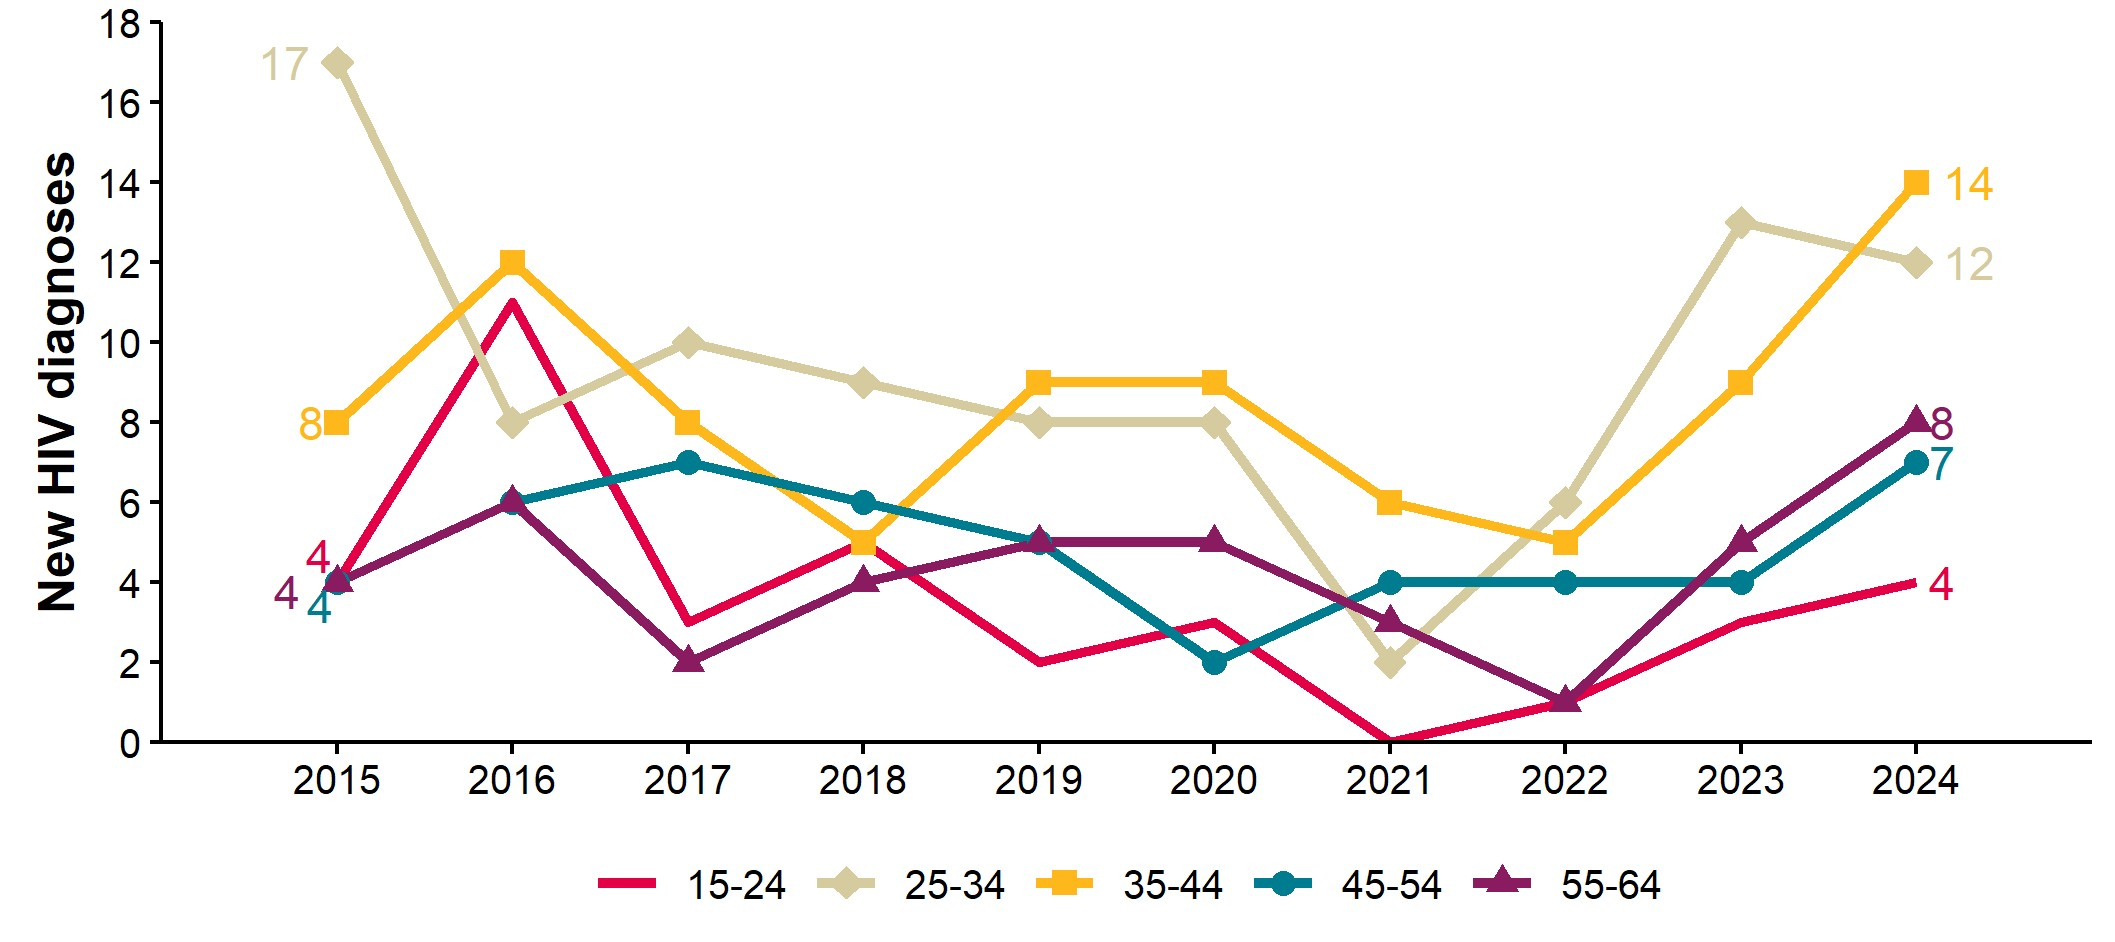
Figure 11. Number of new HIV diagnoses with a probable route of exposure through heterosexual sex by age group, North East residents aged 15 to 64 years, 2015 to 2024 [note 1]
Sources: UKHSA, HIV and AIDS New Diagnoses and Deaths (HANDD).
The number of new diagnoses will depend on accessibility of testing as well as infection and transmission.
Due to a change in the definition of new HIV diagnoses, this figure no longer includes data for persons previously diagnosed abroad and differs from that included in previous reports.
Note 1: numbers may rise as further reports are received and more information is obtained. This is more likely to affect more recent years, particularly 2024.
Figure 11 is a line chart displaying trend lines of the number of new HIV diagnoses with a probable route of exposure through heterosexual sex by age group in the North East over the past 10 years (2015 to 2024). Five age groups are displayed: 15 to 24 years, 25 to 34 years, 35 to 44 years, 45 to 54 years and 55 to 64 years.
As previously described in Figure 5, the numbers of new HIV diagnoses attributed to heterosexual sex generally declined before the COVID-19 pandemic but have increased subsequently over the past 2 years. This pattern was observed across all age groups except those aged 25 to 34 years, where diagnoses decreased by 8% between 2023 and 2024.
Between 2022 and 2024, the largest proportional increase in new HIV diagnoses occurred among those aged 55 to 64 years, rising from 1 to 8 diagnoses (700%). However, the largest absolute increase was among those aged 35 to 44 years, where diagnoses increased from 5 to 14 (180%). This age group accounted for the highest proportion of heterosexual-attributed diagnoses in men in 2024, representing 31% of new diagnoses in this exposure category.
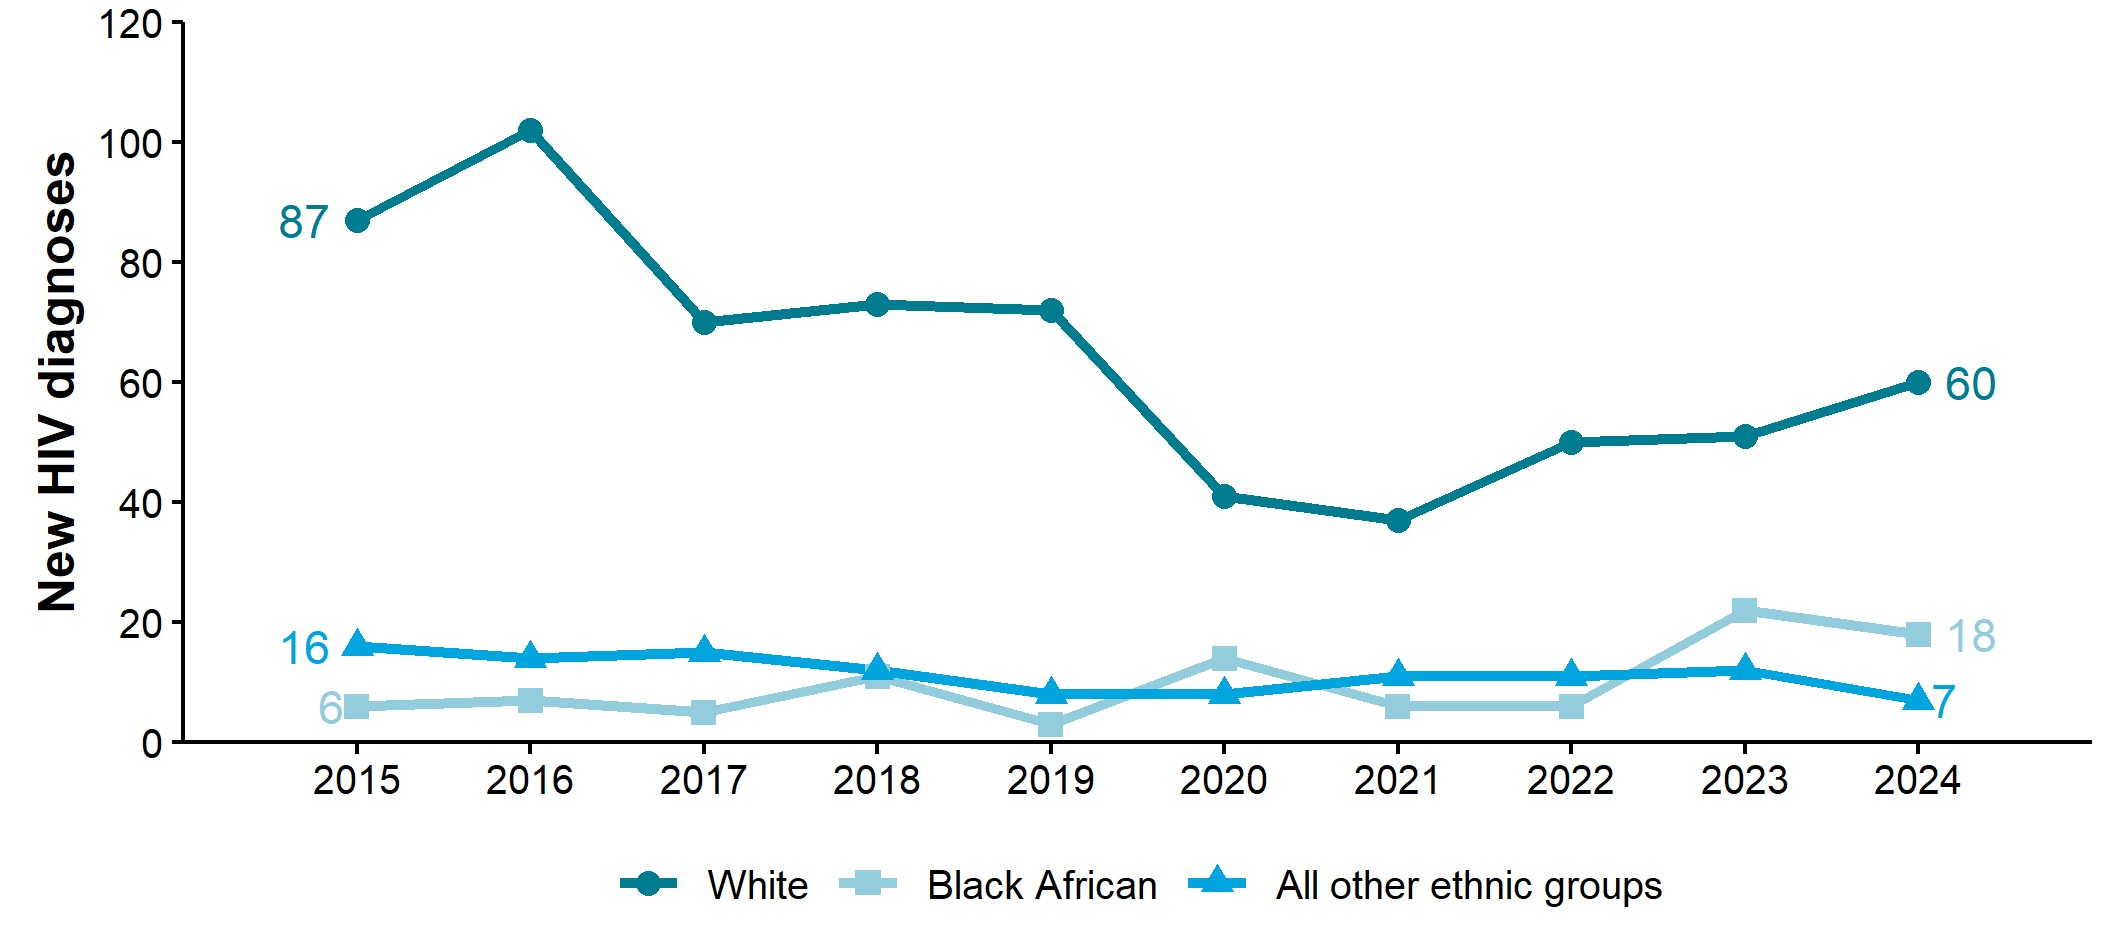
Figure 12. Number of new HIV diagnoses by ethnic group (adjusted for missing ethnic group information), North East residents, 2015 to 2024 [note 1]
Sources: UKHSA, HIV and AIDS New Diagnoses and Deaths (HANDD).
The number of new diagnoses will depend on accessibility of testing as well as infection and transmission.
Due to a change in the definition of new HIV diagnoses, this figure no longer includes data for persons previously diagnosed abroad and differs from that included in previous reports.
Note 1: numbers may rise as further reports are received and more information is obtained. This is more likely to affect more recent years, particularly 2024.
Figure 12 is a line chart showing the trend in new HIV diagnoses by ethnic group over the past 10 years. The White and Black African ethnic groups are represented as distinct categories. All other ethnic groups are grouped into a single category.
The chart shows the highest number of new HIV diagnoses remained in the White ethnic group in North East residents in 2024, accounting for 71% of individuals.
New diagnoses in the Black African ethnic group increased from 6 in 2015 to 18 in 2024, representing a 200% increase over the period.
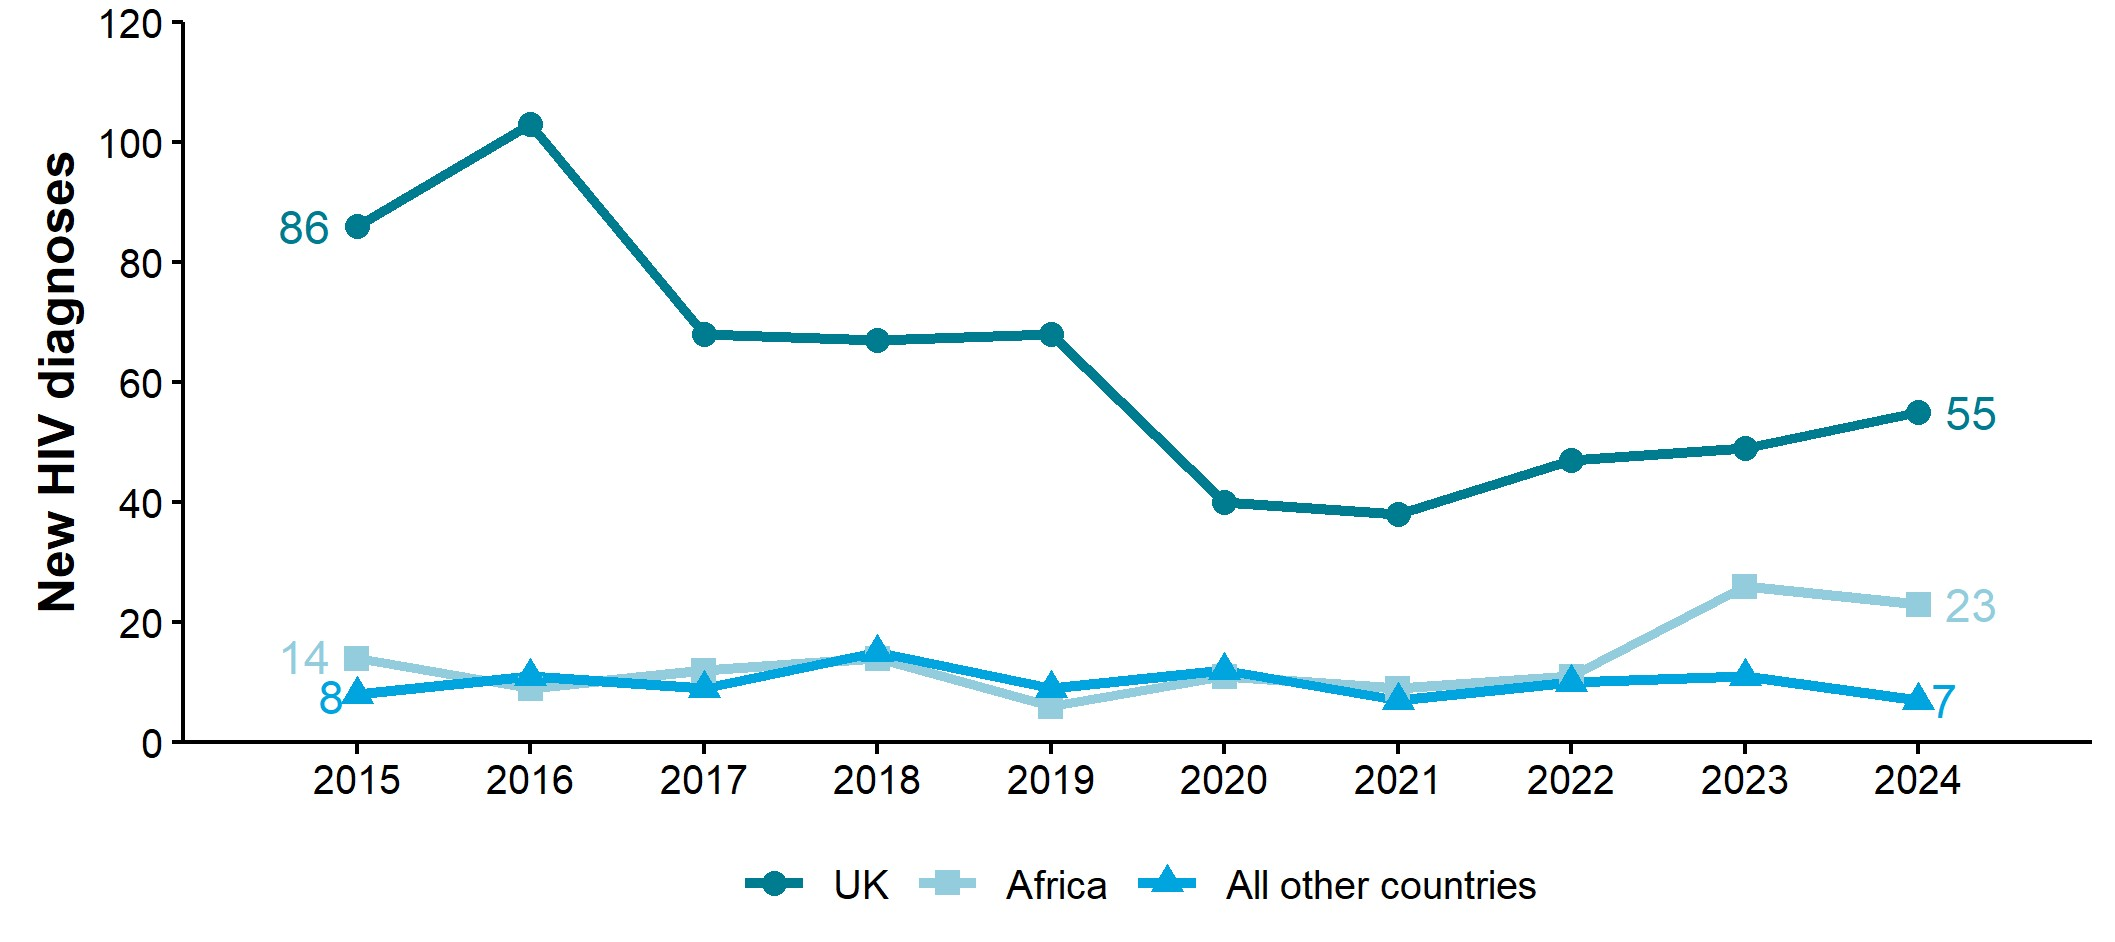
Figure 13. Number of new HIV diagnoses by world region of birth (adjusted for missing world region of birth information), North East residents, 2015 to 2024 [note 1]
Sources: UKHSA, HIV and AIDS New Diagnoses and Deaths (HANDD).
The number of new diagnoses will depend on accessibility of testing as well as infection and transmission.
Due to a change in the definition of new HIV diagnoses, this figure no longer includes data for persons previously diagnosed abroad and differs from that included in previous reports.
Note 1: numbers may rise as further reports are received and more information is obtained. This is more likely to affect more recent years, particularly 2024.
Figure 13 is a line chart showing the trend in new HIV diagnoses by world region of birth over the past 10 years. The UK and Africa are represented as distinct categories. All other world regions of birth are grouped into a single category.
The chart shows that the number of new HIV diagnoses among North East residents born in the UK was 36% lower in 2024 than in 2015 (55 versus 86). In contrast, the number of new HIV diagnoses among residents born in Africa was 64% higher in 2024 than in 2015 (23 versus 14). Consequently, the proportion of new HIV diagnoses occurring in UK-born residents fell from 80% in 2015 to 65% in 2024, while the proportion occurring in African-born residents increased from 13% to 27%.
Although the number of diagnoses among residents born in Africa was higher in 2024 than in 2015, between 2023 and 2024 the number of new HIV diagnoses increased only among UK-born residents (49 to 55 diagnoses, a 12% increase). During the same period, diagnoses decreased among residents born in Africa (26 to 23 diagnoses, an 11% decrease) and among those born in all other countries (11 to 7 diagnoses, a 36% decrease).
Table 1. Number of new HIV diagnoses by ethnic group and whether born abroad, North East residents, 2020 to 2024 [note 1]
| Ethnic group | UK-born | Born abroad | Unknown country of birth |
|---|---|---|---|
| White | 165 | 7 | 14 |
| Black African | 1 | 47 | 4 |
| Other | 3 | 34 | 2 |
| Unknown | 2 | 8 | 69 |
Sources: UKHSA, HIV and AIDS New Diagnoses and Deaths (HANDD).
Table 1 shows that the relationship between ethnic group and whether a person newly diagnosed with HIV was born abroad. Data is for the 5-year period 2020 to 2024. Those with a prior diagnosis abroad are excluded. To make it clear that there are differences in completeness of ascertainment of country of birth for different ethnic groups, numbers in this table are not adjusted for missing information.
The number of new diagnoses will depend on accessibility of testing as well as infection and transmission.
Note 1: numbers may rise as further reports are received and more information is obtained. This is more likely to affect more recent years, particularly 2024.
Table 1 shows that the relationship between ethnic group and whether a person newly diagnosed with HIV was UK born or born abroad in North East residents. Over the past 5 years (2020 to 2024), 89% of new HIV diagnoses in the White ethnic group were in individuals born in the UK.
In contrast, 90% and 87% of new HIV diagnoses in the Black African ethnic group and the Other ethnic groups, respectively, were in individuals born abroad.
However, it is important to highlight differences in the completeness of data ascertainment across these groups.
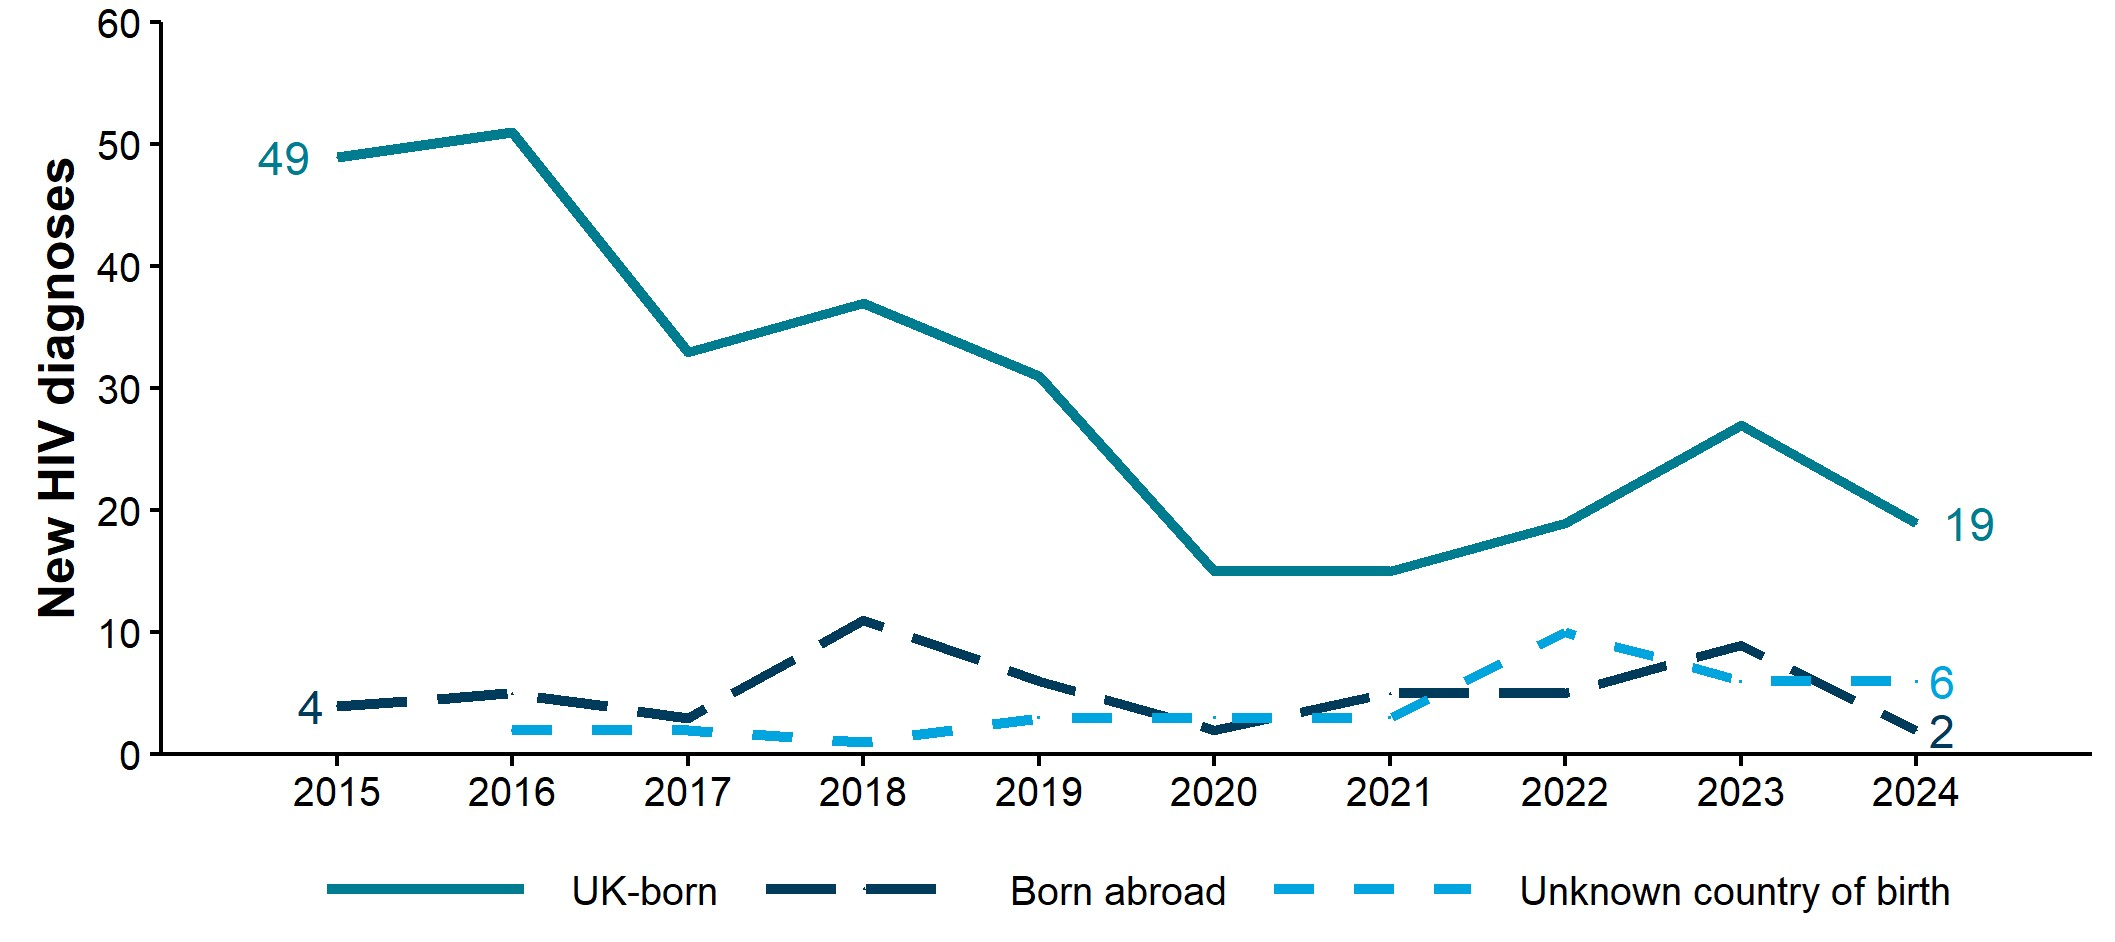
Figure 14. New HIV diagnoses in gay and bisexual men by whether born abroad, North East residents, 2015 to 2024 [note 1]
Sources: UKHSA, HANDD.
The number of new diagnoses will depend on accessibility of testing as well as infection and transmission. Those with a prior diagnosis abroad are excluded.
Note 1: numbers may rise as further reports are received and more information is obtained. This is more likely to affect more recent years, particularly 2024.
Figure 14 is a line chart showing the trend in new HIV diagnoses in gay and bisexual men by whether born abroad over the past 10 years in North East residents.
The chart line shows that in 2024, of those with a known country of birth, 90% (19/21) of new diagnoses in gay and bisexual men were in UK-born residents, and 10% (2/21) were in individuals born abroad. There were 6 new diagnoses in residents with an unknown country of birth.
A decade ago the proportions were also similar in the North East, with 92% (42/53) of new diagnoses in gay and bisexual men being in UK-born residents, and 8% (4/53) being in residents born abroad.
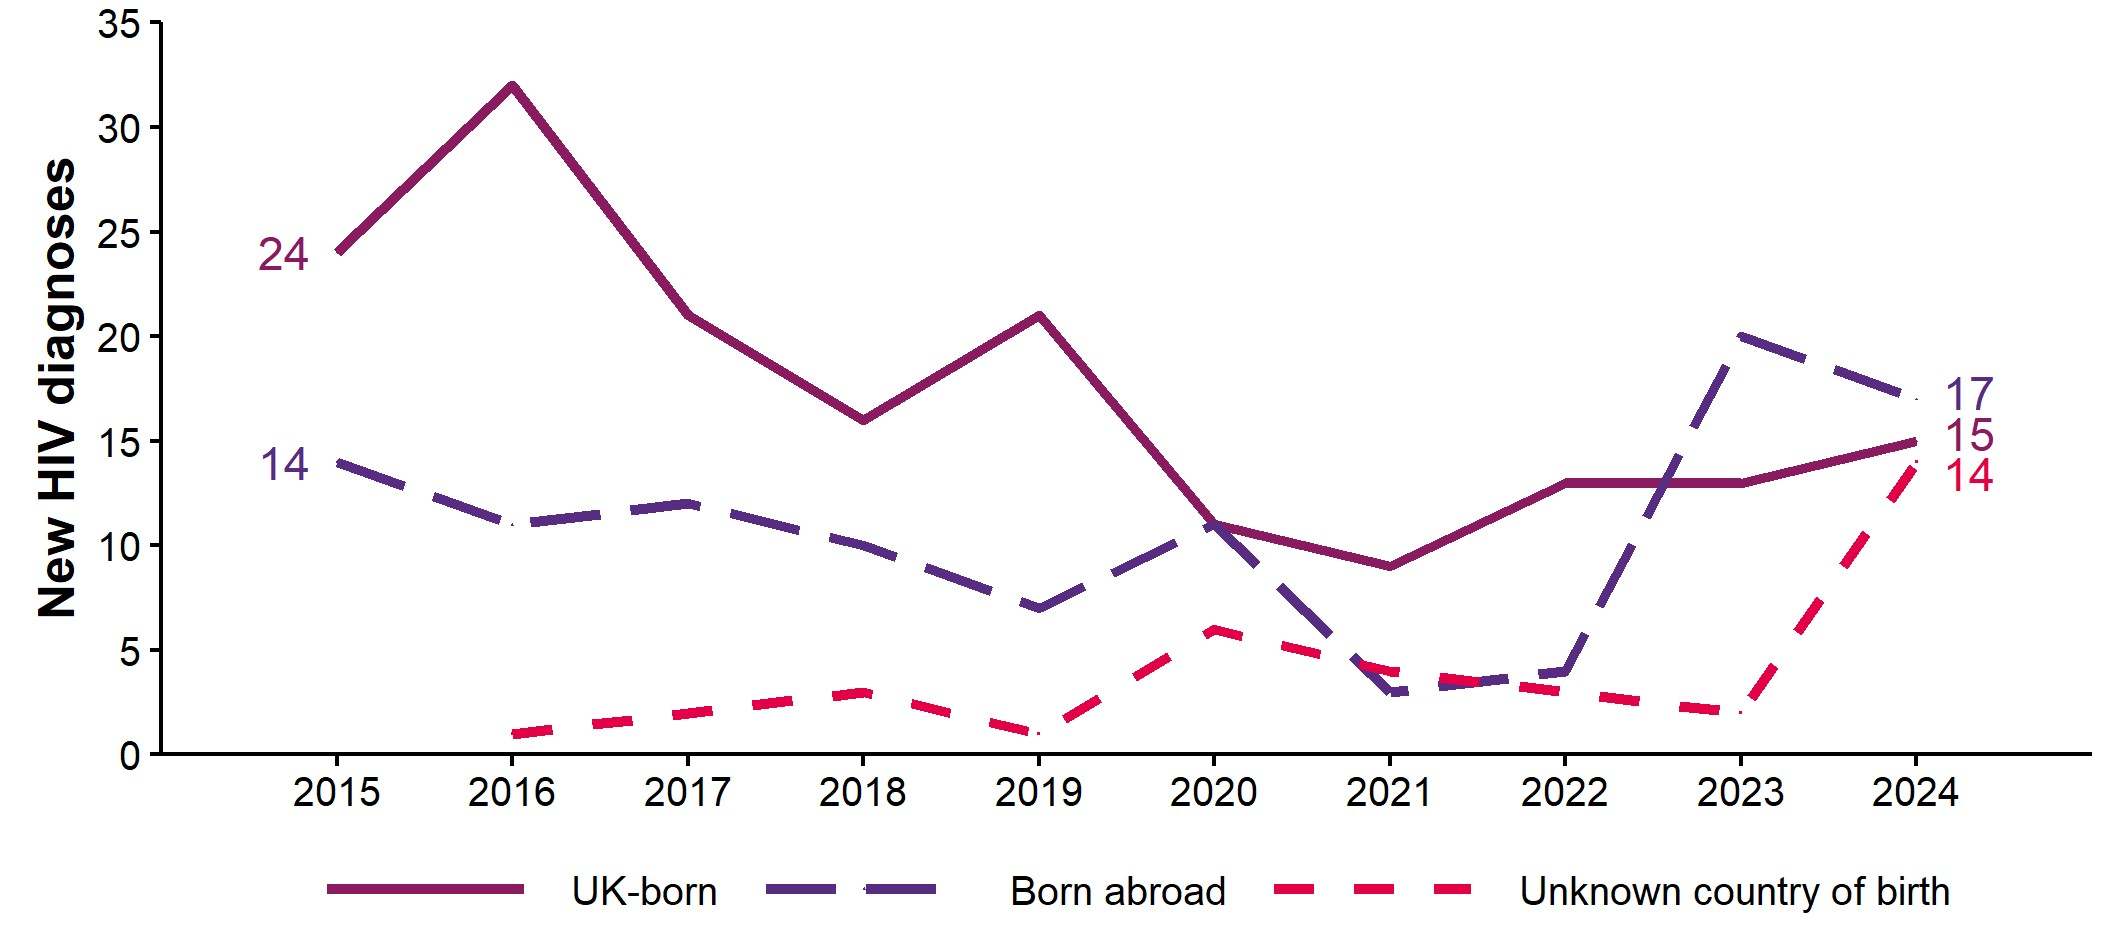
Figure 15. New HIV diagnoses in heterosexuals by whether born abroad, North East residents, 2015 to 2024 [note 1]
Sources: UKHSA, HANDD.
The number of new diagnoses will depend on accessibility of testing as well as infection and transmission. Those with a prior diagnosis abroad are excluded.
Note 1: numbers may rise as further reports are received and more information is obtained. This is more likely to affect more recent years, particularly 2024.
Figure 15 is a line chart showing the trend in new HIV diagnoses in heterosexuals by whether born abroad over the past 10 years in North East residents.
The chart line shows, of those with a known country of birth, the proportion of new diagnoses in heterosexual individuals that were UK-born was lower in 2024 compared to 2015 (47% in 2024 to 63% in 2015) while the proportion of individuals born abroad was higher (53% in 2024 to 37% in 2015).
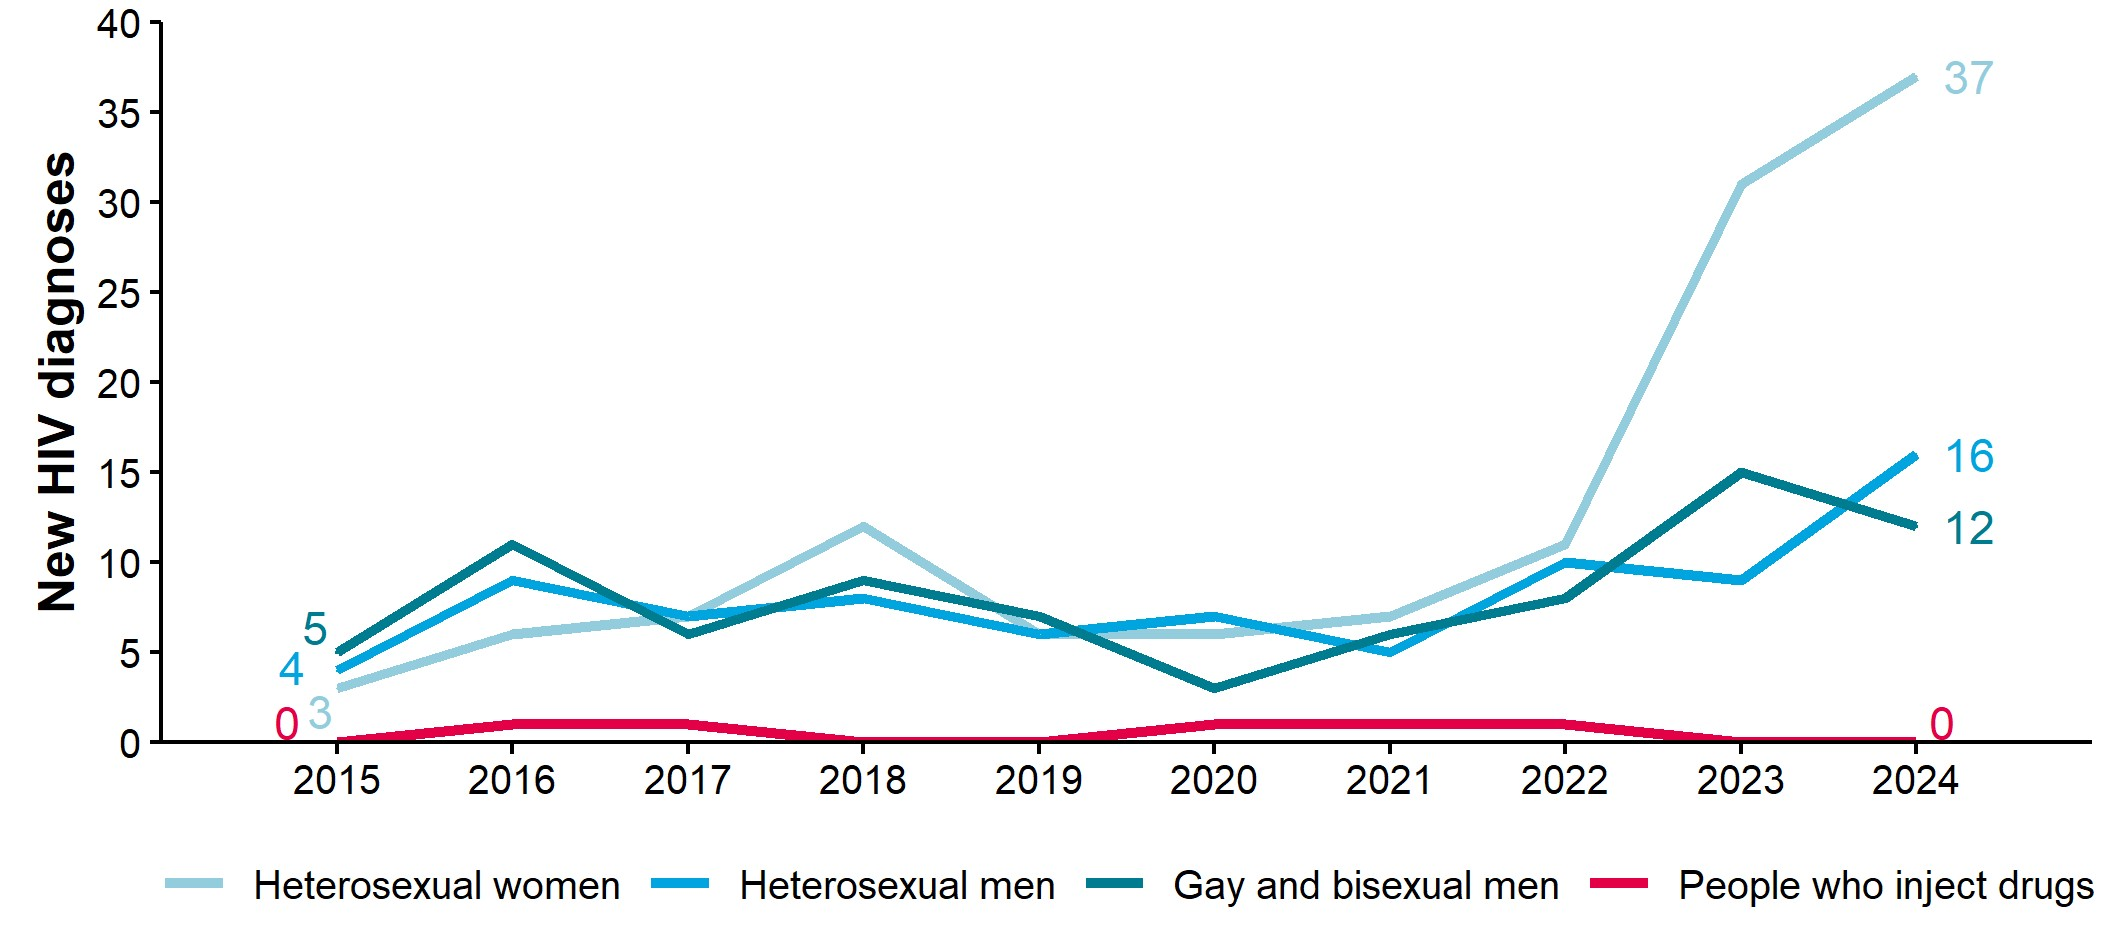
Figure 16. People diagnosed with HIV before continuing care in England by probable route of exposure, North East residents, 2015 to 2024 [note 1]
Sources: UKHSA, HANDD.
The number of new diagnoses will depend on accessibility of testing as well as infection and transmission.
Note 1: numbers may rise as further reports are received and more information is obtained. This is more likely to affect more recent years, particularly 2024.
Figure 16 is a line chart showing the trend in new HIV diagnoses by probable route of acquiring HIV over the past 10 years, in people diagnosed with HIV before continuing care in England. Four probable routes of exposure are shown: heterosexual women, heterosexual men, gay and bisexual men and people who inject drugs.
The chart suggests that, prior to the COVID-19 pandemic, the number of new HIV diagnoses among heterosexual women, heterosexual men and gay and bisexual men was generally stable, despite some year-to-year fluctuation. However, all 3 groups experienced increases from 2021 onwards. The largest annual increase was observed among heterosexual women, with diagnoses rising from 11 in 2022 to 31 in 2023 (182% increase).
Between 2023 and 2024, new HIV diagnoses among gay and bisexual men decreased 20%, from 15 to 12 diagnoses. In contrast, diagnoses increased among both heterosexual men (78% rise) and heterosexual women (19% rise).
In 2024, heterosexual women accounted for the majority of new HIV diagnoses among individuals diagnosed before continuing care in England (57%), followed by heterosexual men (25%) and gay and bisexual men (18%).
The number of new HIV diagnoses in people who inject drugs has remained low over this time period.
Late diagnoses
The following set of charts relate to new HIV diagnoses that were estimated to have been made ‘late’ in relation to the time of acquisition. The categorization of a HIV diagnosis as ‘late’ is based on CD4 count at diagnosis as this count tends to decline over time in people living with undiagnosed HIV. To improve the robustness of estimates, most charts below combine 3 years of data. This approach is required because the denominator is restricted to new HIV diagnoses meeting the specific inclusion criteria outlined in each chart’s footnote. Despite this aggregation, some analyses, particularly at local authority level, remain based on small numbers and should be interpreted with caution.
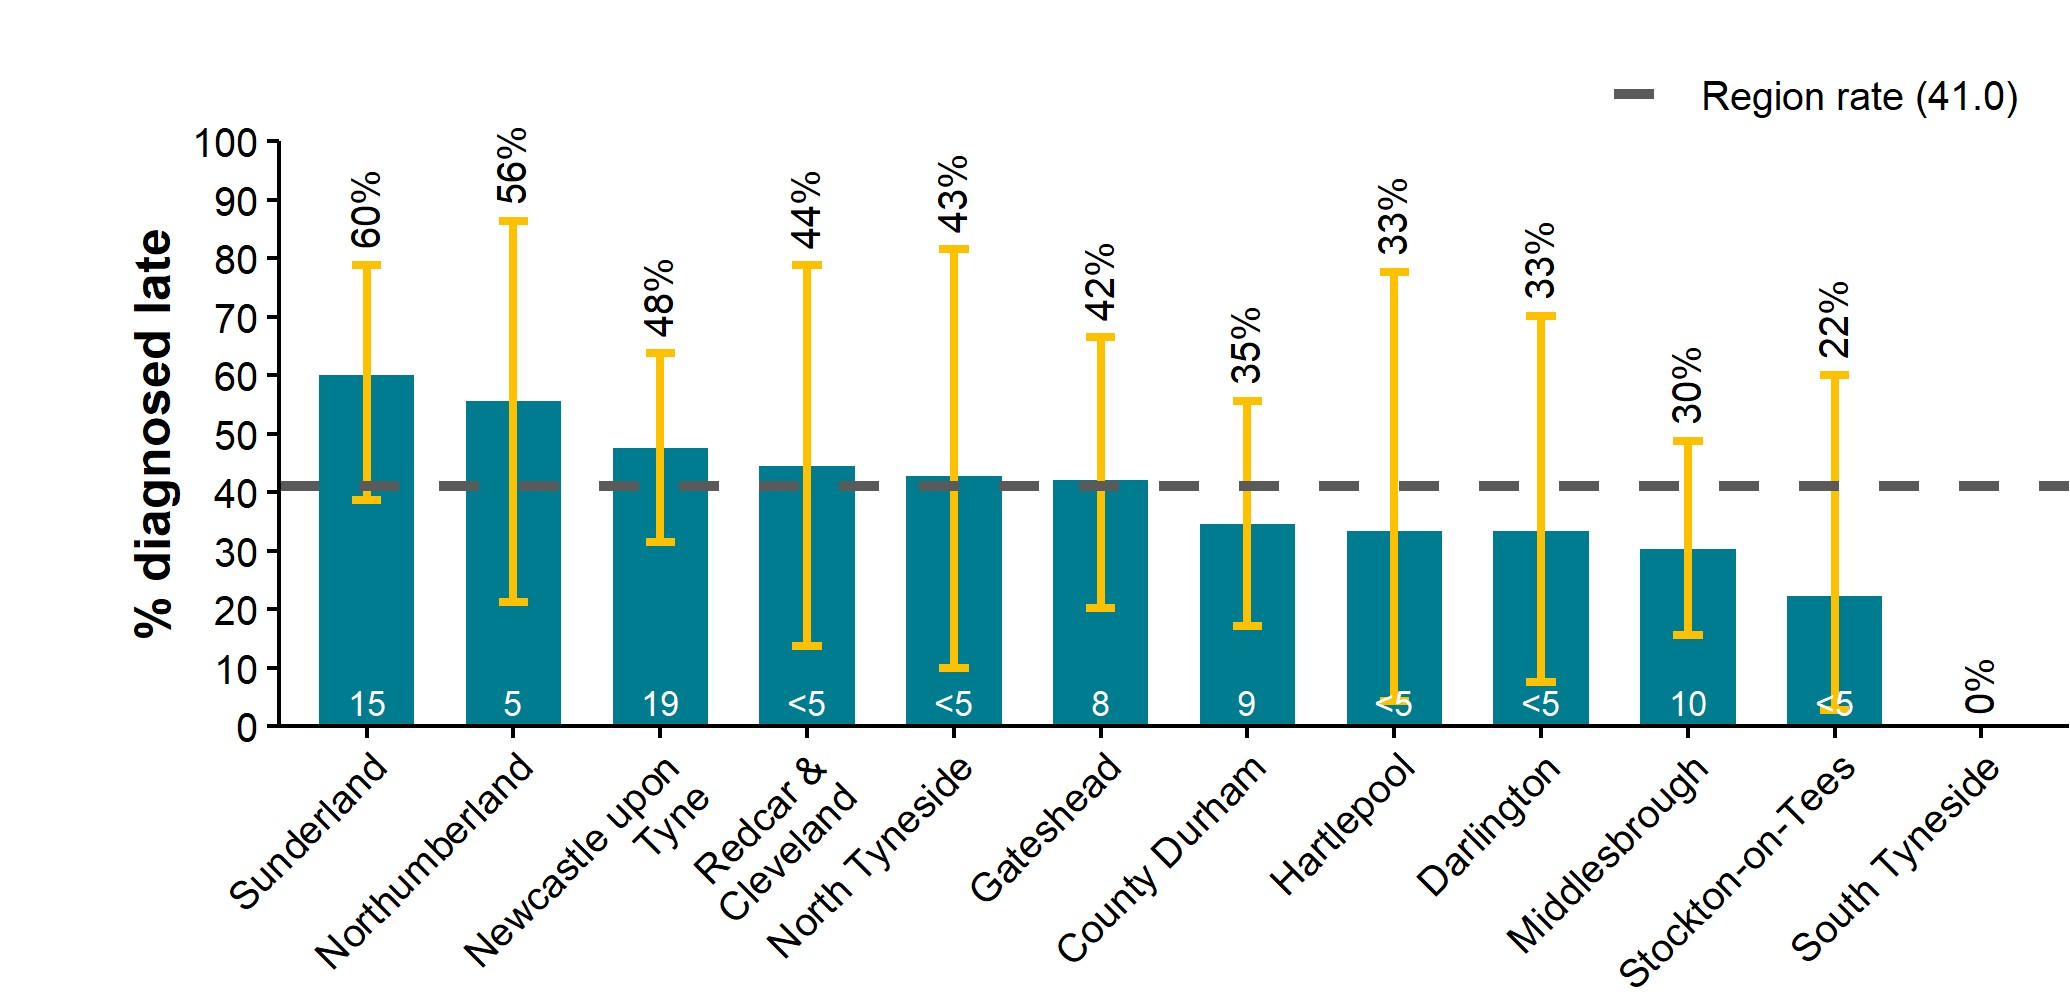
Figure 17. Percentage of new HIV diagnoses, by local authority of residence, that were diagnosed late, North East, aged 15 years and over, 2022 to 2024 [note 2]
Sources: UKHSA, HIV and AIDS New Diagnoses and Deaths (HANDD), HIV and AIDS Reporting System (HARS).
The number contained within each bar indicates the number of cases.
Note 2: only includes new diagnoses in those aged 15 years or older with no prior diagnosis abroad and for which a CD4 count was reported within 91 days of diagnosis; late diagnosis defined as CD4 count less than 350 cells/mm3. The underlying population will impact on the proportion diagnosed late, for example, gay and bisexual men are less likely to be diagnosed late.
Figure 17 is a column chart showing rates of new HIV diagnoses that were diagnosed late in individuals aged 15 years and by North East local authority for the 3-year period of 2022 to 2024. Local authorities are shown in descending order in relation to their percentage of late diagnoses. The overall North East percentage of late diagnoses (41.0%) is represented as a dashed horizontal line.
Across the local authorities, the proportion of late diagnoses varied from 0% in South Tyneside to 60% in Sunderland. As described below, the proportion of late diagnoses varies by risk groups. Hence, the underlying population demographics within each local authority will impact upon the overall proportion diagnosed late.
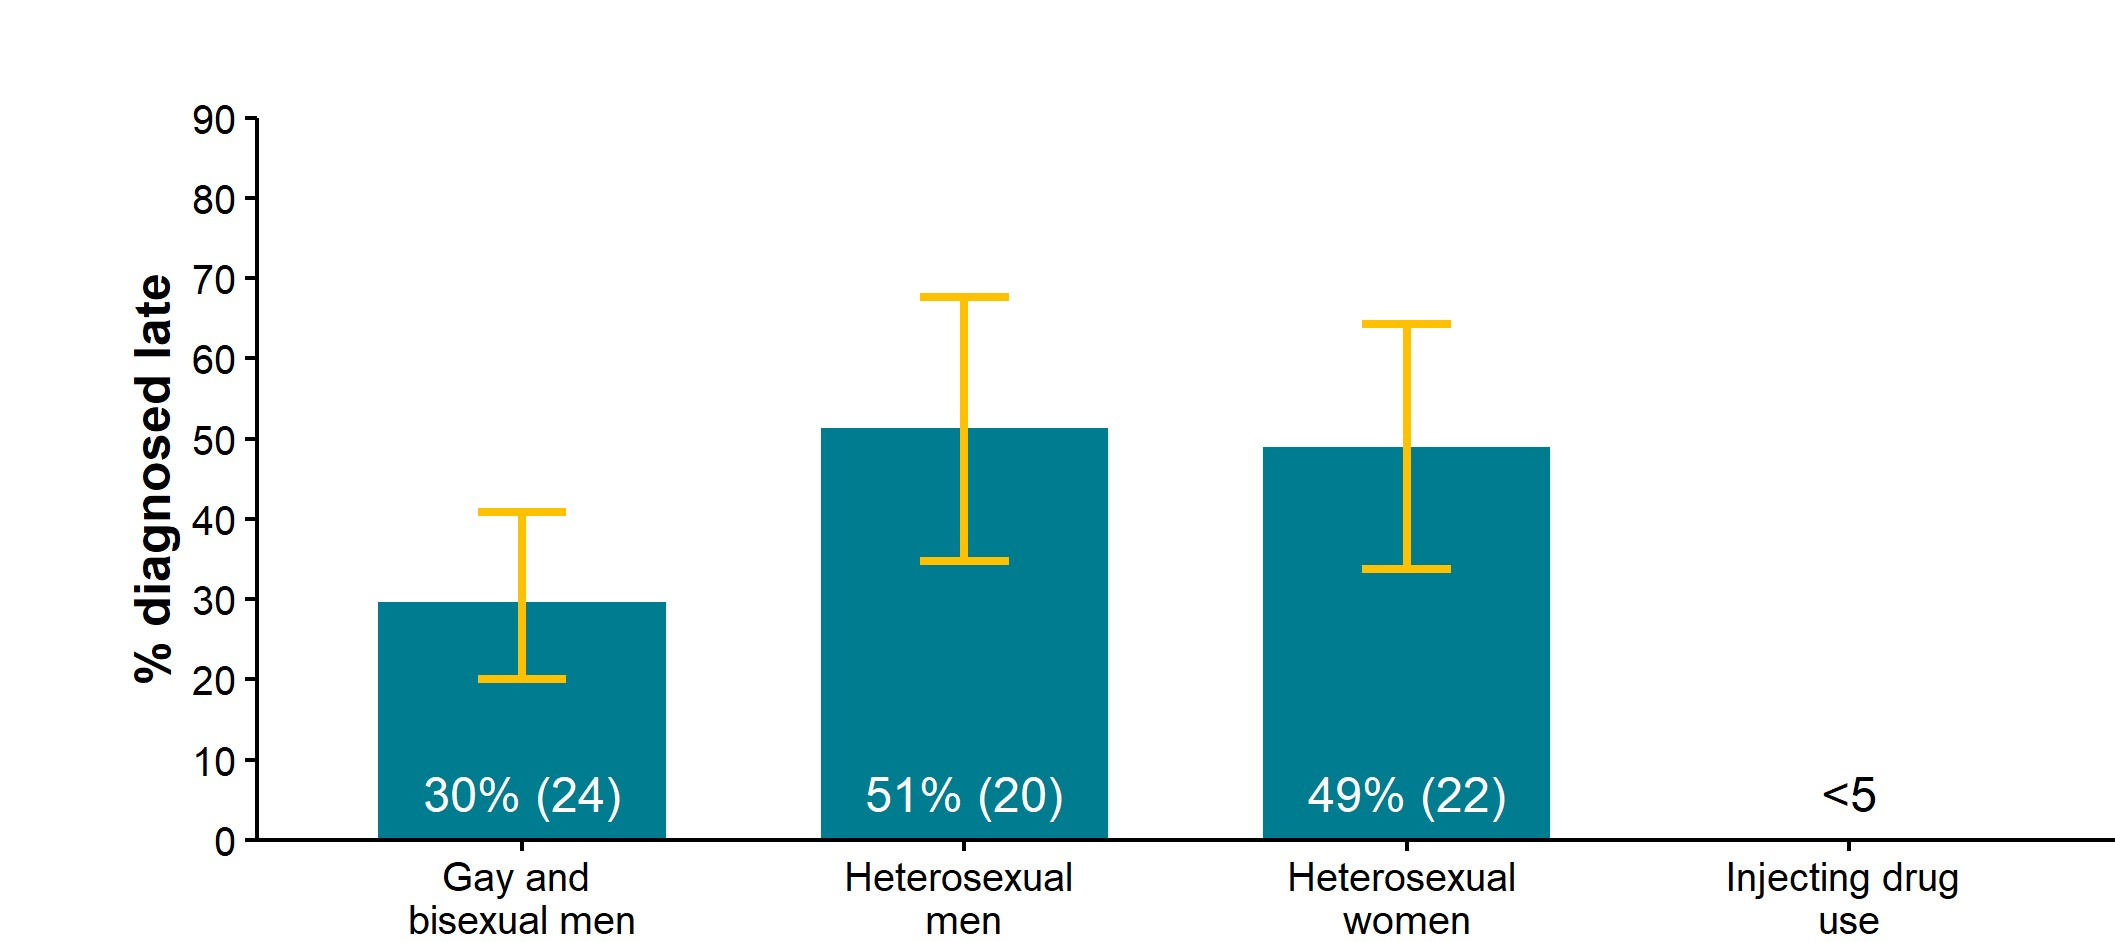
Figure 18. Percentage and number of new HIV diagnoses by probable route of exposure that were diagnosed late, North East residents, aged 15 years and over, 2022 to 2024 [note 3]
Sources: UKHSA, HIV and AIDS New Diagnoses and Deaths (HANDD), HIV and AIDS Reporting System (HARS).
The numbers contained within each bar indicates percentage with the number of cases diagnosed late in brackets.
Note 3: only includes new diagnoses in those aged 15 years or older with no prior diagnosis abroad and for which a CD4 count was reported within 91 days of diagnosis; late diagnosis defined as CD4 count less than 350 cells/mm3. Proportions are only shown for the gay and bisexual men, heterosexual men, heterosexual women, and injecting drug use exposure groups and are withheld for any of these categories if they contain fewer than 5 late diagnoses.
Figure 18 is a column chart displaying the percentage of new HIV diagnoses that were diagnosed late in individuals aged 15 years and over by probable route of infection in the North East from 2022 to 2024. Four major probable routes of infection are shown: sex among gay and bisexual men, sex among heterosexual men, sex among heterosexual women, and injecting drug use.
The chart shows that the proportion of late HIV diagnoses differed by probable route of exposure, ranging from 30% for diagnoses attributed to sex among gay and bisexual men to 51% for diagnoses attributed to heterosexual sex among men, the highest of all exposure groups.
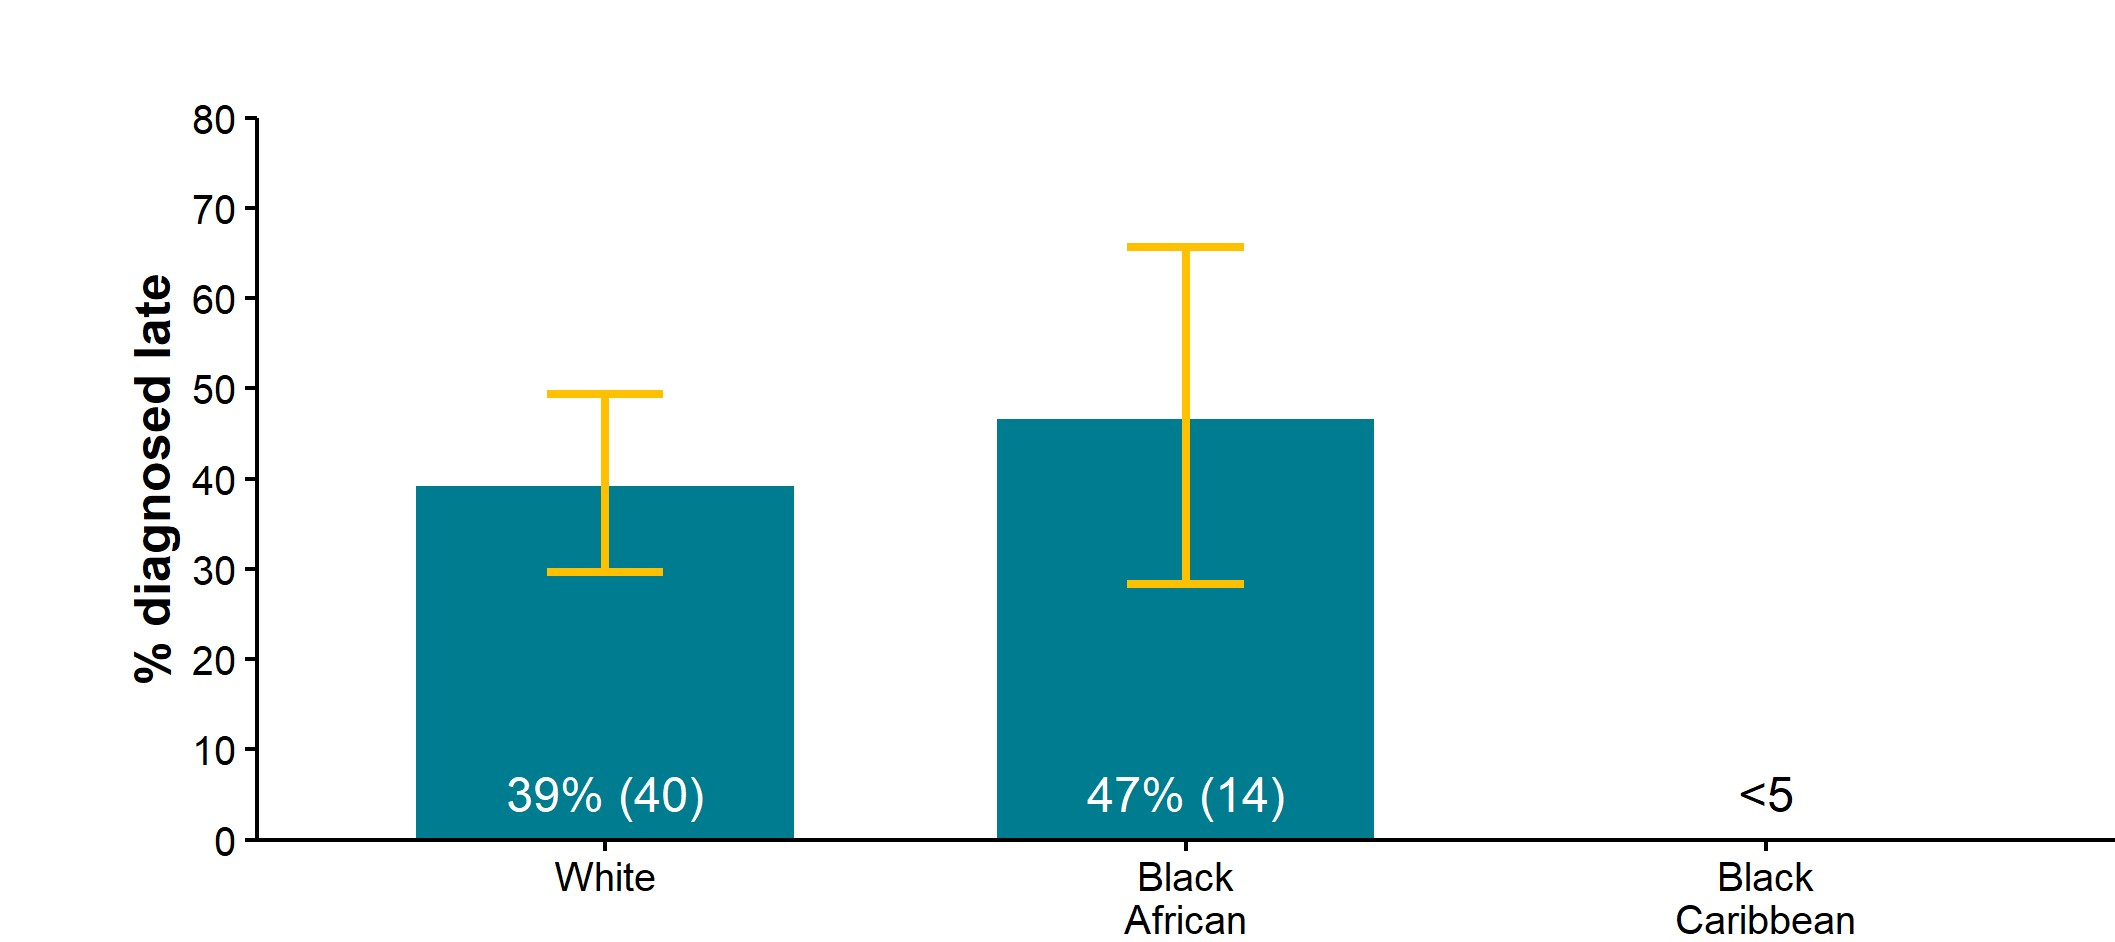
Figure 19. Percentage and number of new HIV diagnoses by ethnic group that were diagnosed late, North East residents, aged 15 years and over, 2022 to 2024 [note 4]
Sources: UKHSA, HIV and AIDS New Diagnoses and Deaths (HANDD), HIV and AIDS Reporting System (HARS).
Note 4: only includes new diagnoses in those aged 15 years or older with no prior diagnosis abroad and for which a CD4 count was reported within 91 days of diagnosis; late diagnosis defined as CD4 count less than 350 cells/mm3. Proportions are only shown for the White, Black African and Black Caribbean ethnic groups and are withheld for any of these ethnic group categories if they contain fewer than 5 late diagnoses. IPB means Indian/Pakistani/Bangladeshi.
Figure 19 is a column chart displaying the percentage of new HIV diagnoses that were diagnosed late in individuals aged 15 years and over by ethnic group in the North East from 2022 to 2024. Three categories of ethnic group are displayed: White, Black African and Black Caribbean.
The chart shows that the percentage of late diagnoses varied by ethnic group, with the percentage being higher in the Black African ethnic group (47%) than the White ethnic group (39%).
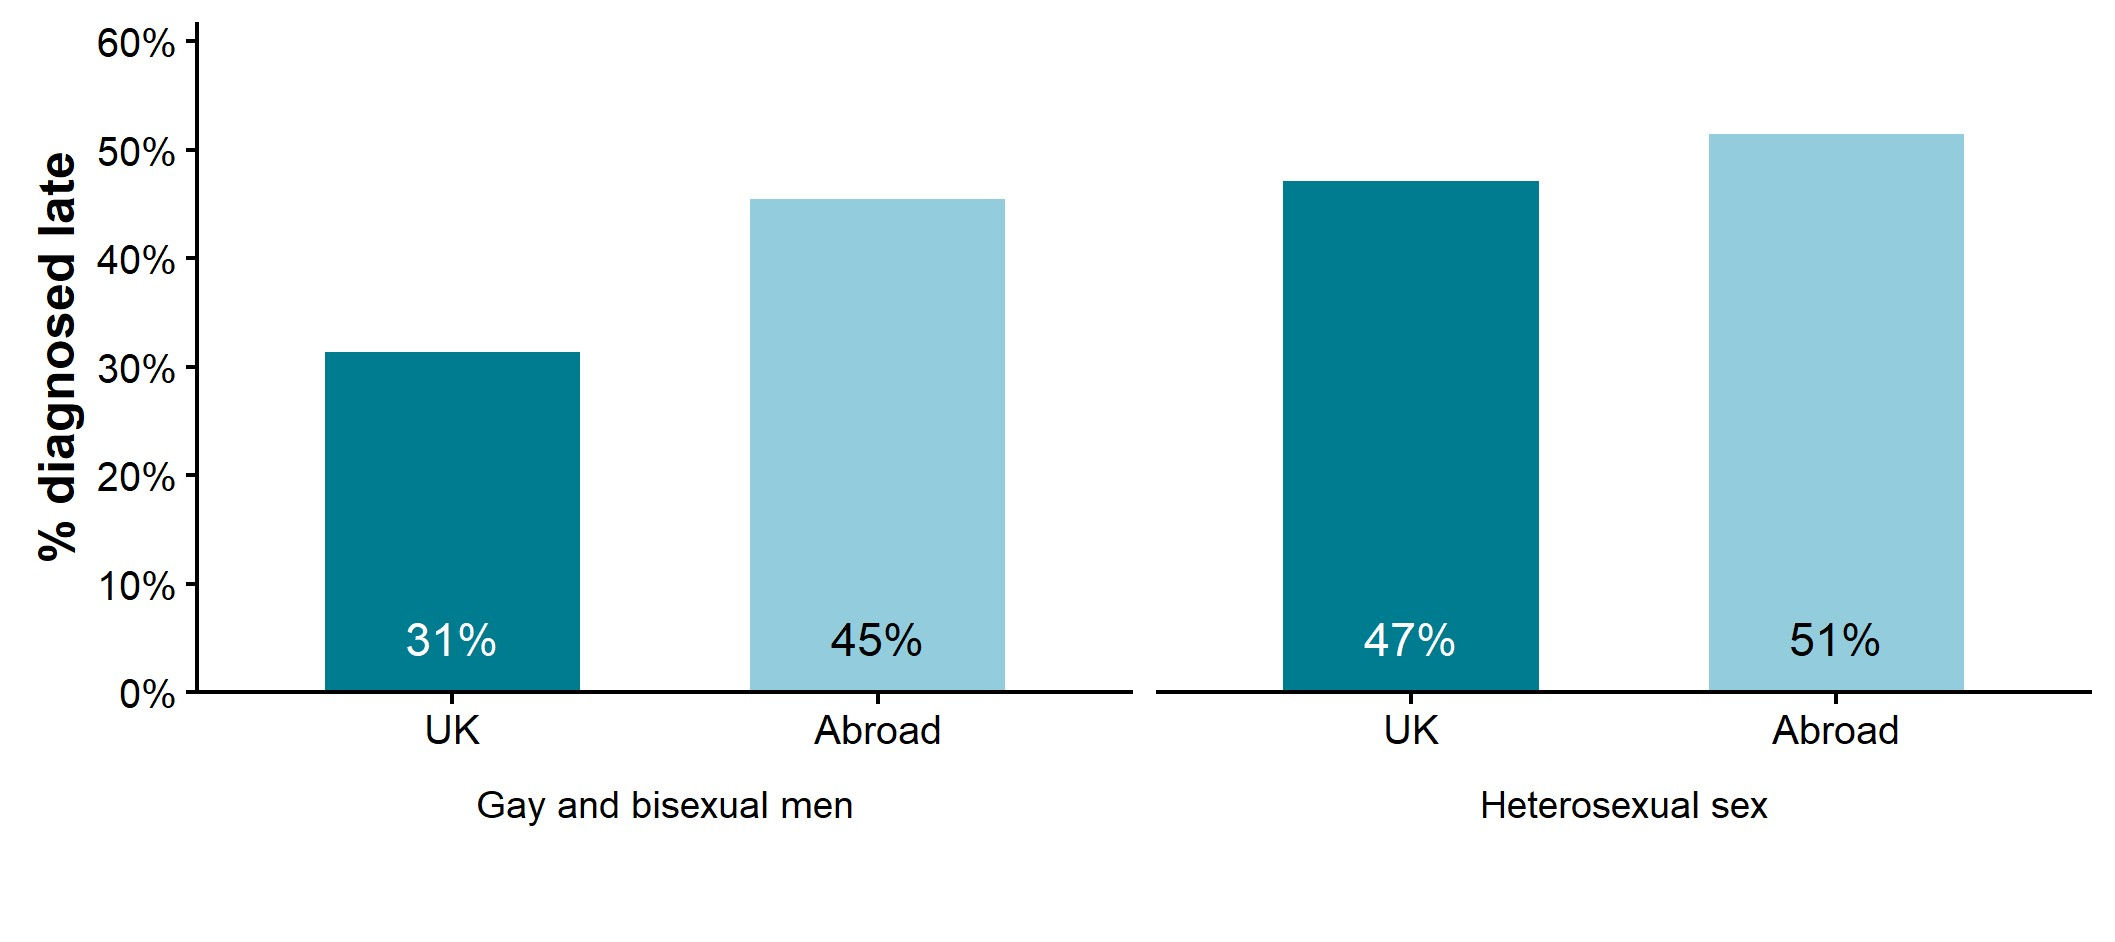
Figure 20. Percentage of new HIV diagnoses that were diagnosed late in gay and bisexual men and heterosexuals by whether born abroad, North East residents, aged 15 years and over, 2022 to 2024 [note 5]
Sources: UKHSA, HIV and AIDS New Diagnoses and Deaths (HANDD), HIV and AIDS Reporting System (HARS).
Note 5: only includes new diagnoses in those aged 15 years or older with no prior diagnosis abroad and for which a CD4 count was reported within 91 days of diagnosis; late diagnosis defined as CD4 count less than 350 cells/mm3.
Figure 20 is a column chart showing the percentage of late diagnoses among North East residents aged 15 years and over by whether born abroad and probable route of exposure during 2022 to 2024. Two exposure groups are included: sex among gay and bisexual men and sex among heterosexuals.
The chart shows that among diagnoses attributed to sex between gay and bisexual men, the lowest proportion of late diagnoses was observed in individuals born in the UK (31%). For diagnoses attributed to heterosexual sex, the proportion of late diagnoses was similar among those born in the UK (47%) and those born abroad (51%).
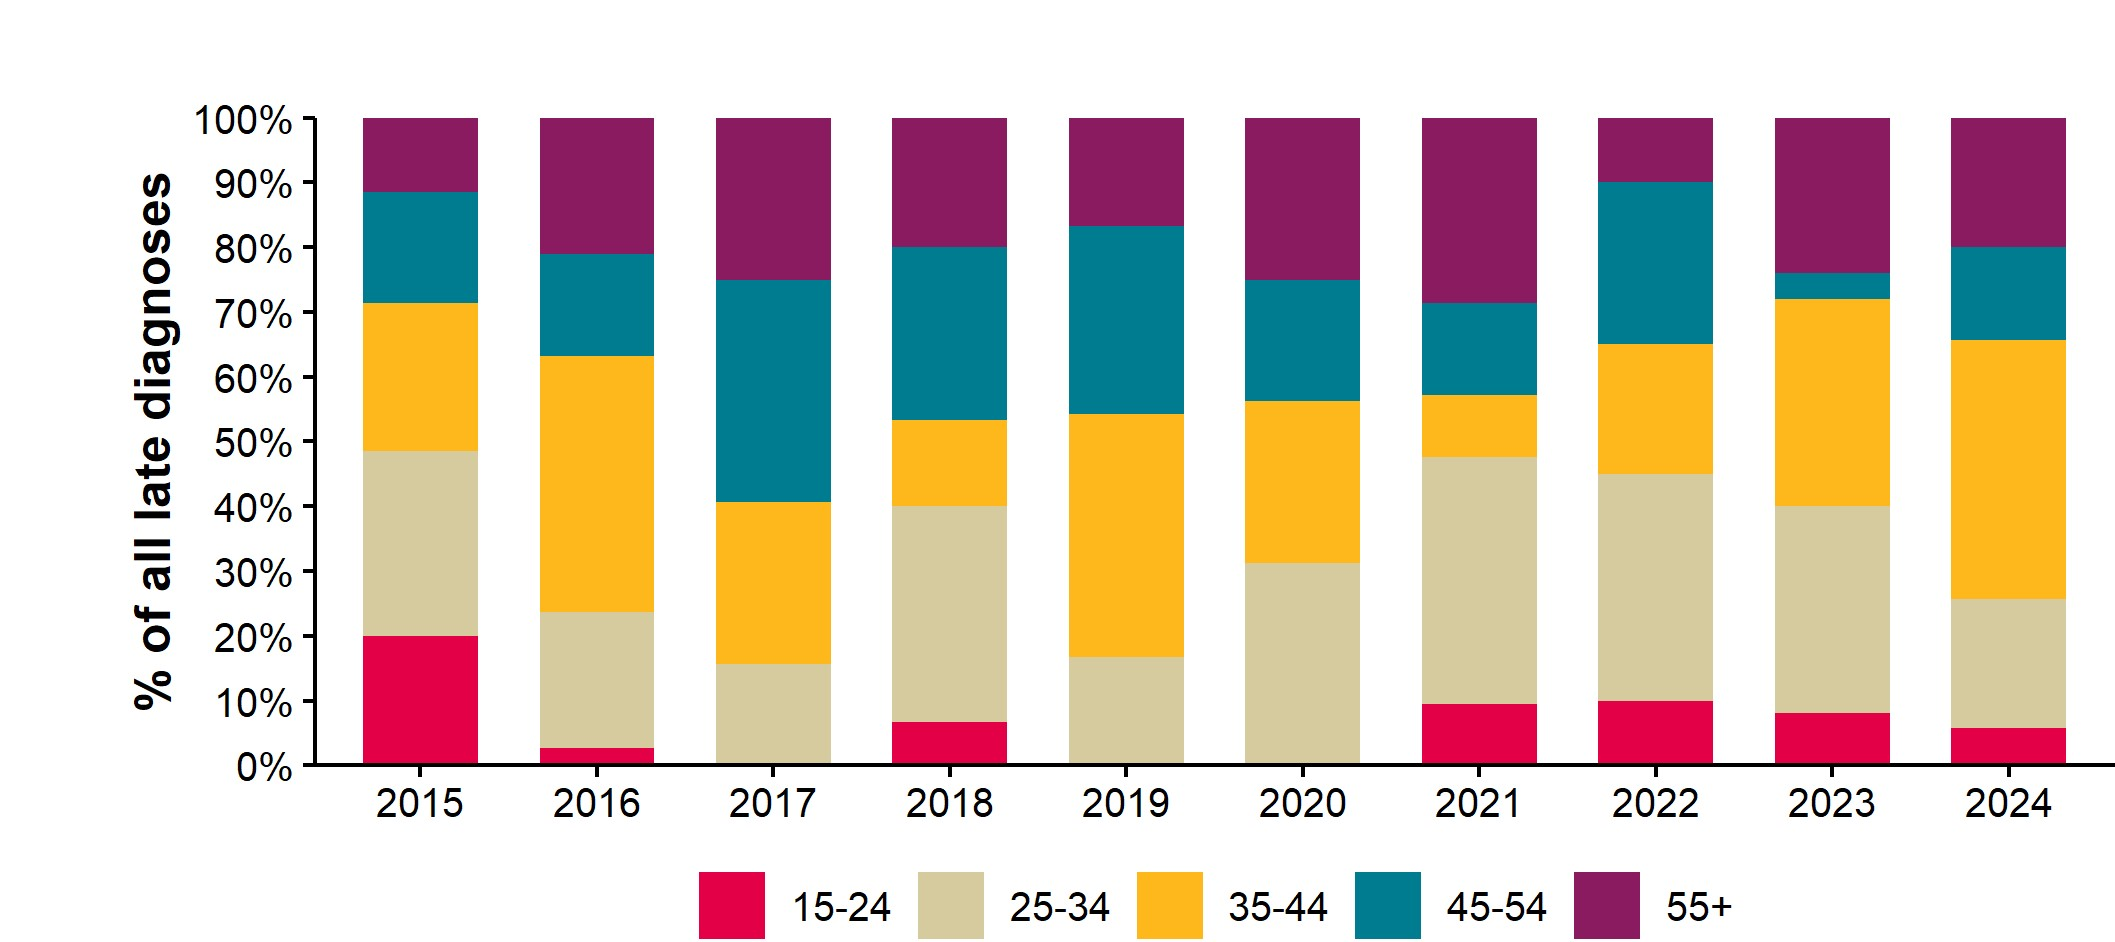
Figure 21. Age group distribution of new HIV diagnoses that were diagnosed late, North East residents, aged 15 years and over, 2015 to 2024 [note 5]
Sources: UKHSA, HIV and AIDS New Diagnoses and Deaths (HANDD), HIV and AIDS Reporting System (HARS).
Note 5: only includes new diagnoses in those aged 15 years or older with no prior diagnosis abroad and for which a CD4 count was reported within 91 days of diagnosis; late diagnosis defined as CD4 count less than 350 cells/mm3.
Figure 21 is a type of column chart in which the percentages within each column are stacked. Each column represents a year between 2015 and 2024. The colours within the columns represent the percentage of new HIV diagnoses that were diagnosed late in that year by age group. As such, each column adds up to 100% of cases. As with previous charts, this chart captures North East residents aged 15 years or older that were estimated to have been diagnosed late.
The chart shows that in 2024, 6% of those diagnosed late were aged 15 to 24 years, 20% were aged 25 to 34 years, 40% were aged 35 to 44 years, 14% were aged 45 to 54 years and 20% were aged 55 and older. These proportions have varied over the past 10 years.
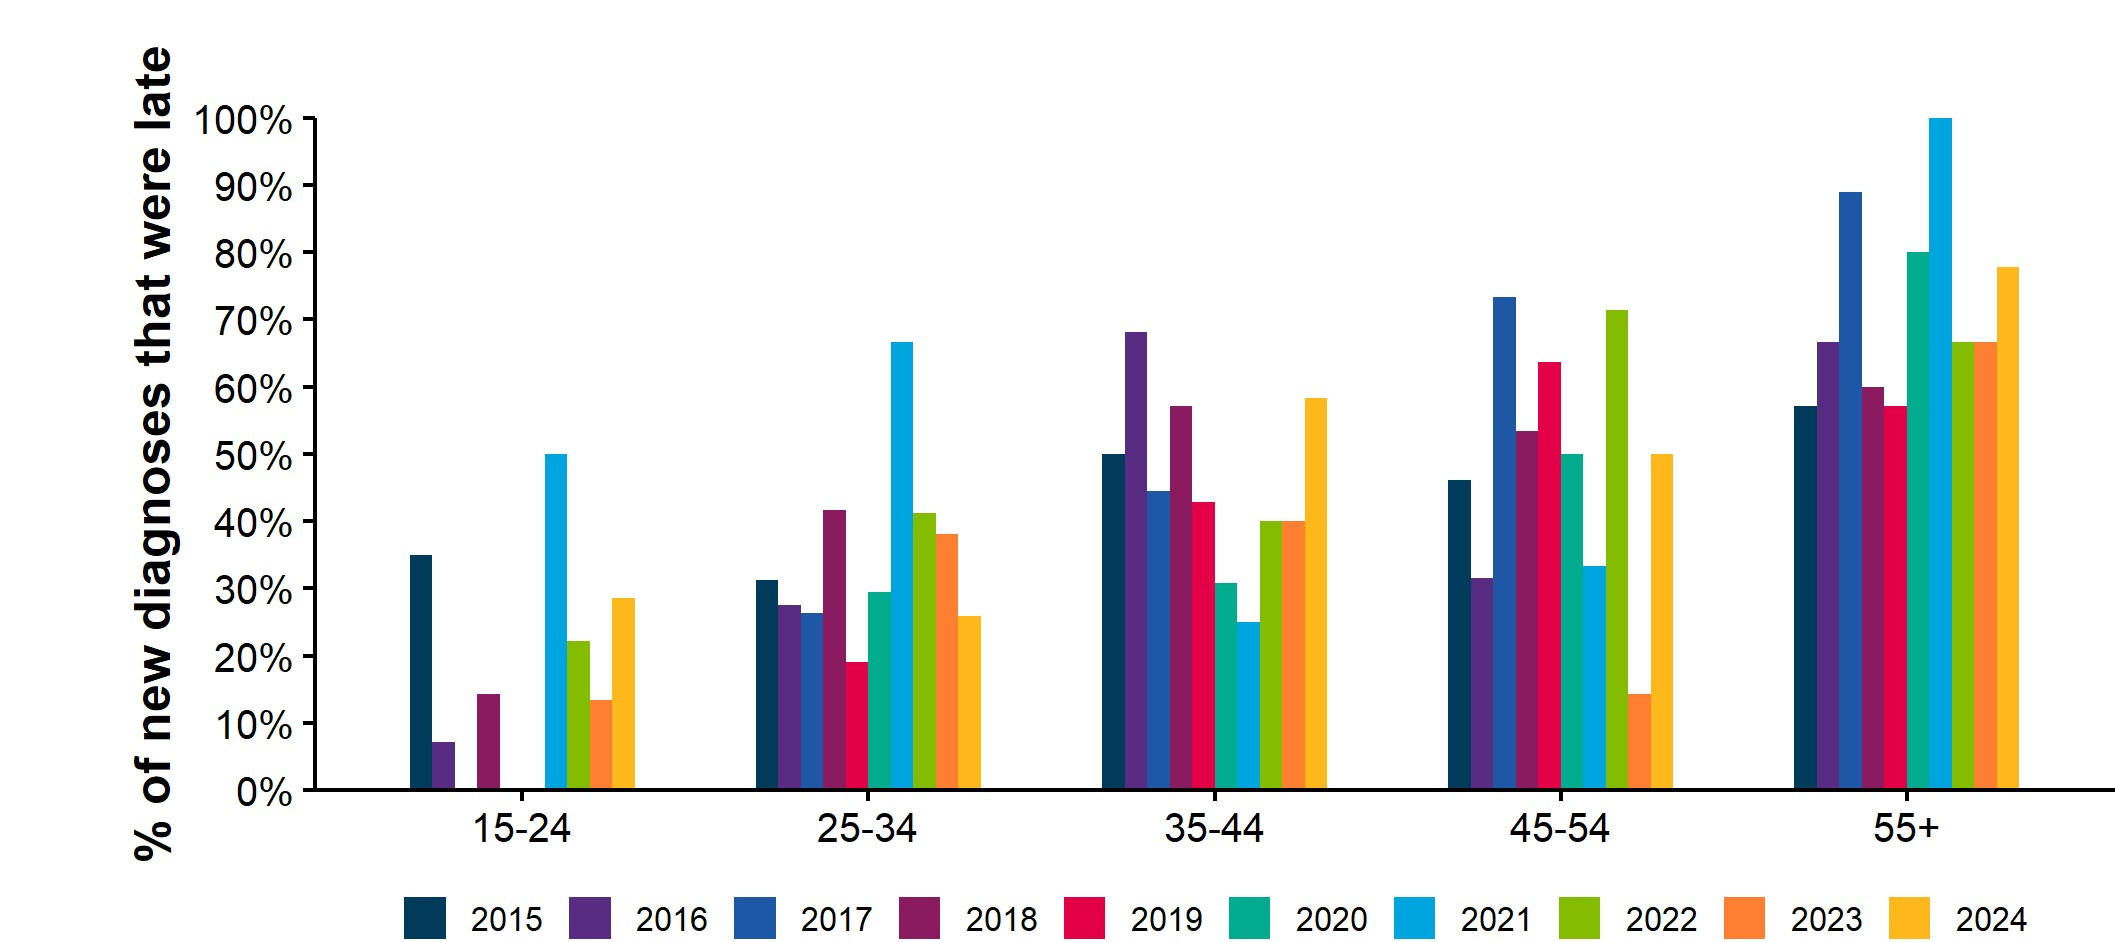
Figure 22. Percentage of new diagnoses that were late by age group, North East residents, aged 15 years and over, 2015 to 2024 [note 5]
Sources: UKHSA, HIV and AIDS New Diagnoses and Deaths (HANDD), HIV and AIDS Reporting System (HARS).
Note 5: only includes new diagnoses in those aged 15 years or older with no prior diagnosis abroad and for which a CD4 count was reported within 91 days of diagnosis; late diagnosis defined as CD4 count less than 350 cells/mm3.
Figure 22 is a column chart showing the percentage of late HIV diagnoses within each age group over the past 10 years, from 2015 to 2024. As with previous charts, this chart captures North East residents aged 15 years or older.
Percentages in this chart are less robust as numbers in individual years are small and should be interpreted as indicative of broad trends only.
The chart shows that for the younger age groups: 15 to 24 and 25 to 34 years old, the proportion of late HIV diagnoses in 2024 was lower than in 2015. In older age groups, the proportion of late diagnoses in 2024 was higher than in 2015.
The proportion of late HIV diagnoses in 2024 was higher than in 2023 for all age groups, except the 25 to 34 year old group, where it decreased.
People living with diagnosed HIV
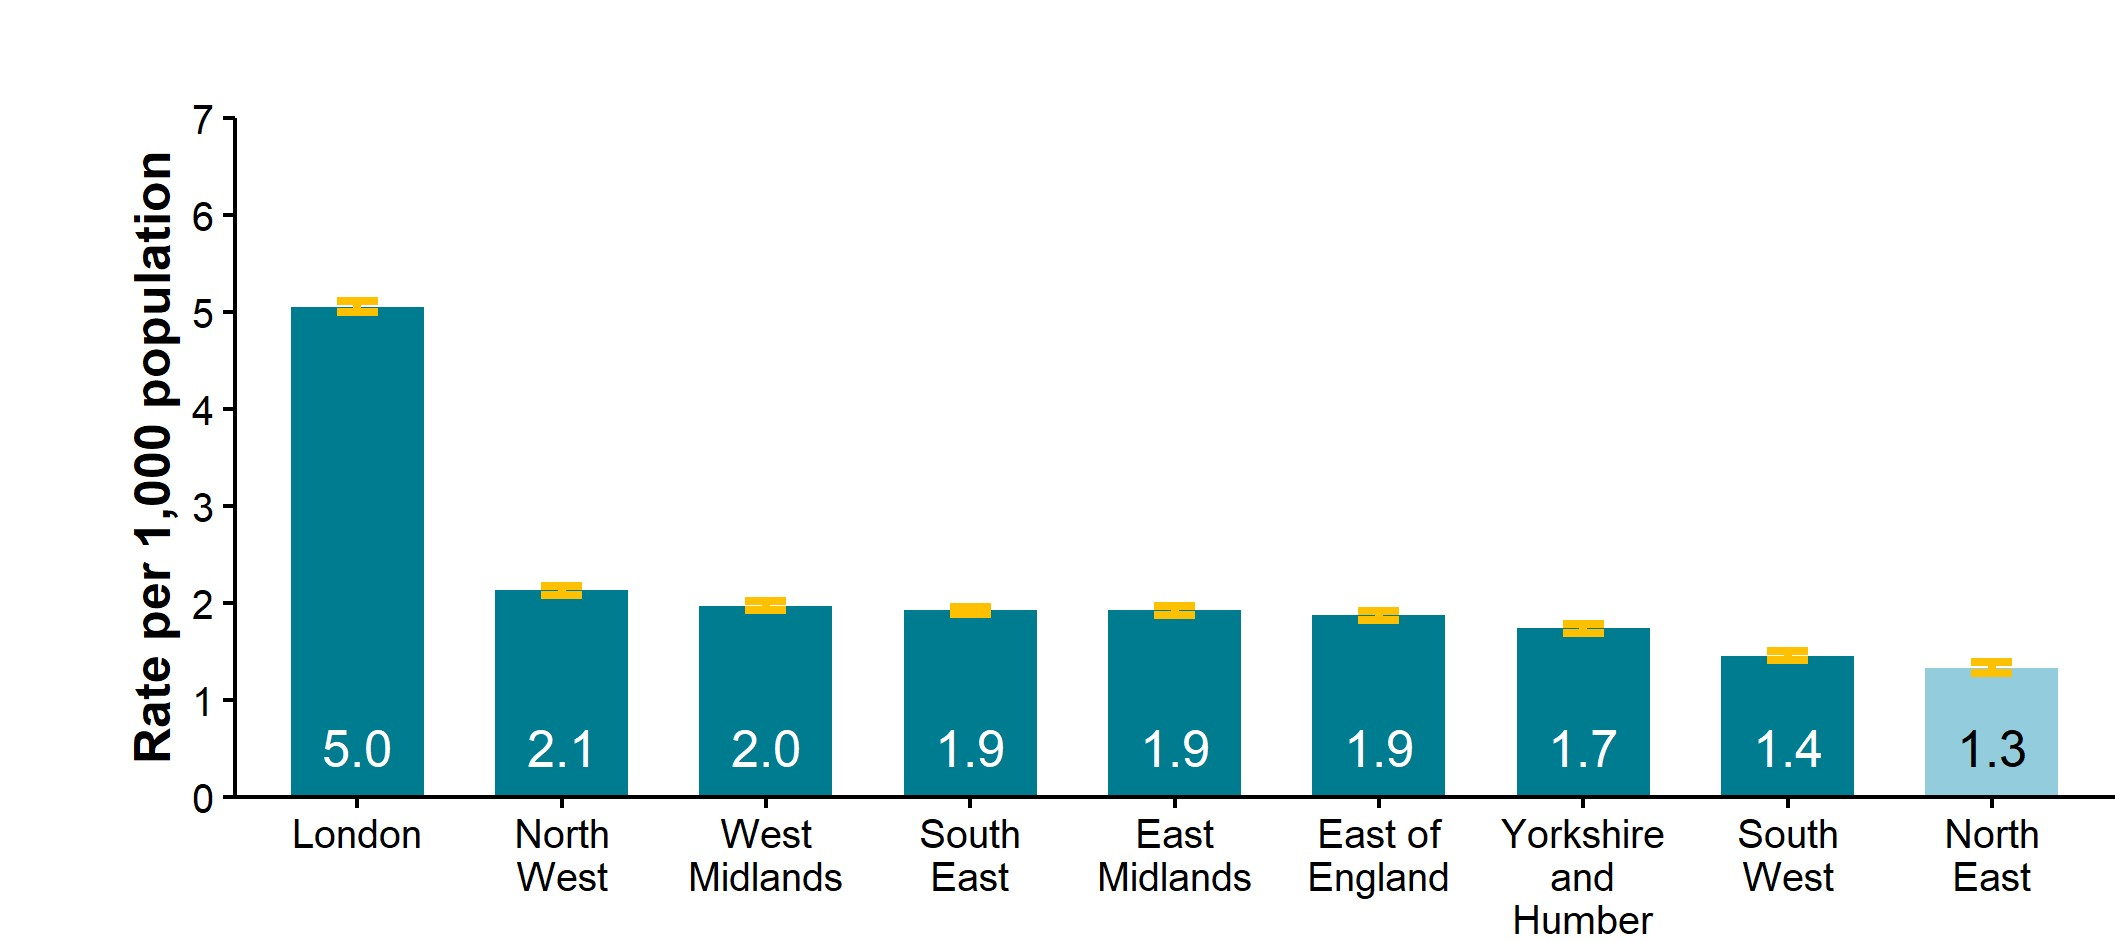
Figure 23. Diagnosed HIV prevalence per 1,000 residents aged 15 to 59 years by UKHSA region, 2024
Sources: UKHSA, HIV and AIDS Reporting System (HARS).
Figure 23 is a column chart displaying the prevalence of diagnosed HIV in 2024 by UKHSA region. Rates are by 1,000 population and are restricted to those aged 15 to 59 years as per NICE testing guidelines. UKHSA regions are shown in descending order in relation to prevalence of diagnosed HIV.
The chart shows that the rate of diagnosed HIV prevalence in the North East is the lowest of all regions in England at 1.3 per 1,000 population aged 15 to 59 years.
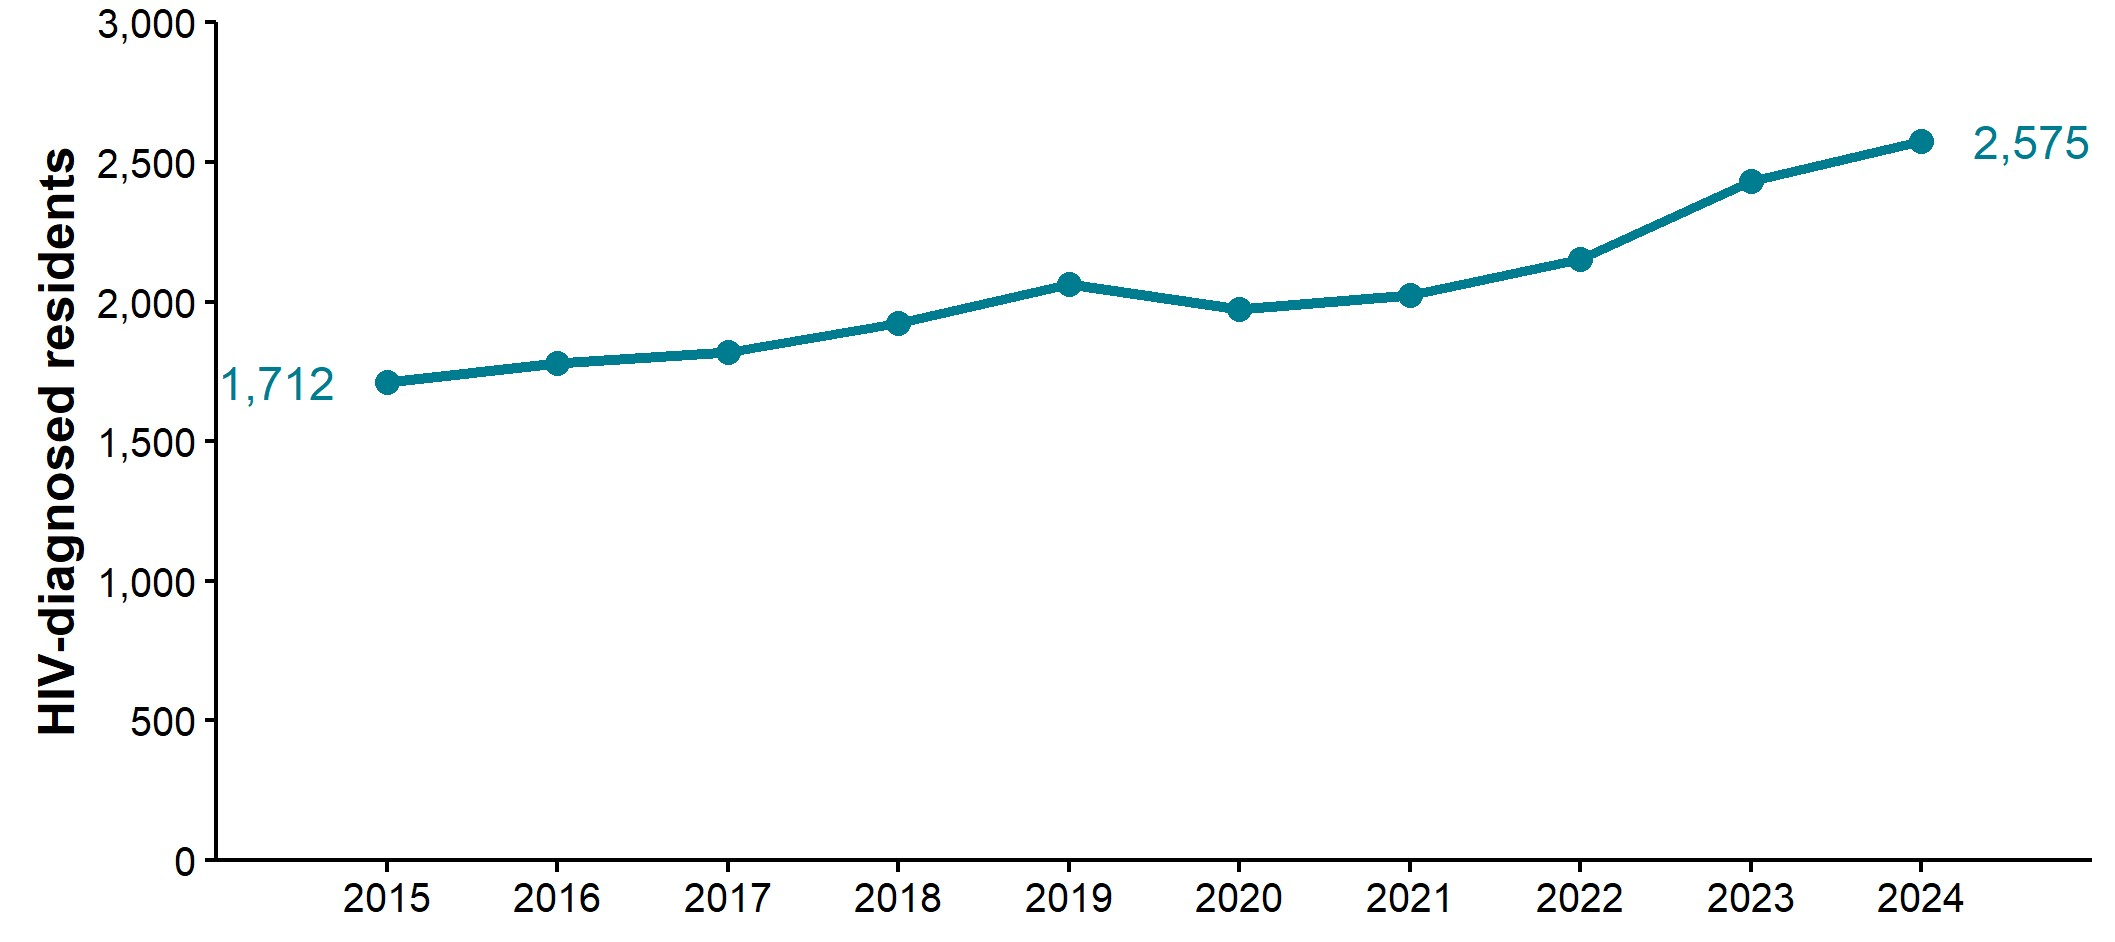
Figure 24. Number of residents living with diagnosed HIV (all ages) and accessing care, the North East, 2015 to 2024
Sources: UKHSA, HIV and AIDS Reporting System (HARS).
Figure 24 is a line chart showing the number of North East residents living with diagnosed HIV who accessed HIV related care over the past 10 years, from 2015 to 2024. This number acts as a proxy for the number of people living with diagnosed HIV in the region.
As can be seen in Figure 24, the number of North East residents living with diagnosed HIV in 2024 was 2,575, which is 50% higher than in 2015. Through the 10 years, there was an increasing trend in the number of North East residents living with diagnosed HIV. This reflects advances in testing as well as HIV treatments and care and, consequently, reductions in mortality associated with HIV. This all increases the recorded numbers of HIV-diagnosed residents.
Furthermore, disruptions to care, changes in residence and migration during the COVID-19 pandemic years can also be partly observed with a 4% decrease in number of HIV-diagnosed residents in the North East between 2019 and 2020. This may also reflect increased mortality during the pandemic.
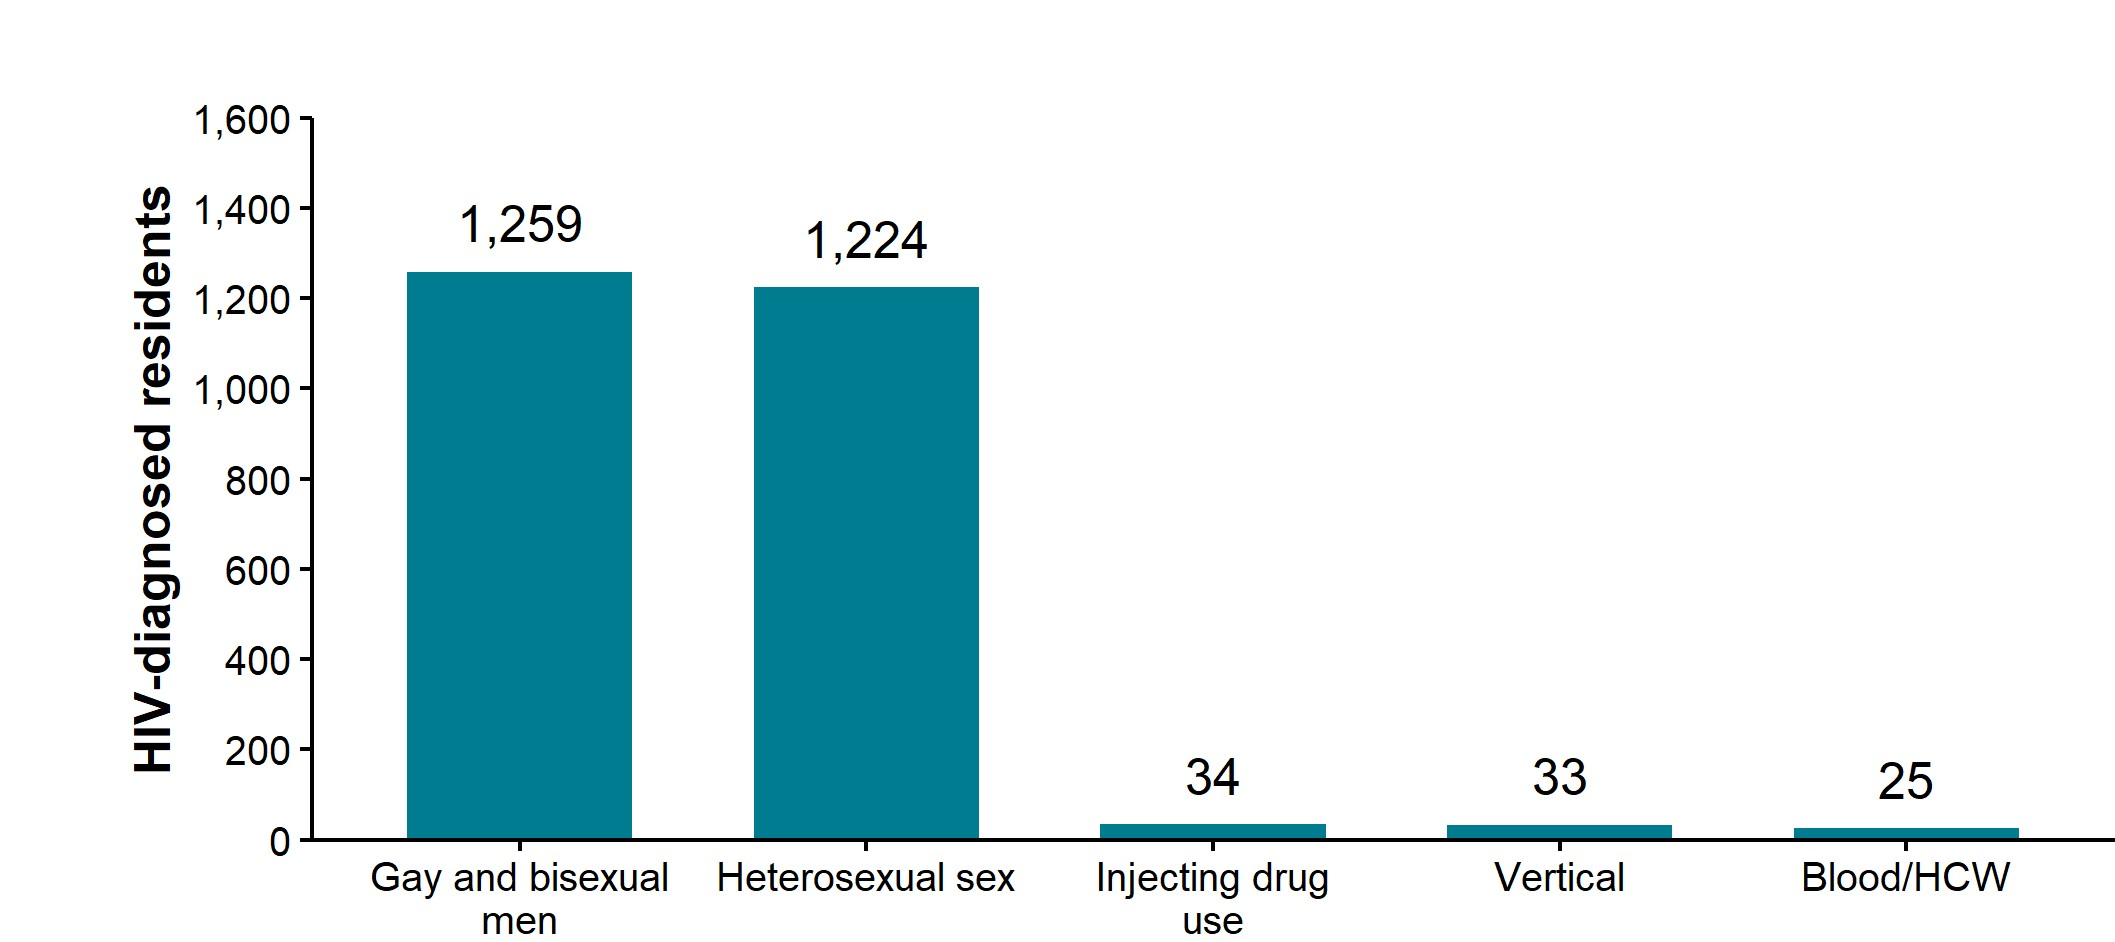
Figure 25. Number of residents living with diagnosed HIV and accessing care by probable route of exposure (adjusted for missing route information), the North East, 2024
Sources: UKHSA, HIV and AIDS Reporting System (HARS).
Figure 25 is a column chart displaying the number of North East residents living with diagnosed HIV and accessing care in 2024 broken down by probable route of exposure. Five categories of exposure are shown: sex among gay and bisexual men, heterosexual sex, injecting drug use, vertical (mother to child) transmission, and blood/healthcare worker.
As shown in Figure 25, of the 2,575 North East residents accessing HIV care in 2024, 96% were likely to have acquired HIV through sexual transmission. Nearly half (1,259; 49%) were estimated to have acquired HIV through sex between gay and bisexual men, while a similar proportion (1,224; 48%) were estimated to have acquired HIV through heterosexual sex.
The remaining 4% were likely to have acquired HIV through the other 3 transmission routes presented.
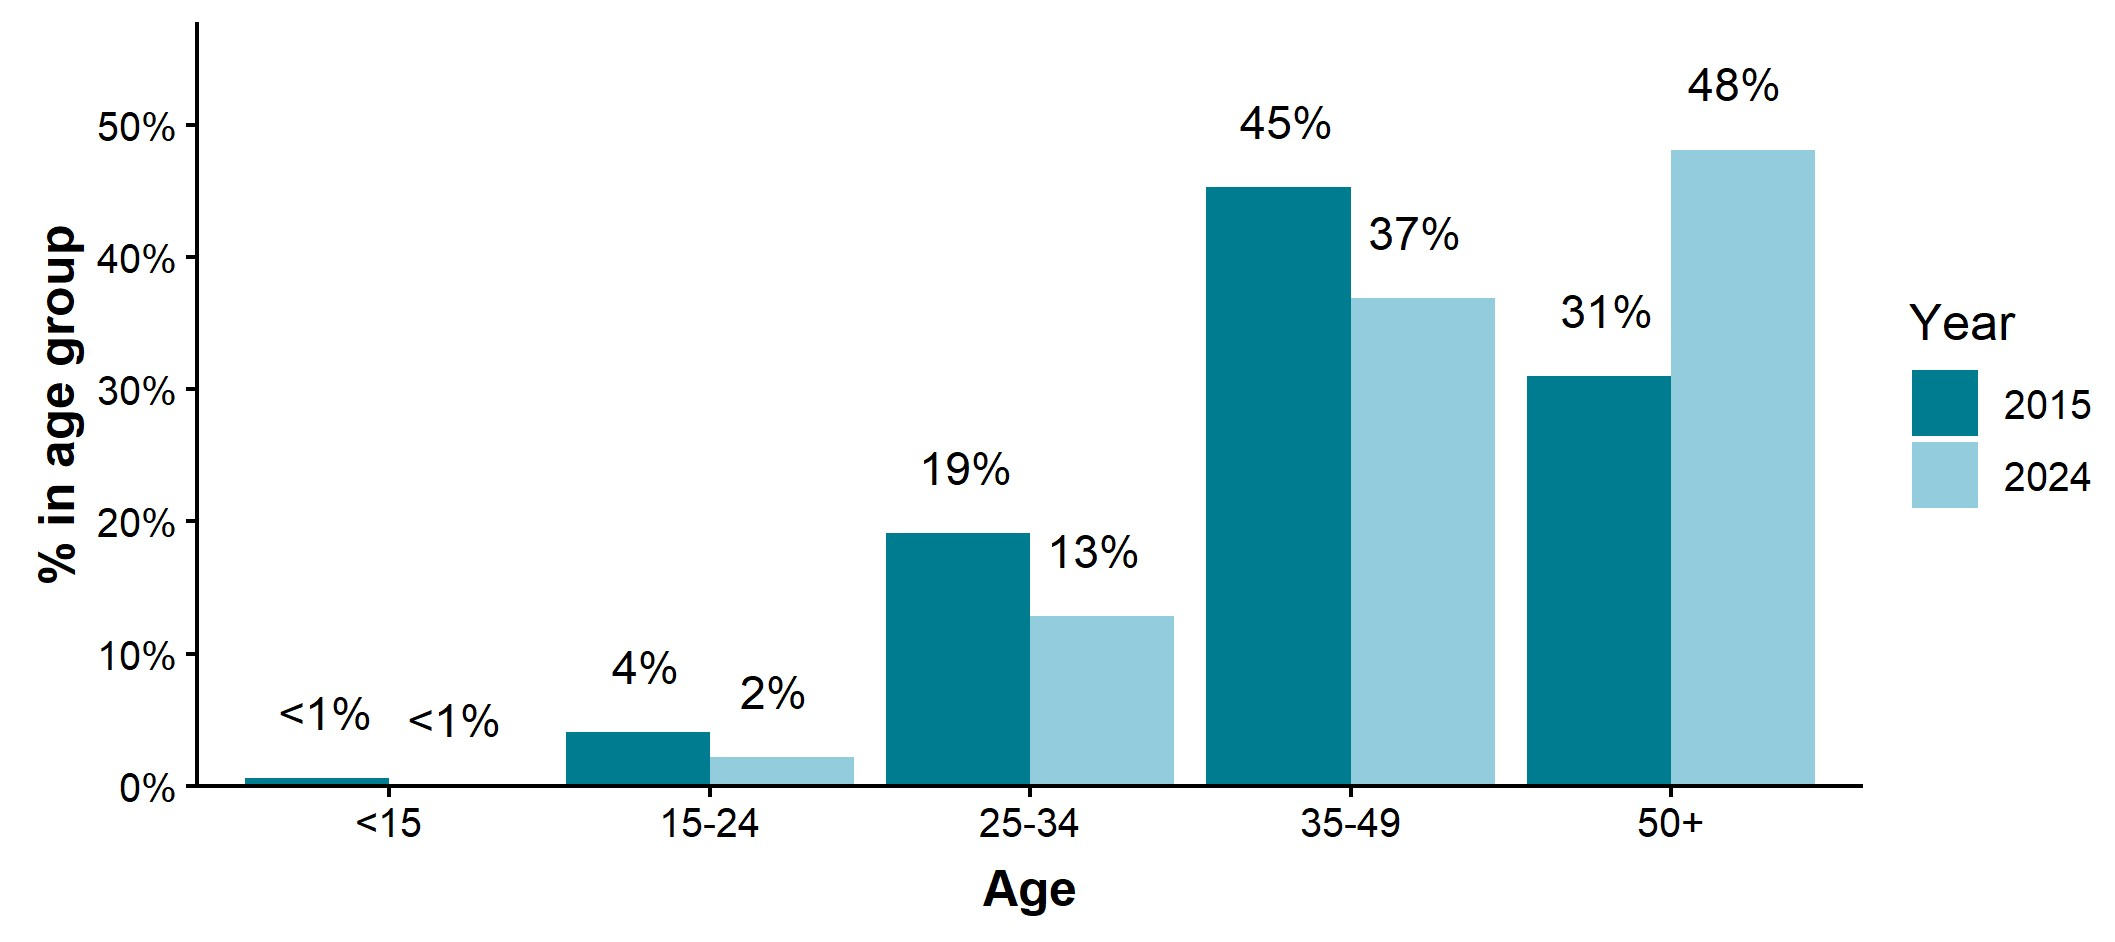
Figure 26. Percentage of all residents with diagnosed HIV who are accessing care, by age group contribution, the North East, 2015 and 2024
Sources: UKHSA, HIV and AIDS Reporting System (HARS).
Figure 26 is a column chart displaying the age distribution of North East residents with diagnosed HIV who accessed care in 2015 (dark column) and 2024 (light column). Five age groups are displayed: under 15 years, 15 to 24 years, 25 to 34 years, 35 to 49 years and 50 and over years.
The chart shows for all age groups except 50 years and over, the percentage of residents with diagnosed HIV was lower in 2024 compared to 2015. This suggests an ageing cohort effect in which there is reduced transmission and fewer new diagnoses feeding into the younger age groups in combination with improved treatments and fewer premature deaths, such that more individuals living with diagnosed HIV are moving up into older age groups.
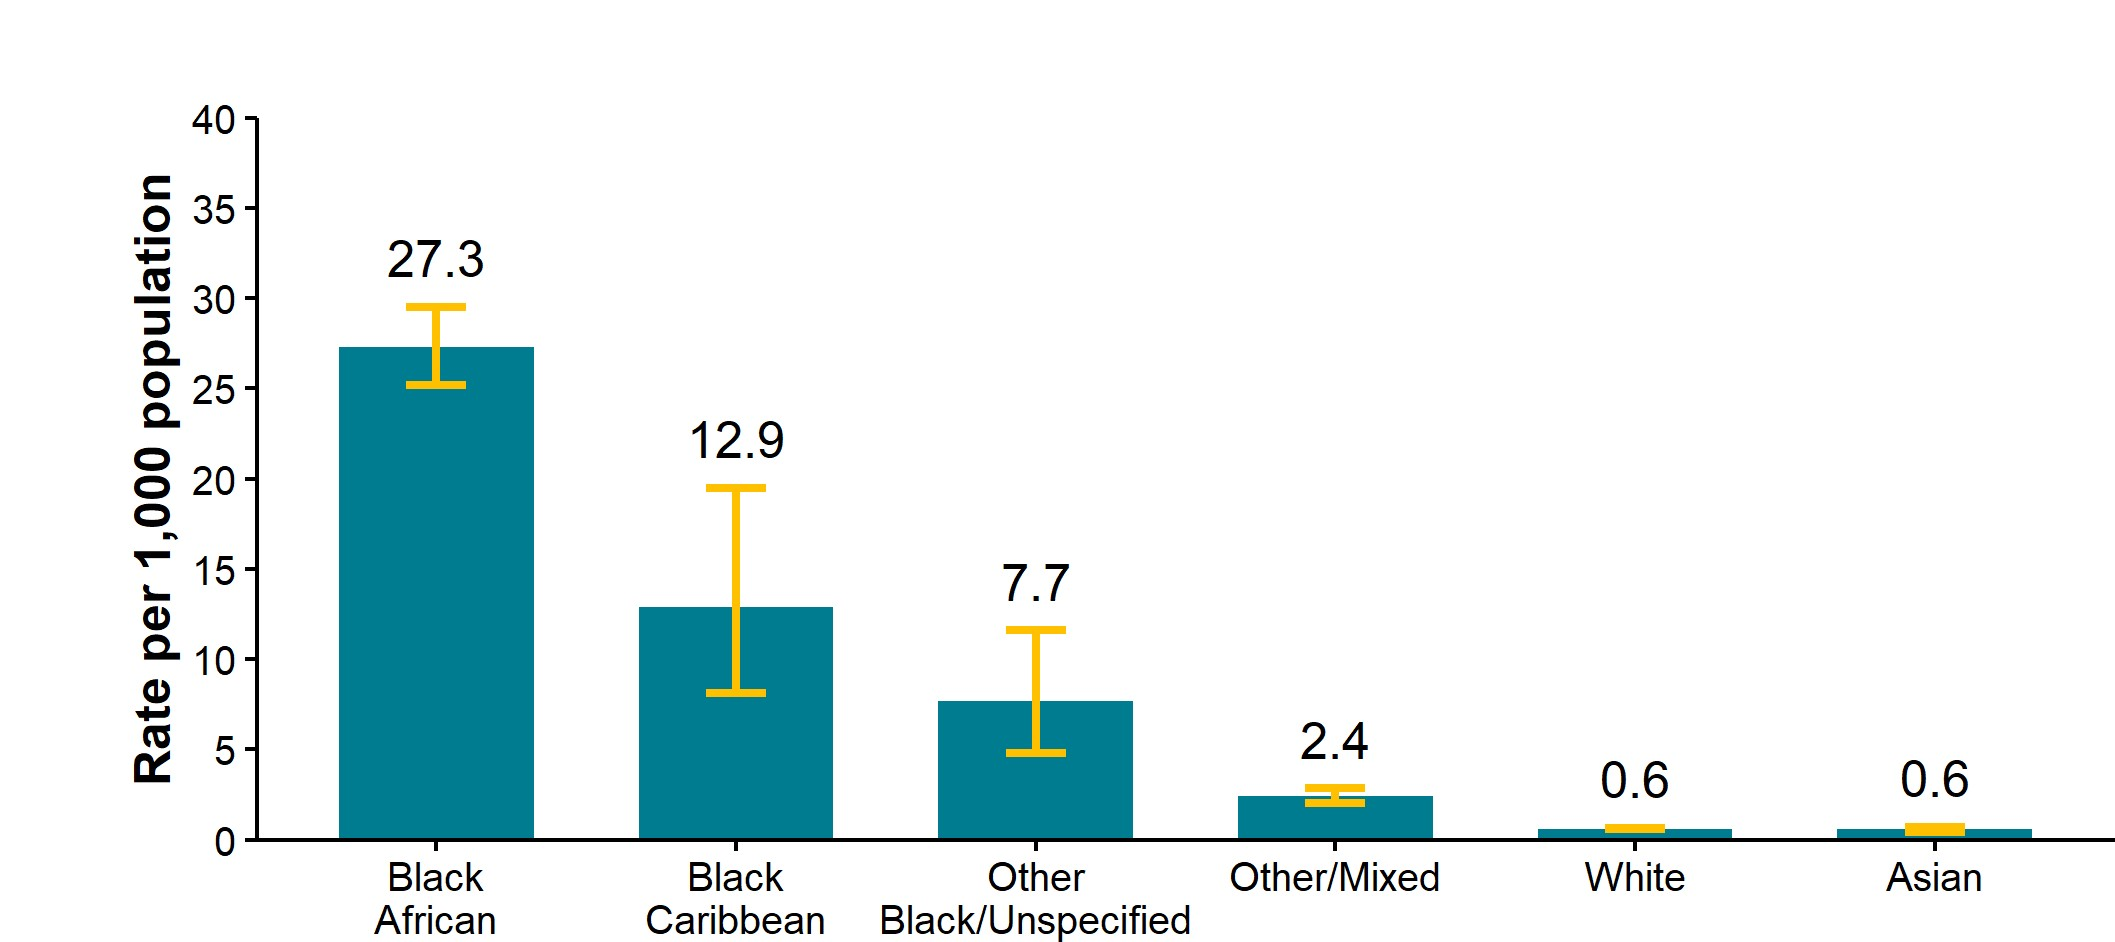
Figure 27. Diagnosed HIV prevalence per 1,000 residents by ethnic group (all ages), the North East, 2024
Sources: UKHSA, HIV and AIDS Reporting System (HARS).
Figure 27 is a column chart displaying the prevalence (per 1,000 residents) of diagnosed HIV in the North East in 2024 by ethnic group. Six categories are shown: Black African, Black Caribbean, Other Black/unspecified, Other/Mixed, White, and Asian. No ages were excluded from these data.
The chart shows the diagnosed HIV prevalence per 1,000 North East residents was highest in the Black African ethnic group (27.3) and lowest in the White (0.6) and Asian (0.6) ethnic groups. Notably the North East has a small population of Black African and Black Caribbean ethnic groups. While these groups show the greatest prevalence, absolute numbers are small. In 2024 there were 1,584 individuals with a White ethnic background, 602 individuals with a Black African ethnic background, 145 Other or Mixed, 55 Asian, 22 Black Caribbean and 22 individuals with Other Black or unspecified ethnic backgrounds living with diagnosed HIV and accessing care in the North East.
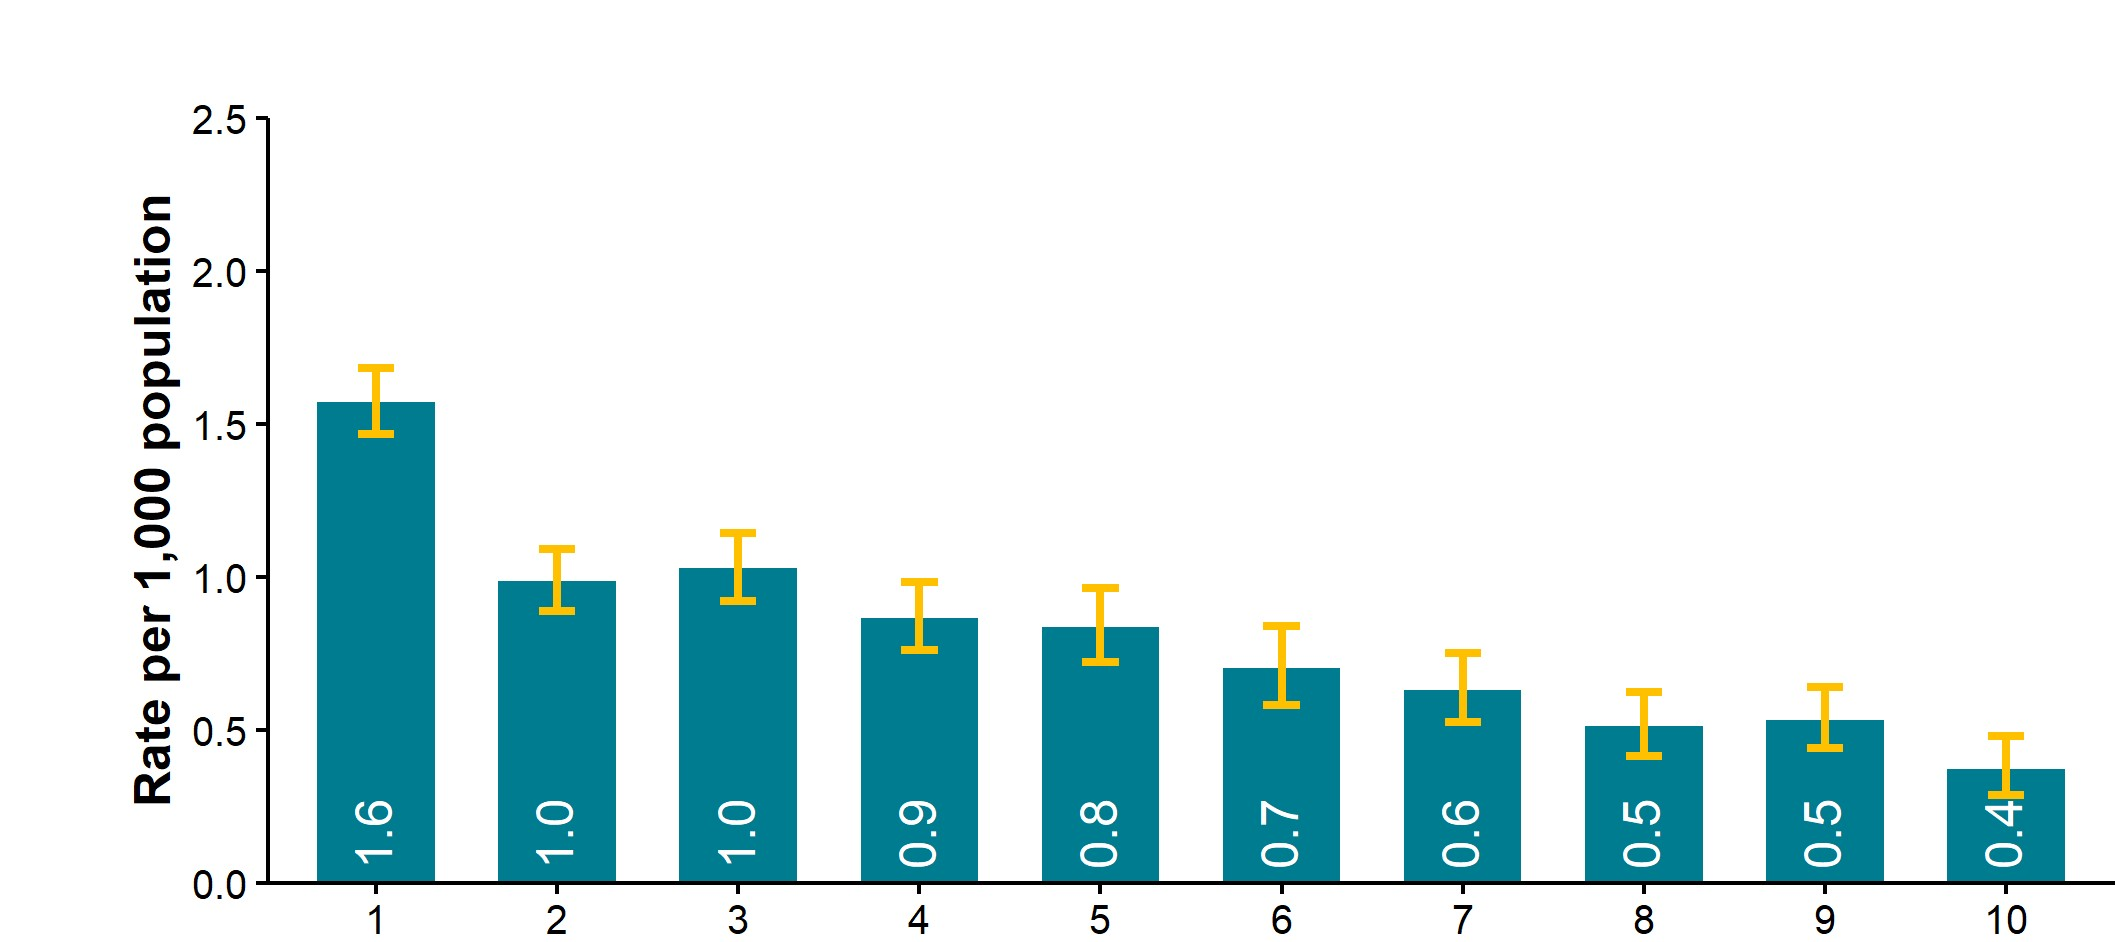
Figure 28. Diagnosed HIV prevalence per 1,000 population by Index of Multiple Deprivation decile, the North East, 2024
Sources: UKHSA, HIV and AIDS Reporting System (HARS).
Figure 28 is a column chart displaying the diagnosed HIV prevalence per 1,000 North East residents in 2024 by index of multiple deprivation (IMD) decile (1 is the most deprived, 10 is the least deprived).
The chart shows the rate across the North East increased with increasing deprivation in 2024, rising from 0.4 per 1,000 population in the least deprived areas (IMD 10) to 1.6 per 1,000 population in the most deprived areas (IMD 1).
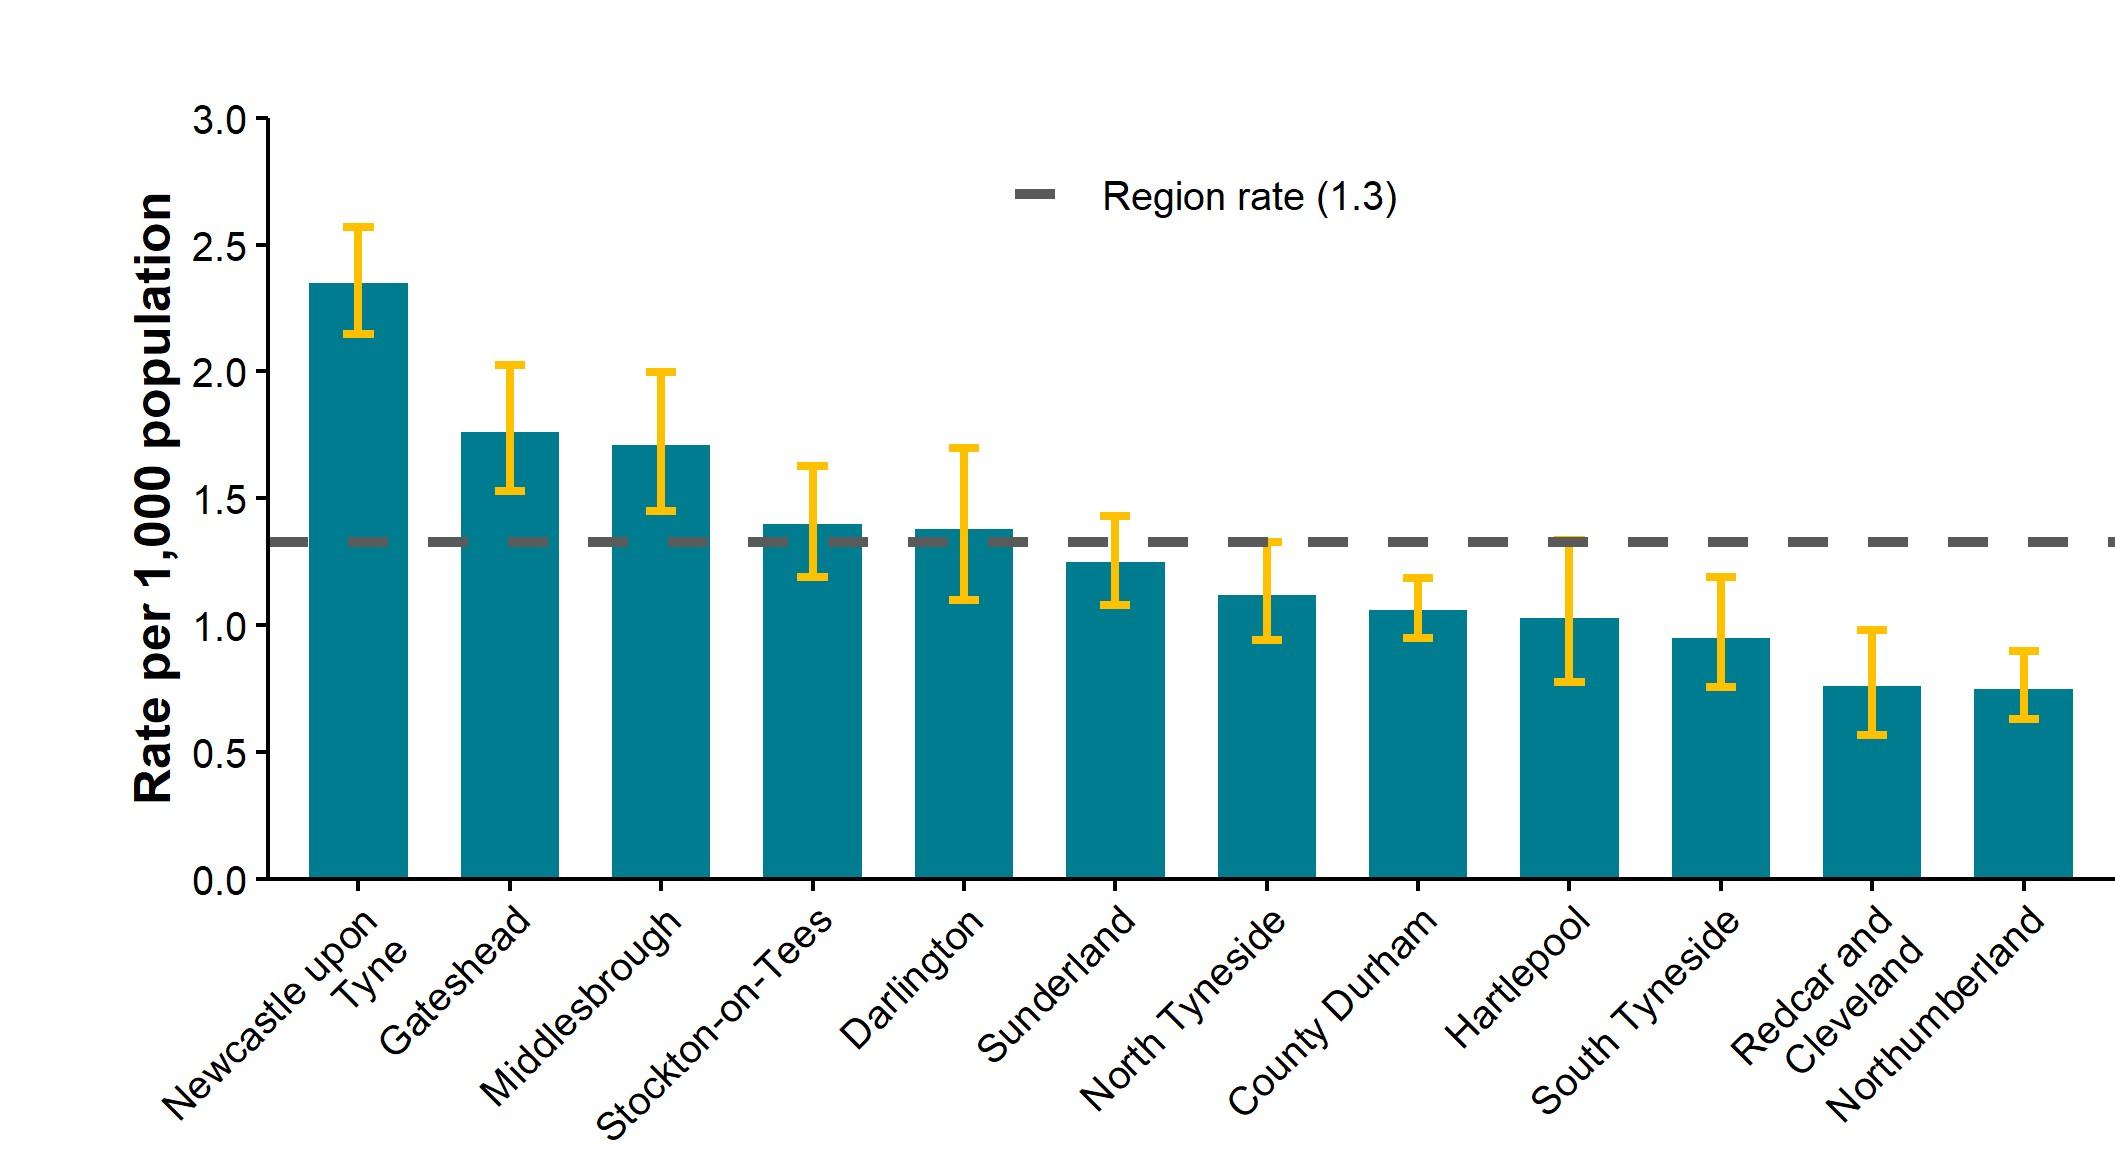
Figure 29. Diagnosed HIV prevalence per 1,000 residents aged 15 to 59 years by local authority, the North East, 2024
Sources: UKHSA, HIV and AIDS Reporting System (HARS).
Figure 29 is a column chart which displays the prevalence of diagnosed HIV by North East local authority of residence in 2024. Rates are per 1,000 population and are restricted to those aged 15 to 59 years as per NICE testing guidelines. Local authorities are shown in descending order in relation to prevalence of diagnosed HIV.
The chart shows the regional rate in 2024 is 1.3 per 1,000 residents aged 15 to 59 years (presented by the dashed line). This was the same regional rate as 2023.
Newcastle upon Tyne had the highest rate of all North East local authorities at 2.4 per 1,000, exceeding the 2 per 1,000 population threshold for expanded HIV testing / definition of ‘high prevalence’ area. Four additional local authorities had rates higher that the regional average: Gateshead (1.8 per 1,000), Middlesbrough (1.7 per 1,000), Stockton-on-Tees (1.4 per 1,000) and Darlington (1.4 per 1,000). Redcar and Cleveland, and Northumberland had the lowest rates in 2024 (0.8 per 1,000 each respectively).
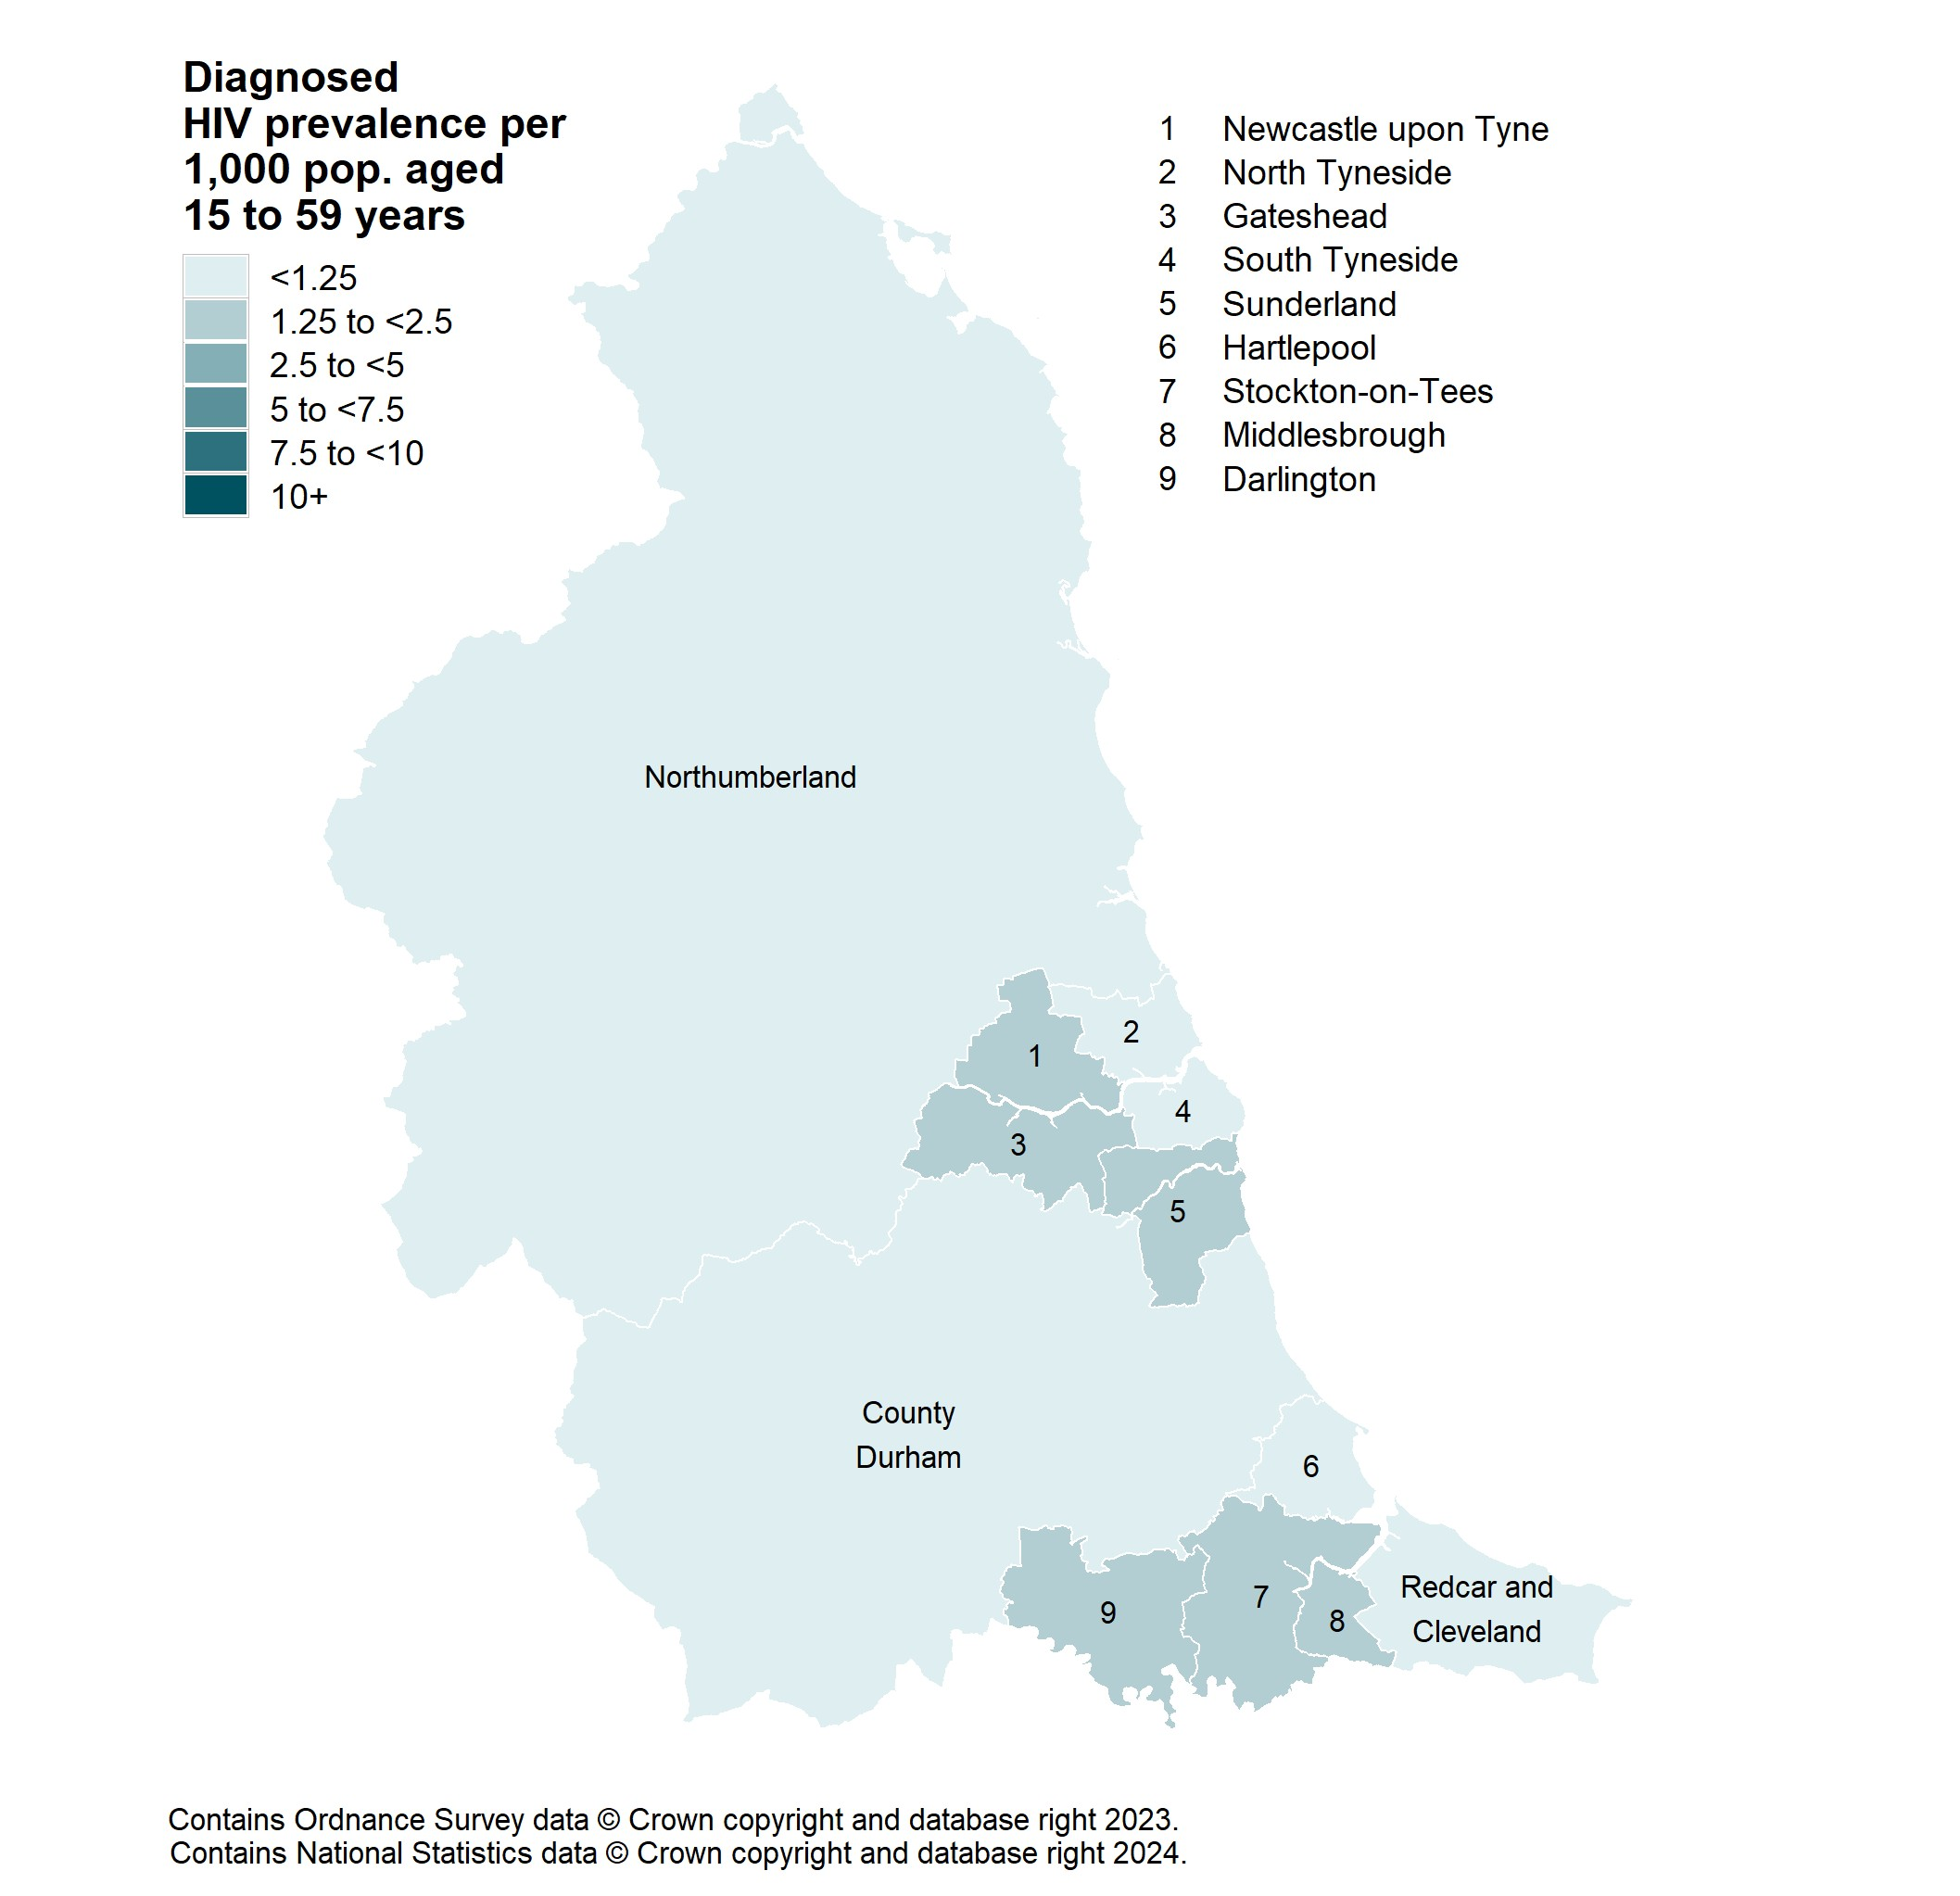
Figure 30. Diagnosed HIV prevalence per 1,000 residents aged 15 to 59 years by local authority, the North East, 2024
Sources: UKHSA, HIV and AIDS Reporting System (HARS).
Figure 30 is a map displaying diagnosed HIV prevalence (per 1,000 residents), aged 15 to 59 years by local authority in the North East in 2024. This conveys the information in Figure 29 more graphically.
Nine local authorities in the North East are annotated by numbers on the map: Newcastle upon Tyne, North Tyneside, Gateshead, South Tyneside, Sunderland, Hartlepool, Stockton-on-Tees, Middlesbrough and Darlington. In addition, Northumberland, County Durham, Redcar and Cleveland are displayed. The local authorities are colour coded: the darker the shade, the higher the diagnosed HIV prevalence.
The map shows that the lowest diagnosed HIV prevalences in the North East were in Northumberland and Redcar and Cleveland (0.8 per 1,000 residents each). As mentioned in Figure 29, Newcastle upon Tyne (2.4 per 1,000 residents) had the highest diagnosed HIV prevalence in the North East.
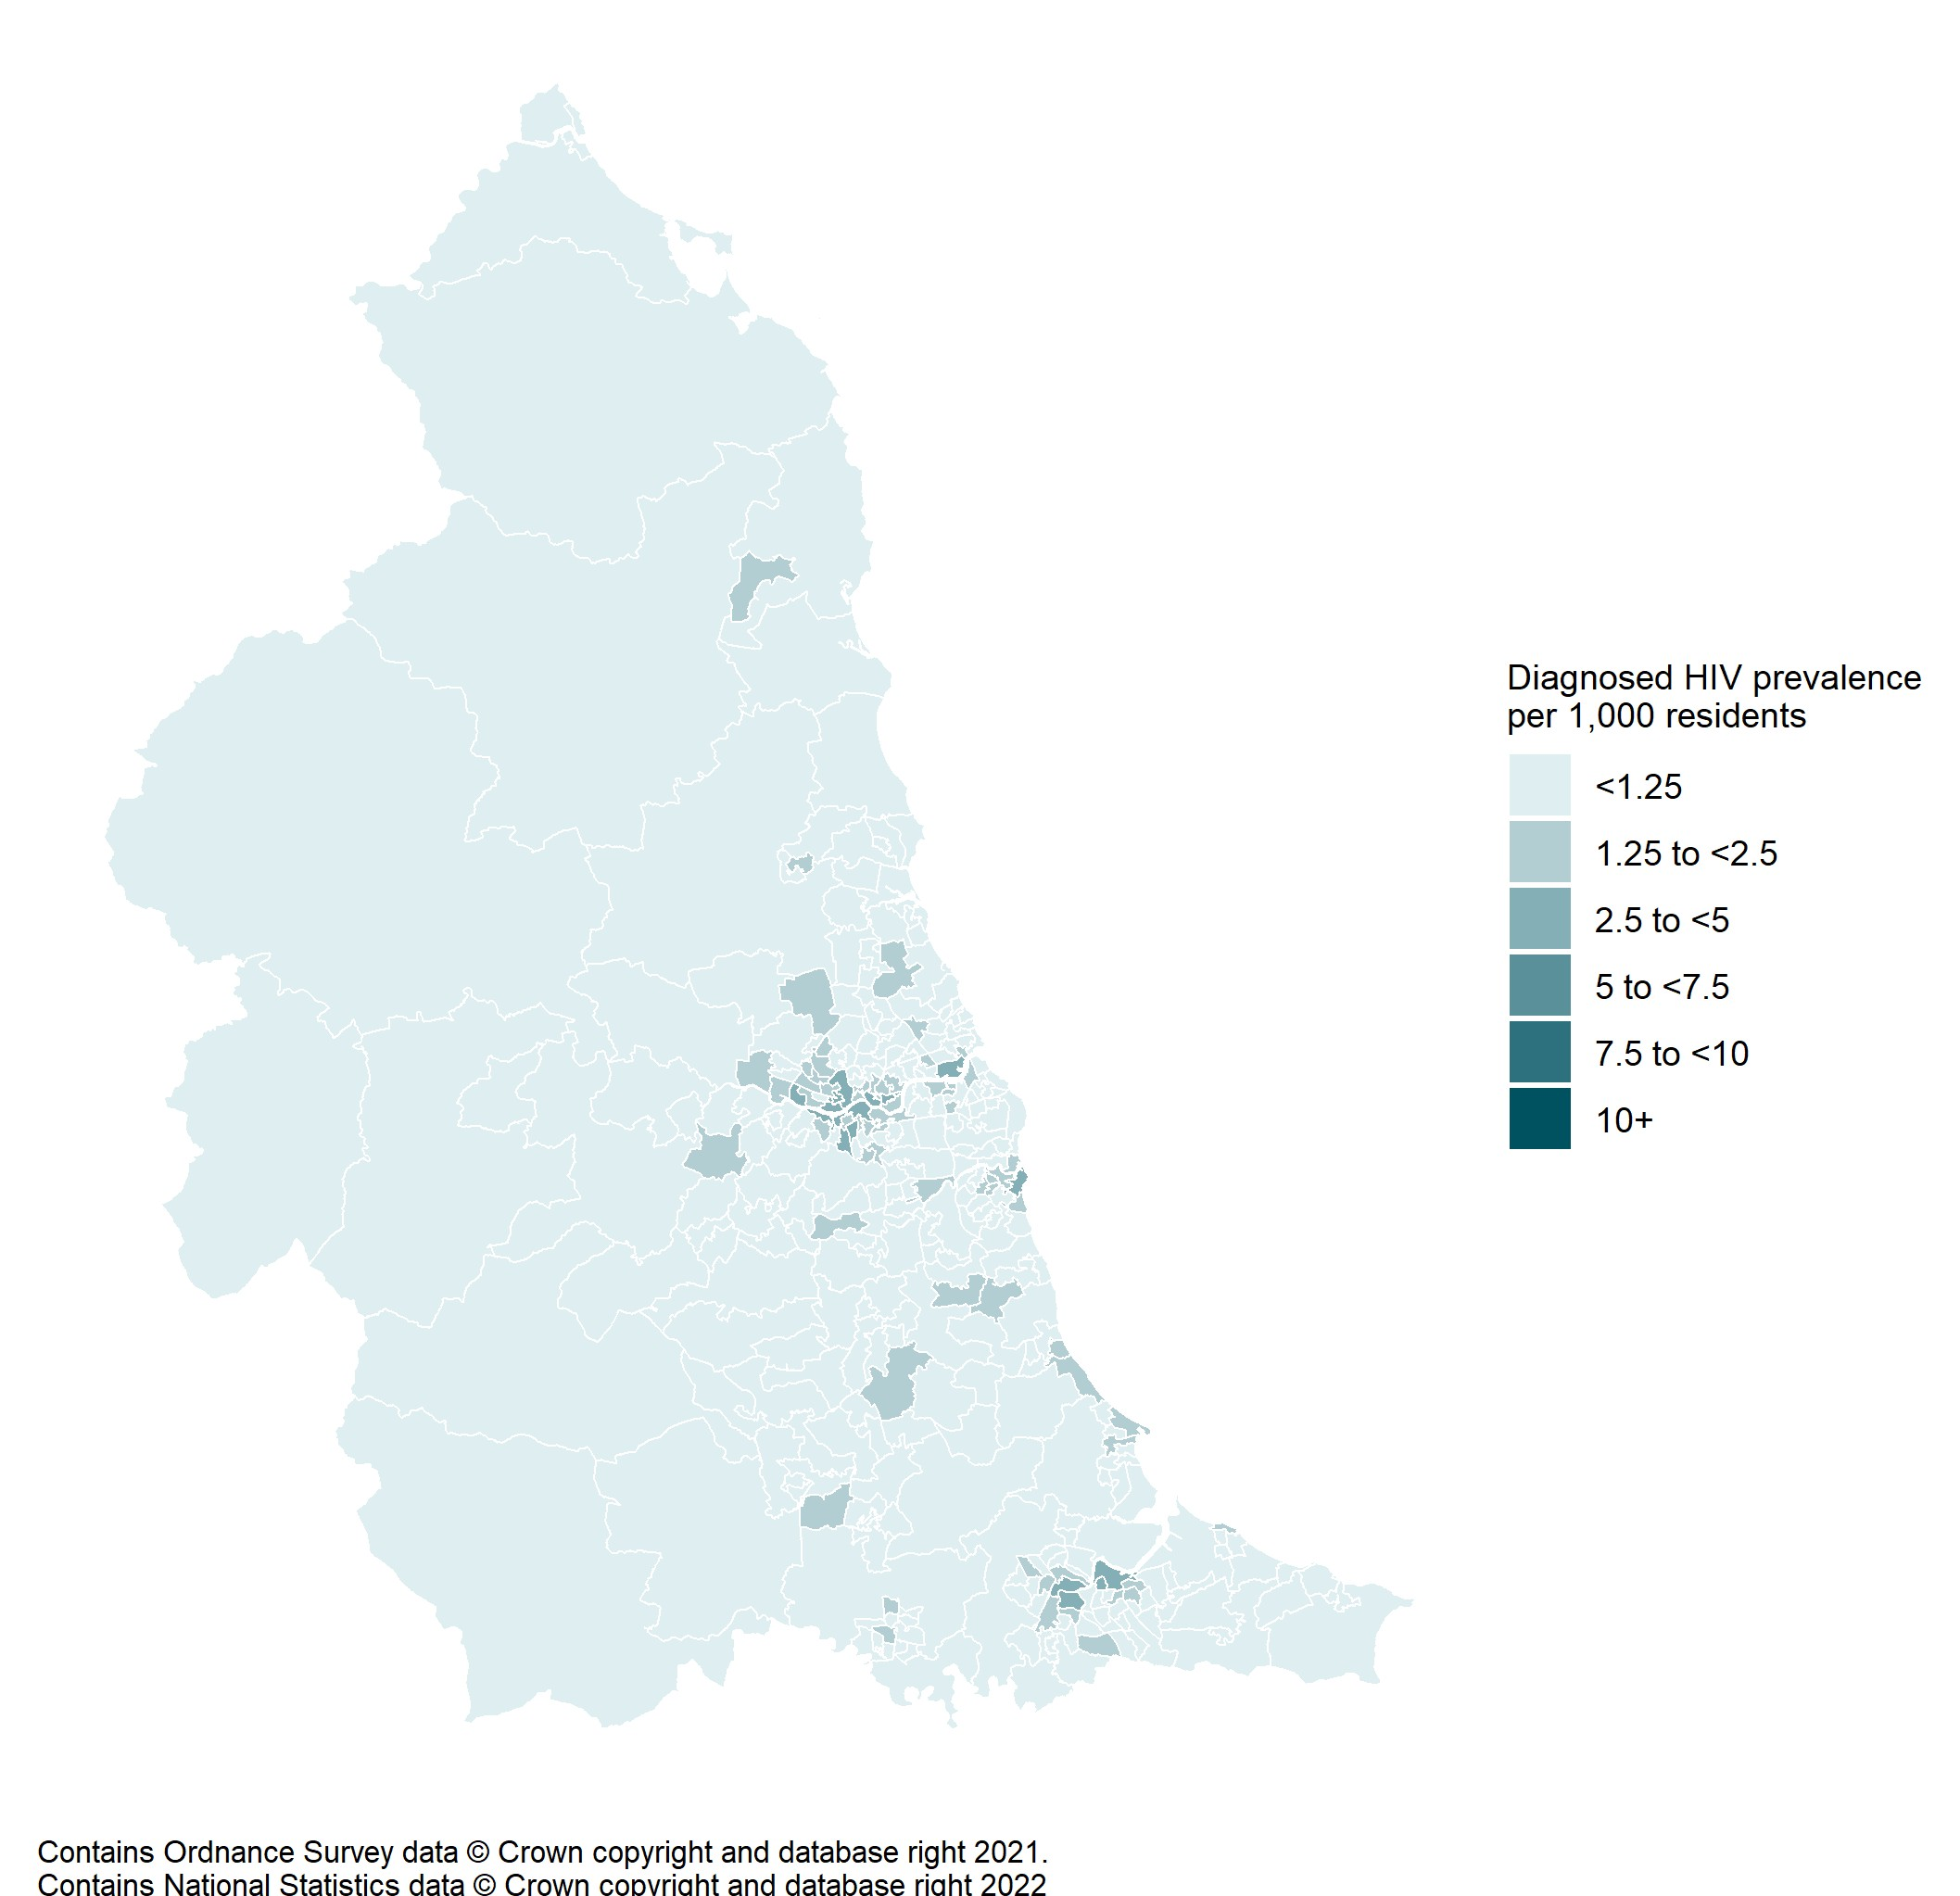
Figure 31. Diagnosed HIV prevalence per 1,000 residents (all ages) by middle super outer area of residence the North East, 2024
Sources: UKHSA, HIV and AIDS Reporting System (HARS).
Figure 31 is a map displaying diagnosed HIV prevalence (per 1,000 residents), for all ages by middle super output area (MSOA) of residence in the North East in 2024. The MSOAs are colour coded: the darker the shade, the higher the diagnosed HIV prevalence.
The map shows that the vast majority of MSOAs in the North East had diagnosed HIV prevalence less than 1.25 per 1,000 residents (265 out of 342, 77%), 18% of MSOAs (62 out of 342) had a rate between 1.25 and 2.5 per 1,000 and 4% (15 out of 342) had a rate between 2.5 and 5 per 1,000 population. MSOAs with rates between 2.5 and 5 per 1,000 population fell predominantly within Newcastle upon Tyne (6 out of 15) with some in Gateshead (3), Middlesbrough (2), Stockton-on-Tees (2), North Tyneside (1) and Sunderland (1).
HIV testing
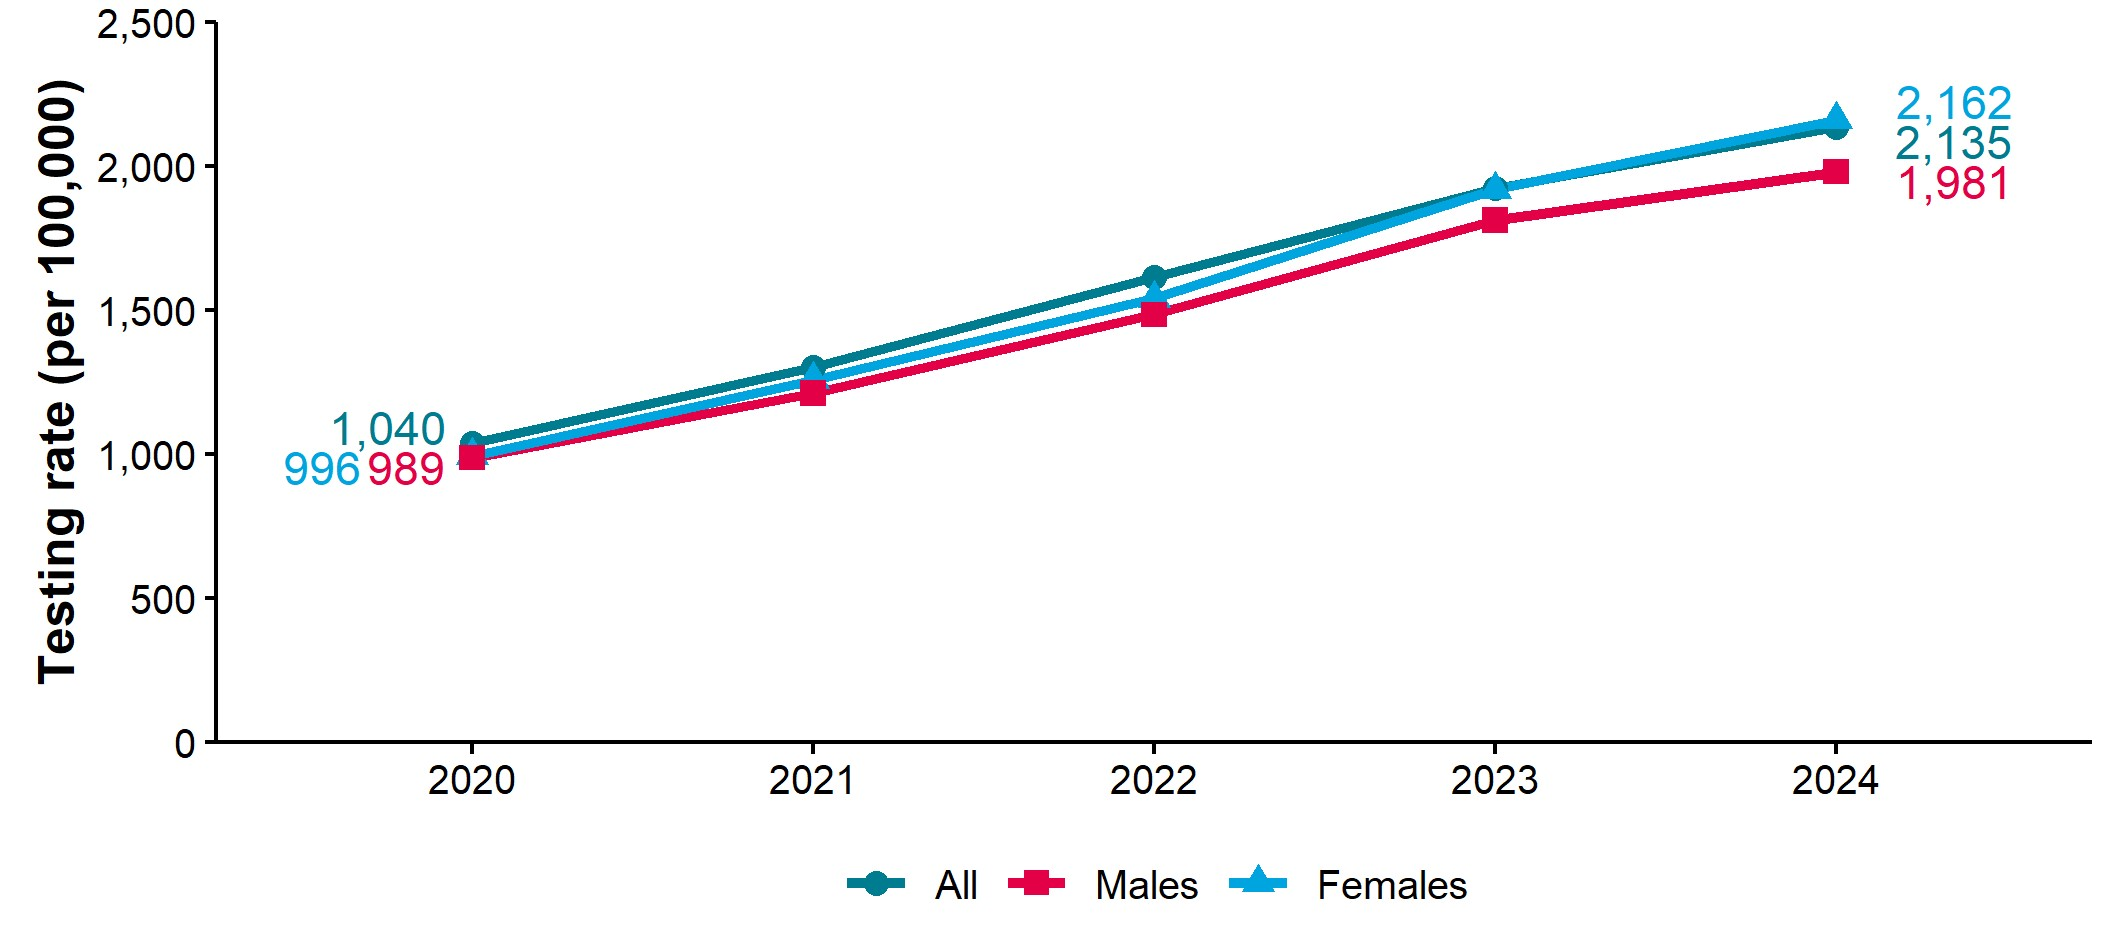
Figure 32. HIV testing rate per 100,000 by population group, North East residents, 2020 to 2024 [note 6]
Sources: UKHSA, Genitourinary Medicine Clinic Activity Dataset (GUMCAD).
The proportion of eligible attendees at specialist sexual health services (SHS) who accepted a HIV test. An eligible attendee is defined as a patient attending specialist SHS at least once during a calendar year. Patients known to be HIV positive, or for whom a HIV test was not appropriate, or for whom the attendance was related to Sexual and Reproductive Health (SRH) care only, are excluded.
Figure 32 is a line chart presenting testing rates (per 100,000) at specialist sexual health services (SHS) in North East residents over the last 5 years, from 2020 to 2024. Three population groups are presented: all individuals, males and females.
The chart shows that HIV testing rates have increased continuously over the past 4 years in the North East, for all individuals, as well as for males and females.
Table 2. People tested for HIV by population group, North East residents attending all SHSs, 2019 to 2024
| Gender identity or sexual orientation | 2019 | 2020 | 2021 | 2022 | 2023 | 2024 | % change 2019 to 2024 | % change 2023 to 2024 |
|---|---|---|---|---|---|---|---|---|
| Heterosexual men | 14,531 | 7,244 | 7,692 | 9,793 | 12,779 | 14,357 | 1% | 12% |
| Gay and bisexual men | 4,173 | 3,749 | 5,484 | 5,376 | 5,999 | 6,340 | 52% | 6% |
| All men | 19,408 | 11,507 | 13,961 | 16,079 | 19,884 | 21,487 | 11% | 8% |
| Hetero or bisexual women | 19,615 | 12,081 | 14,929 | 17,724 | 21,771 | 24,849 | 27% | 14% |
| All women | 20,850 | 12,812 | 16,045 | 18,993 | 23,453 | 26,286 | 26% | 12% |
| Total | 41,475 | 25,466 | 31,619 | 37,659 | 44,756 | 49,286 | 19% | 10% |
Sources: UKHSA, GUMCAD.
The totals for ‘All men’ and ‘All women’ include people tested from sexual orientation categories not shown in the table above.
Table 2 presents the number of North East residents tested for HIV in all sexual health services (SHS) over the period 2019 to 2024 and by population group.
Across all individuals, HIV testing increased by 19% between 2019 and 2024, from 41,475 to 49,286 tests, and by 10% between 2023 and 2024.
Among heterosexual men, HIV testing in 2024 returned to levels similar to those seen in 2019, following a substantial decline in 2020 associated with COVID-19-related restrictions on SHS. In contrast, HIV testing among gay and bisexual men was less affected during the pandemic and increased by 52% between 2019 and 2024, and by 6% between 2023 and 2024. HIV testing among all men increased by 11% between 2019 and 2024 and by 8% between 2023 and 2024.
Among women, HIV testing in heterosexual and bisexual women increased by 27% between 2019 and 2024 and 14% between 2023 and 2024. A similar pattern was observed among all women, with increases of 26% and 12%, respectively.
Pre-exposure prophylaxis (PrEP)
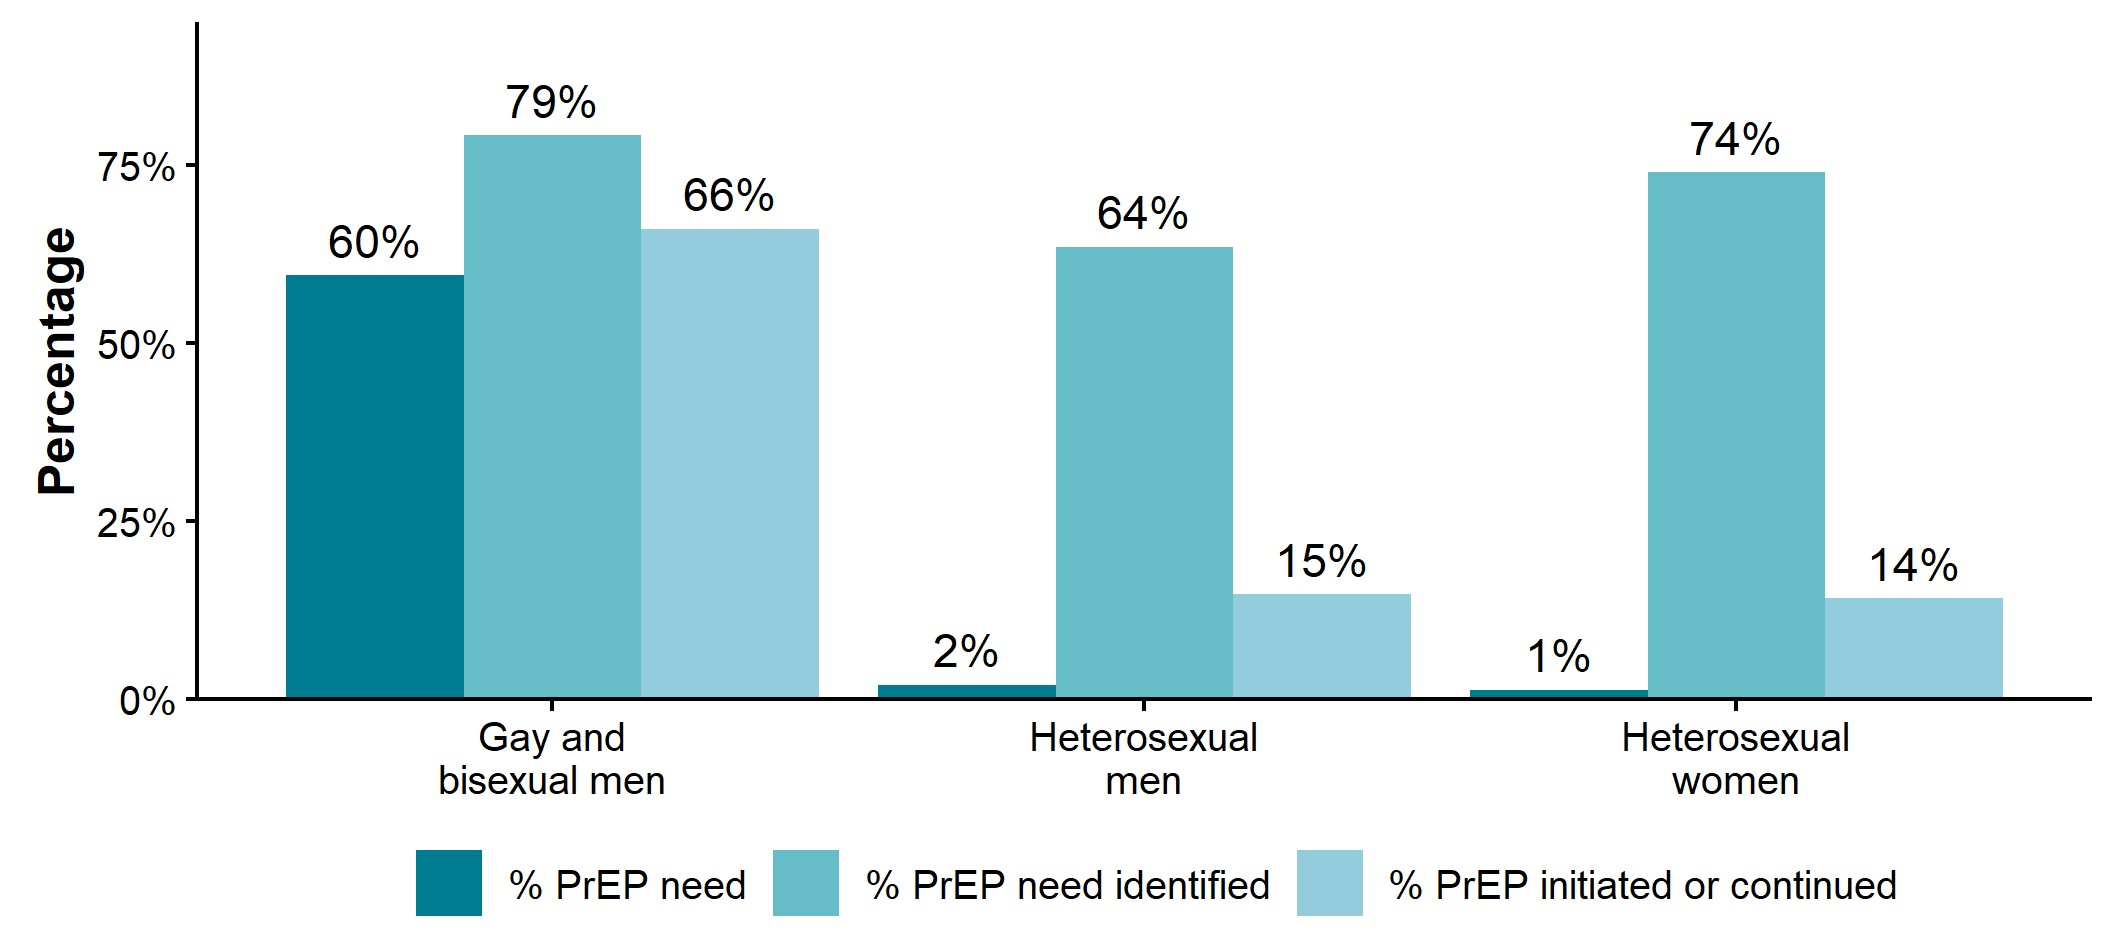
Figure 33. HIV pre-exposure prophylaxis (PrEP) need and initiation/continuation in residents attending specialist sexual health services (SHSs), the North East, 2024
Sources: UKHSA, GUMCAD.
Clinical and other information provided to GUMCAD was used to determine whether individuals were in need of PrEP, had that need identified and initiated in clinic. The 2 final columns for each group must be looked at in relation to the first column.
Figure 33 is a column chart displaying information about HIV pre-exposure prophylaxis (PrEP) need and use by gender identity and sexual orientation, in North East residents attending specialist sexual health services (SHS) in 2024. Three groups are shown: gay and bisexual men, heterosexual men and heterosexual women. For each group there are 3 columns: percentage of residents determined to be in need of PrEP, percentage of those in need of PrEP who were identified by the service, and percentage of those in need of PrEP for whom PrEP was initiated or continued. These 3 indicators were determined by clinical and other information provided to GUMCAD by SHS.
The chart shows that determined PrEP need was substantially higher among gay and bisexual men (60%) compared to heterosexual men (2%) and heterosexual women (1%). Similarly, the percentage of those in need of PrEP for whom PrEP was initiated or continued was also substantially higher among gay and bisexual men (66%) compared to heterosexual men (15%) and heterosexual women (14%).
In contrast, the percentage of those in need of PrEP who were identified by the service was closer between population groups (ranging from 64% in heterosexual men to 79% in gay and bisexual men).
Information on data sources
- HIV and AIDS New Diagnoses and Deaths (HANDD) collects information on new HIV diagnoses, AIDS at diagnosis and deaths among people diagnosed with HIV. Information is received from laboratories, specialist SHSs, GPs and other services where HIV testing takes place in England, Wales and Northern Ireland. The Recent Infection Testing Algorithm (RITA) and CD4 surveillance scheme are linked to HANDD to assess trends in recent and late diagnoses. Data is deduplicated across regions and therefore figures may differ from country-specific data.
- The Survey of Prevalent HIV Infections Diagnosed (SOPHID) began in 1995 and was a cross-sectional survey of all adults living with diagnosed HIV infection who attend for HIV care in England, Wales and Northern Ireland. SOPHID collected information about the individual’s place of residence along with epidemiological data including clinical stage and antiretroviral therapy (ART). In 2015, SOPHID reporting in England was replaced by the HIV and AIDS Reporting System (HARS) which captures information at every attendance for HIV care.
- Date of data extract: October 2024. Updates to HANDD and SOPHID/HARS made after this date will not be reflected in this report.
- Confidence intervals for rates in the figures have been calculated to the 95% level using the Byar’s method. Confidence intervals for percentages have been calculated to the 95% level using the Wilson Score method. Confidence intervals presented in the text are produced by Bayesian analysis.
- The most recent ONS mid-year estimates at the time of analysis were used as denominators for rates. Unless otherwise stated, for UTLAs 2024 estimates were used (published June 2024), for MSOAs 2022 estimates were used (published November 2024), for LTLAs 2021 estimates were used (published November 2022), and for LSOAs 2022 estimates were used (published November 2024).
- The GUMCAD STI Surveillance System was established in 2008 as an electronic surveillance system to collect disaggregated, pseudonymised and depersonalised patient-level data on all STI tests and diagnoses from SHSs in England. In 2019, UKHSA commenced implementation of a new version of this data set, the GUMCAD Behavioural Specification (GUMCADv3). ONS mid-2023 population estimates have been used to calculate HIV testing rate.
- The data behind charts showing absolute numbers may have been adjusted for missing information. However, unless stated otherwise, the numbers in the summary section are the numbers as reported, that, is unadjusted counts. Where charts are displaying adjusted data this is indicated in the chart title. Where figures have been ‘adjusted for missing information’, this means that when unknown values are present (for example, route of probable exposure = ‘unknown’), they are proportionally distributed amongst other groups for the purposes of analysis (for example, if A = 12, B = 4, C = 2, and unknown = 6, the 6 ‘unknown’ values are distributed proportionally among groups A, B, and C to give A = 15, B = 6, C = 3).
- The denominators for all percentages exclude records for which information was unknown, that is the proportion of new diagnoses where probable route of exposure was gay and bisexual men would be calculated using new diagnoses for which route of exposure was known as the denominator.
- All analyses in this report are residence-based and reflect the patient’s place of residence at diagnosis.
- Numbers may change as more information becomes available to assign area of residence to cases and historical data is refreshed accordingly.
More information
For more information on a whole range of sexual health indicators, see:
For more information on local sexual health data sources, see:
For the annual epidemiological spotlight on STIs in North East 2023, see:
For the national HIV report: 2023 data, see:
Local authorities have access to additional HIV and STI intelligence via the Data Exchange and the HIV and STI web portal. They should also have received a set of tables containing HIV data specific to their authority. If they do not have access to this information, they should contact fes.northeast@ukhsa.gov.uk
About the Field Service
The Field Service was established in 2018 as a national service comprising geographically dispersed multi-disciplinary teams integrating expertise in Field Epidemiology, Real-time Syndromic Surveillance and Public Health Microbiology to strengthen the surveillance, intelligence and response functions of UKHSA.
You can contact your local FS team at fes.northeast@ukhsa.gov.uk
If you have any comments or feedback regarding this report or the Field Service, contact your local FS team above.
Acknowledgements
We would like to thank:
- local sexual health and HIV clinics for supplying the HIV data
- Institute of Child Health
- UKHSA Blood Safety, Hepatitis, Sexually Transmitted Infections and HIV Division (BSHSH) for collection, analysis and distribution of data
References
1. Brown Alison E, Shah Ammi, Martin Veronique, Chau Cuong, Djuretic Tamara. ‘People diagnosed with HIV before continuing care in England are extremely unlikely to pass on HIV in England’ HIV Medicine 2025: volume 26, issues 10, pages 1,626 to 1,627
2. Shah Ammi, Mackay Neil, Kitt Hannah, Harrison Catriona, Okumu-Camerra Kadeen, Ratna Natasha and others. ‘HIV testing, PrEP, new HIV diagnoses and care outcomes for people accessing HIV services: 2025 report’ The annual official statistics data release (data to end of December 2024)