Chapter 7: current and emerging health protection issues
Published 13 July 2017

© Crown copyright 2017
This publication is licensed under the terms of the Open Government Licence v3.0 except where otherwise stated. To view this licence, visit nationalarchives.gov.uk/doc/open-government-licence/version/3 or write to the Information Policy Team, The National Archives, Kew, London TW9 4DU, or email: psi@nationalarchives.gov.uk.
Where we have identified any third party copyright information you will need to obtain permission from the copyright holders concerned.
This publication is available at https://www.gov.uk/government/publications/health-profile-for-england/chapter-7-current-and-emerging-health-protection-issues
1. Main messages
Health protection issues include the prevention and control of infectious diseases and environmental threats to the health of the population.
In England, hot and cold weather events are associated with increases in mortality and morbidity. During the winter 2015 to 2016 there were an estimated 24,300 excess deaths in winter. Flooding is particularly associated with adverse mental health effects.
Long-term exposure to particulate air pollution in the population increases the burden of mortality, principally from cardiovascular and respiratory causes. In England, it is estimated to have an effect on mortality equivalent to 25,000 deaths every year.
Over the past century there have been significant reductions in the number of deaths from traditional infectious diseases. These accounted for 32% of all deaths in 1901 compared with just 8% in 2015. New threats from infectious diseases arise from changing socio-demographics including increased travel, immunosuppression and new types of viruses or bacteria.
The increasing use of antibiotics is a major driver in the development of antibiotic-resistant infections, which are increasing. However, antibiotic consumption fell across all healthcare settings for the first time in the financial year 2014 to 2015 in England.
2. Introduction
Life expectancy has risen steadily since the 1900s and, despite very recent fluctuations, provisional data for 2016 show that it has reached 79.5 years for males and 83.1 years for females. In Western countries, some infectious diseases have been all but eliminated and mortality from infections has fallen which has contributed to significant improvements in life expectancy over the past century (chapter 1).
Our environment continues to significantly contribute to ill health. For example, poor air quality or cold weather contributes to mortality from respiratory and cardiovascular diseases. Diseases such as mesothelioma (a type of lung cancer) arising from exposure to workplace asbestos or deaths from motor vehicle accidents are expected to fall thanks to legislative and technological advances.
The National Risk Register (NRR) provides an overview of the main types of civil emergencies that could affect the UK in the next 5 years [footnote 1] (figure 1). Many of the risks included in the register have health consequences that will be discussed in this chapter:
Climate change, extreme events, and air pollution
Climate change is likely to have a range of environmental effects that may impact on health including; more frequent and severe extreme weather events, such as heatwaves and floods; changing patterns of air pollution; changing patterns of diseases caused by microorganisms
Emerging and re-emerging infectious diseases
These are infections which have appeared in the population for the first time, or that may have existed previously but are rapidly increasing in incidence or geographic range. Examples include Ebola, Zika virus and tuberculosis.
Pandemic influenza
A global outbreak of an influenza virus
Antimicrobial resistance (AMR)
This occurs when the microbes that cause disease (including bacteria, viruses, fungi, and parasites) cease to be affected by the drugs we use to kill them and treat the disease
2.1 Figure 1: national risk assessment of civil emergencies facing people in the UK, 2015
Pandemic influenza is the most significant civil risk facing the UK
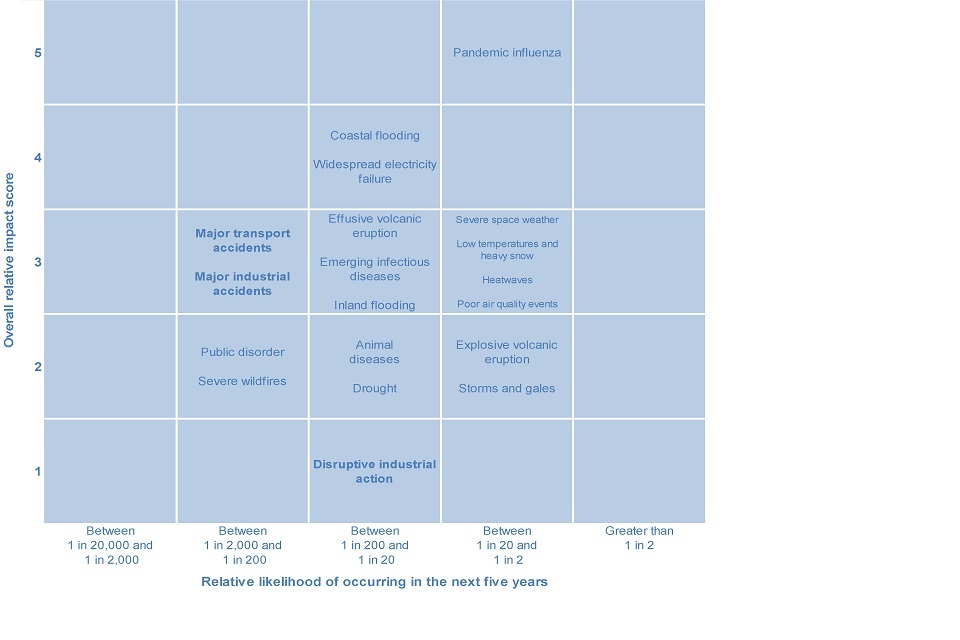
Figure 1. National risk assessment of civil emergencies facing people in the UK, 2015
This shows:
- the probability of an influenza pandemic (impact = 5) occurring in the next 5 years is between 1 in 2 and 1 in 20
- the reasonable worst case for severe heatwaves, cold and heavy snow, and elevated poor air quality are also assessed as likelihood ‘4’ (between 1 in 2 and 1 in 20), but their impacts would be significantly less than that of pandemic influenza
- the NRR also has separate information as to the risk from terrorism and other malicious attacks
See the full data source: National Risk Register of Civil Emergencies 2015 Edition (Cabinet Office)
3. Climate change and extreme events
Extreme events are defined in this chapter as any extreme weather or other natural hazards, with the potential to cause adverse impact on health [footnote 2]. The main extreme events in England are cold weather, heatwaves, flooding, and drought. Extreme events that may have more relevance in other countries include wildfires, landslides, earthquakes, volcanic eruptions, and tsunamis.
Greenhouse gas emissions from human activity have led to higher average UK and global temperatures. Between 1880 and 2012, average surface global temperatures increased by 0.85C with changes reflected in the UK [footnote 3]. Public health, across the world and in the UK, is closely linked to climate change – from an increase in extreme events such as flooding and heatwaves to the threat of new diseases carried here from non-native species of mosquitoes, for example.
Excess winter deaths can be broadly defined as the number of deaths in winter (December to March) over and above the number expected based on deaths in the non-winter period (April to November) [footnote 4].
Following a steady decline since the 1950s, the number of excess winter deaths in England has plateaued in recent years from a 5-year average of 60,000 deaths per winter in the 1950’s to around 25,000 in the late 2000’s (figure 2). Older people are most affected by excess winter deaths, the causes of which are complex and inter-related but are considered largely to be due to cold weather and circulating infections such as influenza [footnote 5].
3.1 Figure 2: excess winter deaths, single years and 5-year central moving average, England and Wales, 1950 to 1951 up to 2015 to 2016
There has been a steady decline in the number of excess winter deaths since 1950
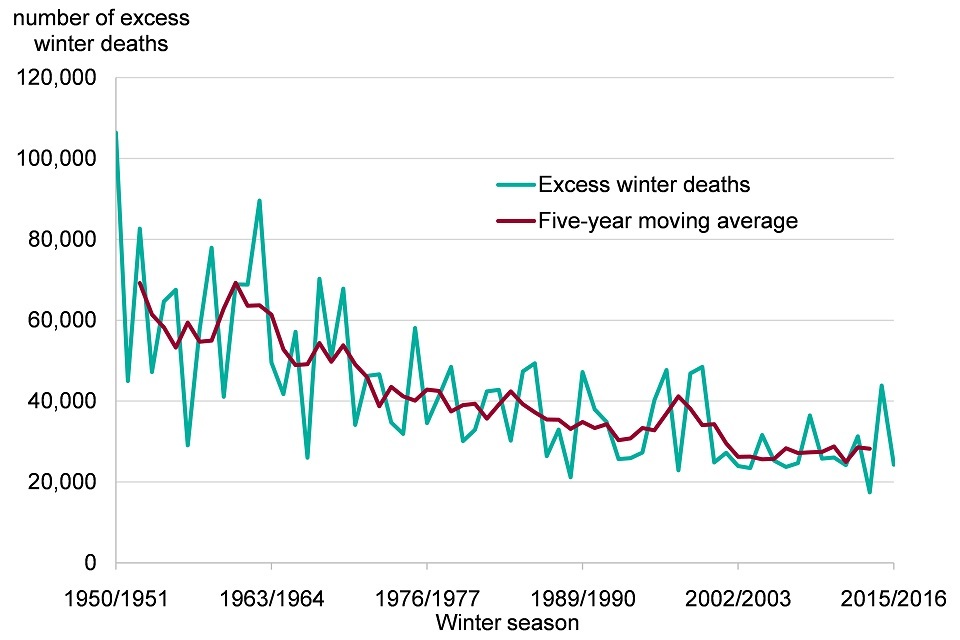
Figure 2. Excess winter deaths, single years and five-year central moving average , England and Wales, 1950 to 1951 to 2015 to 2016 [Source: ONS Excess winter mortality in England and Wales]
This shows:
- there has been a steady decline in the number of excess winter deaths since 1950 but the downward trend has plateaued in recent years
- in the winter of 1952 to 1953 there were 69,174 excess deaths based on the 5 years moving average, in 2013 to 2014 this had fallen to 28,218; 5 year central moving averages are calculated using the winter period of interest, along with the 2 winter periods before and 2 periods after (for example, data for 1952 to 1953 is the average of 1950 to 1951 up to 1954 to 1955)
- the most recent excess mortality data is available for 2015 to 2016, when there were an estimated 24,300 excess winter deaths
See the full data source: ONS Excess winter mortality in England and Wales
Most of the mortality burden from cold weather starts at relatively moderate outdoor average temperatures, around 4oC to 8oC, and increases as temperatures fall, but this relationship is complex [footnote 4]. Deaths due to cold temperatures are not commonly due to hypothermia, but rather due to respiratory and cardiovascular causes.
In 2015 to 2016 there were 41% more deaths during the winter months from respiratory diseases when compared with the non-winter months [footnote 6]. Of these, chest infections (bacterial and viral including influenza) accounted for the largest proportion of deaths.
Countries which typically have mild winters, such as Spain and Portugal, have much higher excess winter mortality when compared with countries with low winter temperatures [footnote 7]. This may be partly due to these populations being less prepared for cold weather (fewer precautions and poorer home insulation) [footnote 8]. In comparison with other European countries, England has higher than average excess winter mortality.
Fuel poverty is the condition of being unable to afford to keep one’s home adequately heated for comfort and this is one of the factors associated with a reduced quality of health [footnote 9]. In England, 10.6% of households were fuel poor in 2014, ranging from 12.6% of houses in the most deprived local authorities to 7.6% in the least deprived (chapter 6). Fuel poverty affected 2.38 million households in 2014 and a proportion of excess winter deaths are thought to be attributable to fuel poverty [footnote 10].
High temperatures in excess of 25oC are also associated with excess deaths, particularly in the elderly, young children and the chronically ill as these groups are less able to keep cool at high temperatures [footnote 12].
In the UK, summers have become hotter and, by 2040, heatwaves similar to the 2003 heatwave which led to 2,000 excess deaths, are expected to become the norm [footnote 13]. The main causes of death and illness during heatwaves are respiratory and cardiovascular diseases [footnote 14]. Nevertheless, despite the expected increase in heat-related premature deaths, deaths from hot weather are expected to continue to be lower than cold weather [footnote 15].
Ultraviolet (UV) radiation may also cause harm during hot weather [footnote 14]. In moderation, UV radiation helps the body produce vitamin D, but excessive exposure is harmful, especially in children. Over the last decade, the incidence of malignant melanoma has increased by 45% in the UK (56% in males and 35% in females) [footnote 16].
Flooding events have always occurred in England but there has been an increase in the number of events reported over the past 100 years. The winter of 2013 to 2014 brought the wettest winter to England in 250 years, with 155 flood warnings and 11,000 properties flooded [footnote 17].
Flood risk is projected to increase over this century, both as a result of climate change and population growth. The effects will depend on the degree of adaptation undertaken, including improved flood defences, catchment and urban water management, spatial planning and building codes [footnote 18].
In England, 1.4 million people live in areas where there is a greater than 1 in 75 annual chance of flooding [footnote 19]. As well as the direct health impacts of flooding (drowning, injuries, carbon monoxide poisoning) there are also indirect health impacts (depression, anxiety, post-traumatic stress disorder) [footnote 20]. The risk of mental health issues in people whose homes have been flooded is about 6 times higher than in those who are unaffected by flooding (figure 3).
3.2 Figure 3: mental health outcomes following flooding by exposure group
The risk of mental health issues in people whose homes have been flooded is 6 times higher than in those who are unaffected by flooding
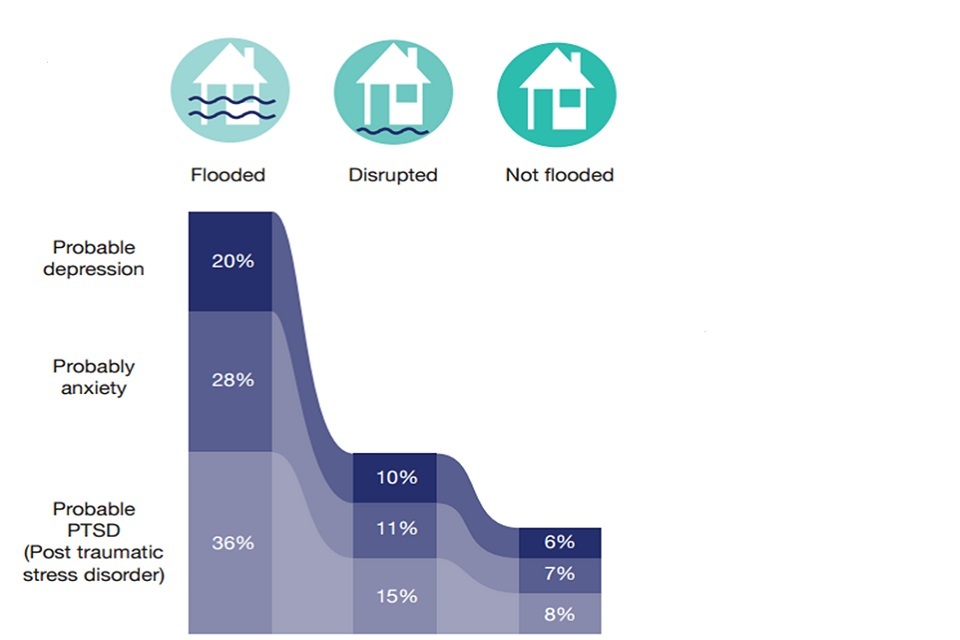
Figure 3. Mental health outcomes by exposure group
This shows that:
- the prevalence of depression among those who had experienced flooding was 20.1% compared to 5.8% in the unaffected group
- the prevalence of post-traumatic stress disorder (PTSD) among those who had been flooded was much higher in the flooded group (36.2%) when compared to those unaffected by flooding (7.9%)
- the disrupted group refers to people whose homes were not directly flooded but were affected by the resulting disruption (for example, loss of utilities or access to services); this group were found to have poorer mental health outcomes than those who were not flooded
See the full data source: Flooding and Health. National study 2017
4. Outdoor air pollution
Outdoor air pollution and the associated health problems have been well documented for centuries. The industrial revolution in the 18th century brought challenges as air pollution increased significantly due to the burning of coal.
As recently as the 1950s, high levels of soot and sulfur dioxide were emitted from industrial and domestic coal burning, resulting in the Great Smog of London in December 1952. One estimate is that this caused 12,000 additional deaths between December 1952 and February 1953 [footnote 21].
Since then there has been a change in the type of air pollution the population is exposed to, which has been driven by legislation and technological advances. Pollution emitted from transport increased in importance in the 1960s to 1980s (figure 4). Since then the change to unleaded fuel and catalytic convertors means that modern cars release much less lead and carbon monoxide than those in the 1980s. However, an increase in the use of diesel vehicles has contributed to particulate matter (PM2.5, PM10) and nitrogen dioxide (NO2) being of most concern (figure 4). Other pollutants such as ground-level ozone, formed in the air from chemical reactions, also affects health [footnote 22].
4.1 Figure 4: changes in the sources and constituents of air pollution
The sources and types of air pollution has changed since the 1940s
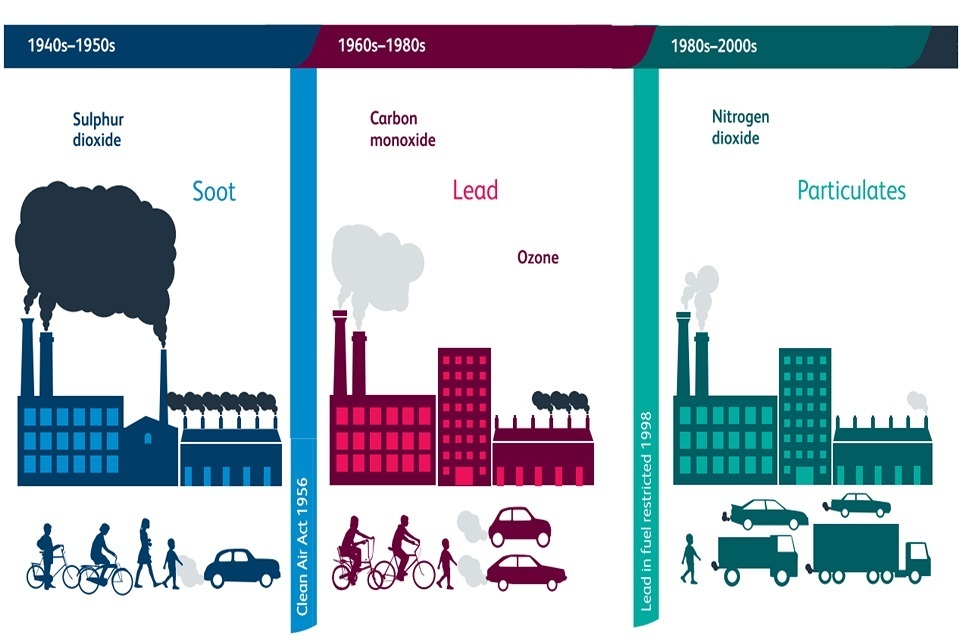
Figure 4. Changes in the sources and constituents of air pollution
This shows:
- in the 1940s and 1950s, large-scale industrial burning of coal resulted in large quantities of soot and sulfur dioxide being released into the atmosphere causing ill health
- following the Great Smog in 1952, new legislation such as the Clean Air Act 1956 was introduced to help tackle air pollution
- lead in fuels posed problems between the 1960s and 1980s and this was replaced following technological advances and further legislative change
- these days, increasing numbers of diesel vehicles emit particulate matter and nitrogen dioxide
See the full data source: Reproduced with permission from: Royal College of Physicians. Every breath we take: the lifelong impact of air pollution. Report of a working party. London: RCP, 2016. Illustration Kieli Bibbings, © Royal College of Physicians
Both short and long-term exposure to air pollutants can cause a range of adverse effects on health. Much of the evidence relates to effects on the respiratory and cardiovascular systems, but there is also emerging evidence suggesting possible effects on other health outcomes such as diabetes and brain function.
In England, particulate pollution from human activities is estimated to have an effect on mortality equivalent to approximately 25,000 deaths annually [footnote 23]. Air pollution is unlikely to be the sole or primary cause of deaths, but is thought likely to be a contributory factor to a much larger number of deaths than this. This estimated figure of attributable deaths is similar in size to that for alcohol, and about one-third of that for smoking (figure 5).
4.2 Figure 5: estimates of yearly mortality in England and the number of deaths for which the risk factor is the main cause of death.
Air pollution has a large effect on mortality in England, but is unlikely to be the main risk factor for individual deaths
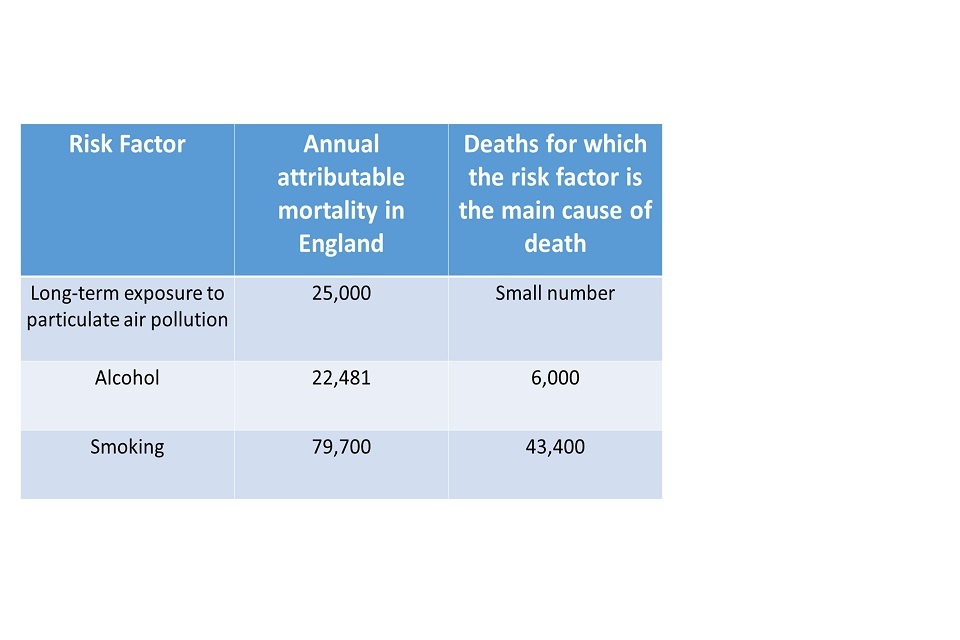
Figure 5. Estimates of yearly mortality in England and the number of deaths for which the risk factor is the main cause of death [Source: Understanding the impact of particulate air pollution, PHE Blog]
This shows:
- air pollution is unlikely to be the sole or principal cause of many deaths
- it is more likely to contribute to the deaths of a much larger number of people
- the overall effect is estimated as being equivalent to 25,000 deaths in England annually
See further information: PHE air pollution blog
Studies have also shown a link between mortality and long-term average concentrations of nitrogen dioxide (NO2). However, because particulates and NO2 are emitted from the same sources, it has been difficult to distinguish the effects of NO2 from those of particulate matter. The estimated burden of mortality from both NO2 and particulate matter is currently being determined by the Government’s Committee on the Medical Effects of Air Pollutants [footnote 23].
The elderly, the very young, and those with existing medical conditions are more vulnerable to the effects of air pollution [footnote 24]. The most deprived families often live in areas with the highest levels of pollution, as areas with the lowest housing costs tend to be near industrial zones or busy roads [footnote 24]. Short-term peaks in air pollution are also associated with increases in daily mortality and hospital admissions [footnote 25].
5. Emerging infectious diseases
Although morbidity and the number of deaths from infections have fallen dramatically there remains a significant threat from the emergence or re-emergence of infectious diseases (figure 6). Also, the rate at which these new diseases can develop and spread (or at least be identified) appears to be increasing. Between 1940 and 2004, 335 new infectious diseases emerged globally [footnote 26]. Of the emerging infectious diseases, 71.8% originated in wildlife, such as severe acute respiratory syndrome (SARS) and Ebola [footnote 27].
5.1 Figure 6: mortality from traditional infectious diseases, rates per 100,000, England and Wales, 1901 compared with 2015
In 1901, 32% of deaths were due to infectious diseases compared to 8% in 2015
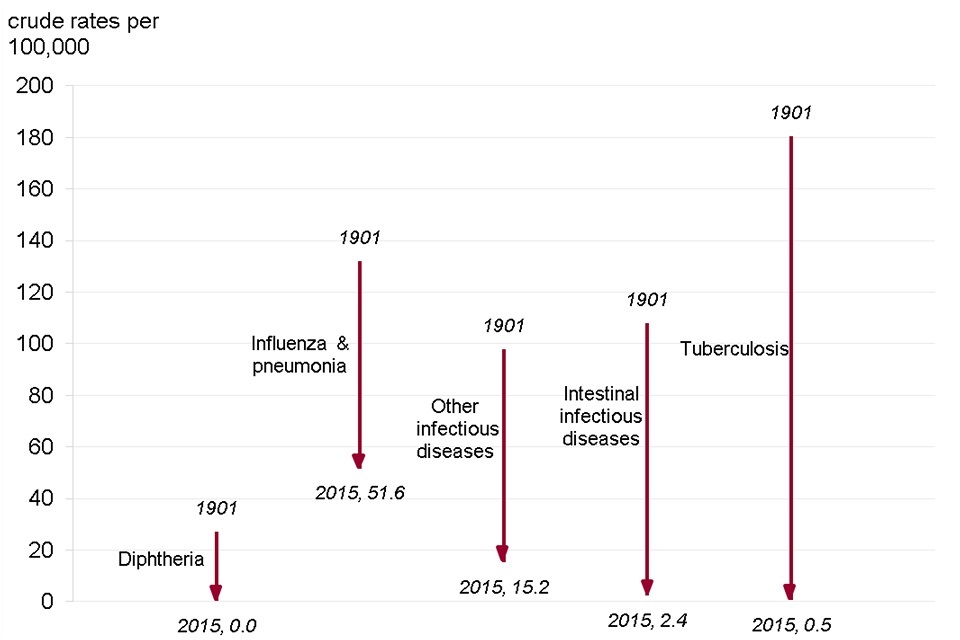
Figure 6. Mortality from traditional notifiable infectious diseases, rates per 100,000. England and Wales, 1901 vs. 2015 [Source: ONS, The 20th century mortality files]
This shows:
- comparisons of death rates over long periods of time are complex due to disease coding changes and the identification of new diseases
- influenza and pneumonia is the most common infectious disease to cause death in 2015. However, the death rate from influenza and pneumonia has fallen from around 132 per 100,000 in 1901 to 51.6 per 100,000 in 2015
- Diphtheria became rare in England following the introduction of mass immunisation in 1942 and the mortality rate fell from around 27 per 100,000 in 1901 to zero in 2015
See the full data source: ONS 20th century mortality ONS 21st century mortality
The magnitude of global animal trade, and more frequent human intrusion into natural ecosystems, has intensified the risk of infectious diseases in humans arising from animals. An increase in travel has made it easier for new infections to be spread widely before detection and containment measures can be developed. This combined with warmer, wetter conditions expected with climate change will allow some diseases to extend their global range. Several vector-borne diseases (such as diseases spread by insects and ticks) have emerged and expanded in Europe in recent years [footnote 3].
Tuberculosis (TB) is a notifiable disease in the UK and although it has re-emerged with additional challenges, such as strains resistant to antibiotics, there was a 32.7% decline in incidence between 2011 and 2015 (figure 7). This sustained decline in the number of new cases of TB in England has been driven by migration changes and a new national TB strategy [footnote 28].
The incidence of TB in England, however, remains higher than most other Western European countries [footnote 29]. Globally the rate of decline in new TB cases was 1.5% between 2014 and 2015 [footnote 30].
Despite the recent fall in new TB cases, there are still significant inequalities associated with the disease. In 2015, 12% of all TB cases in England had at least one social risk factor (homelessness, drug or alcohol misuse or imprisonment); this was an increase on 2014 levels. These cases were twice as likely to have infectious pulmonary TB and twice as likely to die of TB. They also had poorer treatment outcomes and were more likely to have drug resistant TB [footnote 31].
5.2 Figure 7: tuberculosis case notifications and rates, England 2000 to 2015
The incidence of TB in England has fallen since 2011
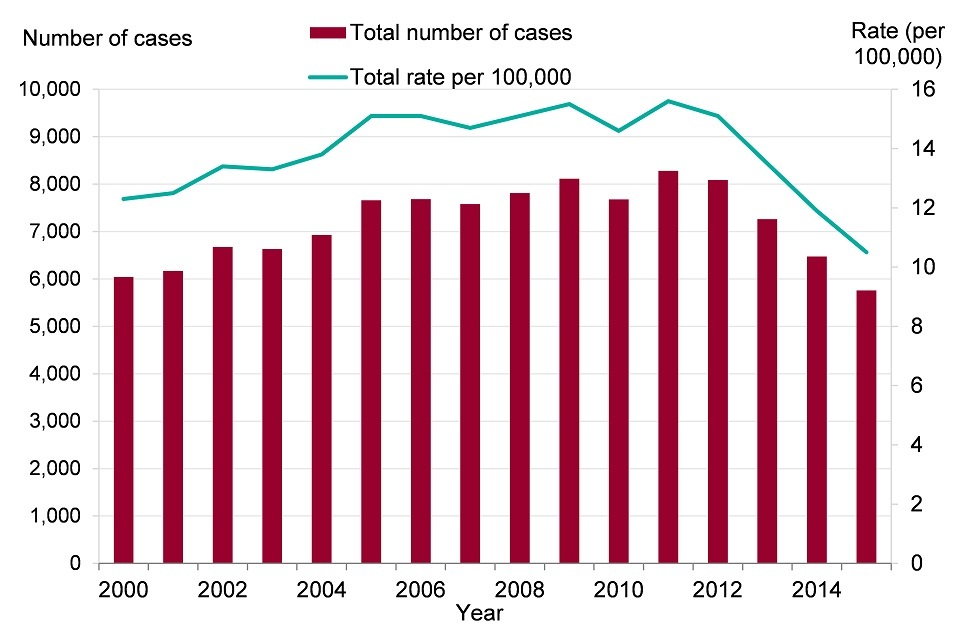
Figure 7. Tuberculosis case notifications and rates, England 2000 to 2015 [Source: Tuberculosis in England 2016]
This shows:
- there has been a year-on-year decline in the incidence of TB in England since 2011
- in 2015 the rate of TB fell to 10.5 per 100,000 (5,758 cases), a reduction of one-third since the peak of 15.6 per 100,000 (8,280 cases) in 2011
See the full data source: See how your area compares:
Other recent, well known examples of emerging infectious diseases include Ebola, Zika and pandemic influenza.
6. Pandemic influenza
Pandemics are defined as epidemics of infection occurring worldwide, or over a very wide area, crossing international boundaries and usually affecting a large proportion of the population [footnote 32]. Influenza pandemics are naturally occurring phenomena that have occurred regularly over the centuries (figure 8).
In the past century, the 1918 H1N1 pandemic was the most severe, accounting for around 200,000 excess deaths in England and Wales [footnote 33]. The 2009 swine flu pandemic was also caused by an H1N1 virus but genetic analysis shows the 2009 H1N1 virus did not have any of the markers of the 1918 virus that was associated with increased risk of severe disease [footnote 34]. This pandemic in 2009 was a mild one with less than a thousand deaths in the UK.
The 3 significant pandemics of the 20th Century (1918 to 1919, 1957, 1968 to 1970) however presented real and daunting challenges to the health, social and economic wellbeing of England with 25 to 35% of the population being ill and between 0.1 and 0.5% of the population dying from the pandemic [footnote 33].
The mild 2009 pandemic does not change the probability of a further pandemic in the near future. The likelihood of a significant pandemic influenza occurring is estimated to be around 3% per year. As has been described, the social and economic impact as well as morbidity and mortality of a significant pandemic would be high.
Each pandemic is different and planning is based on being able to deal with a range of events up to the ‘reasonable worst case’ in which 50% of the population might be ill and over 1% of the population might die. Most pandemics are expected to be less severe than the reasonable worst case – but more severe pandemics are possible if improbable [footnote 35].
6.1 Figure 8: influenza pandemics in England over the past century
There have been 4 flu pandemics in England over the past century
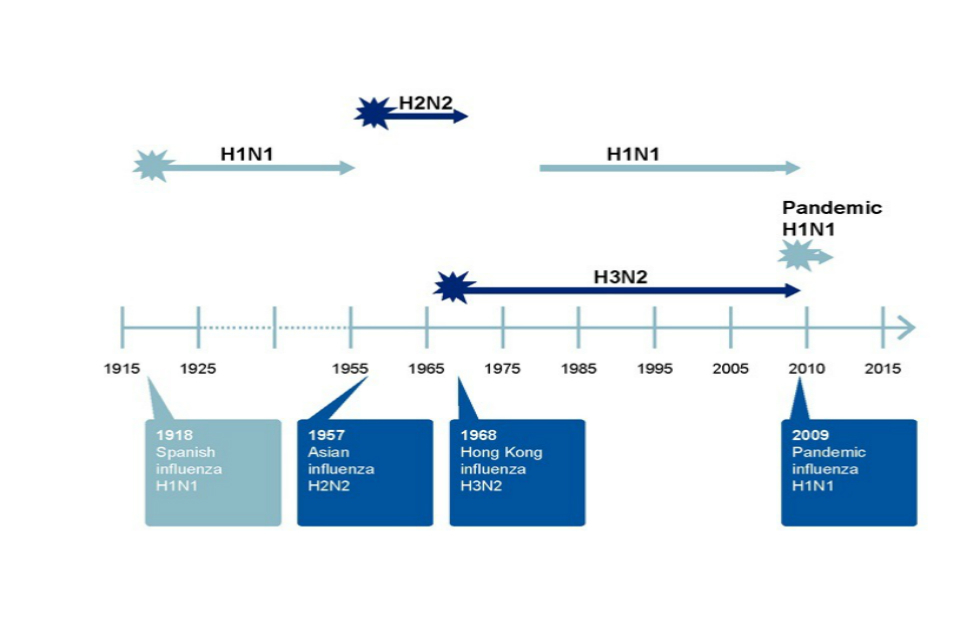
Figure 8. Change to a chart of excess deaths from flu and the timeline
This shows:
- there were 3 influenza pandemics in the 20th century and the most recent one, swine flu, occurred in 2009
- the overall clinical attack rate (the proportion of people who develop symptoms in an influenza outbreak) of the 2009 outbreak has been reported at around 7%, although half of all infections may have been asymptomatic, making the true figure difficult to estimate precisely; Overall rates of mortality were variable but low, with reports of case fatality ratios of less than 0.05%
- the most severe flu pandemic, the 1918 Spanish flu caused around 200,000 excess deaths in England and Wales; The clinical attack rate was 25% and the case fatality ratio was 2.5%
- the 1957 ‘Asian Flu’ pandemic had a clinical attack rate of 30% and a case fatality ratio of 0.2%
- the 1968 to 1970 ‘Hong Kong’ influenza had a clinical attack rate of over 35% and a case fatality rate of 0.4%
- there are other impacts of significant influenza pandemics such as social and economic costs as well as significant threats to maintaining essential services
See the full data source: Adapted from European Centre for Disease Prevention and Control (ECDC) 2009 and Scientific Summary of Pandemic Influenza and its Mitigation, Department of Health 2011
7. Antimicrobial resistance and bloodstream infections
Antimicrobial resistance (AMR) occurs when microorganisms cease to be affected by treatments such as antibiotics. AMR is a naturally occurring phenomenon but also has many drivers including prescribing of antibiotics to humans and animals, low uptake of vaccination and poor sewage and waste disposal mechanisms [footnote 36].
Between 1940 and 1970 much of the rapid decline in mortality from infectious diseases arose due to vaccine uptake, improved sanitation, healthcare delivery and introduction of antibiotics. However more recent trends since the 1990s have shown slight increases in infectious disease mortality rates [footnote 6] partly due to population demographics, increased immunosuppression (such as from medications, treatments and HIV) and more recently the rise of AMR.
Across the EU, it is estimated that 25,000 people die each year from an infection caused by 5 types of bacteria that have developed resistance to antibiotics [footnote 37]. Failure to tackle antibiotic resistance could result globally in 10 million additional deaths each year and an economic cost of £66 trillion by 2050 [footnote 38]. Among all infections reported to PHE, a rising number are resistant [footnote 40].
Antibiotic prescribing can be measured in many ways but the most frequently used measure is the defined daily dose (DDD). This is a standard measure enabling the comparison of drug usage between organisations and countries.
The total consumption of antibiotics, as expressed in DDD per 1,000 inhabitants per day in primary and secondary care declined by 4.5% between 2012 and 2015 [footnote 39] (figure 9). Between 2014 and 2015 there was a reduction in antibiotics prescribed across all healthcare settings, with the exception of other community where there was a small increase. This reduction in prescribing is thought to be largely attributable to financial incentives introduced in the NHS.
7.1 Figure 9: total antibiotic consumption, expressed as defined daily dose (DDD) per 1,000 inhabitants per day, England 2010 to 2015
Rates of antibiotic consumption fell across all healthcare settings between 2014 and 2015
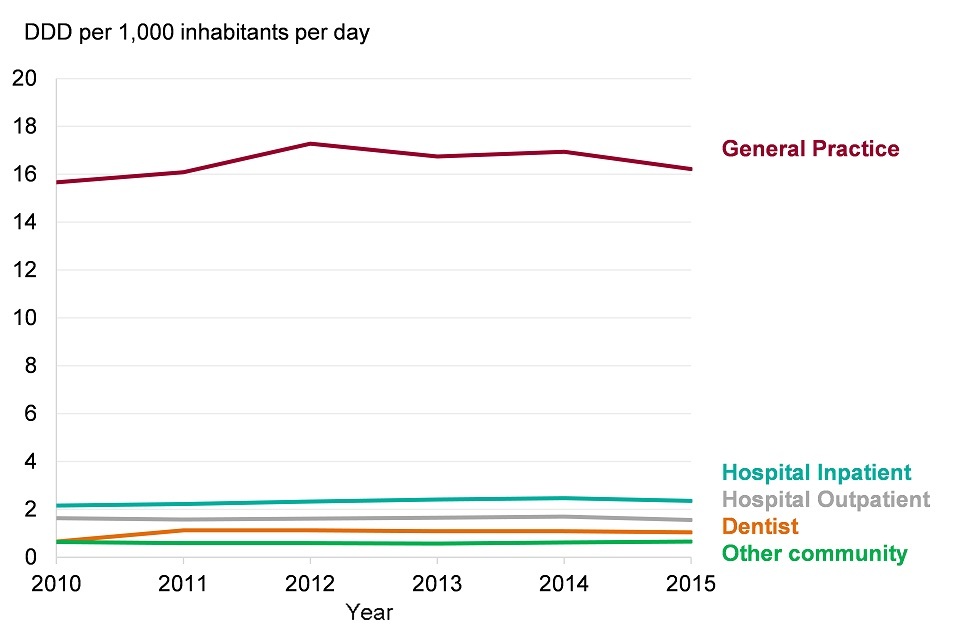
Figure 9. Total antibiotic consumption, expressed as defined daily dose (DDD) per 1,000 inhabitants per day, England 2010 to 2015
This shows:
- there was a fall from 22.8 to 21.8 DDD per 1,000 inhabitants per day between 2014 and 2015 for total consumption of antibiotics
- the consumption of antibiotics, as expressed in defined daily dose (DDD) per 1,000 inhabitants per day, in general practice, hospital inpatients and outpatients combined declined by 4.3% from 2014 to 2015
- general practice (GP) was the largest prescribing setting and consumption decreased from 17.3 to 16.2 DDD per 1,000 inhabitants per day (- 6.1%) between 2012 and 2015
See the full data source: ESPAUR Report 2016
While the number of resistant infections has been increasing, the development of new antimicrobials, particularly antibiotics, has been slow, which is why AMR is of particular concern. There have been no new classes of antibiotics discovered since 1987 and only between 1.5% and 3.5% of possible antibiotics developed through research come to market [footnote 40]. Furthermore, any new antibiotic coming to the market will likely be used in patients whom other antibiotics have been deemed to be ineffective, reducing demand and incentive for manufacturers [footnote 38].
Bloodstream infection refers to invasion of bacteria in the bloodstream and can affect multiple organs or even the entire body and is an extremely serious condition, Escherichia coli (E. coli), a type of bacteria that is particularly challenging accounting for 27% of all bloodstream infections making it the most common source of bloodstream infection in England [footnote 41]. In England, the proportion of people with the condition who die within 30 days is 18.2% [footnote 42].
Most strains of E. coli are harmlessly living in our gut, environment and food but others are harmful and can cause severe bloodstream infections. The rate of bloodstream infections caused by E. coli increased by 15.6% between 2010 and 2015 (figure 10). Of further concern are the increasing rates of resistant E. coli bloodstream infections which are more difficult to treat and have higher mortality rates (figure 11).
7.2 Figure 10: crude E. coli bacteraemia rates in England 2012 to 2016
The incidence of bloodstream infections caused by E. coli have increased
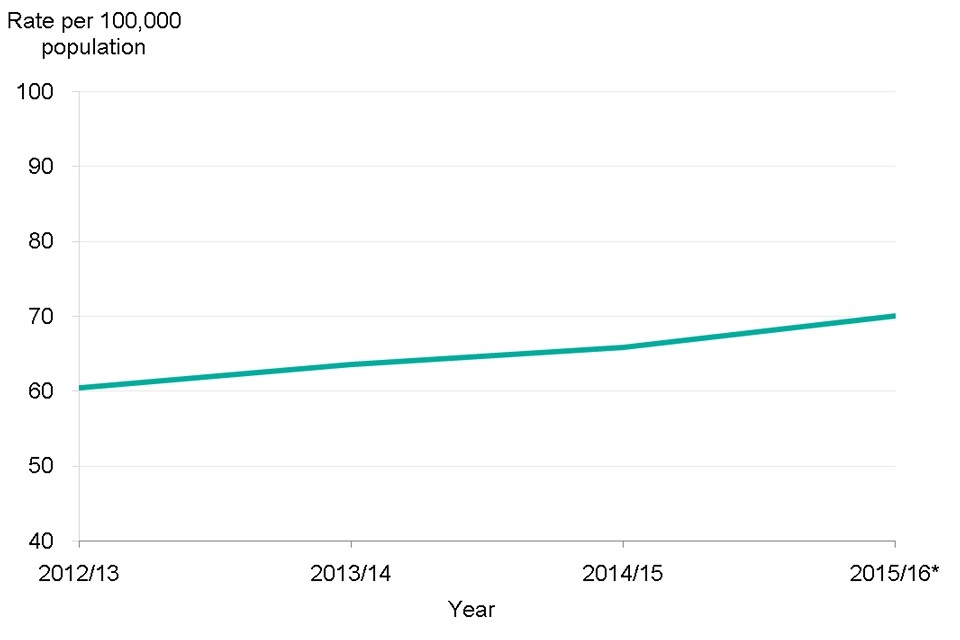
Figure 10. Crude E. coli bacteraemia rates in England 2012 to 2016
This shows:
- rates of E. coli bacteraemia increased from 60.4 per 100,000 in 2012 to 2013 to 70.0 per 100,000 in 2015 to 2016
See the full data source: HCAI Mandatory Surveillance Data
7.3 Figure 11: proportions of bloodstream isolates of E. coli non-susceptible to indicated antibiotics
The proportion of E. coli bloodstream infections demonstrating resistance to some antibiotics has increased
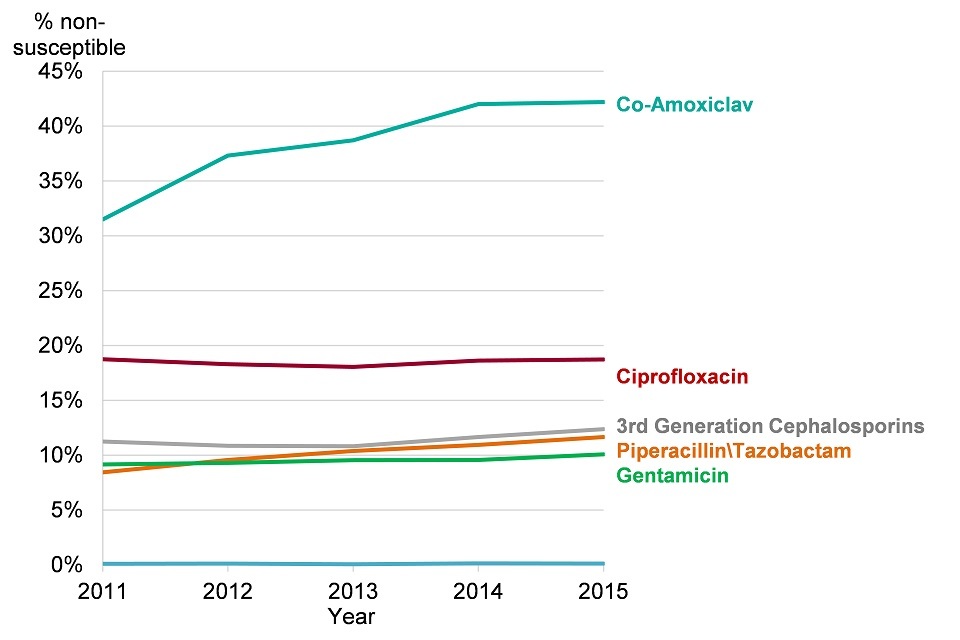
Figure 11. Proportions of bloodstream isolates of E. coli non-susceptible to indicated antibiotics
This shows:
- the proportion of E. coli bloodstream infections demonstrating resistance has remained relatively stable for most classes of antibiotics
- however, resistance to the antibiotics piperacillin/tazobactam and co-amoxiclav increased from 8.5% to 11.7% and 31.5% to 42.2% respectively between 2011 and 2015
See the full data source: ESPAUR Report 2016
8. Further information
We frequently face new threats to our health; they are all significant but there are uncertainties in both timescale and overall impact. One set of emerging public health challenges are those we can recognise, and where we can adapt control measures from the past, such as emerging infectious diseases. There are others where control measures are complex, such as air pollution and climate change, but have the potential of providing multiple health benefits.
Many of the challenges we face cross borders and require a joined-up international effort to tackle them. We must also be mindful about health concerns arising from use of new technologies such as shale gas and the increased exposure to low-level radiofrequency fields from mobile phones, wireless networking and other communication technologies [footnote 43].
Despite the many uncertainties about the type and severity of future public health threats, scientific advances will help to define them. In many cases, there are simple actions which we can take today to mitigate future challenges. For example, adhering to basic infection prevention and control measures will reduce all types of infections and consequently antibiotic use and resistance [footnote 44]. Similarly, adopting more active travel (travel which uses physical activity) will reduce air pollution, noise and carbon emissions as well as reducing the disease burden associated with diabetes, obesity and mental health.
9. References
-
Cabinet Office (2015) National Risk Register of Civil Emergencies. ↩
-
Hales S, Edwards S. & Kovats R. (2003). Climate change and human health - risks and responses. World Health Organisation. ↩
-
Committee on Climate Change (2017). UK Climate Change Risk Assessment 2017. ↩ ↩2
-
PHE, N. E. (October 2015). The Cold Weather Plan for England Protecting health and reducing harm from cold weather. ↩ ↩2
-
ONS (June 2016). Population Estimates for UK, England and Wales, Scotland and Northern Ireland: mid-2015. ↩
-
ONS 2016. Mortality, 2014-based national population projections reference volume. ↩ ↩2
-
Healy J D. (2003) Excess winter mortality in Europe: a cross country analysis identifying key risk factors. Journal of Epidemiology and Community Health 57, 784-789. ↩
-
Fowler T, Southgate R J, Waite T, Harrell R, Kovats S, Bone A, Doyle Y. & Murray V. (2015). Excess Winter Deaths in Europe: a multi-country descriptive analysis. European Journal of Public Health 25, 339-345. ↩
-
Hills J. (2012). Getting the measure of fuel poverty. Final Report of the Fuel Poverty Review. ↩
-
Department of Energy and Climate Change (June 2016). Annual Fuel Poverty Statistics Report, England. ↩
-
PHE, N E. (May 2015a). Heatwave plan for England. ↩
-
Christidis N, Jones G S. & Stott P A. (2015). Dramatically increasing chance of extremely hot summers since the 2003 European heatwave. Nature Clim. Change 5, 46-50. ↩
-
PHE, N E. (May 2015b). Heatwave plan for England. Making the case: the impact of heat on health: now and in the future. ↩ ↩2
-
Hajat S, Vardoulakis S, Heaviside C. & Eggen B. (2014) Climate change effects on human health: projections of temperature-related mortality for the UK during the 2020s, 2050s and 2080s. Journal of Epidemiology and Community Health 68, 641-648. ↩
-
Cancer Research UK (2017) Skin cancer incidence statistics Accessed 16 June 2017. ↩
-
PHE (January 2017). The English National Study for Flooding and Health: First year report. ↩
-
Sayers P B, Horritt M, Penning-Rowsell E. & Mckenzie A. (2015). Climate Change Risk Assessment 2017: Projections of future flood risk in the UK. ↩
-
Kovats R S. & Osborn D. (2016). UK Climate Change Risk Assessment Evidence Report. Chapter 5. People and the Built Environment. ↩
-
WHO (2014). Floods and health. ↩
-
Bell M L. & Davis D L. (2001). Reassessment of the lethal London fog of 1952: novel indicators of acute and chronic consequences of acute exposure to air pollution. Environmental Health Perspectives 109, 389-394. ↩
-
COMEAP (2015) Quantification of mortality and hospital admissions associated with ground-level ozone. ↩
-
Committee On The Medical Effect of Air Pollutants. Long-Term Exposure to Air Pollution: Effect on Mortality. ↩ ↩2
-
Royal College Of Physicians (February 2016) Every breath we take: the lifelong impact of air pollution. ↩ ↩2
-
Macintyre H L, Heaviside C, Neal L S, Agnew P, Thornes J. & Vardoulakis S. (2016). Mortality and emergency hospitalizations associated with atmospheric particulate matter episodes across the UK in Spring 2014. Environment International 97, 108-116. ↩
-
Jones K E, Patel N G, Levy M A, Storeygard A, Balk D, Gittleman J. L. & Daszak P. (2008). Global trends in emerging infectious diseases. Nature 451, 990-993. ↩
-
Taylor L H, Latham S M. & Woolhouse M E. (2001). Risk factors for human disease emergence. Philosophical Transactions of the Royal Society B: Biological Sciences, 356, 983-989. ↩
-
PHE 2015. Collaborative tuberculosis strategy for England: 2015 to 2020. ↩
-
Adam, B. U, Cosford, P, Anderson, S. R. & Abubakar, I. (2017) Sustaining tuberculosis decline in the UK. The Lancet, 389, 1176-1177. ↩
-
WHO (2016). Global tuberculosis report. ↩
-
PHE (2016c) Tuberculosis in England: 2016 annual report. ↩
-
Kelly H. (2011) The classical definition of a pandemic is not elusive. Bulletin of the World Health Organization 89, 539-540. ↩
-
Department Of Health (2011) Scientific Summary of Pandemic Influenza and its Mitigation. ↩ ↩2
-
Neumann, G. & Kawaoka, Y. (2011) The first influenza pandemic of the new millennium. Influenza and Other Respiratory Viruses 5, 157-166. ↩
-
SPI-M Subgroup (2013.) Scientific Pandemic Influenza Advisory Committee (SPI-M): Subgroup on Modelling. ↩
-
HM Government (2013). Joint report on human and animal antibiotic use, sales and resistance, 2013. ↩
-
European Centre For Disease Control, E. M. A. (2009). The bacterial challenge: time to react. ↩
-
Jim O’Neill (2014). Antimicrobial Resistance: Tackling a crisis for the health and wealth of nations. ↩ ↩2
-
Lewis K. (2013) Platforms for antibiotic discovery. Nat Rev Drug Discov 12, 371-387. ↩ ↩2
-
PHE (2016a.) English surveillance programme for antimicrobial utilisation and resistance (ESPAUR). ↩
-
PHE (2016b). Polymicrobial bacteraemia and fungaemia in EWNI. ↩
-
Abernethy J K, Johnson A P Guy, R, Hinton N., Sheridan E A & Hope R J (2015). Thirty day all-cause mortality in patients with Escherichia coli bacteraemia in England. Clinical Microbiology and Infection, 21, 251.e1-251.e8. ↩
-
PHE (2013). Review of the Potential Public Health Impacts of Exposures to Chemical and Radioactive Pollutants as a Result of Shale Gas Extraction. ↩
-
O’Neill J. (2016). Infection prevention, control and surveillance: limiting the development and spread of drug resistance. ↩