Health Assessment Channels Trial
Published 15 September 2026

© Crown copyright 2026
This publication is licensed under the terms of the Open Government Licence v3.0 except where otherwise stated. To view this licence, visit nationalarchives.gov.uk/doc/open-government-licence/version/3 or write to the Information Policy Team, The National Archives, Kew, London TW9 4DU, or email: psi@nationalarchives.gov.uk.
Where we have identified any third party copyright information you will need to obtain permission from the copyright holders concerned.
This publication is available at https://www.gov.uk/government/publications/health-assessment-channels-trial-2022-to-2023/health-assessment-channels-trial
The Department for Work and Pensions (DWP) ad hoc research report no. 142.
A report of research conducted by DWP.
Crown copyright 2026.
You may re-use this information (not including logos) free of charge in any format or medium, under the terms of the Open Government Licence.
To view this licence, visit Open Government Licence
or write to:
The Information Policy Team,
The National Archives,
Kew,
London
TW9 4DU
or email: psi@nationalarchives.gov.uk.
If you would like to know more about DWP research, email socialresearch@dwp.gov.uk.
First published September 2026.
ISBN 978-1-80786-047-9.
Lead author: Manveer Gill, Data Analyst at DWP.
Views expressed in this report are not necessarily those of DWP or any other government department.
1. Executive summary
The multi-channel delivery of health assessments was developed following the introduction of telephone and video assessments in light of the COVID-19 pandemic. These were designed to enable assessments that had been briefly paused to resume by telephone and video where face-to-face was for a time not possible.
In 2022 DWP conducted the Health Assessment Channels Trial (HACT), a counterfactual evaluation to determine whether remote assessment channels such as telephone (TA) and video assessments (VA) result in different award outcomes compared to face-to-face assessments (F2F). Claimants were automatically allocated to assessment channels in a way that was random, or sufficiently close to random, to support causal comparison of outcomes across channels. This report explains the design used for the trial and presents findings from the trial.
The findings presented in this report are based on analysis of over 350,000 trial eligible assessments with an outcome identified from a Personal Independence Payment (PIP) assessment and the Work Capability Assessment (WCA).
1.1. Executive findings
The trial did not identify award outcomes that were substantially different between F2F and remote channels, or that a particular channel had an impact on Annually Managed Expenditure (AME – basically benefit payments) that was materially different to any other channel, across both PIP and the WCA, which is used to determine entitlement to Universal Credit (UC) health element and Employment and Support Allowance (ESA).
Trial findings include outcomes from Mandatory Reconsiderations (MRs) and appeals. The main findings are as follows:
Award outcomes:
-
The proportion of claimants awarded the health element (Limited Capability for Work and Work-Related Activity (LCWRA) / Support Group) and/or PIP after being allocated a F2F assessment did not differ considerably from the proportion awarded after being allocated a remote channel.
-
50% of claimants were awarded PIP when allocated a F2F assessment, whilst 50% and 49% of claimants were awarded PIP when allocated a VA and TA, respectively.
-
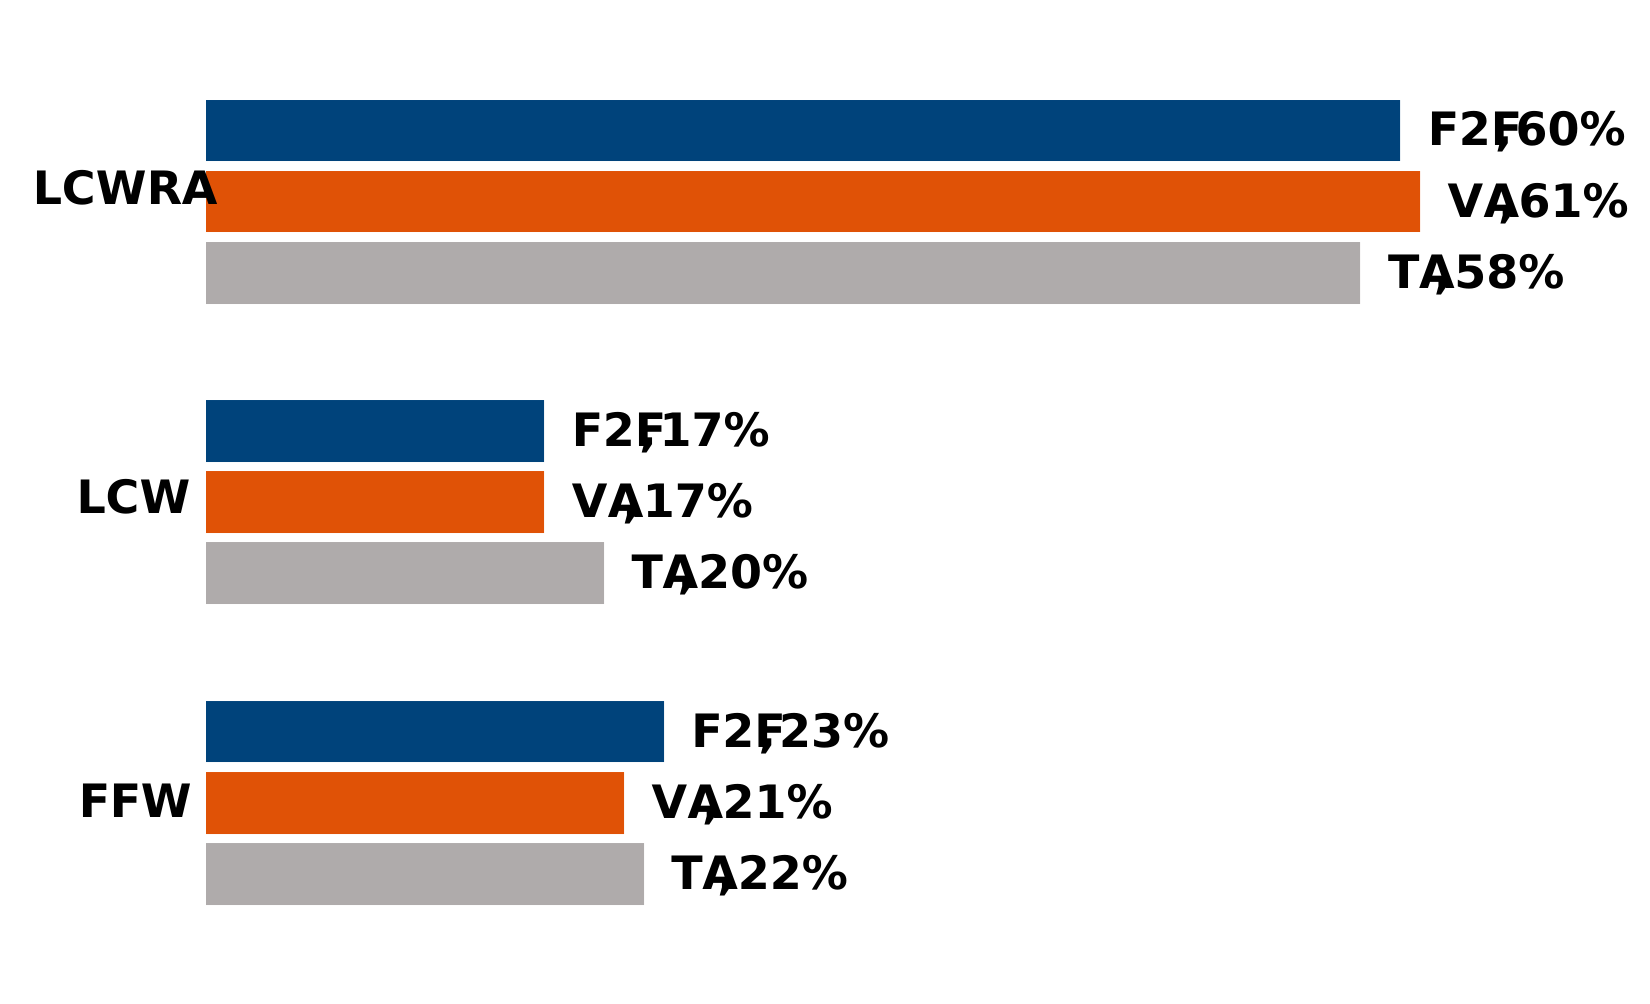
60% of claimants undergoing a WCA were awarded LCWRA when allocated a F2F assessment, whilst 61% and 58% were awarded LCWRA when allocated a VA and TA, respectively.
-
Channel change was associated with a small difference in award outcomes and values for HACT PIP assessments, but the effect was relatively small.
-
Claimants that changed channel tended to receive a higher award on average, compared to those that stayed in their originally allocated channel.
Claimant experience – qualitative research:
-
PIP claimants were more likely than UC and ESA claimants to express uncertainty about all the channels. This suggests that PIP claimants may need additional support or reassurance through the assessment process.
-
Claimants were more likely to agree a channel was suitable after experiencing it.
-
Awareness of the ability to change channel amongst trial participants was low. However, when asked in the survey if they would like a choice of which channel their assessment is conducted by in the future, nearly 9 in 10 said that they would.
-
This report concentrates on the quantitative findings of the trial. The published qualitative research can be found here: Health Assessment Channels Research - GOV.UK.
Across both PIP assessments and the WCA, the equality analysis shows small but statistically significant differences in the age, gender and condition profiles of claimants assessed via F2F and remote channels, consistent with modest variation in case mix rather than evidence of material or systemic differences between channels.
1.2. Design and methodology
The trial was conducted between May 2022 and January 2023. It adopted a non-inferiority design to examine whether telephone and video assessments were not significantly worse than face-to-face assessments in terms of outcomes and award values.
This design was adopted following consultation with experts on the cross-government trials advice panel given the aim was not being able to find a channel which is superior in outcomes, but to establish whether there were broadly the same outcomes from the different channels. This is important for health assessment policy as individuals should gain the same assessment outcome regardless of the way in which they are assessed.
Claimants were automatically allocated to an assessment channel in a way that was random, or sufficiently close to random to ensure a like-for-like comparison between channels. Otherwise, it is probable that allocated channel would reflect differences in claimant characteristics, especially health conditions, with the potential for there to be an underlying difference in outcomes by channel as a result.
To be eligible for inclusion in the trial, claimants had to meet all 3 of the following criteria:
-
only an individual’s initial assessment was included, they were not existing health and disability benefit recipients
-
claimants had to be able to use all 3 channels rather than routed to one or another due to stated condition
-
providers could auto-allocate the claimant to any of the 3 channels
Claimants were excluded from the trial on one of the following bases:
-
where initial triage by assessment providers highlighted claimant vulnerabilities and not all channels were deemed suitable
-
where assessment channels were manually allocated, which may have been done to speed up processing times in some geographic areas
If a claimant wished to be assessed using a different channel, they were able to do so. All claimants involved in the trial were made aware, when they were notified of their appointment, that they were able to choose an alternative channel.
Outcomes were analysed by the channel to which claimants were originally allocated (Intention to Treat, ITT) and by the channel by which they attended (Per Protocol, PP). The difference between the 2 groups was given by those who opted to change channel.
Standardised Mean Difference (SMD) tests (see HACT Technical Annex, section A) were conducted to check that the automatic provider allocation to the different channels was done in a way that did not introduce population bias in observable characteristics among the claimants eligible for the trial.
The evaluation was multi-stranded, combining:
-
Healthcare Provider (HP) referrals and bookings data
-
administrative data from the DWP internal systems comprising claimant assessment history, characteristics, and benefit outcomes
-
quantitative and qualitative survey research to explore claimant experiences
Acknowledgements
The Health Assessment Channels Trial was conducted by DWP.
The authors would like to thank everyone who gave their time to participate in this trial and the supporting research.
We extend thanks to the analysis and project teams that were established to support this trial. Special thanks are given to Deborah Grayson and the late Tina Jackson for heading up their respective teams on HACT.
Glossary
| Term | Meaning |
|---|---|
| Allocated channel | The assessment channel a claimant was originally assigned to (face‑to‑face, telephone, or video) at the point their assessment was scheduled |
| AME | Expenditure that is demand‑led and funded annually by HM Treasury, including benefit payments such as Personal Independence Payment and Universal Credit health‑related elements |
| Appeal | A formal challenge to a benefit decision, heard by an independent tribunal |
| Assessment channel | The method by which a health assessment is carried out. In this trial, channels included face‑to‑face (F2F), telephone (TA), and video (VA) |
| Capable to Work (CTW) | A Work Capability Assessment outcome indicating that a claimant is considered able to work and is not entitled to health‑related benefit elements. Referred to as Fit for Work (FFW) in Employment and Support Allowance |
| Counterfactual evaluation | An evaluation approach that estimates what would have happened in the absence of an intervention |
| Employment and Support Allowance (ESA) | A benefit for people whose ability to work is limited by a health condition or disability |
| Face‑to‑face assessment (F2F) | A health assessment conducted in person at an assessment centre |
| HACT | A trial conducted by the Department for Work and Pensions between May 2022 and January 2023 to assess whether different assessment channels result in different award outcomes |
| Healthcare Professional (HCP) | A qualified professional employed by an assessment provider who conducts health assessments and provides recommendations to DWP Decision Makers |
| Intention to Treat (ITT) | An analytical approach where outcomes are analysed according to the channel a claimant was originally allocated to, regardless of the channel they attended. This approach preserves the comparability created by the allocation process |
| Limited Capability for Work (LCW) | A Work Capability Assessment outcome indicating that a claimant is not currently required to look for work, whilst on Universal Credit, but may be expected to undertake work‑related activity. Referred to as the Work‑Related Activity Group (WRAG) in Employment and Support Allowance |
| Limited Capability for Work and Work‑Related Activity (LCWRA) | A Work Capability Assessment outcome indicating that a claimant is not required to work or undertake work‑related activity due to their health condition, whilst on Universal Credit. Referred to as the Support Group in Employment and Support Allowance |
| Mandatory Reconsideration (MR) | A process in which DWP reviews a benefit decision after the claimant asks for it to be reconsidered |
| Non‑inferiority design | A trial design used to assess whether an alternative approach is not meaningfully worse than the existing approach |
| Per Protocol (PP) | An analytical approach where outcomes are analysed based on the channel the claimant attended |
| Personal Independence Payment (PIP) | A benefit that helps with the extra costs of long‑term health conditions or disabilities, based on how a condition affects daily living and mobility |
| Primary condition | The main health condition recorded at the PIP assessment. Whereas for Work Capability Assessments analysis is based on the first recorded condition on DWP systems (rather than primary condition) |
| Prognosis period | A review period set by the Healthcare Professional indicating a date at which it might be beneficial to reassess the claimant |
| Random (or as‑good‑as‑random) allocation | An allocation process that produces broadly comparable groups across assessment channels |
| Selection effects | Differences in outcomes that arise because individuals who select or move into a particular group differ from those who do not |
| Standardised Mean Difference (SMD) | A statistical measure used to assess whether claimant characteristics are balanced across groups |
| Telephone assessment (TA) | A health assessment conducted by telephone |
| Universal Credit (UC) | A means-tested benefit payment designed to help with living costs for people of working age who are on a low income, out of work, or unable to work |
| Video assessment (VA) | A health assessment conducted via video call |
| Work Capability Assessment | An assessment used to determine entitlement to health‑related elements of Universal Credit and Employment and Support Allowance |
2. Background and methodology
2.1. Background
PIP and WCA policy context
PIP provides a contribution towards the extra costs that may arise from a long-term disability or health condition. PIP is tax free and is not means tested.
Entitlement to PIP focuses on the functional impacts of a person’s health condition or disability on their daily life, and is assessed based on needs arising and not on the condition itself.
Individuals can choose how to use the benefit, in the light of their individual needs and preferences.
PIP can also be paid in addition to any other financial or practical support someone may be entitled to such as Universal Credit, Employment and Support Allowance, NHS services, free prescriptions, help with travel costs to appointments. It can also act as a passport to additional support such as premiums and additional amounts paid within certain benefits, Carer’s Allowance for an informal carer or the Blue Badge scheme.
The WCA determines eligibility for the additional health-related amount of UC. It assesses whether an individual has LCW and, if they do, whether they also have LCWRA. It was designed to ensure that people receive appropriate financial and work-related support.
The primary difference between a PIP assessment and a WCA is their focus: PIP assesses how a condition affects daily life and mobility, whereas the WCA evaluates if a condition restricts your ability to work. While both involve healthcare professionals and similar paperwork, they are separate processes with distinct criteria and outcomes.
The HACT
Before the COVID-19 pandemic, in 2019, over three-quarters of WCAs and PIP assessments were conducted face-to-face, with the remainder being those where a decision could be made solely on reviewing paper-based evidence. During the COVID-19 pandemic, it was necessary to move away from face-to-face assessments to assessments largely conducted over the telephone as a public health response. An option for video assessments was added subsequently. Where the level of information provided means it is possible to determine the outcome through a paper-based assessment, this practice has remained.
The HACT aimed to evaluate how well telephone and video assessments were working compared to face-to-face assessments. The trial compares award outcomes across channels for people who have attended an initial PIP assessment or an initial WCA, who were eligible to attend all 3 channels, and whose assessment was automatically allocated to one of those channels. Paper-based assessments were not affected.
The trial and research have developed the evidence base on the use of different channels to inform wider implementation, identify impacts by protected characteristics where possible, assess value for money, and determine next steps.
The trial findings reflect the period during which the HACT was conducted between May 2022 and January 2023. This was considered sufficient time since the pandemic to ensure assessment providers had bedded in the new channels, that Healthcare Professionals (HCPs) were familiar in using them, and the time taken to process claims had returned to close to their normal levels. Whilst the HACT findings provide robust evidence for the period in which the trial was conducted, they may not fully reflect more recent operational processes, claimant behaviours, and characteristics. Since early 2023, wider system changes, shifts in claimant health needs, labour market conditions, and post-pandemic stabilisation may have altered assessment demand and delivery patterns. As a result, the conditions underpinning the original HACT evidence may differ from those influencing the current assessment environment, meaning the findings should be interpreted with this context in mind.
2.2. Trial methodology
The trial adopted a non-inferiority design to examine whether telephone and video assessments were not significantly worse than face-to-face assessments. That is to say, whether remote assessments work just as well as face-to-face assessments and whether there is any difference in the outcomes and benefit amounts claimants receive.
To assess whether outcomes differed by assessment channel, it was necessary that claimants allocated to different channels were broadly comparable. In practice, allocation was based on the next available appointment, which resulted in groups that were balanced across observable characteristics.
There are many possible ways to ensure random assignment, such as allocation using a randomisation tool. To determine whether the existing allocation mechanisms used by the health assessment providers were unbiased, a sample of assessments were evaluated. These tests demonstrated that the existing processes did not introduce observable bias and that no changes to operational delivery were required for the trial (see HACT Technical Annex, section A).
To be eligible for inclusion in the trial, claimants had to meet all 3 of the following criteria:
-
only an individual’s initial assessment was included, they were not existing health and disability benefit recipients
-
claimants had to be able to use all 3 channels rather than routed to one or another due to stated condition
-
providers could auto-allocate the claimant to any of the 3 channels
Safeguards were built into the trial design to ensure that it could be delivered safely, ethically and in a way that produced robust and interpretable evidence. Key critical success factors for the HACT included: ensuring claimants were only included where all 3 assessment channels were deemed suitable following provider risk triage; maintaining the ability for claimants to request a different channel where appropriate; and ensuring that no claimant was assessed in a channel that was clinically or operationally unsuitable.
Outcomes were analysed by the channel to which claimants were originally allocated (ITT) and by the channel by which they attended (PP).
In addition, the analysis tracked claimant outcomes through to MR and appeal stages where applicable, ensuring a comprehensive assessment of decision-making and downstream impacts across the full customer journey. The findings were subject to internal quality assurance and external peer review to validate the analytical approach and interpretation.
The evaluation was multi-stranded, combining:
-
assessment provider referrals and bookings data
-
administrative data from internal DWP systems comprising claimant assessment history, characteristics, and benefit outcomes
-
quantitative and qualitative survey research to explore claimant experiences – which can be found at Health Assessment Channels Research
3. Findings
3.1. Eligibility and allocation
Figure 3.1.1 below shows that between May 2022 and January 2023, when the HACT took place, there were a total of 777,000 referrals (the formal transfer of a claimant’s case from DWP to the Health Assessment Provider).
Of the 777,000 referrals, 690,000 were related to individuals. 81,000 of those individuals had multiple referrals, either due to multiple benefit claims or due to cycling within the system, whereby an individual would need to be re-referred.
Of the 777,000 HACT referrals:
- 57% were PIP referrals and 43% were WCA referrals
- 85% of PIP referrals and 72% of WCA referrals were assessed during this time
- 69% of PIP assessments and 43% of WCAs were classed as trial eligible
- 97% of trial eligible PIP assessments and 96% of trial eligible WCAs had an outcome identified by March 2025. This includes the outcomes of Mandatory Reconsiderations and appeals, where applicable
- 67% of PIP trial eligible assessments with an outcome identified were allocated to telephone (TA), 18% to face-to-face (F2F), and 15% to video (VA)
- Around 30% of claimants allocated to a face-to-face PIP assessment and 27% of those allocated to a video assessment attended a different channel. In contrast, very few claimants allocated to a telephone assessment changed channel
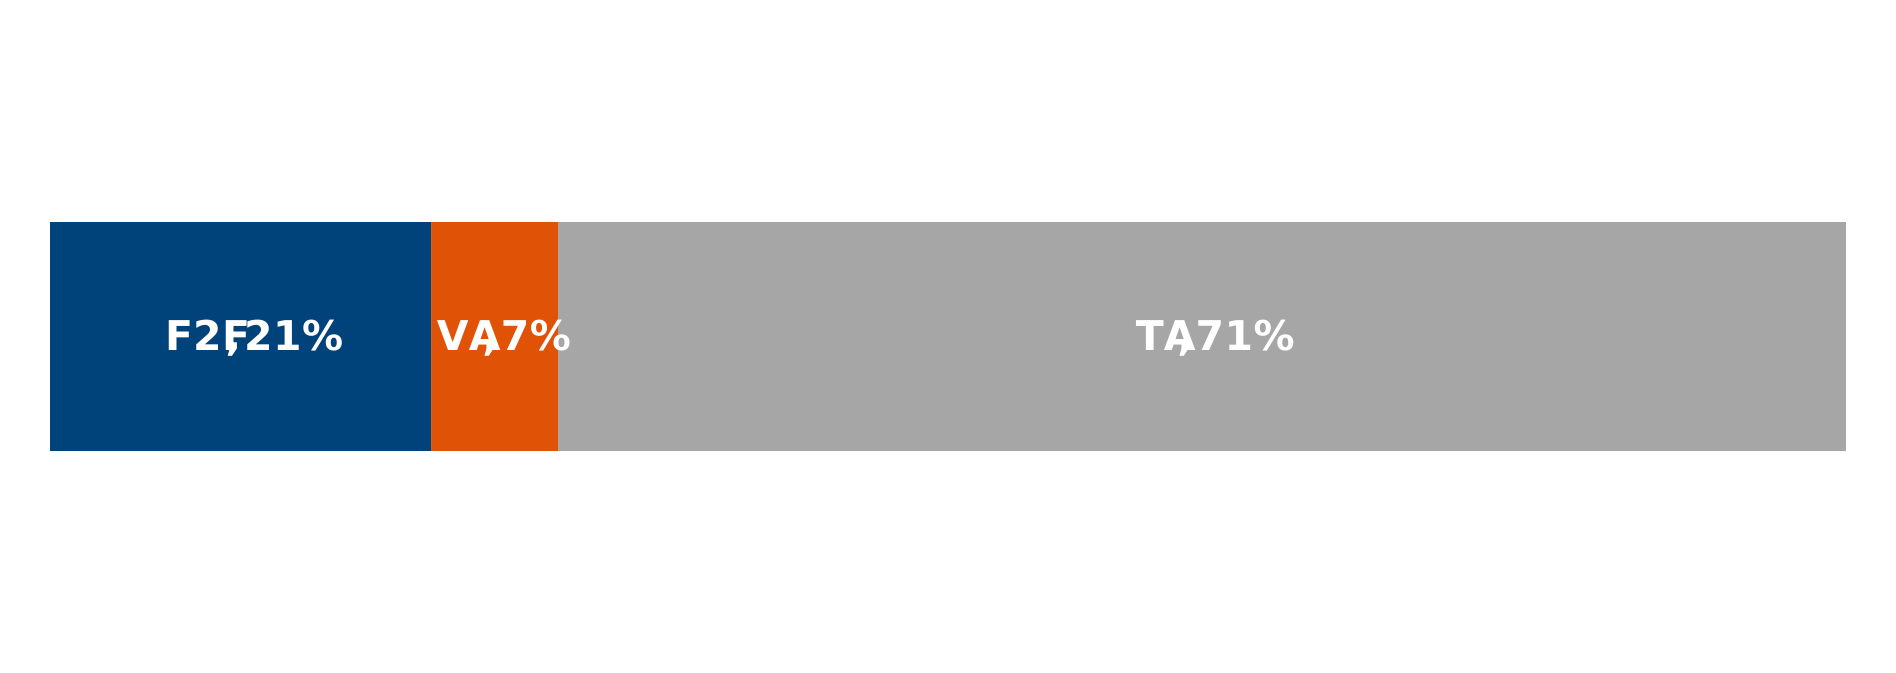
- 71% of trial eligible WCAs with an outcome identified were allocated to telephone, 21% to face-to-face, and 7% to video
- Around 2% of claimants that were allocated to a face-to-face WCA and 1% of claimants allocated to video attended a different channel. Very few claimants allocated to telephone changed channel
Of the assessments conducted during the trial period, over 350,000 PIP assessments and WCAs met the eligibility criteria for inclusion in the HACT analysis and had an outcome identified, forming the analytical sample used throughout this report.
Figure 3.1.1. Tree diagram showing the flow of referrals to assessments per channel for PIP and WCA

N.B. Percentage figures may not sum due to rounding.
Figure 3.1.1 shows a flow chart for 777,483 total Health Assessment Channels Trial referrals. Referrals are split between Personal Independence Payment assessments and the Work Capability Assessment. They are further split between the number of referrals that were assessed, trial eligible, had an outcome identified, by allocated channel, and by claimants that subsequently changed channel.
3.2. Personal Independence Payment findings
Assessments from Scotland and Northern Ireland were excluded from the results due to devolution of powers to the local government, in these regions.
Findings by allocated channel
Across PIP assessments, award rates, award lengths and award values were broadly consistent across face-to-face, video and telephone channels.
Of PIP assessments that were trial eligible and had an outcome identified:
- 18% of PIP assessments were allocated to face-to-face (F2F)
- 15% were allocated to video (VA)
- 67% were allocated to telephone (TA)
- most claimants remained in their allocated channel. Those that changed channel were mostly to a telephone assessment
Figure 3.2.1 PIP assessments by allocated channel
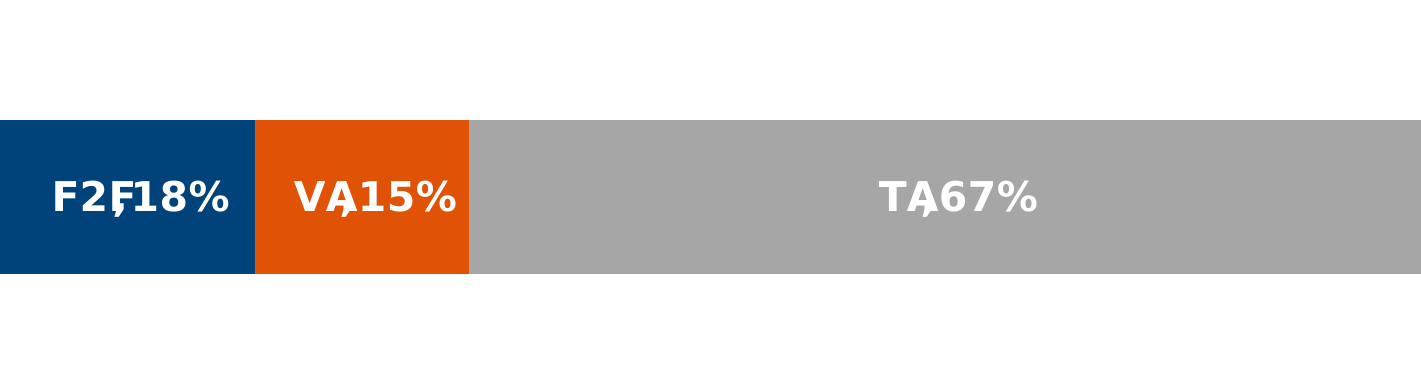
Figure 3.2.1 shows a horizontal stacked bar chart confirming that face-to-face assessments represented 18% of PIP allocated channels, video assessments 15%, and telephone assessments 67%, with telephone making up the majority of the allocation.
Equalities analysis
The tables in this section are presented to examine whether particular claimant groups were disproportionately represented in one channel and to support interpretation of any observed outcome differences for primary condition, gender, and age.
To assess whether there were statistically significant differences between assessment channels, tests of proportions were undertaken comparing F2F assessments with VA and TA.
For each comparison, the null hypothesis was that there was no difference in the proportion observed between channels. Statistical significance was assessed at the 5% level (p ≤ 0.05), with statistically significant differences indicated in the tables.
For PIP assessments, only primary conditions are recorded. Conditions have been mapped to reflect as closely as possible the appropriate International Classification of Diseases version 10[footnote 1]. Medical condition is based on evidence recorded at the PIP assessment; this in itself does not confer entitlement to Personal Independence Payment.
Table 3.2.1 PIP assessment channel allocation by primary condition
| Channel by primary condition | F2F | VA | TA | F2F per cent | VA per cent | TA per cent |
|---|---|---|---|---|---|---|
| Malignant disease¹ ² | 1,307 | 572 | 2,436 | 30.3 | 13.3 | 56.5 |
| Autism¹ ² | 1,283 | 644 | 2,335 | 30.1 | 15.1 | 54.8 |
| Learning disability¹ ² | 256 | 140 | 487 | 29.0 | 15.9 | 55.2 |
| Neurological disease¹ ² | 4,843 | 3,592 | 14,947 | 20.7 | 15.4 | 63.9 |
| Respiratory disease¹ ² | 2,500 | 1,745 | 8,175 | 20.1 | 14.0 | 65.8 |
| Cardiovascular disease¹ ² | 1,778 | 1,405 | 6,354 | 18.6 | 14.7 | 66.6 |
| Attention deficit hyperactivity disorder (ADHD) or Attention deficit disorder (ADD)² | 1,043 | 901 | 3,684 | 18.5 | 16.0 | 65.5 |
| Musculoskeletal disease (general)¹² | 8,179 | 6,550 | 29,944 | 18.3 | 14.7 | 67.0 |
| Musculoskeletal disease (regional)¹ ² | 6,350 | 5,348 | 24,941 | 17.3 | 14.6 | 68.1 |
| Endocrine disease² | 1,095 | 1,067 | 4,513 | 16.4 | 16.0 | 67.6 |
| Gastrointestinal disease² | 1,155 | 1,090 | 5,017 | 15.9 | 15.0 | 69.1 |
| Anxiety and depression¹ ² | 9,377 | 10,158 | 45,851 | 14.3 | 15.5 | 70.1 |
| Psychiatric disorders excluding anxiety and depression¹ ² | 1,309 | 919 | 3,777 | 21.8 | 15.3 | 62.9 |
| Unknown² | 9 | 699 | 3,971 | 0.2 | 14.9 | 84.9 |
| All other categories¹ ² | 3,993 | 3,360 | 14,925 | 17.9 | 15.1 | 67.0 |
| Sample size | 44,477 | 38,190 | 171,357 | No data | No data | No data |
¹VA is statistically significantly different from F2F (p < 0.05).
²TA is statistically significantly different from F2F (p < 0.05).
Table 3.2.1 shows that across all condition categories, TA accounted for the largest share of allocation, reflecting overall trial allocation patterns. However, some variation by condition is observed and in the majority of categories, these are statistically significant.
For example, a higher proportion of allocated F2F assessments was observed for claimants with malignant disease, autism, or learning disabilities, while a higher proportion of allocated telephone assessments were observed for claimants with mental health conditions, particularly anxiety and depression.
Table 3.2.2 PIP assessment channel allocation by gender
| Channel by gender | F2F | VA | TA | F2F per cent | VA per cent | TA per cent |
|---|---|---|---|---|---|---|
| Female¹ ² | 26,043 | 22,897 | 101,984 | 17.3 | 15.2 | 67.6 |
| Male¹ ² | 18,434 | 15,293 | 69,371 | 17.9 | 14.8 | 67.3 |
| Sample size | 44,477 | 38,190 | 171,355 | No data | No data | No data |
¹VA is statistically significantly different from F2F (p < 0.05).
²TA is statistically significantly different from F2F (p < 0.05).
Table 3.2.2 shows that for both females and males, TA accounted for around two-thirds of allocated channels. Small differences were observed in the proportion of F2F and VA by gender, and the differences were statistically significant due to the large sample size. However, the absolute differences are small.
Table 3.2.3 PIP assessment channel allocation by age group
| Channel by age | F2F | VA | TA | F2F per cent | VA per cent | TA per cent |
|---|---|---|---|---|---|---|
| 16 to 19¹ ² | 1,602 | 1,276 | 5,441 | 19.3 | 15.3 | 65.4 |
| 20 to 24² | 2,833 | 2,525 | 11,336 | 17.0 | 15.1 | 67.9 |
| 25 to 29² | 3,202 | 3,239 | 14,099 | 15.6 | 15.8 | 68.6 |
| 30 to 34² | 4,104 | 3,797 | 17,233 | 16.3 | 15.1 | 68.6 |
| 35 to 39² | 4,026 | 3,896 | 17,451 | 15.9 | 15.4 | 68.8 |
| 40 to 44² | 4,140 | 3,829 | 17,268 | 16.4 | 15.2 | 68.4 |
| 45 to 49¹ ² | 4,331 | 3,724 | 16,658 | 17.5 | 15.1 | 67.4 |
| 50 to 54¹ ² | 5,581 | 4,590 | 20,746 | 18.1 | 14.8 | 67.1 |
| 55 to 59¹ ² | 6,395 | 5,074 | 22,782 | 18.7 | 14.8 | 66.5 |
| 60 to 64¹ ² | 6,858 | 5,178 | 23,451 | 19.3 | 14.6 | 66.1 |
| 65 to 69¹ ² | 1,402 | 1,062 | 4,886 | 19.1 | 14.4 | 66.5 |
| Sample size | 44,477 | 38,190 | 171,355 | No data | No data | No data |
¹ VA is statistically significantly different from F2F (p < 0.05).
² TA is statistically significantly different from F2F (p < 0.05).
Table 3.2.3 shows that channel mix was broadly consistent across age groups. TA accounted for around two‑thirds of allocated channels in all age groups. A slightly higher proportion of F2F was observed among older claimants, compared to younger claimants. Differences between remote channels (VA and TA) and F2F were statistically significant; however, this is partly driven by the large sample size, and the absolute differences in proportions across age groups are small.
It is important to note that whilst many of these differences are statistically significant, some are small in magnitude. These tests are intended to support interpretation of observed differences and do not provide evidence of superiority, appropriateness, or effectiveness of any one channel over another.
Award rates and average weekly awards
Award rates (adjusted for MRs and appeals, where applicable) were consistent across all channels. TA had a slightly lower award rate and average monetary award than F2F. While this difference was statistically significant (see HACT Technical Annex, section B), the effect size was very small, indicating that the difference is marginal.
Almost all (97%) of PIP trial eligible assessments had an outcome (254,000).
- 18% were allocated to F2F, of which half were given an award for PIP. The remaining 50% were disallowed decisions. PIP claimants allocated to F2F received an average weekly award of £52.11 when including disallowed awards.
- 15% were allocated to VA, of which half were given an award for PIP. The remaining 50% were disallowed decisions. PIP claimants allocated to VA received an average weekly award of £51.38 when including disallowed awards.
- 67% were allocated to TA, of which slightly fewer than half were given an award for PIP. The remaining 51% were disallowed decisions. PIP claimants allocated to TA received an average weekly award of £50.75 when including disallowed awards.
PIP claimants who were allocated a remote assessment received a slightly lower monetary award than those who were allocated a F2F assessment.
Figure 3.2.2 PIP assessment outcomes by allocated channel
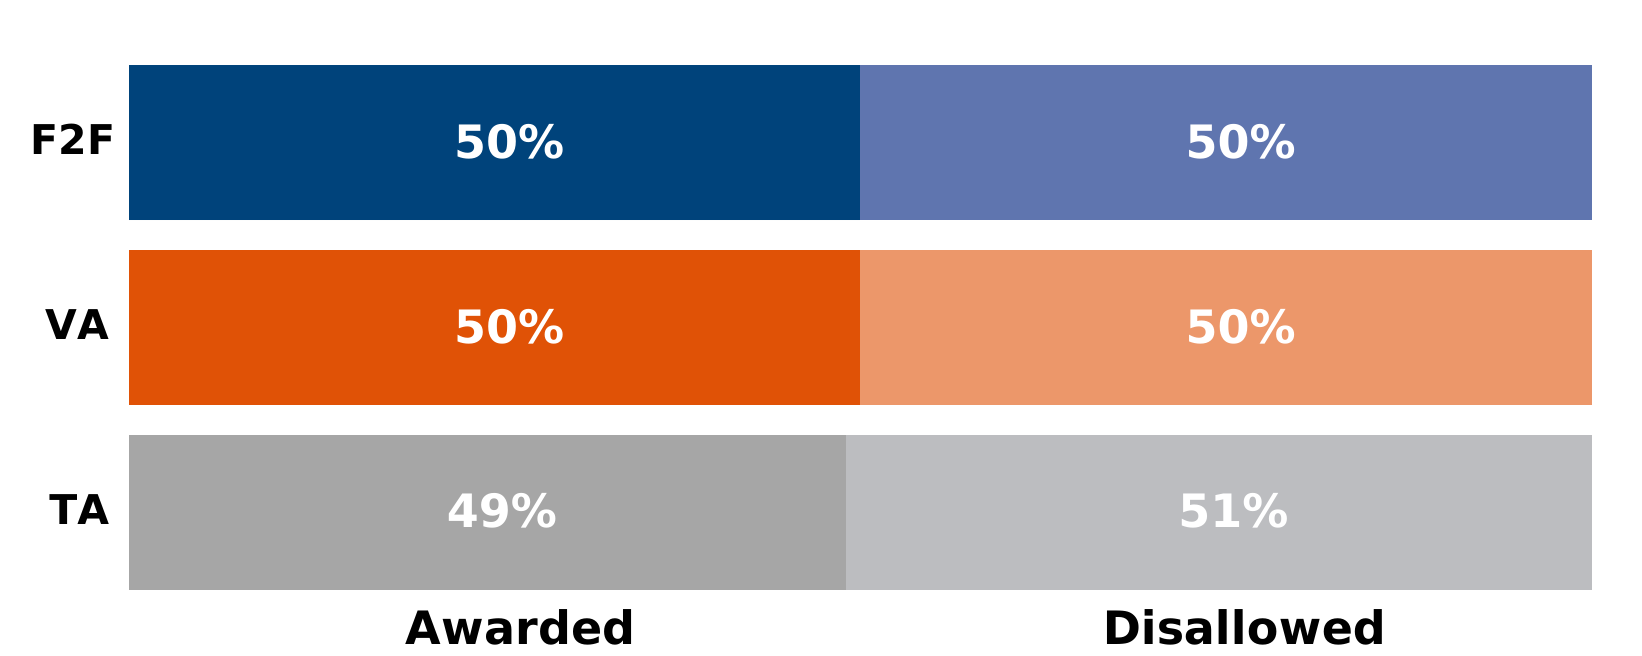
Figure 3.2.2 shows 3 horizontal stacked bar charts, one for face-to-face showing outcomes were equally split between awarded and disallowed, one for video assessments showing outcomes were equally split between awarded and disallowed and one for telephone assessments showing awarded outcomes were slightly lower than disallowed outcomes.
Figure 3.2.3 PIP assessment award rates by allocated channel and primary condition
¹ Indicates the comparison between F2F and TA is statistically significant at (or below) the .05 level.
² Indicates the comparison between F2F and VA is statistically significant at (or below) the .05 level.
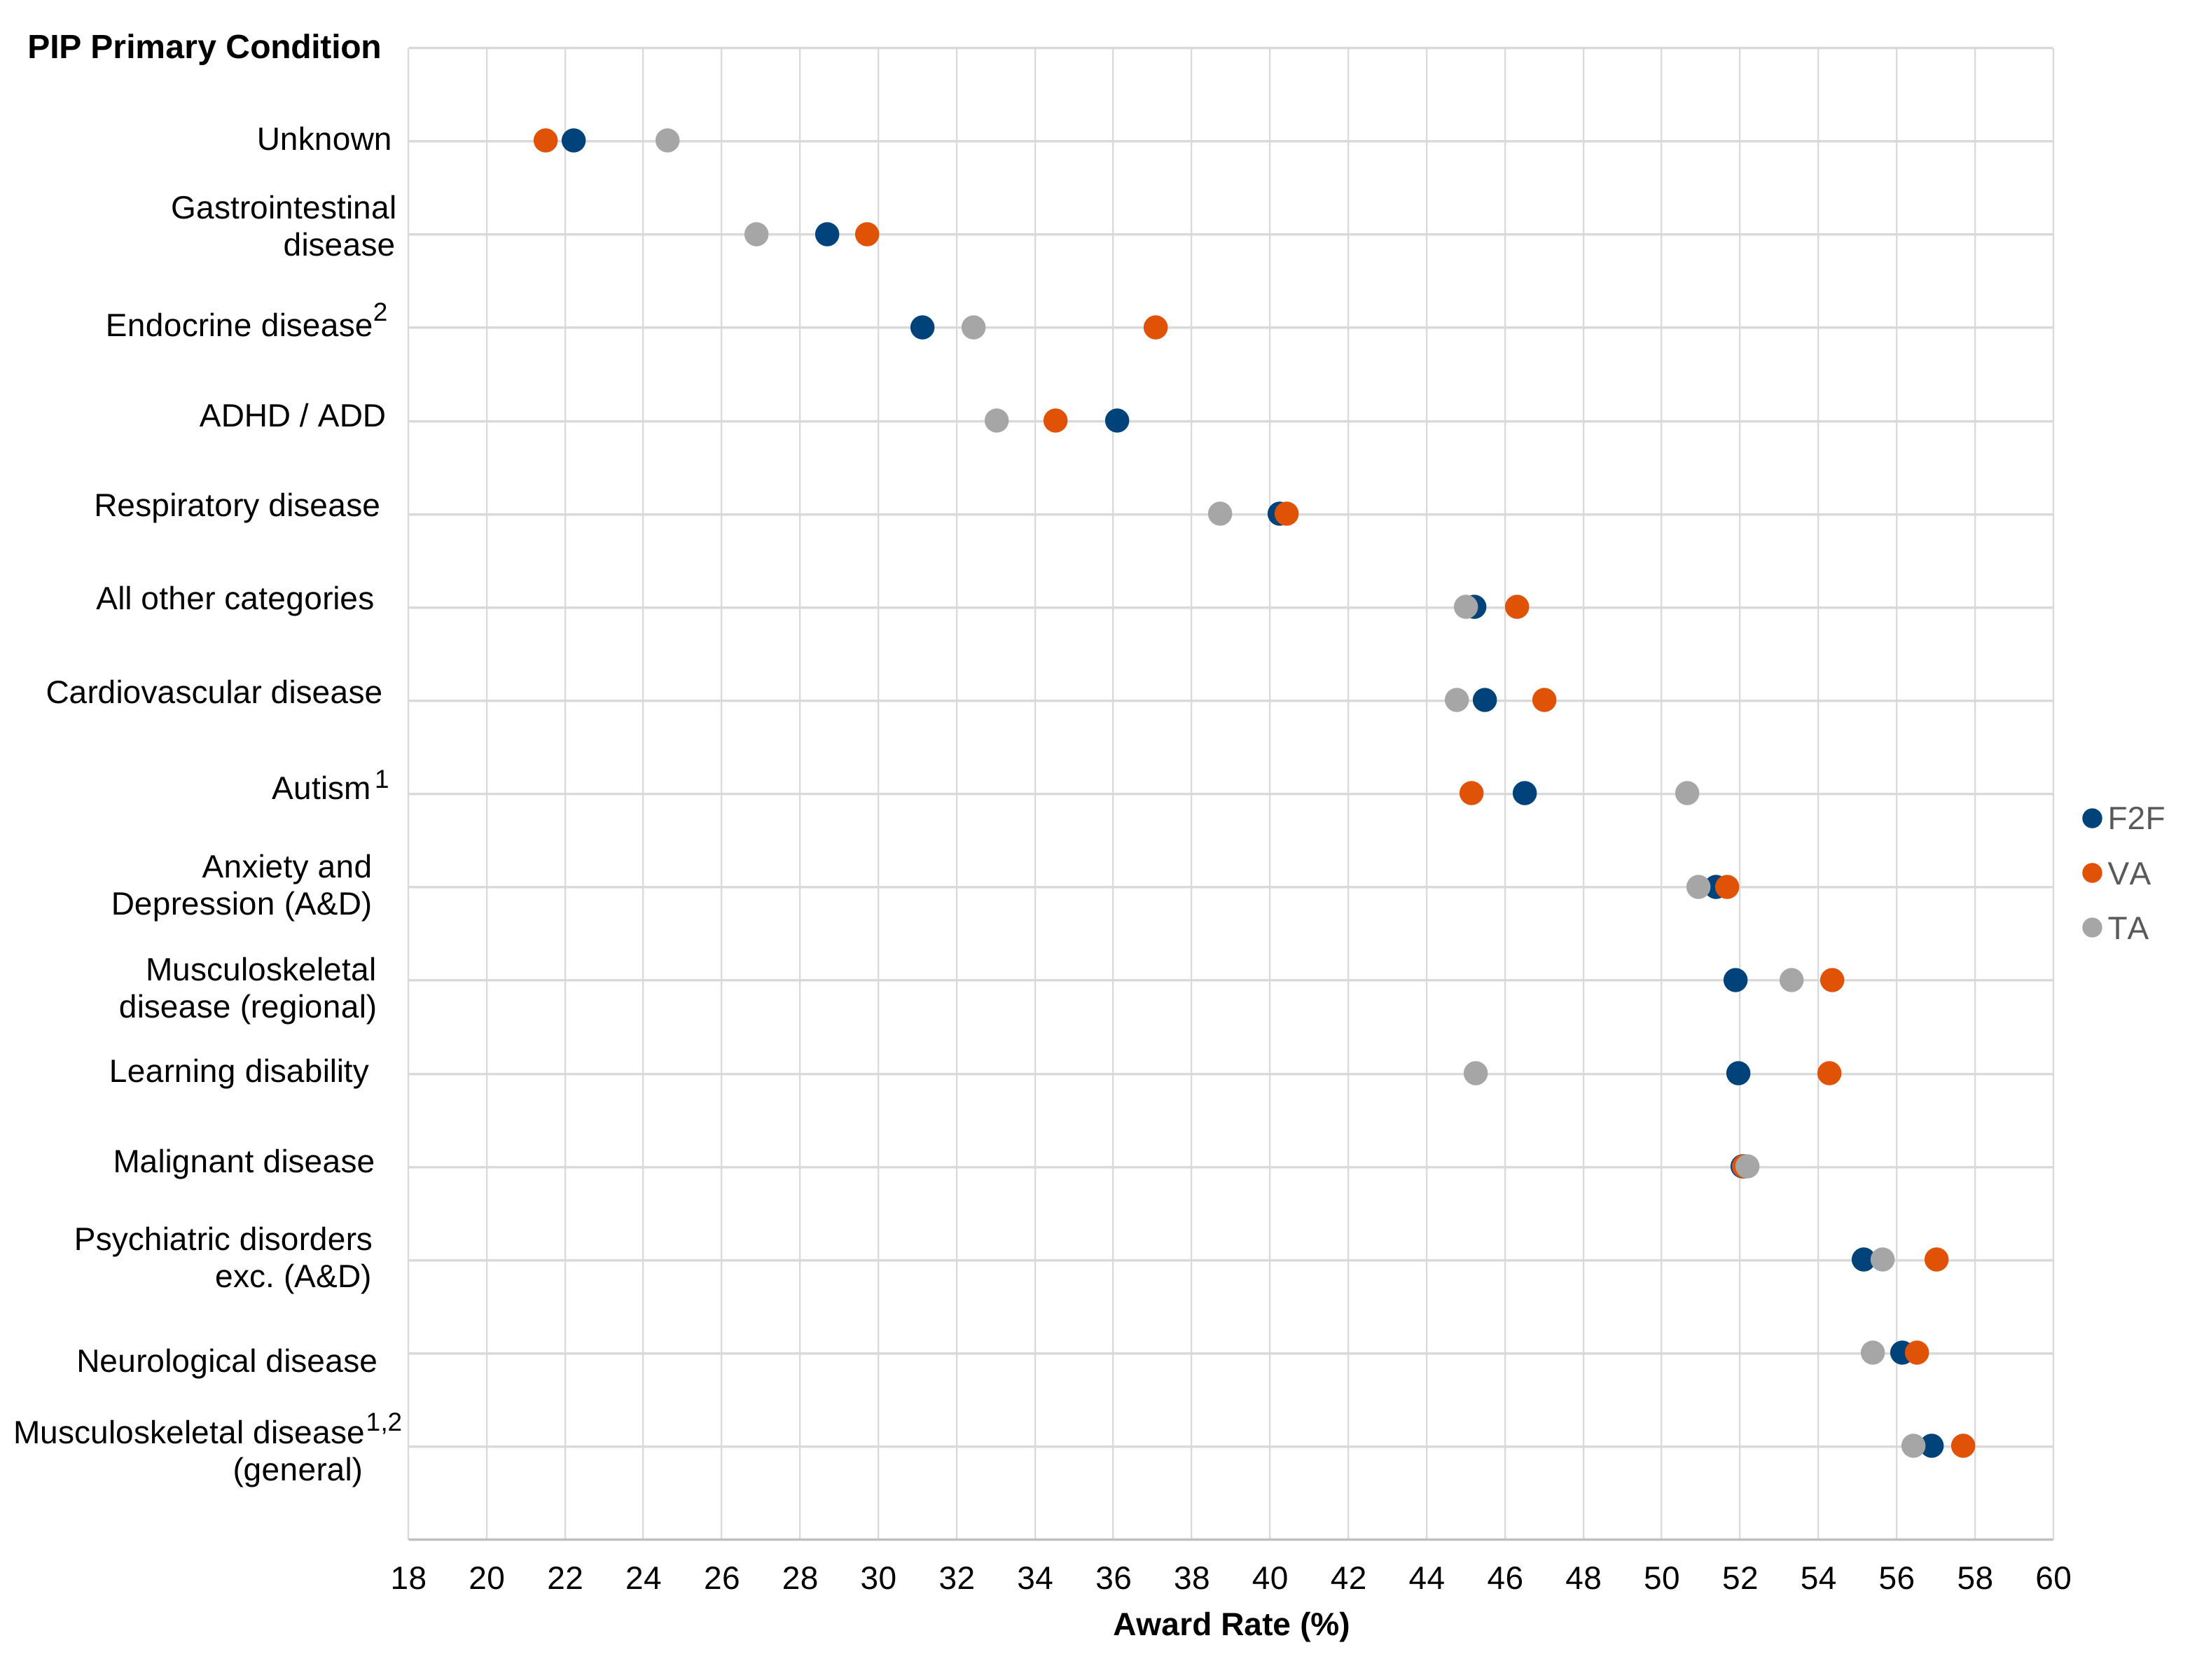
Figure 3.2.3 shows award rates by allocated channel and recorded PIP primary condition. Award rates were broadly consistent between claimants allocated to F2F and remote channels.
Claimants with a learning disability had the largest variance in award rates between channels but this was not statistically significant.
Only 2 condition groups (autism and musculoskeletal disease (regional)) showed statistically significant differences at the 5% level where award rates differed between TA and F2F assessments (4.2 percentage point difference for autism and 1.4 percentage point difference for musculoskeletal disease (regional)). Effect sizes were small for both conditions, however.
Two condition groups (musculoskeletal disease (regional) and endocrine disease) showed statistically significant differences when comparing F2F assessments to VA. The absolute difference between the 2 channels for musculoskeletal disease (regional) was 2.5 percentage points higher for VA and for endocrine disease it was 6 percentage points higher for VA. Whilst these absolute differences were larger than for other conditions, effect sizes were moderate, indicating limited practical impact.
Psychiatric disorders (excluding anxiety and depression), neurological disease and musculoskeletal diseases (general) had the highest award rate of all the PIP primary conditions.
All other conditions showed no statistically significant differences and absolute differences were small, mostly around 2 percentage points.
Figure 3.2.4 PIP assessment award rates by allocated channel and gender

¹ Indicates the comparison between F2F and TA is statistically significant at (or below) the .05 level.
Figure 3.2.4 shows award rates by allocated channel and gender. Award rates were broadly similar across channels for males and females. There was no evidence of a statistically significant difference between F2F assessments and VA for either gender. However, there was evidence of association between F2F assessments and TA for both genders, but observed differences were very small and effect sizes were negligible.
Figure 3.2.5 PIP assessment award rates by allocated channel and age group
¹ Indicates the comparison between F2F and TA is statistically significant at (or below) the .05 level.
² Indicates the comparison between F2F and VA is statistically significant at (or below) the .05 level.
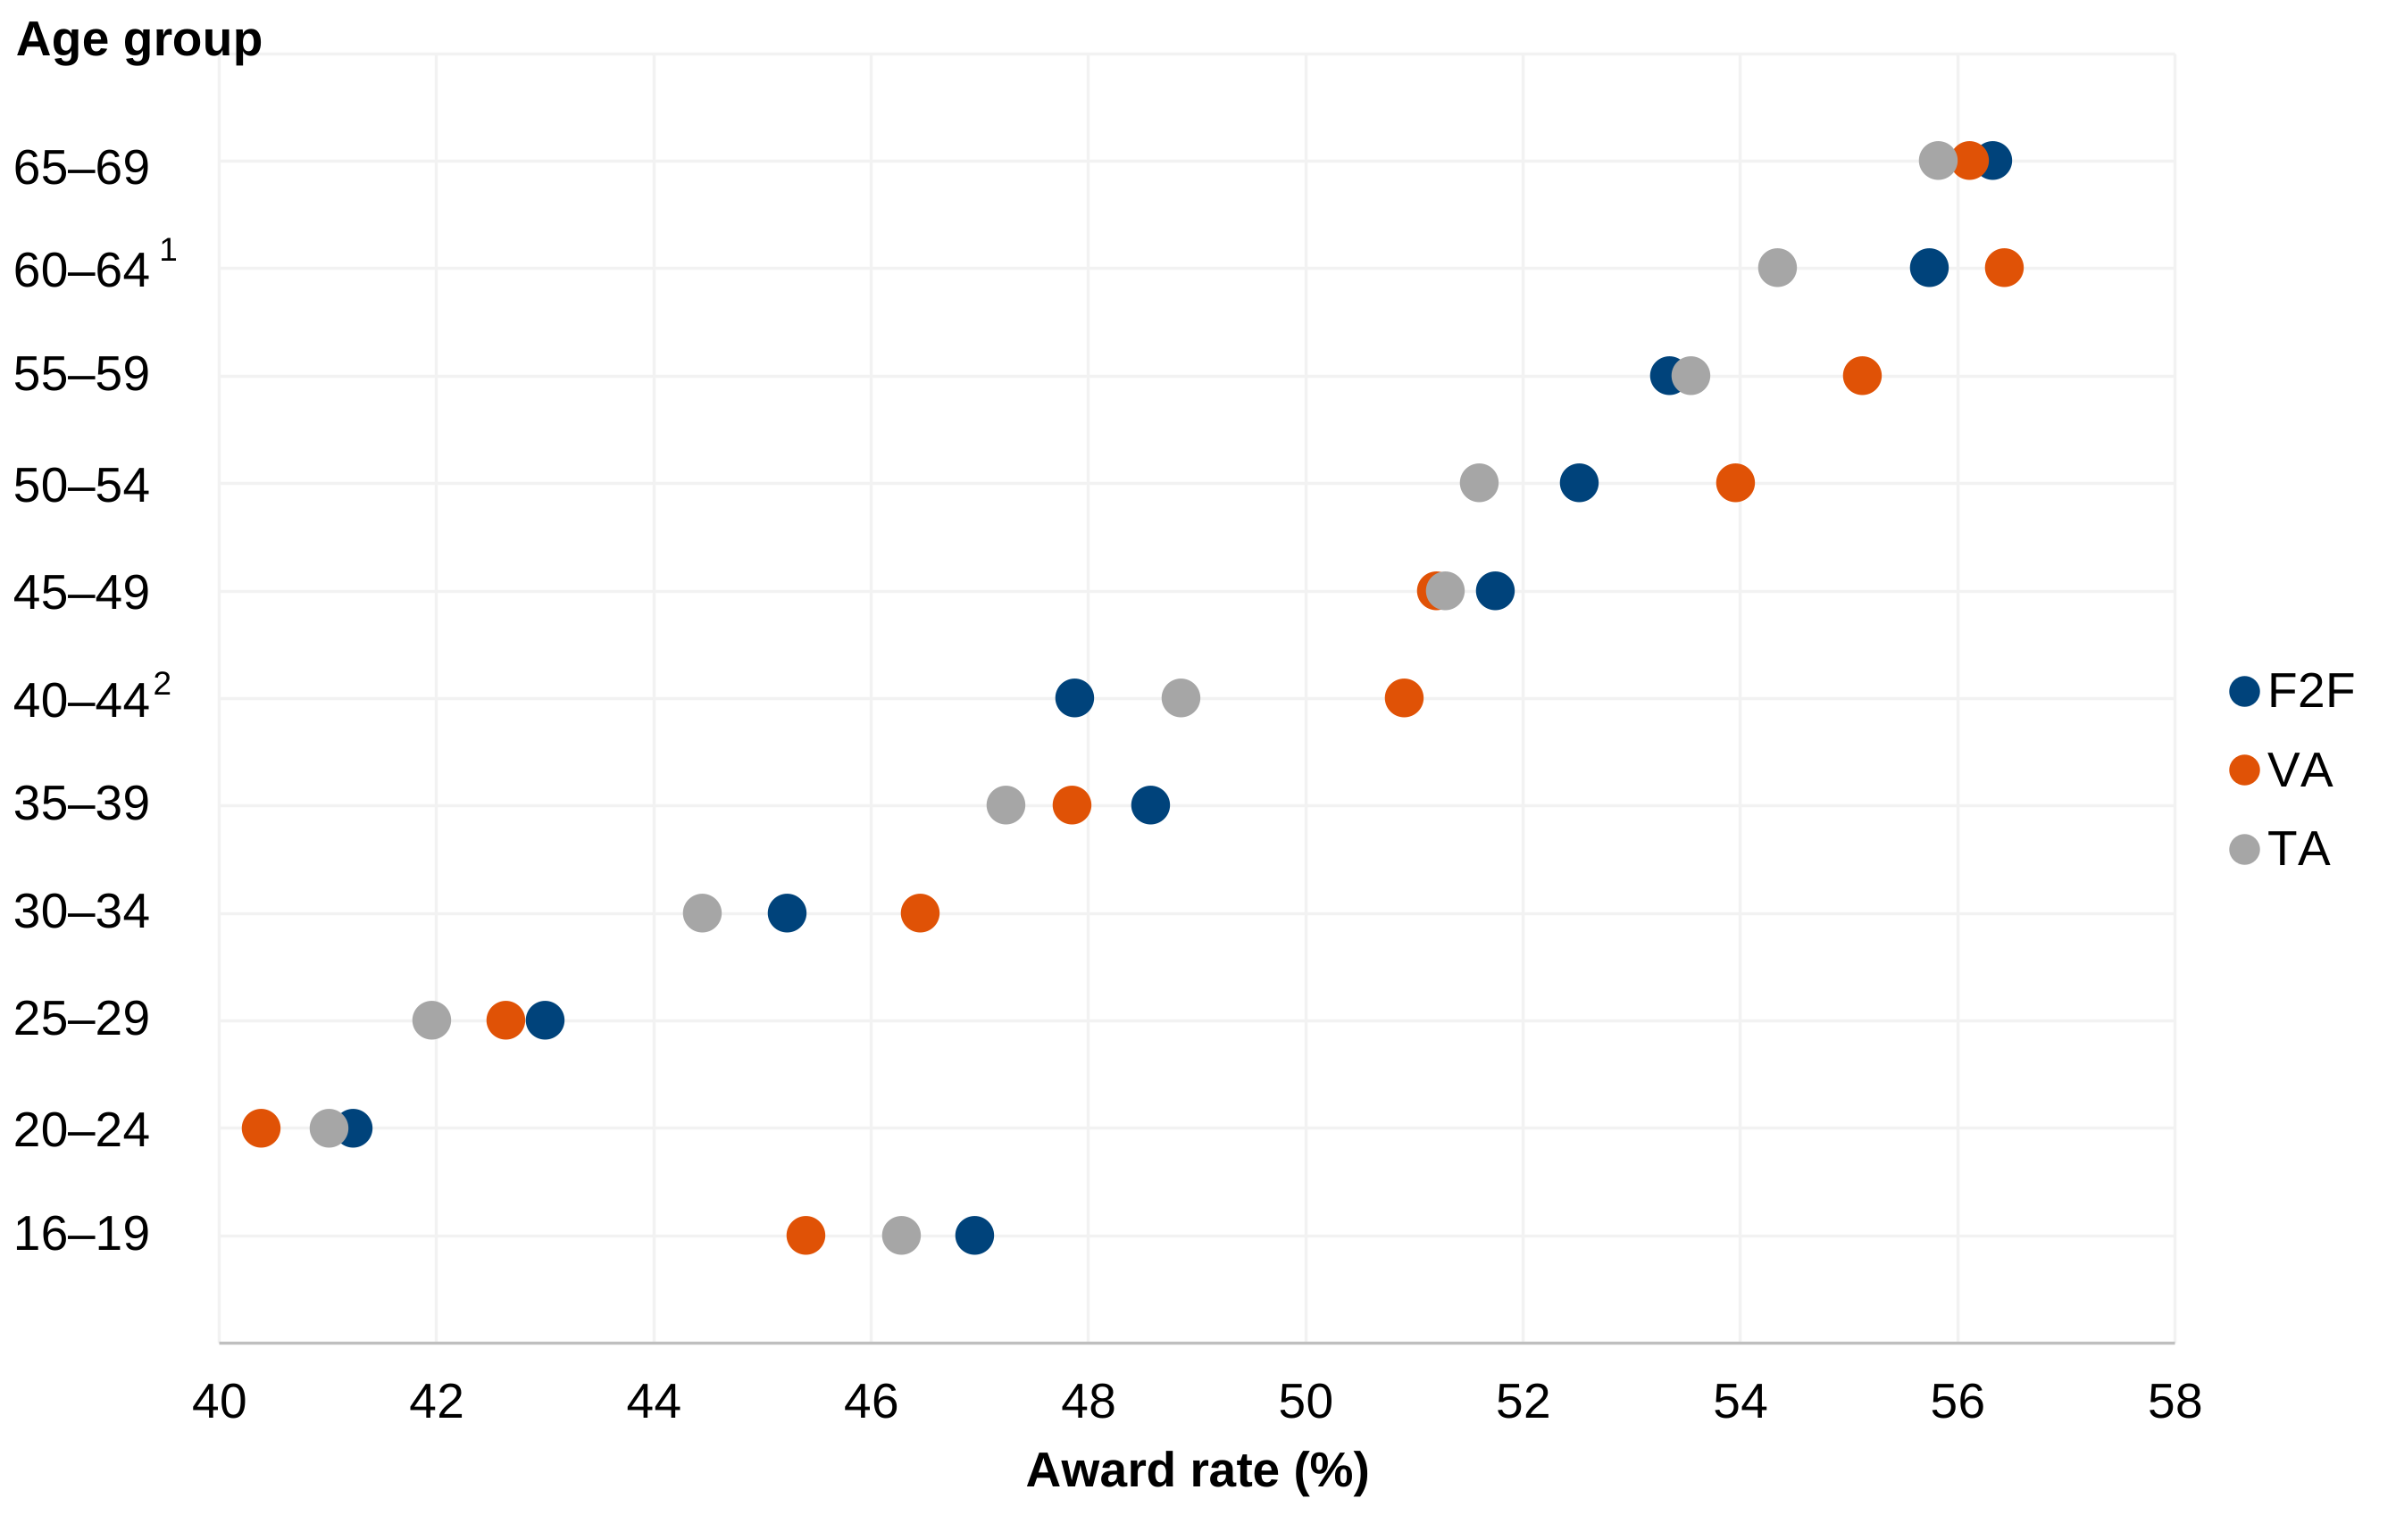
Figure 3.2.5 shows award rates by allocated channel and age group. Award rates were broadly similar across claimants allocated F2F and to remote channels. For most age groups, there was no evidence of a statistically significant association between allocated channel and award outcome at the 5% level. Two age groups showed statistically significant differences: for claimants aged 60 to 64, award rates were marginally lower for claimants allocated to TA than those allocated to F2F, and for claimants aged 40 to 44, award rates were marginally higher for claimants allocated to video than those allocated to F2F. However, effect sizes were negligible, and the absolute differences were small. An award was more likely as age increased.
All tables and statistical tests relating to award rates by PIP allocated channel are provided in the HACT Technical Annex, section B.
Award lengths
Mean award lengths were similar by allocated channel. F2F assessments were given a mean award length of 34.48 months, VA were given 33.56 months, and TA were given 33.43 months.
F2F had slightly longer average award lengths than VA and TA. Although these differences were statistically significant (see HACT Technical Annex, section B), the absolute differences were small.
Findings by attended channel
This section examines HACT PIP assessments, award rates, award lengths, and the average weekly award by the channel that a claimant attended in. Comparisons by attended channel should be treated with caution since claimants that changed channel from their allocated channel may have re-routed into those channels because of their characteristics, thus the differences in awards may reflect who is in each channel, rather than the channel itself.
Figure 3.2.6 PIP assessments by attended channel
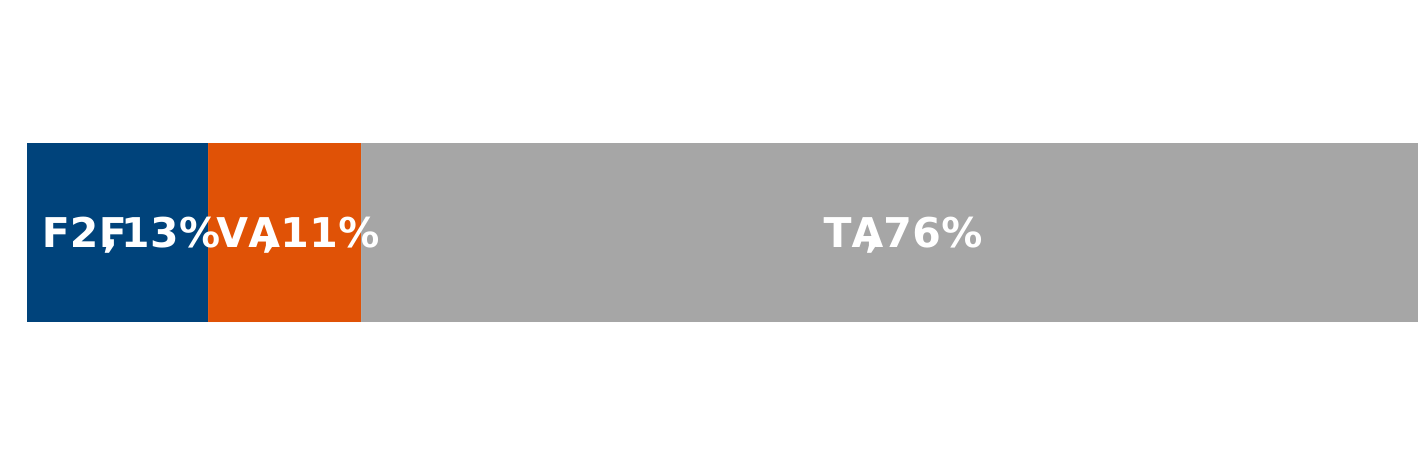
Figure 3.2.6 shows a horizontal stacked bar chart confirming that face-to-face assessments represented 13% of PIP attended channels, video assessments 11%, and telephone assessments 76%, with telephone making up the majority of attended assessments.
Award rates and average weekly awards
As with findings by allocated channel, award rates (adjusted for MRs and appeals, where applicable) were consistent across all attended channels. However, remote channels had a slightly higher award rate and monetary award than F2F. While statistically significant (see HACT Technical Annex, section C), these results should be interpreted with caution as attended channel is not randomly assigned, these differences are likely to reflect selection effects associated with channel changing behaviour rather than a causal impact of the assessment channel itself.
Of PIP trial eligible assessments that had an outcome obtained:
- 13% attended via F2F, of which, less than half were given an award for PIP. The remaining 52% were disallowed decisions. PIP claimants who attended via F2F received an average weekly award of £49.17, when including disallowed awards.
- 11% attended via VA, of which, half were given an award for PIP. The remaining 50% were disallowed decisions. PIP claimants who attended via VA received an average weekly award of £50.21, when including disallowed awards.
- 76% attended via TA, of which, half were given an award for PIP. The remaining 50% were disallowed decisions. PIP claimants who attended via TA received an average weekly award of £51.53, when including disallowed awards.
PIP claimants who attended a remote assessment received a slightly higher average weekly award than those who attended a F2F assessment. This difference is driven by claimants who changed channel from their original allocation. In contrast, claimants who were allocated a remote channel had a slightly lower average weekly award, indicating that the differences observed by attended channel reflect selection effects associated with channel changing, rather than a causal impact of assessment channel.
Figure 3.2.7 PIP assessment outcomes by attended channel
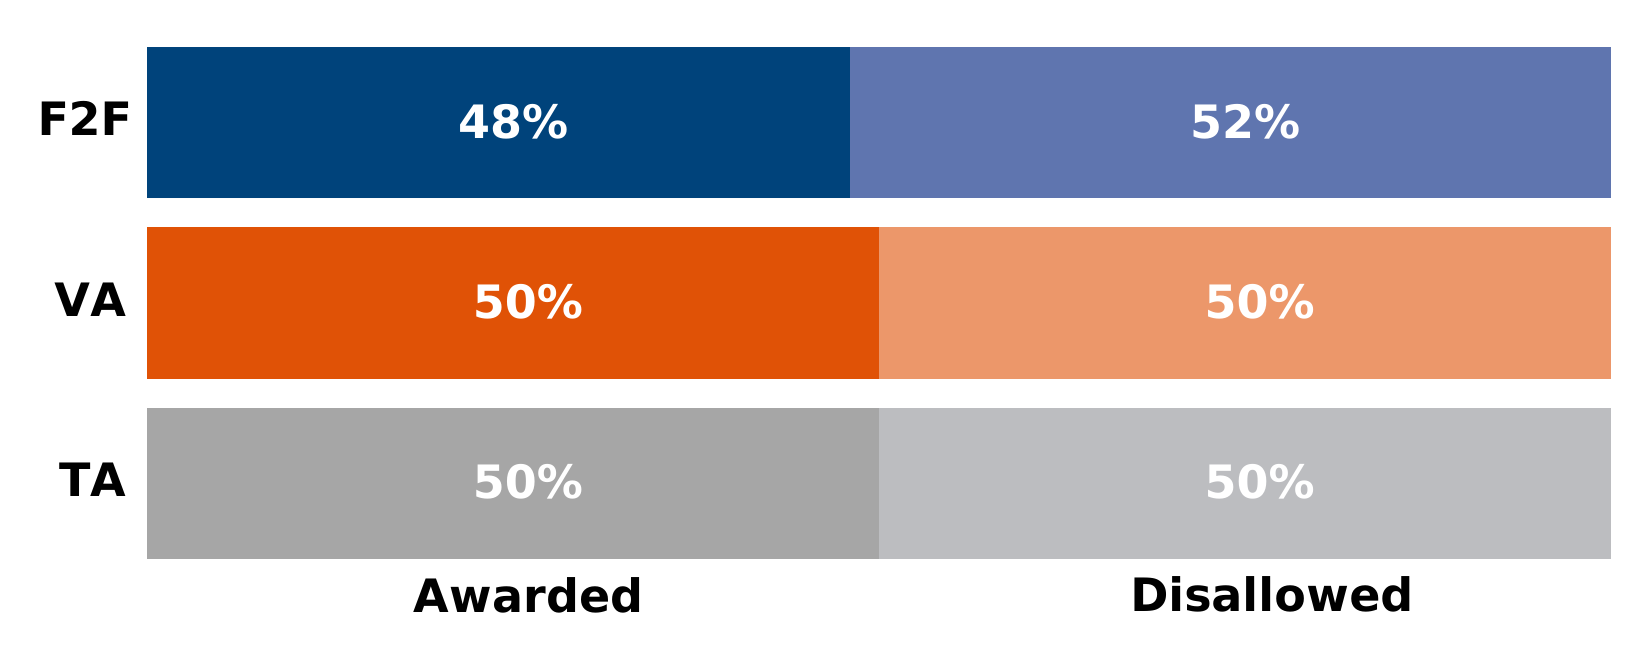
Figure 3.2.7 shows 3 horizontal stacked bar charts, one for face-to-face showing awarded outcomes were slightly lower than disallowed outcomes, one for video assessments showing outcomes were equally split between awarded and disallowed and one for telephone assessments showing outcomes were equally split between awarded and disallowed.
Figure 3.2.8 PIP assessment award rates by attended channel and primary condition

¹ Indicates the comparison between F2F and TA is statistically significant at (or below) the .05 level.
² Indicates the comparison between F2F and VA is statistically significant at (or below) the .05 level.
Figure 3.2.8 shows award rates by attended channel and by primary condition. Award rates were broadly similar between F2F and remote channels.
In several categories, including anxiety and depression, autism, cardiovascular disease, and musculoskeletal disease (general and regional), award rates were slightly higher for claimants who attended a TA than for those who attended F2F, and these differences were statistically significant at the 5% level. However, the absolute differences were small, and associated effect sizes were also small.
For a small number of conditions, including cardiovascular disease, endocrine disease, and musculoskeletal disease (general and regional), award rates were higher for claimants who attended a VA than for those who attended F2F, and these differences were statistically significant at the 5% level. The largest differences were observed for cardiovascular disease and endocrine disease, where award rates following a VA were around 6 percentage points higher than for F2F.
Despite this, the associated effect sizes were small, and these findings suggest differences are modest in size.
Figure 3.2.9 PIP assessment award rates by attended channel and gender

¹ Indicates the comparison between F2F and TA is statistically significant at (or below) the .05 level.
² Indicates the comparison between F2F and VA is statistically significant at (or below) the .05 level.
Figure 3.2.9 shows across all attended channels, award rates were broadly similar for female and male claimants. Among females, award rates were 1.6 to 1.7 percentage points higher for VA and TA assessments compared with F2F, with these differences statistically significant. Among males, the difference between F2F and TA was statistically significant, while the difference between F2F and VA was not. In all cases, effect sizes were very small, indicating limited practical significance.
For both genders, award rates were lowest for F2F assessments and slightly higher for remote channels.
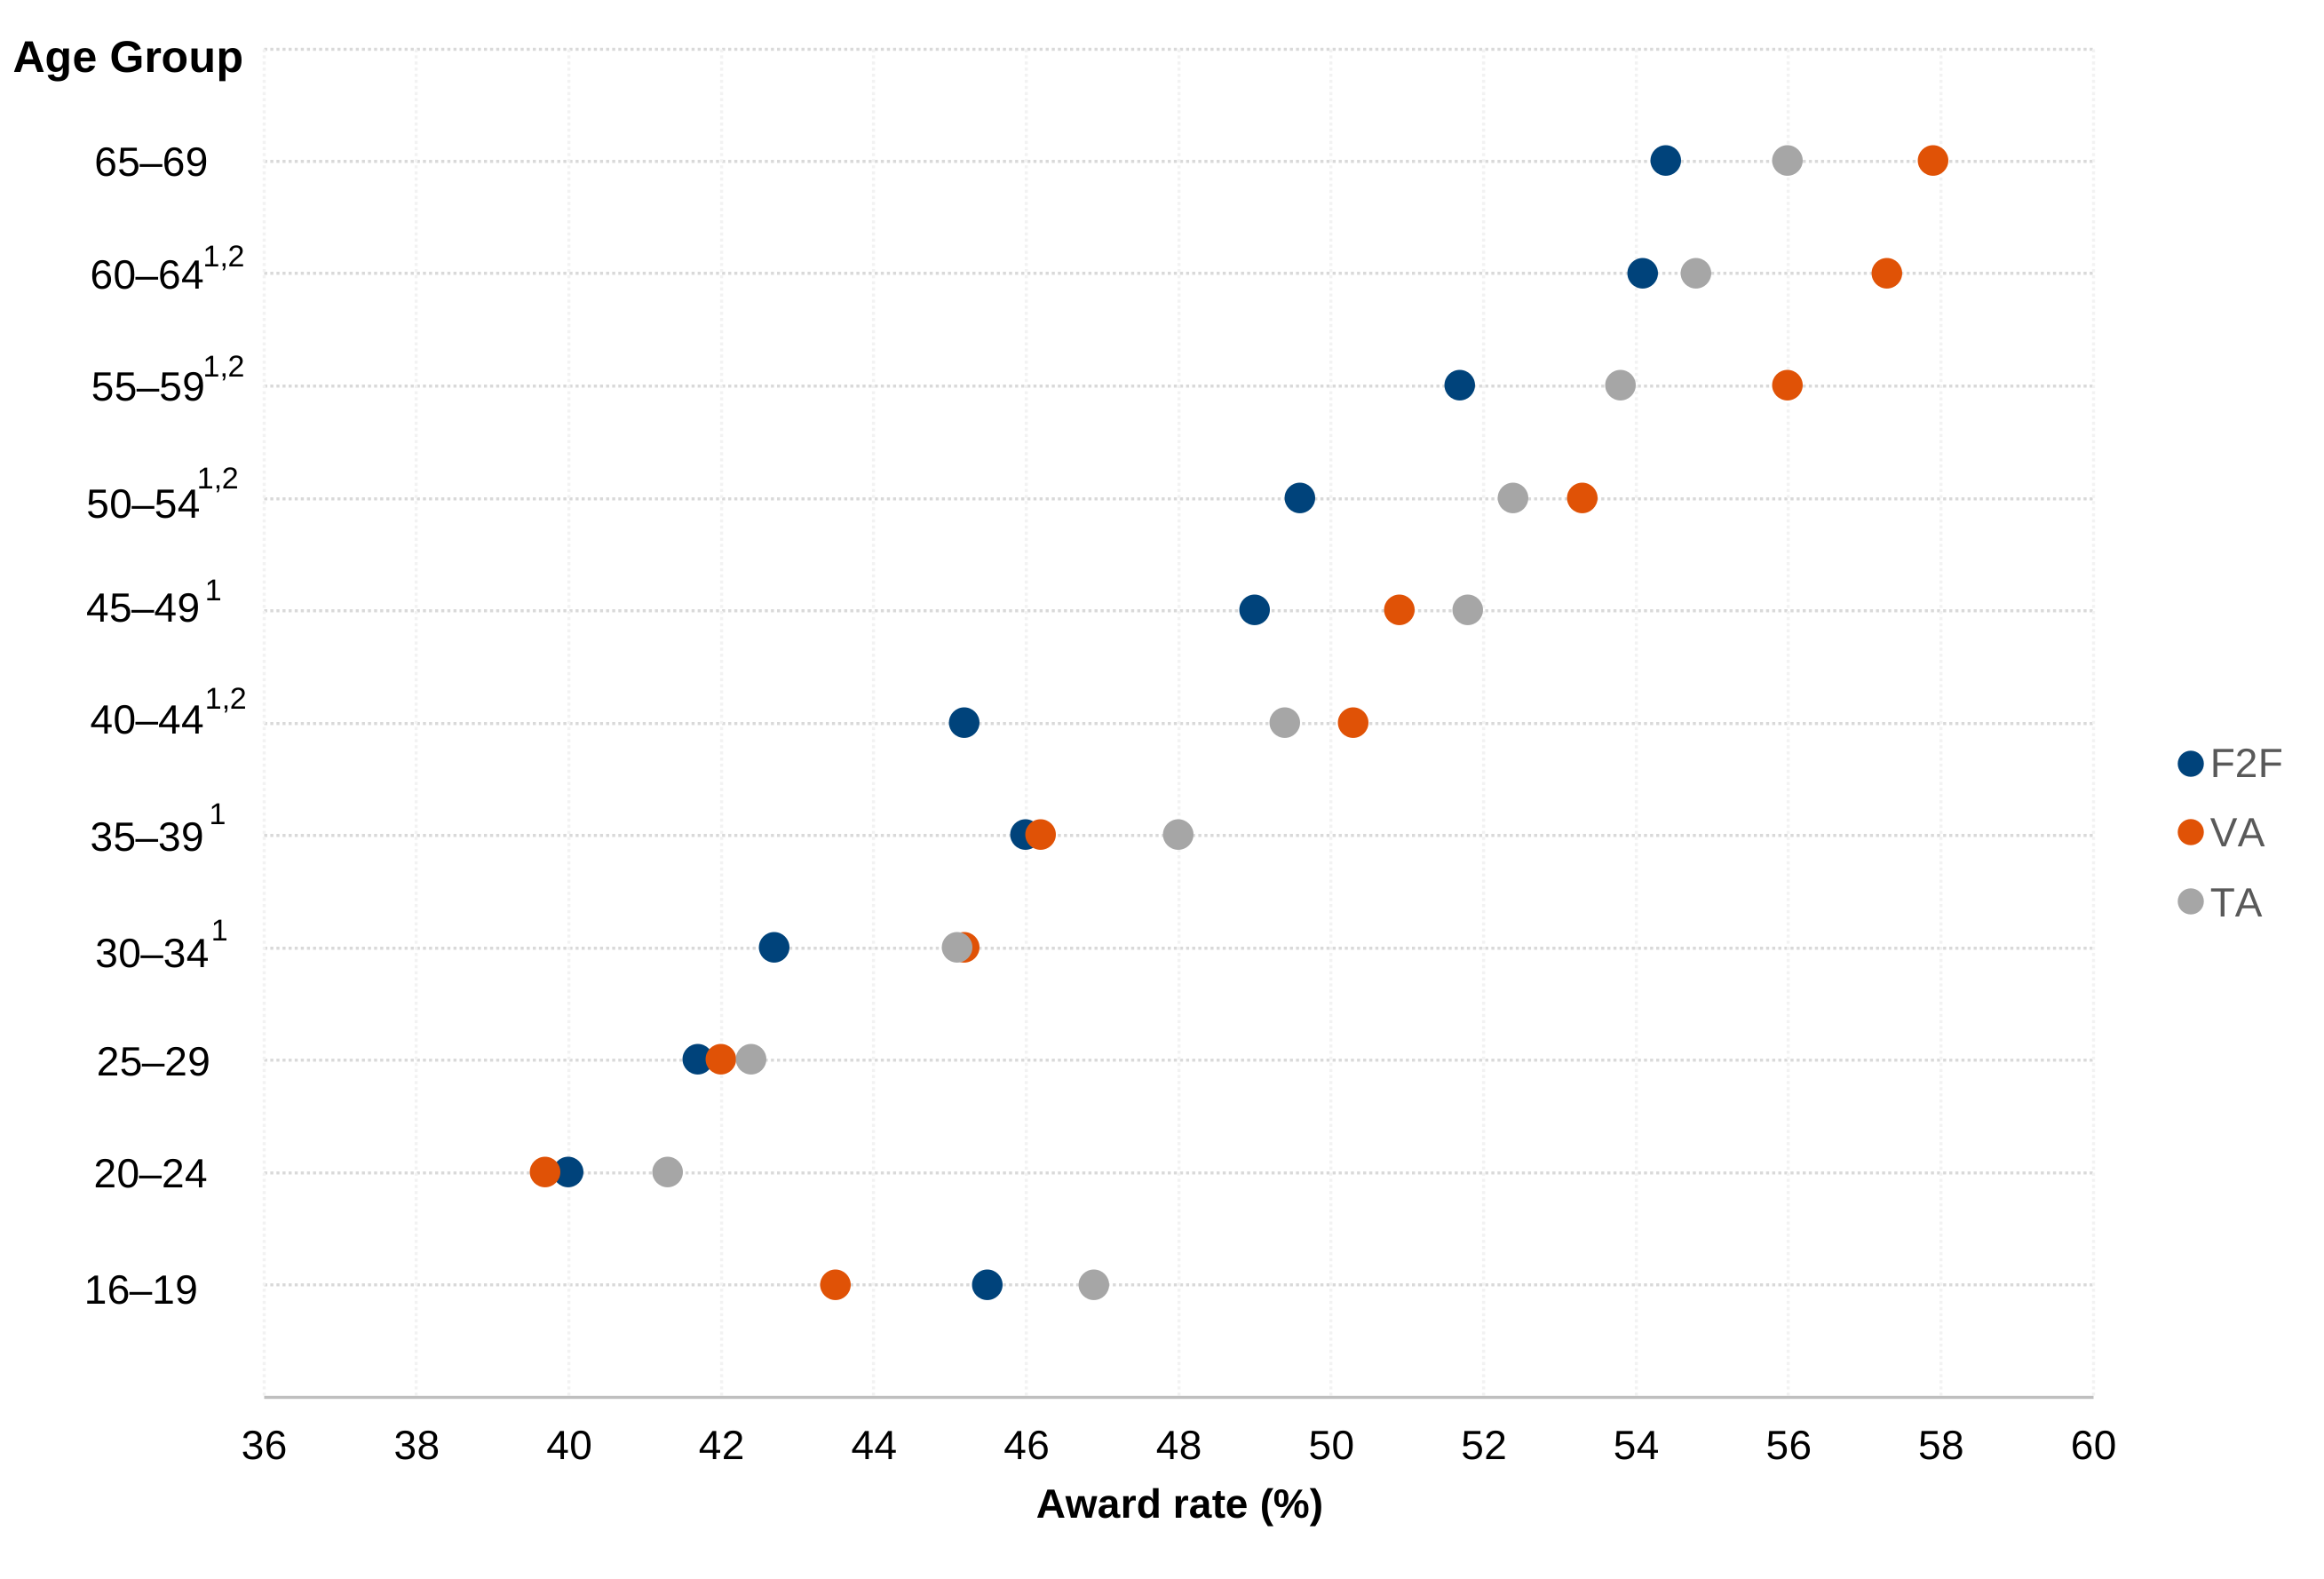
Figure 3.2.10 PIP assessment award rates by attended channel and age group
¹ Indicates the comparison between F2F and TA is statistically significant at (or below) the .05 level.
² Indicates the comparison between F2F and VA is statistically significant at (or below) the .05 level.
Figure 3.2.10 shows across age bands, award rates generally increased with age and were similar across attended channels. In most age groups, award rates for VA and TA were slightly higher than for F2F assessments. Statistically significant differences were observed in some age bands—particularly for claimants aged 40 to 64 when comparing F2F with remote channels. However, the absolute differences were small (typically between 2 and 5 percentage points) and effect sizes were weak, showing limited practical significance.
As with all findings by attended channel, these results are likely to reflect selection effects associated with channel changing from a claimant’s allocated channel, rather than a causal impact.
All tables and statistical tests relating to award rates by PIP attended channel are provided in the HACT Technical Annex, section C.
Award lengths
Mean award lengths were similar by attended channel. F2F assessments were given a mean award length of 34.70 months, VA were given 33.53 months, and TA were given 33.48 months.
F2F had slightly longer average award lengths than VA and TA. Although these differences were statistically significant (see HACT Technical Annex, section C), the absolute differences were very small.
Findings on channel changing
This section examines the channel that a claimant was allocated to and the channel they attended.
Most claimants’ preference when requesting a channel change was towards telephone. Channel changers had higher average award rates and received higher monetary awards. This was regardless of the allocated channel and the channel the claimant attended, suggesting the channel itself is not the driver.
Of the 44,000 that were allocated to F2F:
- 70% attended a F2F assessment
- 30% attended a remote assessment channel instead
Of the 38,000 that were allocated to VA:
- 74% attended a VA
- 27% attended a F2F assessment or TA instead
Of the 171,000 that were allocated to TA:
- 99% attended a TA
- 1% attended a F2F assessment or VA instead
Figure 3.2.11 Heat map showing channel change for PIP assessments
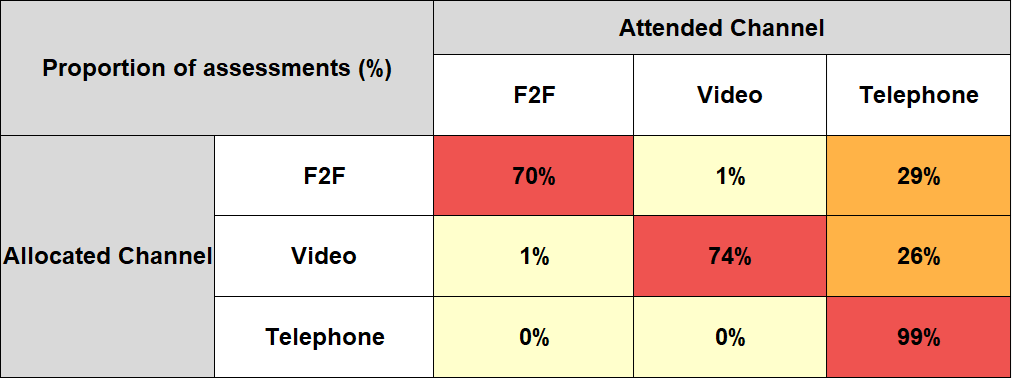
Sample size: 254,021.
Percentages may not sum due to rounding.
Figure 3.2.11 presents a heat map showing the relationship between allocated channel and attended channel. Percentages indicate the proportion of claimants within each allocated channel that ultimately attended each channel. Most claimants attended the channel they were initially allocated.
Figure 3.2.12 Heat map showing average award rates (including disallowances) for PIP assessments

Sample size: 254,021.
Figure 3.2.12 presents a heat map showing award rates by allocated channel and attended channel. Award rates vary from 48% to 56%. Award rates are lowest where claimants attend the same channel as allocated to them and generally higher where claimants attend a different channel.
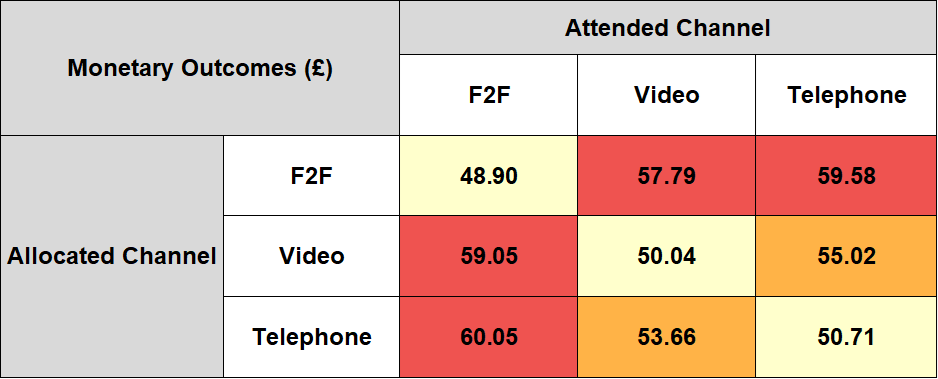
Figure 3.2.13 Heat map showing average weekly award (including disallowances) for PIP assessments
Sample size: 254,021.
Figure 3.2.13 presents a heat map comparing average weekly monetary outcomes by allocated channel and attended channel. The lowest monetary outcomes are observed where claimants attend the same channel to which they were allocated. Higher monetary outcomes are generally associated with claimants attending a different channel from the one allocated to them.
Characteristics of channel changers
Table 3.2.4 PIP assessment channel switching by primary condition
| Channel switching by PIP primary condition | Changed channel | Stayed in allocated channel | Changed channel per cent | Stayed in allocated channel per cent |
|---|---|---|---|---|
| Learning disability¹ | 122 | 761 | 14 | 86 |
| Malignant disease¹ | 586 | 3,729 | 14 | 86 |
| Psychiatric disorders (excluding anxiety and depression)¹ | 773 | 5,232 | 13 | 87 |
| Anxiety and depression | 6,685 | 58,701 | 10 | 90 |
| Autism¹ | 537 | 3,725 | 13 | 87 |
| Neurological disease | 2,402 | 20,980 | 10 | 90 |
| Cardiovascular disease | 956 | 8,581 | 10 | 90 |
| ADHD or ADD | 560 | 5,068 | 10 | 90 |
| Respiratory disease¹ | 1,168 | 11,252 | 9 | 91 |
| Musculoskeletal disease (general)¹ | 4,119 | 40,554 | 9 | 91 |
| Musculoskeletal disease (regional)¹ | 3,206 | 33,433 | 9 | 91 |
| Endocrine disease¹ | 603 | 6,072 | 9 | 91 |
| Gastrointestinal disease¹ | 621 | 6,641 | 9 | 91 |
| Unknown¹ | 221 | 4,458 | 5 | 95 |
| All other categories¹ | 2,024 | 20,253 | 9 | 91 |
| Sample size | 24,583 | 229,440 | No data | No data |
¹ The result is significant at (or below) the .05 level.
Table 3.2.4 compares claimants who changed channel and those who remained in their allocated channel by PIP primary condition. Claimants with learning disabilities, malignant disease, autism, and psychiatric disorders (excluding anxiety and depression) were more likely to change channel, with around 13% to 14% changing channel in these groups. In contrast, claimants with gastrointestinal disease, musculoskeletal disease, endocrine disease, and respiratory conditions were slightly less likely to change channel, with around 9% doing so.
Table 3.2.5 PIP assessment channel switching by gender
| Channel switching by gender | Changed channel | Stayed in allocated channel | Changed channel per cent | Stayed in allocated channel per cent |
|---|---|---|---|---|
| Female | 14,679 | 136,244 | 10 | 90 |
| Male | 9,904 | 93,194 | 10 | 90 |
| Sample size | 24,583 | 229,438 | No data | No data |
Table 3.2.5 compares claimants who changed channel and those who remained in their allocated channel by gender. Gender did not have a statistically significant effect on the likelihood of being assessed in the original channel. The proportion of claimants who changed channel was similar for males and females (both around 10%).
Table 3.2.6 PIP assessment channel switching by age group
| Channel switching by age group | Changed channel | Stayed in allocated channel | Changed channel per cent | Stayed in allocated channel per cent |
|---|---|---|---|---|
| 16 to 24 | 2,284 | 22,729 | 9 | 91 |
| 25 to 34 | 4,214 | 41,459 | 9 | 91 |
| 35 to 44 | 4,836 | 45,774 | 10 | 90 |
| 45 to 54¹ | 5,407 | 50,223 | 10 | 90 |
| 55 to 64¹ | 7,067 | 62,671 | 10 | 90 |
| 65 and over¹ | 775 | 6,582 | 11 | 89 |
| Sample size | 24,583 | 229,438 | No data | No data |
¹ The result is significant at (or below) the .05 level.
Table 3.2.6 compares claimants who changed channel and those who remained in their allocated channel by age group. Older claimants were marginally more likely to change channel, with the likelihood increasing from age 45 onwards. Around 9% of claimants aged under 35 changed channels, compared with around 10 to 11% among claimants aged 45 and over. Differences for claimants aged 45 and over were statistically significant.
Although several differences were statistically significant, the model had limited predictive power, indicating that claimant characteristics alone explain only a small proportion of the variation in channel change. These findings should therefore be interpreted as evidence of modest differences in channel change by primary condition, gender, and age, rather than as indicating that any single characteristic is a strong determinant of channel change.
Logistic regression results examining the likelihood of being assessed in a different channel to that originally allocated can be viewed in the HACT Technical Annex, section E.
Findings on claimant journey by allocated channel
This section examines the customer journey following the declaration of a health condition, focusing on how claimants progress through key stages of the PIP assessment process. The analysis compares these journeys across the channel to which claimants were originally allocated, highlighting any differences in referral, assessment, and clearance outcomes by allocated channel.
The award proportions in this section are shown separately for the initial outcome, MR, and appeals. They therefore differ from the final award rates reported earlier, which incorporate MR and appeal outcomes where applicable.
Figure 3.2.14 PIP assessment customer journey after a claimant declares a health condition by allocated channel

Figure 3.2.14 shows that of the 262,000 PIP referrals that were trial eligible and assessed:
- 97% of claimants that were assessed, had received an outcome
- of claimants that were assessed and had an outcome, 18% of assessments were F2F assessments, 15% were VA and 67% were TA
Of the 18% of assessments that were allocated to F2F:
- 43% were awarded a claim, whilst 57% were disallowed decisions
- the number of MRs registered was 11,400 (26% of assessments allocated to F2F) and nearly all had been decided
- of MRs that had been decided, 10% had an award changed, whilst 90% of awards were unchanged or not revised
- the number of appeals lodged was 4,400 (10% of assessments allocated to F2F)
- 78% of appeals were cleared at a tribunal
- of claimants that had an appeal cleared, 65% had a decision overturned at tribunal, whilst 35% had their decision upheld
Of the 15% of assessments that were allocated to video:
- 44% were awarded a claim, whilst 56% were disallowed decisions
- the number of MRs registered was 8,800 (23% of assessments allocated to VA) and nearly all had been decided
- of MRs that had been decided, 10% had an award changed, whilst 90% of awards were unchanged or not revised
- the number of appeals lodged was 3,400 (9% of assessments allocated to VA)
- 78% of appeals were cleared at a tribunal
- Of claimants that had an appeal cleared, 68% had a decision overturned at tribunal, whilst 32% had their decision upheld
Of the 67% of assessments that were allocated to telephone:
- 43% were awarded a claim, whilst 57% were disallowed decisions
- the number of MRs registered was 37,300 (22% of assessments allocated to TA) and nearly all had been decided
- of MRs that had been decided, 10% had an award changed, whilst 90% of awards were unchanged or not revised
- the number of appeals lodged was 14,000 (8% of assessments allocated to TA)
- 78% of appeals were cleared at a tribunal
- of claimants that had an appeal cleared, 66% had a decision overturned at tribunal, whilst 34% had their decision upheld
Award outcomes were similar across all channels at initial outcome and following MRs and appeals.
Findings on claimant journey by attended channel
This section examines the customer journey following the declaration of a health condition, focusing on how claimants progress through key stages of the PIP assessment process. The analysis compares these journeys across the channel to which claimants attended, highlighting any differences in referral, assessment, and clearance outcomes by attended channel.
The award proportions in this section are shown separately for the initial outcome, MR, and appeals. They therefore differ from the final award rates reported earlier, which incorporate MR and appeal outcomes where applicable.
Figure 3.2.15 PIP assessment customer journey after a claimant declares a health condition by attended channel

Figure 3.2.15 shows that of the 262,000 PIP referrals that were trial eligible and assessed:
-
97% of claimants that were assessed, had received an outcome
-
of claimants that were assessed and had an outcome, 13% of assessments were F2F, 11% were VA and 76% were TA
Of the 13% of assessments that were completed F2F:
-
41% were awarded a claim, whilst 59% were disallowed decisions
-
the number of MRs registered was 8,300 (26% of attended F2F assessments) and nearly all had been decided
-
of MRs that had been decided, 9% had an award changed, whilst 91% of awards were unchanged or not revised
-
the number of appeals lodged was 3,200 (10% of attended F2F assessments)
-
80% of appeals were cleared at a tribunal
-
of claimants that had an appeal cleared, 64% had a decision overturned at tribunal, whilst 36% had their decision upheld
Of the 11% of assessments that were completed via VA:
-
43% were awarded a claim, whilst 57% were disallowed decisions
-
the number of MRs registered was 6,700 (23% of attended VA assessments) and nearly all had been decided
-
of MRs that had been decided, 10% had an award changed, whilst 90% of awards were unchanged or not revised
-
the number of appeals lodged was 2,500 (9% of attended VA assessments)
-
79% of appeals were cleared at a tribunal
-
of claimants that had an appeal cleared, 69% had a decision overturned at tribunal, whilst 31% had their decision upheld
Of the 76% of assessments that were completed via TA:
-
44% were awarded a claim, whilst 56% were disallowed decisions
-
the number of MRs registered was 42,700 (22% of attended TA assessments) and nearly all had been decided
-
of MRs that had been decided, 10% had an award changed, whilst 90% of awards were unchanged or not revised
-
the number of appeals lodged was 16,000 (8% of attended TA assessments)
-
78% of appeals were cleared at a tribunal
-
of claimants that had an appeal cleared, 66% had a decision overturned at tribunal, whilst 34% had their decision upheld
Claimants that attended remote assessments were slightly more likely to be awarded a claim at initial outcome, were just as likely as those that attended a F2F assessment to have a decision changed at MR and were also more likely to have their decision overturned at appeal.
3.3. Work Capability Assessment findings
This section examines the HACT WCA by allocated channel, and the breakdown of the decisions given. WCAs cover both ESA and UC. Assessments from Scotland and Northern Ireland were excluded from the results to ensure consistency between the WCA and PIP.
Findings by allocated channel
Across WCAs, the likelihood of receiving a health-related outcome and the prognosis period awarded were broadly consistent across channels.
Of WCAs that were trial eligible and had an outcome identified:
-
21% were allocated to F2F
-
7% were allocated to VA
-
71% of WCAs were allocated to TA
Figure 3.3.1 WCAs by allocated channel
Percentage figures may not sum due to rounding.
Figure 3.3.1 shows a horizontal stacked bar chart confirming that face-to-face assessments represented 21% of WCA allocated channels, video assessments 7%, and telephone assessments 71%, with telephone making up the majority of the allocation.
Equalities analysis
The tables in this section are presented to examine whether particular claimants were disproportionately represented in one channel and to support interpretation of any observed outcome differences for first recorded condition, gender, and age.
To assess whether there were statistically significant differences between assessment channels, tests of proportions were undertaken comparing F2F assessments with VA and TA.
For each comparison, the null hypothesis was that there was no difference in the proportion observed between channels. Statistical significance was assessed at the 5% level (p ≤ 0.05), with statistically significant differences indicated in the tables.
Medical condition is based on evidence recorded at the WCA, this in itself does not confer entitlement to Employment and Support Allowance or the Universal Credit Health Element.
Conditions have been mapped to reflect as closely as possible the appropriate International Classification of Diseases version 10[footnote 1].
Primary medical condition is not recorded for the WCA. Claimants often have complex health issues and can thus be recorded with multiple conditions. The ICD10 group conditions provided for the HACT analysis are the first recorded condition on DWP systems from the WCA and should not be interpreted as the claimant’s primary medical condition.
Table 3.3.1 WCA channel allocation by first recorded condition
| Condition by channel | F2F | VA | TA | F2F per cent | VA per cent | TA per cent |
|---|---|---|---|---|---|---|
| Certain infectious and parasitic diseases² | 42 | 10 | 108 | 26.3 | 6.3 | 67.5 |
| Congenital malformations, malformations and chromosomal abnormalities² | 16 | 5 | 41 | 25.8 | 8.1 | 66.1 |
| Diseases of the blood and blood forming organs and certain diseases involving the immune mechanism² | 74 | 21 | 195 | 25.5 | 7.2 | 67.2 |
| Diseases of the eye and adnexa¹ ² | 212 | 70 | 558 | 25.2 | 8.3 | 66.4 |
| Diseases of the circulatory system¹ ² | 1,268 | 393 | 3,607 | 24.1 | 7.5 | 68.5 |
| Diseases of the genitourinary system¹ ² | 338 | 116 | 951 | 24.1 | 8.3 | 67.7 |
| Neoplasms¹ ² | 211 | 65 | 613 | 23.7 | 7.3 | 69.0 |
| Injury, poisoning and certain other consequences of external causes² | 89 | 25 | 262 | 23.7 | 6.6 | 69.7 |
| Endocrine, nutritional and metabolic diseases¹ ² | 529 | 169 | 1,595 | 23.1 | 7.4 | 69.6 |
| Diseases of the musculoskeletal system and connective tissue¹ ² | 6,474 | 2,026 | 19,745 | 22.9 | 7.2 | 69.9 |
| Diseases of the ear and mastoid process² | 81 | 22 | 257 | 22.5 | 6.1 | 71.4 |
| Diseases of the nervous system¹ ² | 850 | 344 | 2,706 | 21.8 | 8.8 | 69.4 |
| Diseases of the digestive system¹ ² | 676 | 221 | 2,273 | 21.3 | 7.0 | 71.7 |
| Diseases of the respiratory system¹ ² | 888 | 311 | 2,972 | 21.3 | 7.5 | 71.3 |
| Symptoms, signs and abnormal clinical and laboratory findings, not elsewhere classified¹ ² | 180 | 67 | 600 | 21.3 | 7.9 | 70.8 |
| Diseases of the skin and subcutaneous system² | 110 | 48 | 403 | 19.6 | 8.6 | 71.8 |
| Mental and behavioural disorders¹ ² | 8,666 | 3,311 | 32,518 | 19.5 | 7.4 | 73.1 |
| Factors influencing health status and contact with health services² | 82 | 43 | 399 | 15.6 | 8.2 | 76.1 |
| Pregnancy, childbirth, and the puerperium | 0 | 1 | 9 | 0.0 | 10.0 | 90.0 |
| Unknown or claimants without diagnosis on the system² | 89 | 65 | 372 | 16.9 | 12.4 | 70.7 |
| Sample size | 20,875 | 7,333 | 70,184 | No data | No data | No data |
¹ VA is Statistically significantly different from F2F (p < 0.05).
² TA is Statistically significantly different from F2F (p < 0.05).
Table 3.3.1 shows that, across most condition groups, there were statistically significant differences in the distribution of allocated channel when comparing remote channels (VA and TA) with F2F assessments.
For example, a higher proportion of assessments allocated to telephone was observed for mental and behavioural disorders, whilst a relatively higher proportion of assessments allocated to F2F was observed for conditions relating to certain infectious and parasitic diseases.
Although many of these differences were statistically significant, this is partly driven by the large sample size, and the absolute differences in proportions are generally small.
Table 3.3.2 WCA channel allocation by gender
| Gender by channel | F2F | VA | TA | F2F per cent | VA per cent | TA per cent |
|---|---|---|---|---|---|---|
| Female¹ ² | 10,600 | 3,908 | 37,170 | 20.5 | 7.6 | 71.9 |
| Male¹ ² | 10,275 | 3,425 | 33,014 | 22.0 | 7.3 | 70.7 |
| Sample size | 20,875 | 7,333 | 70,184 | No data | No data | No data |
¹ VA is Statistically significantly different from F2F (p < 0.05).
² TA is Statistically significantly different from F2F (p < 0.05).
Table 3.3.2 shows channel allocation by gender. TA accounted for over 70% of the channel allocation for both females and males. Although differences in allocation between remote channels and F2F were statistically significant, the magnitude of the differences are small.
Table 3.3.3 WCA channel allocation by age
| Age by channel | F2F | VA | TA | F2F per cent | VA per cent | TA per cent |
|---|---|---|---|---|---|---|
| Under 18² | 52 | 21 | 171 | 21.3 | 8.6 | 70.1 |
| 18 to 24¹ ² | 2,151 | 803 | 7,722 | 20.1 | 7.5 | 72.3 |
| 25 to 34¹ ² | 3,394 | 1,473 | 13,363 | 18.6 | 8.1 | 73.3 |
| 35 to 44¹ ² | 4,151 | 1,543 | 14,532 | 20.5 | 7.6 | 71.8 |
| 45 to 49¹ ² | 2,069 | 764 | 6,878 | 21.3 | 7.9 | 70.8 |
| 50 to 54¹ ² | 2,575 | 814 | 7,970 | 22.7 | 7.2 | 70.2 |
| 55 to 59¹ ² | 2,853 | 922 | 8,691 | 22.9 | 7.4 | 69.7 |
| 60 to 64¹ ² | 3,049 | 829 | 9,060 | 23.6 | 6.4 | 70.0 |
| 65 and over¹ ² | 581 | 164 | 1,797 | 22.9 | 6.5 | 70.7 |
| Sample size | 20,875 | 7,333 | 70,184 | No data | No data | No data |
¹ VA is Statistically significantly different from F2F (p < 0.05).
² TA is Statistically significantly different from F2F (p < 0.05).
Table 3.3.3 shows channel allocation by age group. TA accounted for the majority of allocation across all age groups. Older claimants were slightly more likely to be allocated to a F2F assessment, compared to younger claimants. While differences between remote channels and F2F were statistically significant across nearly all age groups, the magnitude of these differences are small.
Given the large sample sizes involved, statistically significant differences should be interpreted with caution because small absolute differences in proportions can be detected as statistically significant but may not represent meaningful differences in practice. These tests are intended to support interpretation of observed differences and do not provide evidence of superiority of one channel.
WCA decisions
Claimants most likely to be considered Fit for Work (ESA) or Capable to Work (UC) were those allocated to F2F assessments. This was closely followed by claimants allocated to TA and then to VA.
Almost all (96%) of WCAs that were trial eligible, had an outcome obtained (98,000).
Of the 21% that were allocated to F2F:
-
23% were considered FFW or CTW
-
17% were considered to have LCW or WRAG
-
60% were considered to have LCWRA or Support Group (SG)
Of the 7% that were allocated to VA:
- 21% were considered FFW or CTW
- 17% were considered to have LCW or WRAG
- 61% were considered to have LCWRA or SG
Of the 71% that were allocated to TA:
- 22% were considered FFW or CTW
- 20% were considered to have LCW or WRAG
- 58% were considered to have LCWRA or SG
When analysed by allocated channel, there were small but statistically significant differences in the likelihood of receiving a health‑related outcome following a WCA. Claimants allocated to TA or VA were marginally more likely to receive a health‑related outcome (LCW/WRAG, LCWRA/Support Group).
Although these differences were statistically significant (see HACT Technical Annex, section D), the absolute differences were small and do not indicate a materially meaningful difference in outcomes between assessment channels.
Figure 3.3.2 WCA decision by allocated channel
Percentages may not sum due to rounding.
Figure 3.3.2 shows claimants that were allocated a face-to-face assessment were more likely to receive a Limited Capability for Work and Work-Related Activity award compared to claimants allocated to a telephone assessment but were slightly less likely to receive the award compared to claimants allocated to a video assessment. Claimants allocated to a face-to-face assessment were as likely to receive a Limited Capability Work as claimants allocated to a video assessment, but less likely than those allocated to telephone. Claimants allocated to face-to-face assessments were slightly more likely to receive a Fit for Work or Capable to Work decision compared to those allocated to a remote channel.
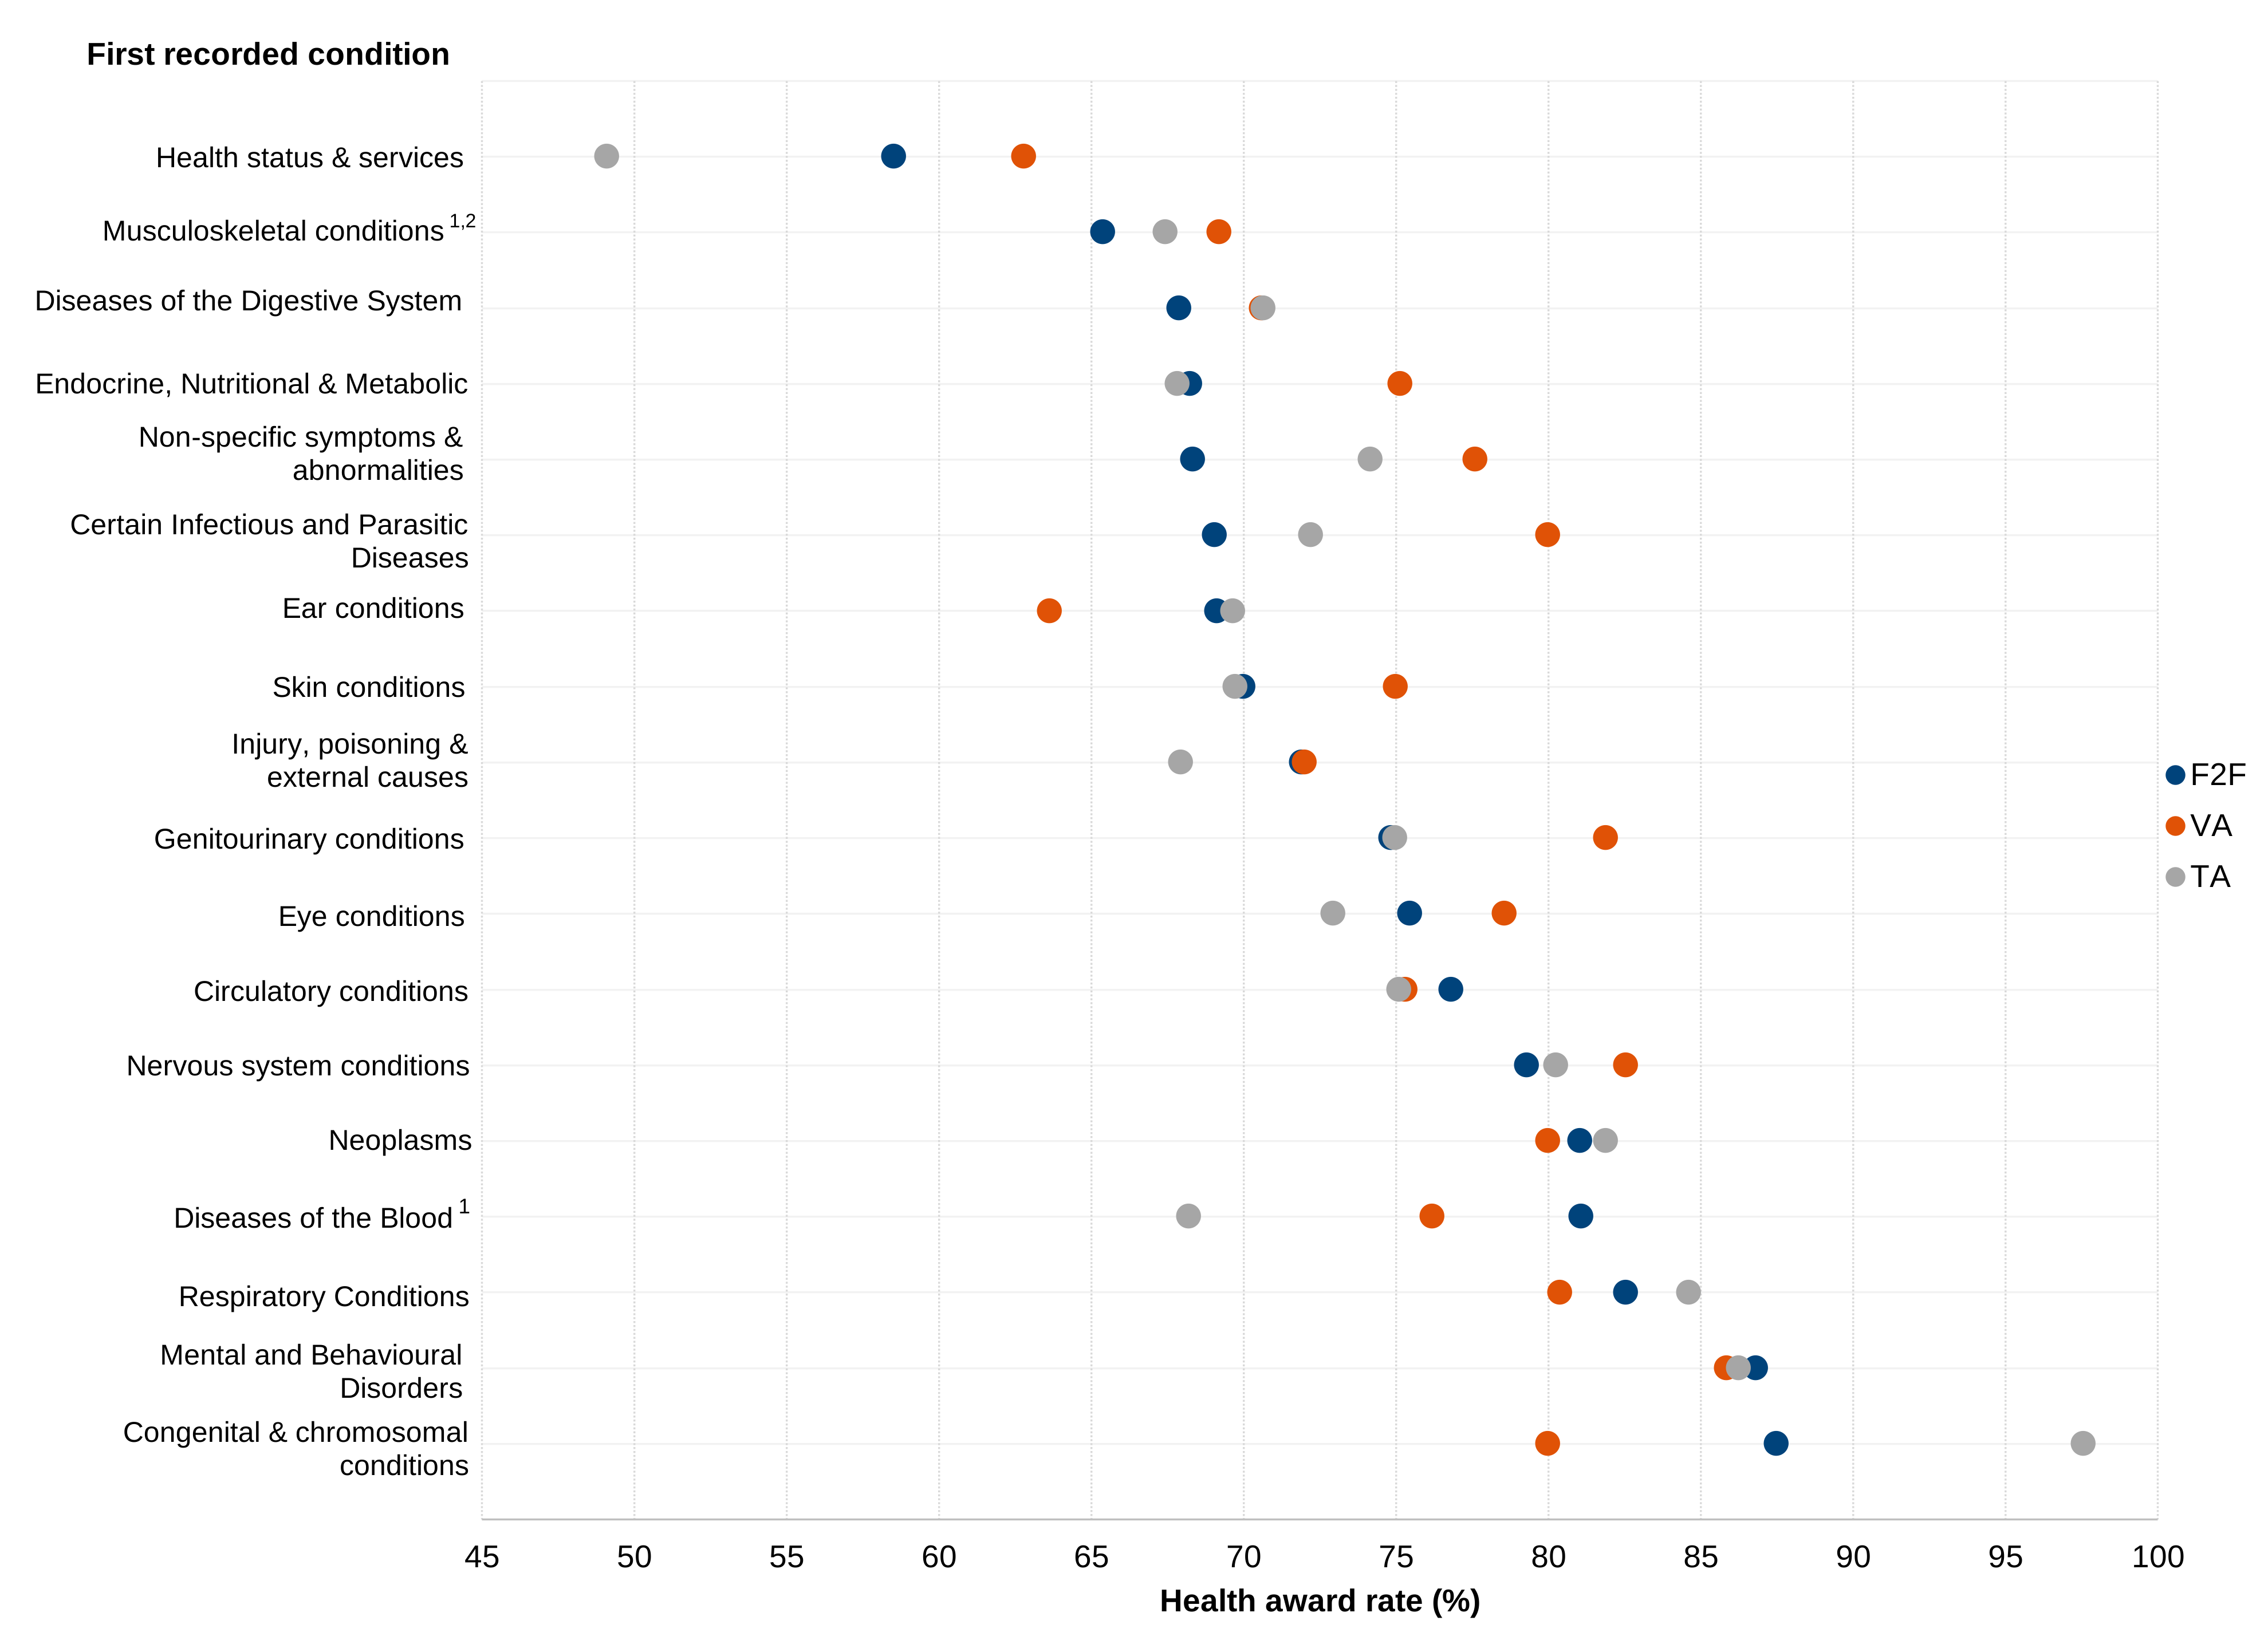
Figure 3.3.3 WCA health award by allocated channel and first recorded condition
¹ Indicates the comparison between F2F and TA is statistically significant at (or below) the .05 level.
² Indicates the comparison between F2F and VA is statistically significant at (or below) the .05 level.
Figure 3.3.3 shows health award (claimants given a LCWRA/SG or LCW/WRAG decision) rates by allocated channel and the first recorded ICD10 medical condition. Overall, there is limited evidence of a substantive relationship between allocated channel and health award rates by condition. For most condition groups, differences in award rates between channels were small and not statistically significant.
Two condition groups show statistically significant differences at the 5% level: “Diseases of the blood and blood forming organs and certain diseases involving the immune mechanism”, where F2F assessments had a statistically significant higher award rate than TA (81.1% compared to 68.2%), and “diseases of the musculoskeletal system and connective tissue”, where TA (67.4%) and VA (69.2%) both had a slightly higher award rate compared to F2F (65.4%).
However, in both cases, effect sizes remain small, suggesting these differences are not substantively meaningful.
Health award rates were generally consistent across channels for most conditions. Diseases of the blood and factors influencing health status and contact with health services showed the largest variance between channels. Health award rates were highest for mental and behavioural disorders and for congenital and chromosomal conditions.
Figure 3.3.4 WCA health award by allocated channel and gender
¹ Indicates the comparison between F2F and TA is statistically significant at (or below) the .05 level.
² Indicates the comparison between F2F and VA is statistically significant at (or below) the .05 level.
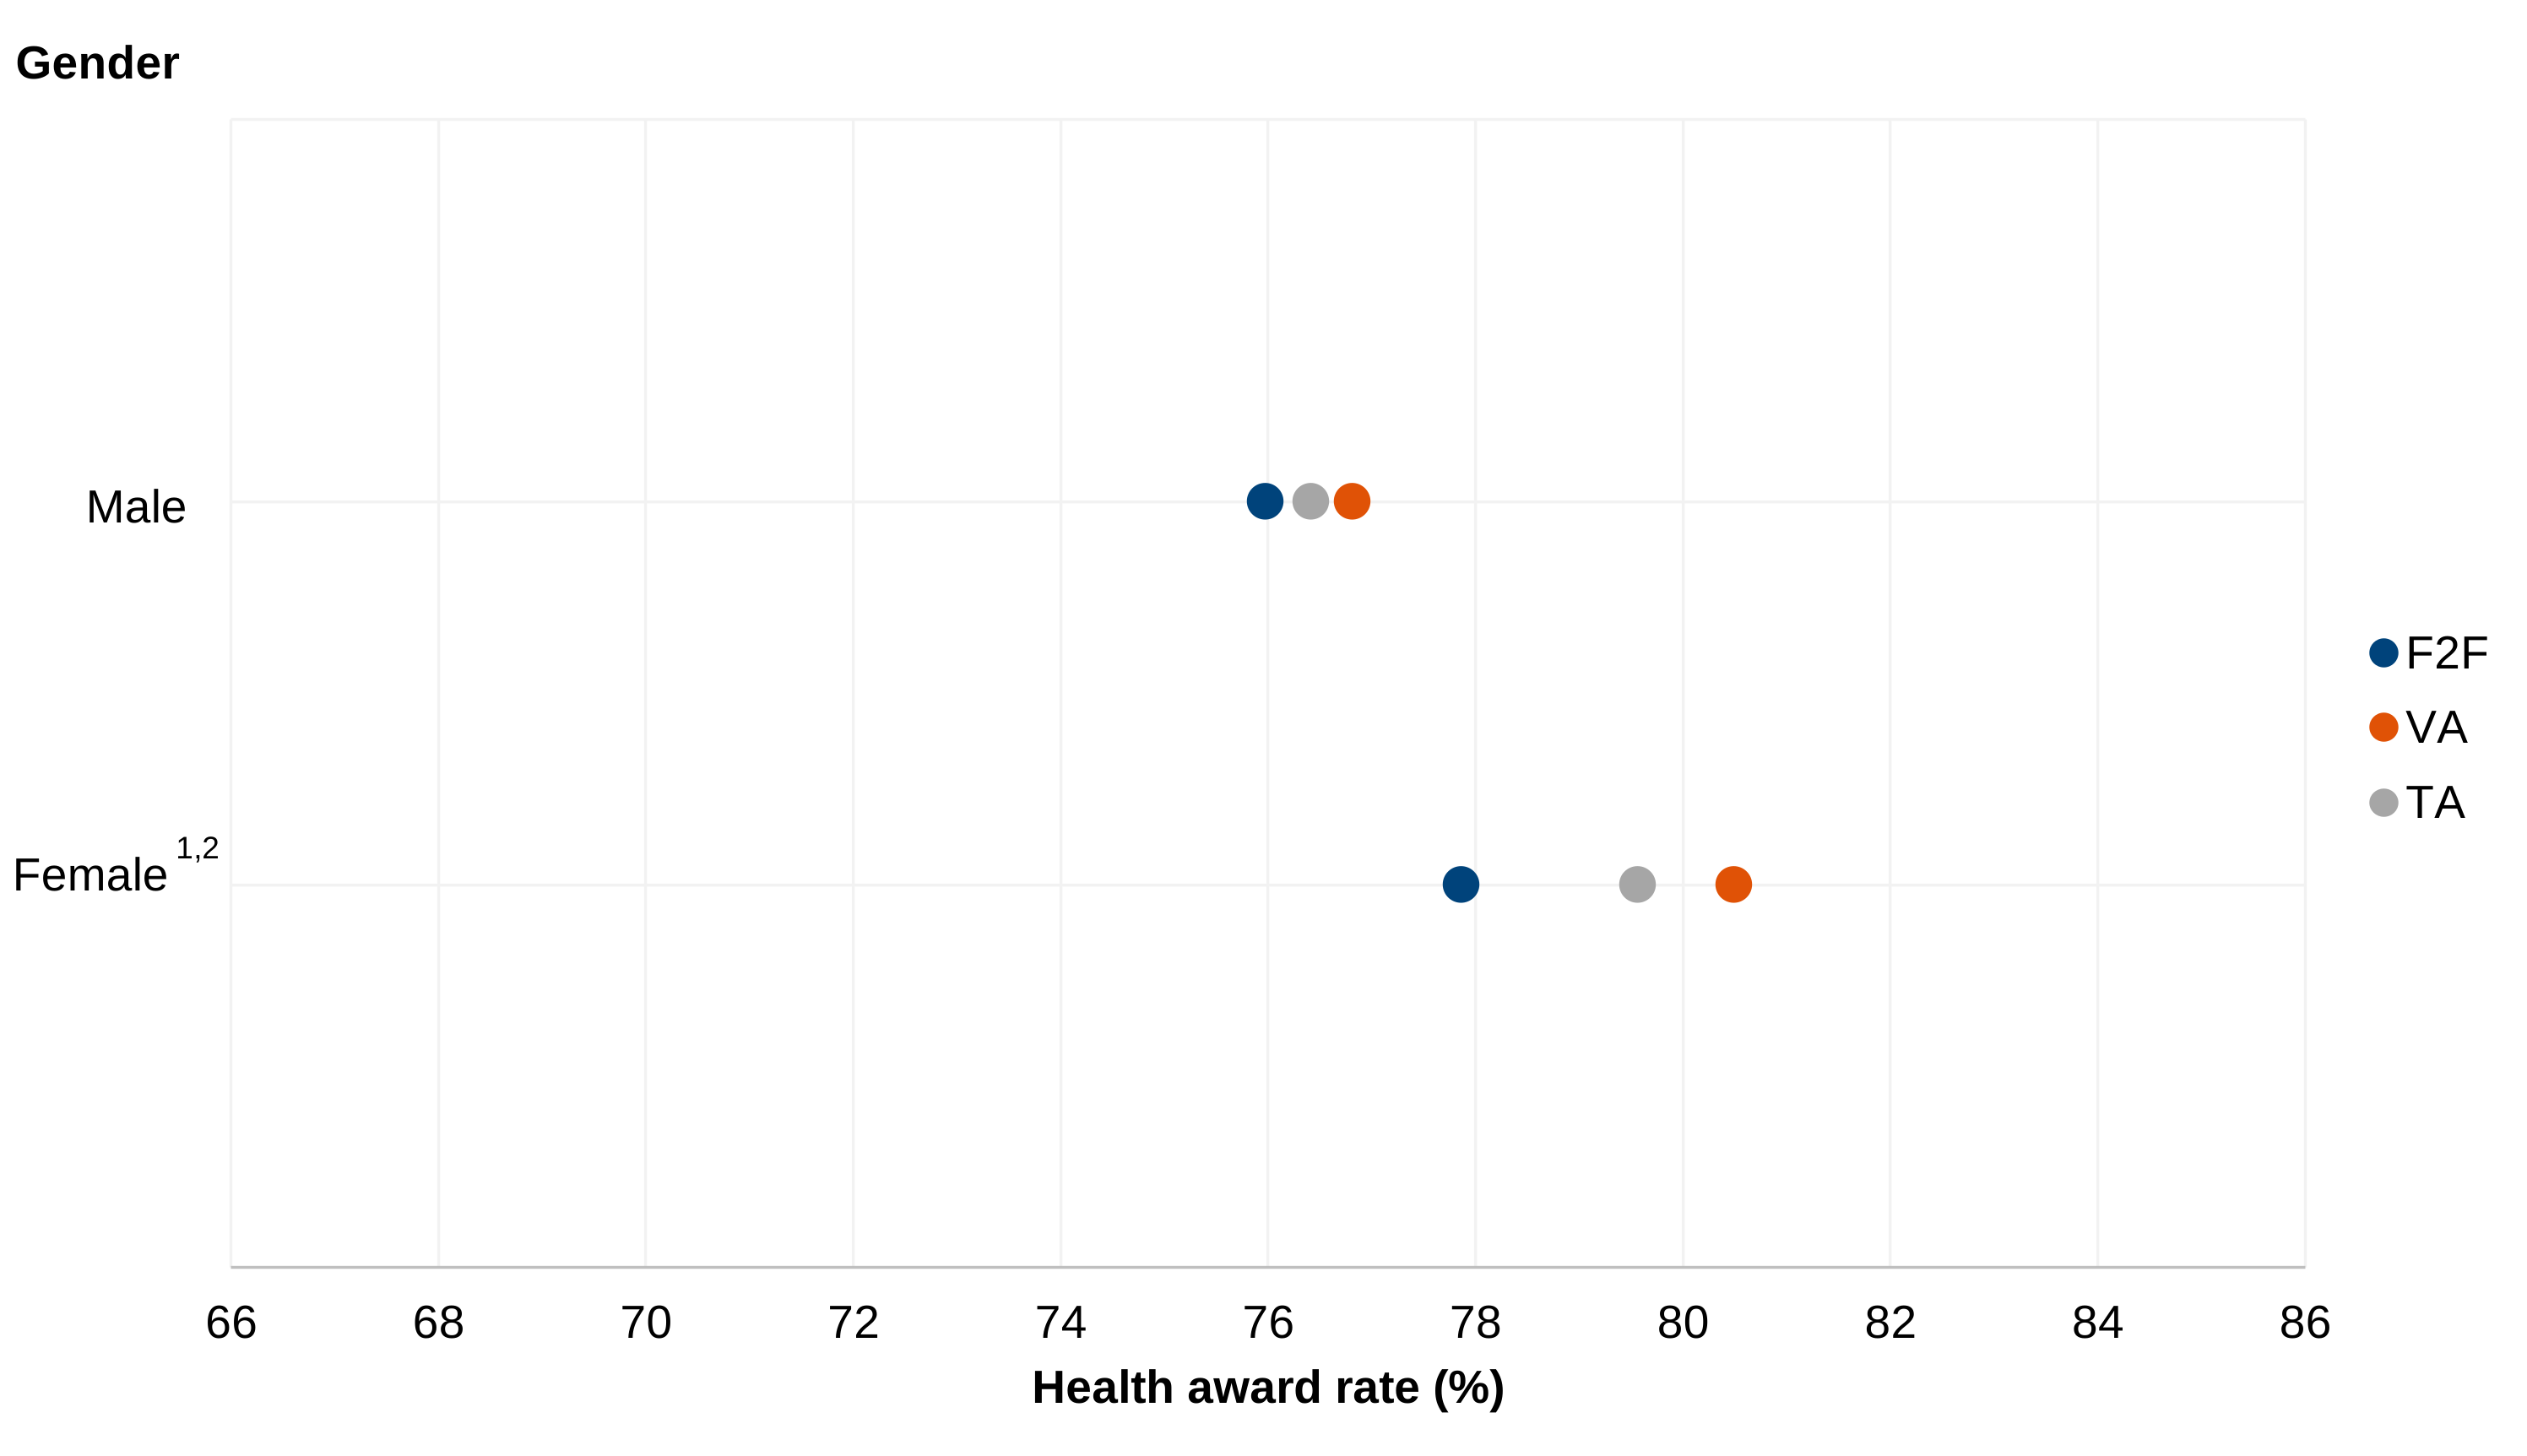
Figure 3.3.4 compares health award by allocated channel and gender. For females, health award rates were slightly higher for VA (80.5%) and for TA (79.6%), compared to F2F assessments (77.9%). These differences were statistically significant at the 5% level; however, effect sizes are very small, indicating a negligible association in practical terms.
For males, differences in award rates between channels are smaller, with award rates ranging from 76.0% for F2F, to 76.8% for VA, and 76.4% for TA. These differences were not statistically significant and are also associated with very small effect sizes. Overall, the results suggest that while there are minor variations in award rates by channel for females, there is no evidence of a meaningful relationship between assessment channel and health award by gender.
Figure 3.3.5 WCA health award by allocated channel and age group
¹ Indicates the comparison between F2F and TA is statistically significant at (or below) the .05 level.
² Indicates the comparison between F2F and VA is statistically significant at (or below) the .05 level.
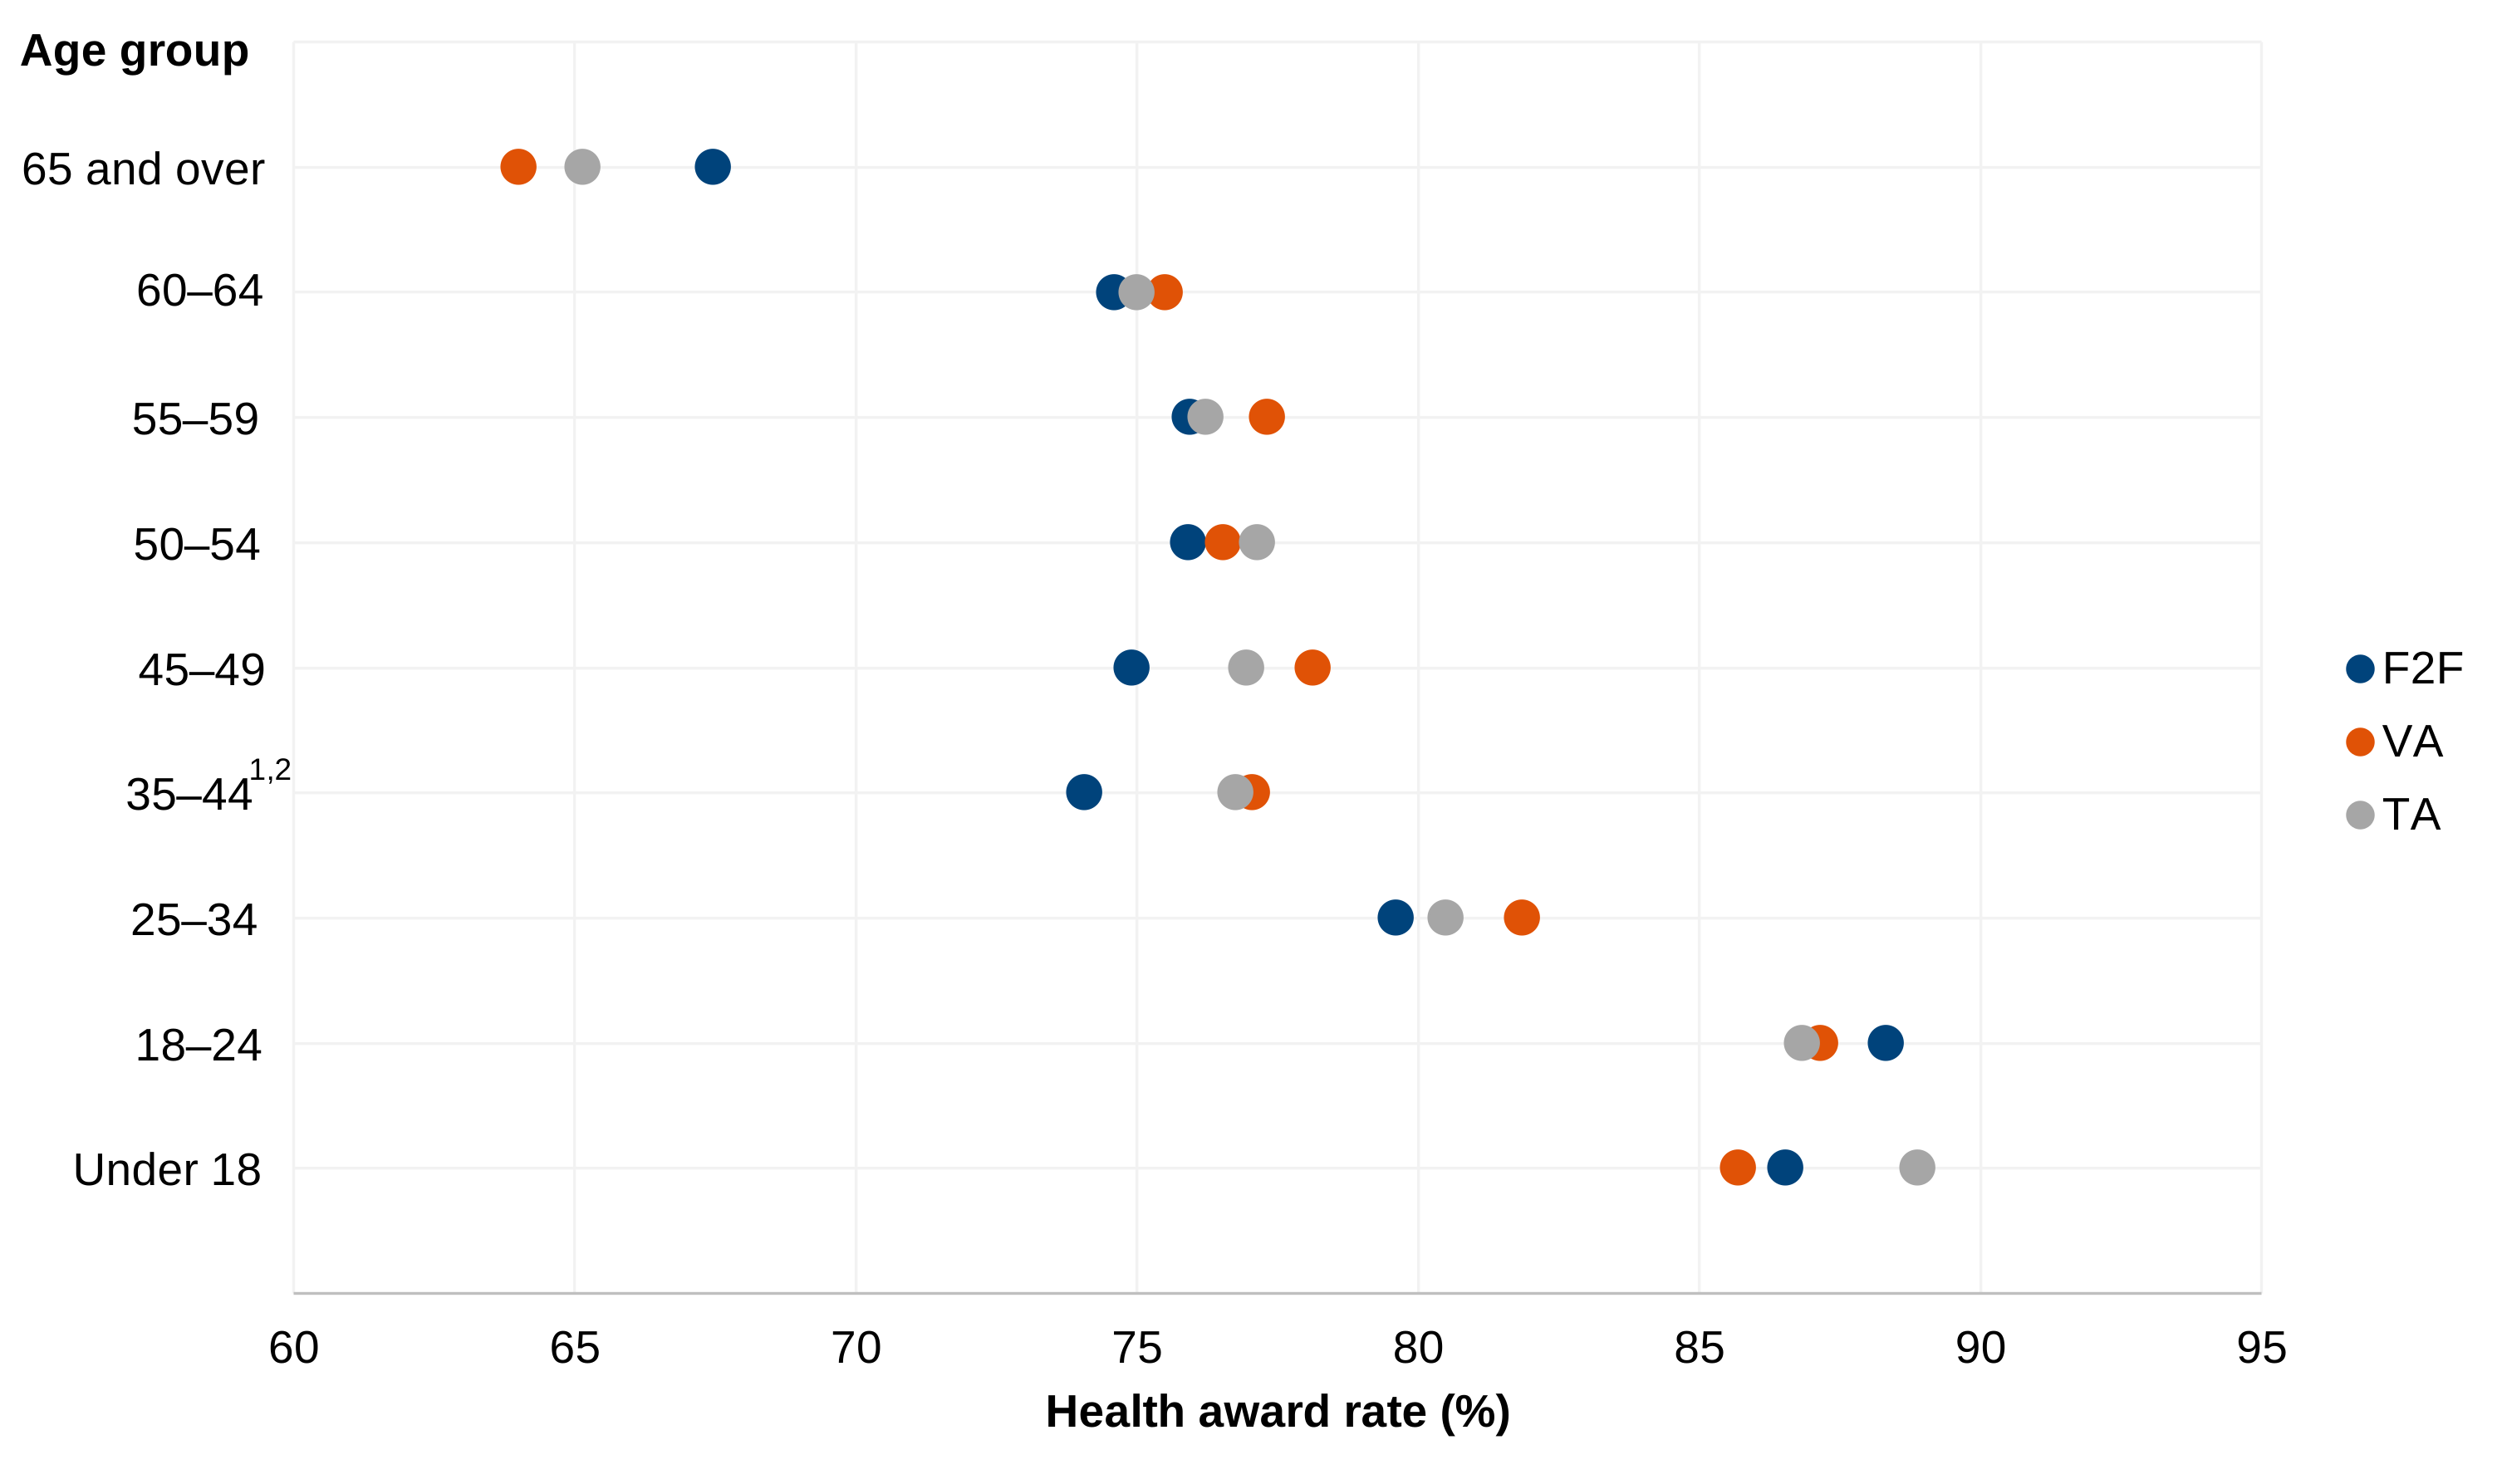
Figure 3.3.5 shows health award by allocated channel and age group. Health award rates generally decline as age increases, from around 86% to 88% for claimants under 25 to approximately 65% to 68% for claimants aged 65 and over. Differences between channels within age groups are small, typically within a few percentage points. Statistically significant differences are observed only for the 35 to 44 age group, where remote assessments have a slightly higher health award than F2F; however, effect sizes are very small, indicating negligible practical differences. Overall, there is no evidence of a meaningful relationship between allocated channel and health award by age.
All tables and statistical tests relating to award rates by WCA allocated channel are provided in the HACT Technical Annex, section D.
Prognosis period
Mean prognosis periods (a review period set by the Healthcare Professional indicating a date at which it might be beneficial to reassess the claimant) were similar by channel. F2F assessments were given a mean prognosis period of 21.02 months, VA were given 20.96 months, and TA were given 20.89 months. Although these results were statistically significant (see HACT Technical Annex, section D), the absolute differences were small.
Findings by attended channel
This section examines HACT WCAs by attended channel, and the breakdown of the decisions given. WCAs cover both ESA and UC.
Claimants who attended a F2F assessment were most likely to be considered Fit for Work or Capable to Work. They were closely followed by claimants that attended a VA and by claimants that attended a TA.
Almost all (96%) of WCAs that were trial eligible, had an outcome obtained (98,000).
Of the 21% that attended via F2F:
-
23% were considered FFW or CTW
-
17% were considered to have LCW or WRAG
-
60% were considered to have LCWRA or SG
Of the 8% that attended via VA:
-
21% were considered FFW or CTW
-
18% were considered to have LCW or WRAG
-
61% were considered to have LCWRA or SG
Of the 71% that attended via TA:
-
20% were considered FFW or CTW
-
21% were considered to have LCW or WRAG
-
58% were considered to have LCWRA or SG
Figure 3.3.6 WCAs by attended channel
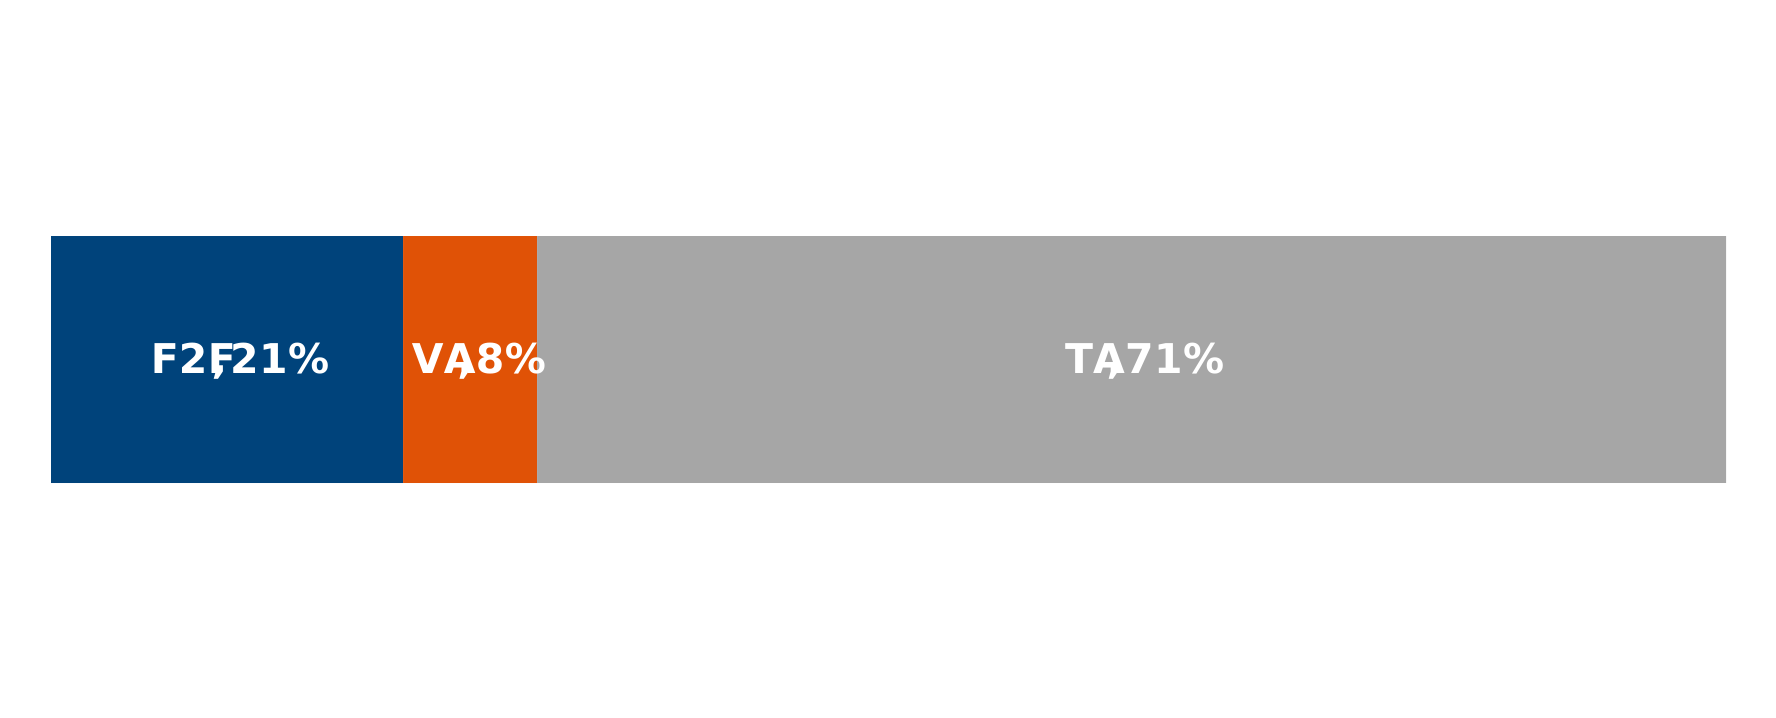
Figure 3.3.6 shows a horizontal stacked bar chart confirming that face-to-face assessments represented 21% of WCA attended channels, video assessments 8%, and telephone assessments 71%, with telephone making up the majority of the assessments.
WCA decisions
Proportions receiving a health‑related outcome (LCWRA/SG, LCW/WRAG) following a WCA were similar across attended channels. Claimants that attended TA or VA were marginally more likely to receive a health‑related outcome.
Figure 3.3.7 Attended channel by WCA decision
Percentages may not sum due to rounding.
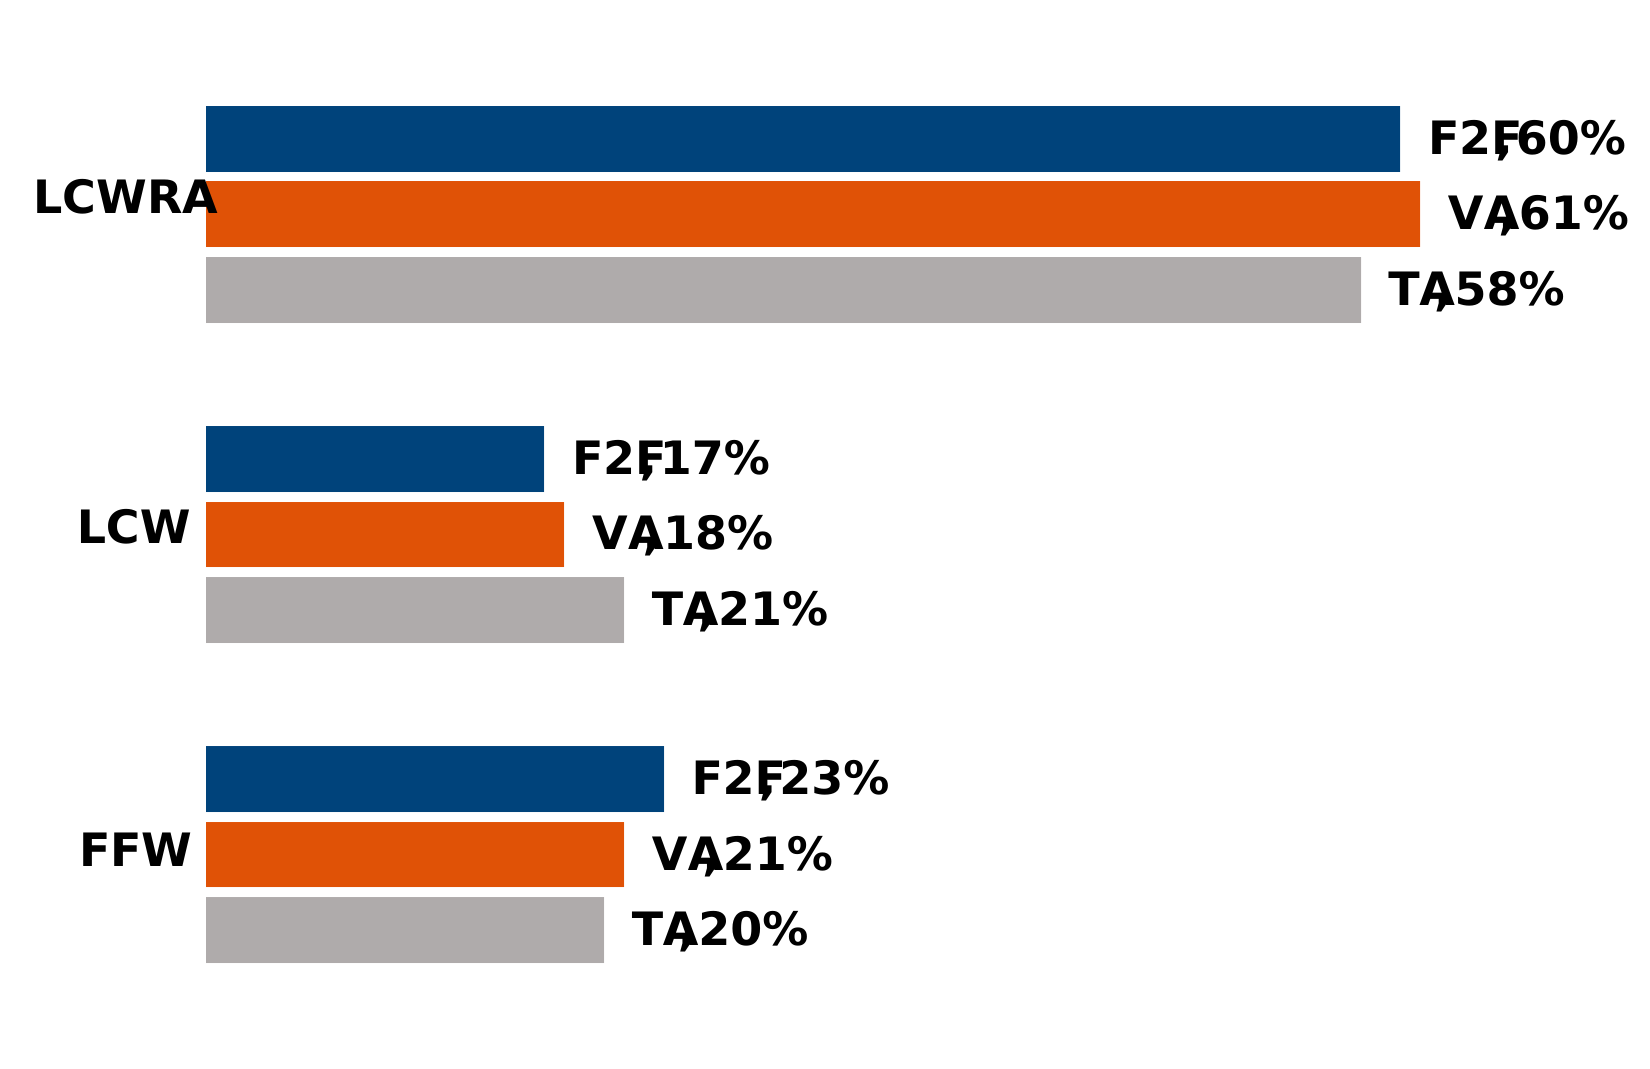
Figure 3.3.7 shows claimants that attended a face-to-face assessment were more likely to receive a Limited Capability for Work and Work-Related Activity award compared to claimants that attended a telephone assessment but were slightly less likely to receive the award compared to claimants that attended a video assessment. Claimants that attended a face-to-face assessment were as likely to receive a Limited Capability Work as claimants that attended a video assessment, but less likely than those that attended via telephone. Claimants that attended face-to-face assessments were slightly more likely to receive a Fit for Work/Capable to Work decision compared to those that attended a remote channel.
Prognosis period
Mean prognosis periods were similar by channel. F2F assessments were given a mean prognosis period of 21.01 months, VA were given 21.00 months, and TA were given 20.88 months.
Findings on channel changing
This section examines the channel that a claimant was allocated to and the channel they attended.
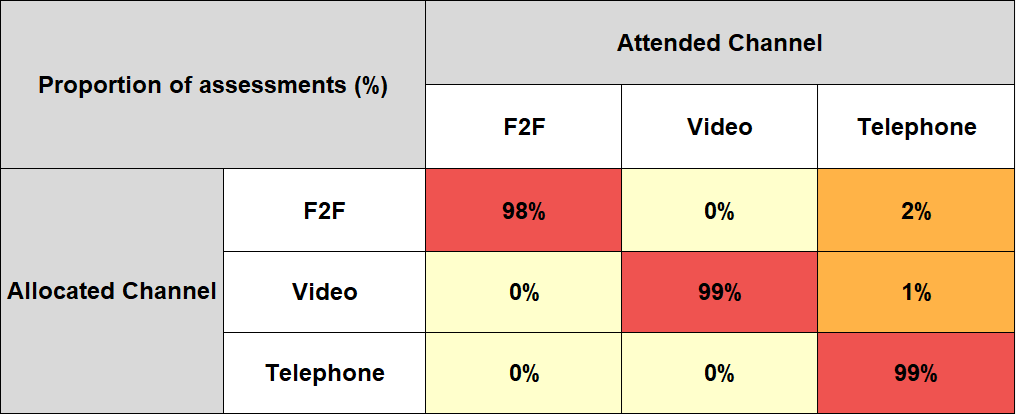
Of the 21,000 that were allocated to F2F:
-
98% attended a F2F assessment
-
2% attended a remote assessment channel instead
Of the 7,000 that were allocated to VA:
-
99% attended a VA channel
-
1% attended a F2F or TA assessment channel instead
Of the 70,000 that were allocated to TA:
-
99% attended a TA channel
-
1% attended a F2F or VA channel instead
Figure 3.3.8 Heat map showing channel change for WCA
Sample size: 98,392.
Percentages may not sum due to rounding.
Figure 3.3.8 shows an overwhelming majority of WCA claimants attended the same assessment channel they were originally allocated. If a claimant requested a change to the channel in which they were assessed, this tended to be towards a telephone assessment.
Characteristics of channel changers
Since only 1% of claimants opted for a different channel (around 1,000 claimants) to the one allocated to them, we could not obtain comprehensive results from statistical tests and therefore have not included them in this report.
4. Conclusions
The Health Assessment Channels Trial was designed to test whether the channel through which a health assessment is conducted influences benefit outcomes. Across more than 350,000 eligible PIP assessments and WCAs, the findings provide little evidence that face-to-face, telephone and video assessments produce materially different award outcomes. While some statistically significant differences were observed, these were generally small in magnitude and were not associated with meaningful differences in benefit expenditure or claimant outcomes.
The trial design enabled claimants to be allocated to channels in a way that was random, or sufficiently close to random, among those eligible for all 3 channels for an initial health assessment. Standardised mean difference testing demonstrated that the allocation process did not introduce observable bias, strengthening confidence that observed differences between allocated channels were not primarily explained by measured differences in claimant characteristics.
Although claimants were able to change channel, channel changing was relatively uncommon and did not alter the overall conclusions. Claimants who changed channel tended to receive higher awards irrespective of the channel they were ultimately assessed in, indicating that differences observed when analysing attended channel are largely attributable to selection effects rather than the assessment channel itself.
Equality analyses identified small differences in the distribution of some claimant characteristics across channels. However, these differences were generally modest in scale and should be interpreted in the context of operational routing and reasonable adjustments. The evidence does not indicate that assessment channels systematically disadvantage particular groups in terms of award outcomes.
Taken together, the findings suggest that telephone and video assessments can achieve outcomes that are broadly comparable to those observed through face-to-face assessments for claimants eligible for all 3 channels. The evidence from HACT therefore supports the conclusion that assessment outcomes are largely independent of channel and are driven more by claimant circumstances than by the mode of assessment itself.
It is important to interpret these findings in the context of the period in which the trial was conducted. Since HACT took place, the distribution of outcomes across assessment channels has diverged to some extent, reflecting changes in claimant behaviour, operational processes, channel usage, and the wider assessment environment. As a result, a replication of the trial under current conditions may not necessarily produce identical estimates of channel effects. However, the trial’s allocation design, which produced broadly comparable groups across observable characteristics, provides robust evidence on the relationship between channel and assessment outcomes during the trial period.