Giardia data 2008 to 2017
Updated 8 April 2026

© Crown copyright 2026
This publication is licensed under the terms of the Open Government Licence v3.0 except where otherwise stated. To view this licence, visit nationalarchives.gov.uk/doc/open-government-licence/version/3 or write to the Information Policy Team, The National Archives, Kew, London TW9 4DU, or email: psi@nationalarchives.gov.uk.
Where we have identified any third party copyright information you will need to obtain permission from the copyright holders concerned.
This publication is available at https://www.gov.uk/government/publications/giardia-national-laboratory-data/giardia-data-2008-to-2017
1. Main points for 2017
The number of Giardia reports has increased year on year since 2013. This increase is largely attributable to the increased use of molecular or antigen-based diagnostic methods by front line diagnostic laboratories.
The region with the highest number of Giardia spp laboratory reports was the South West of England with 1,116 laboratory reports.
The South West of England had the highest rate of Giardia laboratory reports per 100,000 population in England and Wales with 20.1 laboratory reports per 100,000 population.
Reporting numbers were highest for males aged 45 to 49 in 2017.
In 2017, the peak month for Giardia reporting was September, in keeping with the average seasonal variation seen in the period 2012 to 2016.
There were 2 non-foodborne outbreaks of Giardia reported in England and Wales during 2017.
2. Giardia data, 2008 to 2017
All data presented in this report are correct as of 30 July 2018.
2.1 Annual data: 2008 to 2017
Table 1: annual laboratory reports of Giardia in England and Wales 2008 to 2017[footnote 1]
| Year | Number of laboratory reports | per 100,000 population |
|---|---|---|
| 2008 | 3,342 | 6.1 |
| 2009 | 3,501 | 6.3 |
| 2010 | 3,858 | 6.9 |
| 2011 | 3,697 | 6.6 |
| 2012 | 3,902 | 6.9 |
| 2013 | 3,622 | 6.4 |
| 2014 | 4,039 | 7.0 |
| 2015 | 4,390 | 7.6 |
| 2016 | 4,492 | 7.7 |
| 2017 | 4,793 | 8.2 |
Figure 1: annual laboratory reports of Giardia in England and Wales (2008 to 2017)
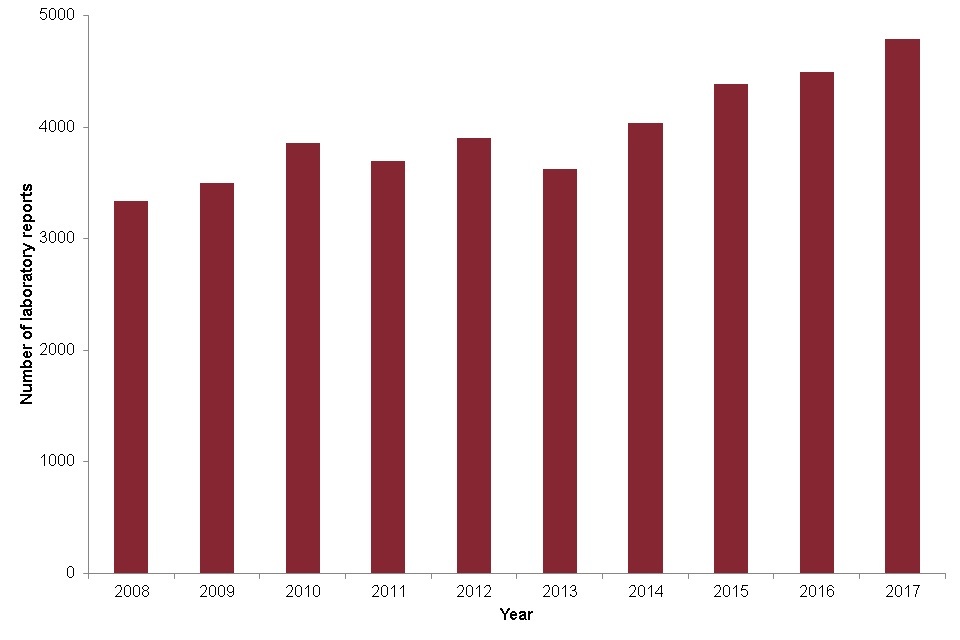
A bar graph showing the number of laboratory reports each year.
2.2 Regional data: 2017
Table 2: regional distribution[footnote 2] of laboratory reports of Giardia in England and Wales: 2017
| Country | Region | Number of laboratory reports | per 100,000 population |
|---|---|---|---|
| England | East Midlands | 338 | 7.1 |
| England | East of England | 366 | 5.9 |
| England | London | 456 | 5.2 |
| England | North East | 315 | 11.9 |
| England | North West | 342 | 4.7 |
| England | South East | 1,062 | 11.7 |
| England | South West | 1,116 | 20.1 |
| England | Yorkshire and The Humber | 310 | 5.7 |
| England | West Midlands | 392 | 6.7 |
| Wales | Wales | 96 | 3.1 |
2.3 Age and sex distribution: 2017
Figure 2: age and sex distribution of laboratory reports of Giardia reported in England and Wales 2017[footnote 3].
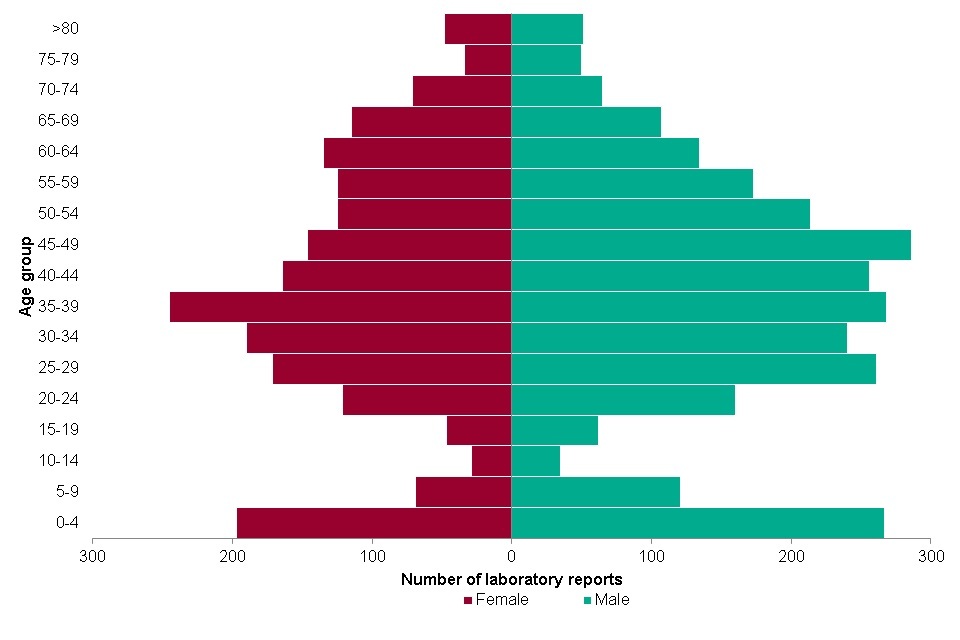
A bar graph showing the number of laboratory reports in 2017 by age and sex.
2.4 Seasonal variation: 2012 to 2017
Figure 3: Number of laboratory reports of Giardia in England and Wales by week in 2017, and average number of reports by week in 2012 to 2016.
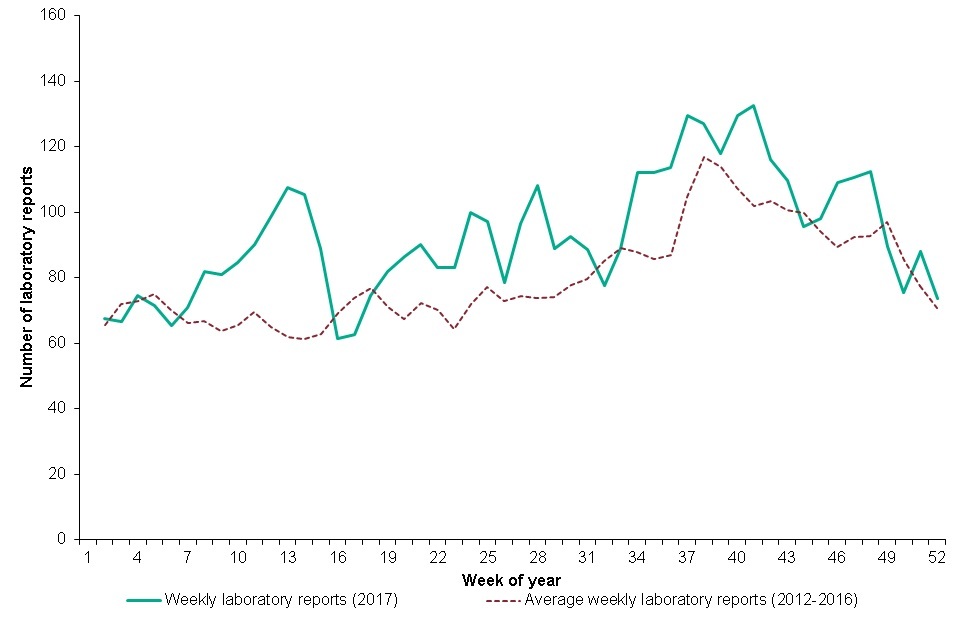
A line graph showing the seasonal trend of Giardia infections in 2017 and the previous five-year average.
2.5 Outbreak data: 2017
In 2017, there were no foodborne outbreaks of Giardia reported in England and Wales, however there were 2 non-foodborne outbreaks reported.
Table 3: non-foodborne outbreaks of Giardia reported in England and Wales 2017
| Agent | Total affected | Laboratory confirmed | Hospitalised | Deaths | Setting | Food description |
|---|---|---|---|---|---|---|
| Giardia lamblia | 4 | 4 | 0 | 0 | Swimming pool | No food identified |
| Giardia lamblia | 3 | 3 | 0 | 0 | Swimming pool | No food identified |
3. Data source
Public Health England (PHE) Second Generation Surveillance System (SGSS). This is a live laboratory reporting system, therefore numbers may fluctuate. Data provided in this report are new extractions from this system and provide updated figures to previously published reports.
In 2014, PHE upgraded the laboratory reporting system so direct comparisons between data reported from the previous system (LabBase2) and the new system (SGSS) may require cautious interpretation.
4. Acknowledgements
We are grateful to:
- the microbiologists, local authorities and local health protection and environmental health specialists who have contributed data and reports to national surveillance systems
- the epidemiologists and information officers who have worked on the national surveillance of gastrointestinal (GI) infectious diseases
- colleagues in the Gastrointestinal Bacterial Reference Unit (GBRU) for providing the Reference Laboratory Services and laboratory surveillance functions and expertise
- the PHE Information Management Department for maintenance and quality assurance of PHE national surveillance databases for GI diseases
- PHE Local Public Health Laboratories and Food Water and Environmental Microbiology Services for providing a surveillance function for GI pathogens and testing of food and environmental samples routinely and during outbreak investigation
- PHE National Parasitology Reference Laboratory, Department of Clinical Parasitology, University College London Hospital NHS Foundation Trust for their expertise
-
Incidence rates were calculated using the Office for National Statistics (ONS) mid-year population estimates for each respective year. ↩
-
Regional classification based on place of residence of laboratory reports and classified using Nomenclature of Territorial Units for Statistics 1 (NUTS 1) codes. Incidence rates were calculated using the Office for National Statistics (ONS) mid-year population estimates for each region. ↩
-
For laboratory reports where age and sex data were available. There were 11 laboratory reports with unknown data recorded. ↩