Gender Pay Gap Information Regulations 2017: summary of reported data for 2017/18
Published 24 October 2018

© Crown copyright 2018
This publication is licensed under the terms of the Open Government Licence v3.0 except where otherwise stated. To view this licence, visit nationalarchives.gov.uk/doc/open-government-licence/version/3 or write to the Information Policy Team, The National Archives, Kew, London TW9 4DU, or email: psi@nationalarchives.gov.uk.
Where we have identified any third party copyright information you will need to obtain permission from the copyright holders concerned.
This publication is available at https://www.gov.uk/government/publications/gender-pay-gap-information-regulations-summary-of-201718-data/gender-pay-gap-information-regulations-2017-summary-of-reported-data-for-201718
Gender Pay Gap Information Regulations 2017
Summary of reported data for 2017/18
October 2018
Executive summary
The gender pay gap (GPG) is the difference in the average hourly wage of all men and women across a workforce. If women do more of the less well paid jobs within an organisation than men, the gender pay gap is usually bigger.
From spring 2017, employers with 250 or more employees in England, Wales and Scotland are legally required to report annually on the gender pay gap within their organisation both on their own website, and via a dedicated governmental reporting portal.
This report summarises the data that employers reported under the first year of the regulations, along with findings from related research conducted by the Government Equalities Office (GEO).
Main findings
Overall employer compliance with the regulations stands at 100% of identified organisations as of 1 August 2018. At the deadline, 94% of employers had complied (96% of public sector organisations, and 93% of private sector organisations).
-
77% of reported median GPGs were positive, 14% were negative, and 9% of employers reported a median GPG of 0%.
-
88% of reported mean GPGs were positive, 12% were negative, and 1% of employers reported a mean GPG of 0%.
-
53% of reported median bonus gaps were positive, 15% were negative, and 33% of employers reported a median bonus gap of 0%.
-
62% of reported mean gender pay gaps were positive, 14% were negative, and 24% of employers reported a median bonus gap of 0%.
While 57% of employers have more women than men among their lowest paid employees, only 33% have more women than men among their highest paid employees.
As of May 2018, 48% of in-scope employers had published an action plan outlining how they intend to tackle their GPG.
Employers reported some difficulty collating the data required to make GPG calculations in the first year, but the majority found it easy to register and input their data on the GPG reporting service.
- 28% said it had been ‘very easy’ or ‘easy’ to gather the data required to make the GPG calculations, 35% said it had been ‘difficult’ or ‘very difficult’
- 40% said it had been ‘very easy’ or ‘easy’ to make the GPG calculations, while 17% said it had been ‘difficult’ or ‘very difficult’
- 87% said it had been ‘very easy’ or ‘easy’ to register with the GPG Reporting Service, while 6% said it had been ‘difficult’ or ‘very difficult’
- 95% said it had been ‘very easy’ or ‘easy’ to input their data, 1% said it had been ‘difficult’, and none said it had been ‘very difficult’
Background
The gender pay gap (GPG) is the difference in the average hourly wage of all men and women across a workforce. If women do more of the less well paid jobs within an organisation than men, the gender pay gap is usually bigger.
From spring 2017, employers with 250 or more employees in England, Wales and Scotland are legally required to report annually on the GPG within their organisation both on their own website, and via a dedicated governmental reporting portal. This report summarises the data reported under the first year of the regulations, along with findings from related research conducted by GEO, including:
- employer compliance with the regulations
- distributions of reported metrics by industry and employer size
- estimates of the proportion of employers producing an action plan to tackle their GPG
- results from a survey undertaken with employers reporting data on the GPG reporting service
There are different regulations covering employers in the public sector and those in the private and voluntary sectors.
Public sector
Most public sector employers must follow the Equality Act 2010 (Specific Duties and Public Authorities) Regulations 2017. This includes most government departments, the armed forces, local authorities, NHS bodies, maintained schools and academy trusts and universities. The full list can be found in schedule 2 of the regulations. If a public sector employer listed in schedule 2 has 250 or more staff on 31 March, then they must publish their data by 30 March of the following year.
Private and voluntary sector
Private and voluntary sector employers must follow the Equality Act 2010 (Gender Pay Gap Information) Regulations 2017. Public sector employers not listed in schedule 2 above must also follow these regulations. If a private or voluntary sector employer (or a public sector employer not listed in schedule 2) has 250 or more employees on 5 April, they must publish their data by 4 April of the following year.
Measures used
The regulations require in-scope employers to report on 14 distinct metrics.
Table 1: Metrics required under GPG Information Regulations 2017
Difference in hourly rate – median gender pay gap
The gap in the median hourly rate of pay between male and female employees expressed as a percentage: (A minus B) divided by A, then multiplied by 100. Where ‘A’ is the median hourly rate of pay of all male relevant employees, and ‘B’ is the median hourly rate of pay of all female relevant employees.
Difference in hourly rate – mean gender pay gap
As median gender pay gap, but taking the gap in the mean hourly rate of pay between male and female employees instead of the median.
Proportion of men and women in each pay quartile
To calculate the quartiles, employers must sort their employees according to hourly pay, and then split them into 4 equal groups (‘pay quartiles’). They are then required to report on the proportions of men and women in each pay quartile.
Proportion of men and women receiving bonus pay
The proportion of employees receiving a bonus, split by gender. Bonuses include anything that relates to profit sharing, productivity, performance, incentive and commission. They must be received in the form of cash, vouchers, securities, securities options, and interests.
Difference in bonus pay: median bonus pay gap
As ‘Difference in hourly rate’, but bonus pay is treated as annual, rather than hourly. Note that only employees receiving bonus pay are included in the calculations.
Difference in bonus pay: mean bonus pay gap
As median bonus pay gap, but taking the gap in the mean annual bonus pay between male and female employees instead of the median.
More details on these measures are provided in the GEO/Acas guidance, Managing Gender Pay Gap Reporting (PDF).
Private and voluntary sector employers (and public sector employers not listed in Schedule 2 of the regulations) must also publish a written statement on their own website. The statement must confirm that the published information is accurate and must be signed by an appropriate senior person. The name and job title of that person must be published on this website.
Median and mean GPG measures
Employers are required to report both their median and mean GPG.
The median measure requires employers to sort all their male and female employees in order of hourly earnings, take the middle employee from each list, and compare their earnings. This is useful, because they show the typical situation in the organisation – a small number of very highly paid men or women would not greatly distort the numbers. However, this could also be a shortcoming, as it would not show inequalities at the highest and lowest levels.
The mean measure requires employers to add up the hourly rate of all their male and female employees, and divide each total by the number of employees. This is useful as it places the same value on every employee’s earnings. However, the value could be distorted, particularly by employees on very high pay (the National Living Wage is likely to reduce the level of variance at the lowest levels of pay).
Considering both values together is useful in understanding the pay situation within any given employer.
Data
This report makes use of 2 main sources of data:
- the figures reported by employers and now available on the gender pay gap viewing service
- the Annual Survey of Hours and Earnings (ASHE)
In addition, further research was undertaken in May to July 2018 to quantify the number of employers producing action plans to tackle their GPG, and to understand employer experiences in reporting their GPG data. Details of the methodologies employed are provided later in this report.
Gender pay gap viewing service
All data reported by employers are available online at the gender pay gap viewing service. Reports can be viewed for individual employers for each reporting year, and the data for all employers across each reporting year are also available as a compiled data table.
The viewing service includes all 14 gender pay gap metrics for each employer (see Table 1), as well as the variables listed in Table 2.
Table 2: Additional employer data available on GPG viewing service
Company, mutual or charity number
Optional.
Sector (public, or private and voluntary)
Compulsory.
Industry
Optional. For organisations with a company number, this is automatically populated as Companies House Standard Industrial Classification (SIC) – note that the accuracy of this data is reliant on organisations keeping their Companies House record up-to-date. Where employers have entered multiple SIC codes, the analysis in this report has used the first displayed code to classify industry. For public sector employers which do not have company numbers, this has been manually assigned for all in-scope.
Name and job title of the individual responsible for reporting
Compulsory only for private and voluntary sector employers, and public sector employers not named in Schedule 2 of the regulations.
Organisation address
Not mandatory, but required in order to register on the portal. This is likely to be the address of the employer’s head office, or the office location of the individual reporting. It may not be representative of the geographical spread of that employer’s workforce.
Number of employees
Optional. Banded as follows:
- less than 250
- 250 to 499
- 500 to 999
- 1,000 to 4,999
- 5,000 to 19,999
- 20,000 and above
Date by which the employer was required to report
Compulsory, automatically populated based on sector.
Date of reporting
Compulsory, automatically populated.
Whether the employer reported on time
Compulsory, automatically populated.
Link to narrative report
Optional. Employers were given the opportunity to provide a narrative explaining the reason for any GPG within their organisation.
All GPG metrics provided on the viewing service are self-reported, and employers are responsible for the accuracy of data provided. Where employers reported statistically unlikely data (for example, mean and median gender pay gaps of zero), they were contacted and asked to check their submission.
The Equality and Human Rights Commission are responsible for investigating breaches of the regulations, which includes the submission of inaccurate data, and have published their enforcement strategy. Employers can adjust their reported data for 2017/18; this report is based upon data extracted from the portal at 24 October 2018, but this remains subject to change.
Annual Survey of Hours and Earnings (ASHE)
The Annual Survey of Hours and Earnings (ASHE) is the main data source used to quantify the GPG in the UK. ASHE is a survey based on a 1% sample of UK employees and is the most comprehensive source of information on the structure and distribution of earnings in the UK. More information on ASHE can be found on the Office for National Statistics website, along with results from the most recent ASHE release (2017).
In this report, we use ASHE data to provide sector level estimates of the gender pay gap for in-scope employers, offering additional context to the reported data.
Differences between GPG viewing service and ASHE data
The data on the GPG viewing service and those available by ASHE are structured differently, which result in differences in the figures produced. There are 2 main differences:
- The main ASHE GPG estimates include all employers, not just those in scope for these regulations (those with 250 or more employees). To counter this issue, industry GPG estimates have been produced for this report that include only those working for an in-scope employer. However, please note that the figures in this report will therefore not match other published industry-level GPG estimates.
- GPG viewing service data is reported at the employer level, while ASHE data is reported at the employee level. Effectively, the viewing service data considers employees in clusters (grouped by employer), whereas ASHE data considers them as one large group. The way in which those clusters occur is a function of the structure of the economy.
This is important in considering how the data can be analysed. To take an average of GPGs of employers in a given industry would not give the same result as the ASHE data for that industry, as the way in which employees are clustered will distort the picture.
Consider the following simplified example, of an industry restricted to 2 employers.
Firm A has 250 employees and a GPG of 25%.
Firm B has 5,000 employees and a GPG of 5%.
The sector (comprising Firms A and B) has 5,250 employees and a GPG of 7%.
Averaging the GPGs of Firms A and B would give a sector GPG of 15% (25% plus 5% = 30%, divided by 2 to get an average). However, the overall sector GPG will be much closer to Firm B’s GPG of 5%, as Firm B is much larger than Firm A.
For this reason, when analysing viewing service data, this report does not include averages across firms, but instead reports on the distribution of reported GPGs, for example, highest and lowest reported values, and midpoints.
For sector and economy level GPG analysis, ASHE is the most reliable source. For employer level GPG data, the viewing service data is the only known source.
Reported data
Employer compliance with the GPG Information Regulations 2017
Table 3 shows the numbers and proportions of employers complying with the regulations, split by sector (as defined within the regulations).
Table 3: Employer compliance with regulations by sector
| Sector | Estimated number of organisations in scope for regulations | Number (%) of employers complying by deadline | Number (%) of employers complying after deadline | Total (%) of compliant employers |
| Public | 1,629 | 1,567 (96%) | 62 (4%) | 1,629 (100%) |
| Private and voluntary | 8,623 | 8,025 (93%) | 598 (7%) | 8,623 (100%) |
| Total | 10,252 | 9,592 (94%) | 660 (6%) | 10,252 (100%) |
Note: Figures correct as at 23 October 2018. The number of in-scope organisations was initially estimated by cross-checking the BEIS Business Population Estimate with additional sources. GEO then worked with individual employers to establish if they were in scope on the snapshot date.
In addition, 281 employers that were not in scope for the regulations opted in to reporting their GPG data. Of these, 227 were from the private and voluntary sectors, and 54 were from the public sector.
Overall, 10,533 employers submitted data in the 2017/18 reporting year.
Figure 1 shows in-scope employer compliance by week of reporting, up to the final reporting deadline. A large proportion of employers reported towards the end of the compliance period.
Of those reporting on time:
- 1,313 (84%) of in-scope public sector employers reported in the final 30 days (to 30 March 2018), and 744 (47%) did so in the final week
- 6,949 (87%) of in-scope private and voluntary sector employers reported in the final 30 days (to 4 April 2018), and 3,843 (48%) did so in the final week
Figure 1: Employer compliance with regulations by week of reporting
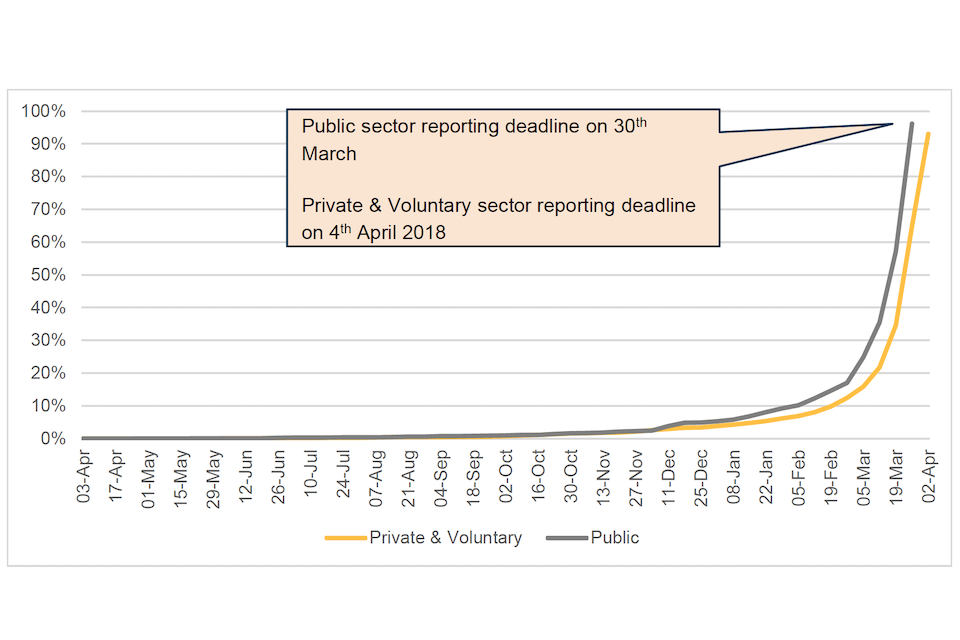
n = 9,593. Includes only in-scope employers reporting before the compliance deadline.
Distribution of reported gender pay gaps
Figures 2 and 3 show the distribution of median and mean reported GPGs. A positive gap means that men are paid more than women on that measure.
- 77% of reported median GPGs were positive, 14% were negative, and 9% of employers reported a median GPG of 0%
- 88% of reported mean GPGs were positive, 12% were negative, and 1% of employers reported a mean GPG of 0%
There are a higher proportion of median bonus gaps of 0% among the reported figures than might have been expected, particularly given that figures are required to be reported to one decimal place. These could be legitimate; for the median, in particular, this could occur in a firm where over half of the lowest paid women and men are on the same rate of pay (for example, the National Living Wage). However, some gaps of 0% may be the result of miscalculated or misreported data.
All GPG metrics provided on the viewing service are self-reported, and employers are responsible for the accuracy of data provided. Where employers reported statistically unlikely data (for example, mean and median gender pay gaps of zero), they were contacted and asked to check their submission. The Equality and Human Rights Commission are responsible for investigating breaches of the regulations, which includes the submission of inaccurate data, and have published their enforcement strategy.
Figure 2: Distribution of reported median GPGs
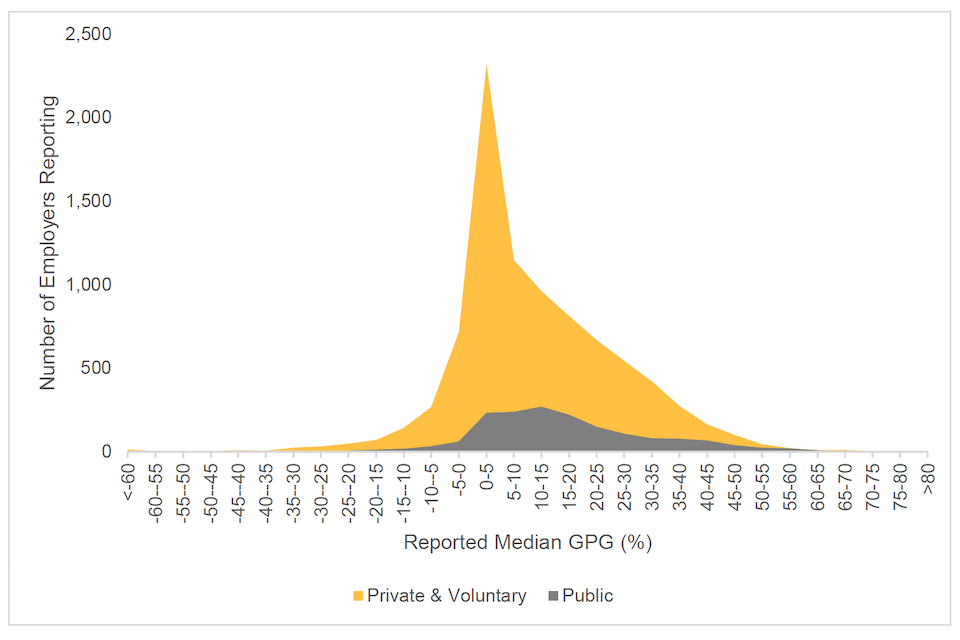
n = 10,533
Figure 3: Distribution of reported mean GPGs
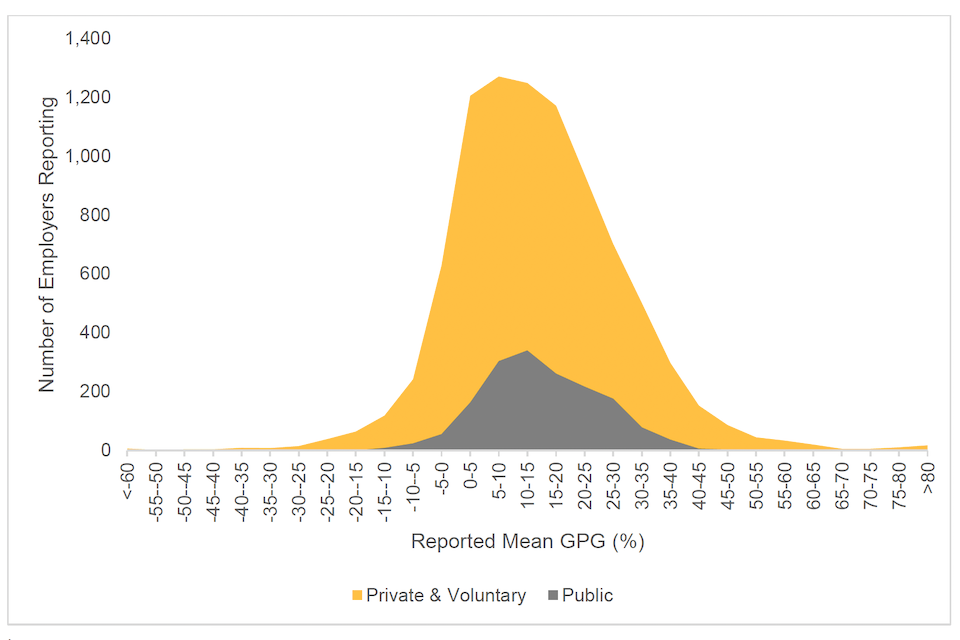
n = 10,533
Figures 5 to 8 show the range of median and mean reported gender pay gaps by industry and employer size band.
For each grouping, gender pay gap data from ASHE have been included as a comparison. Please refer to the Data section at page 10 for an explanation of this data, and why industry averages may differ.
When considering industry level GPGs, ASHE data are the most appropriate, while the viewing service data are most appropriate in considering individual employers. The 2 are combined here only to aid interpretation of the GPG portal data.
Ranges are expressed here using box-and-and whisker plots, as shown in Figure 4 below.
Figure 4: Explanation of box-and-whisker plot
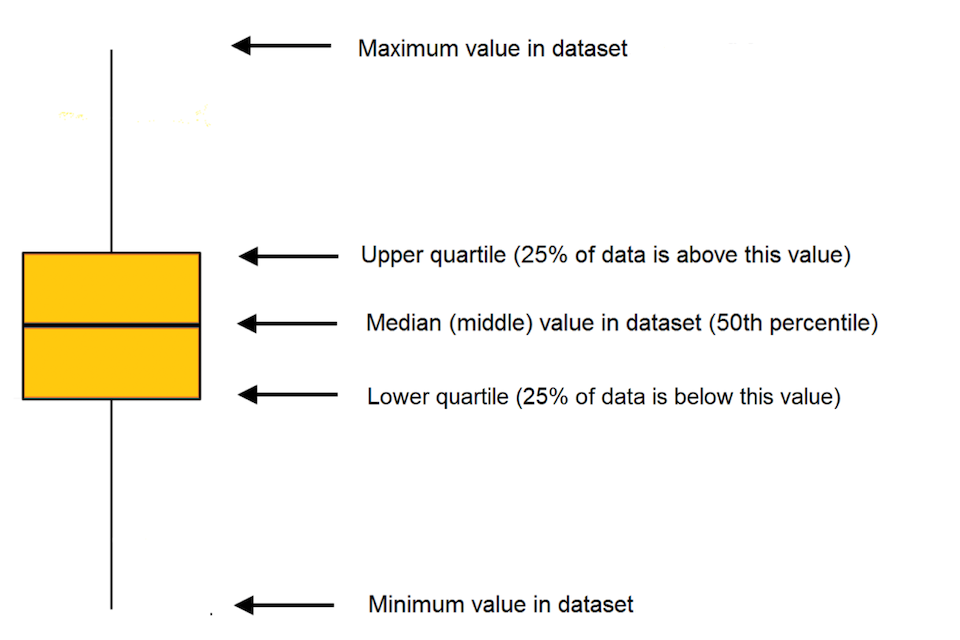
Note: The box-and whisker plots used here exclude extreme values (outliers), defined as those that are over 1.5 times the interquartile range away from the upper and lower quartile.
Figure 5: Range of reported median GPGs by industry, with cross-industry comparison
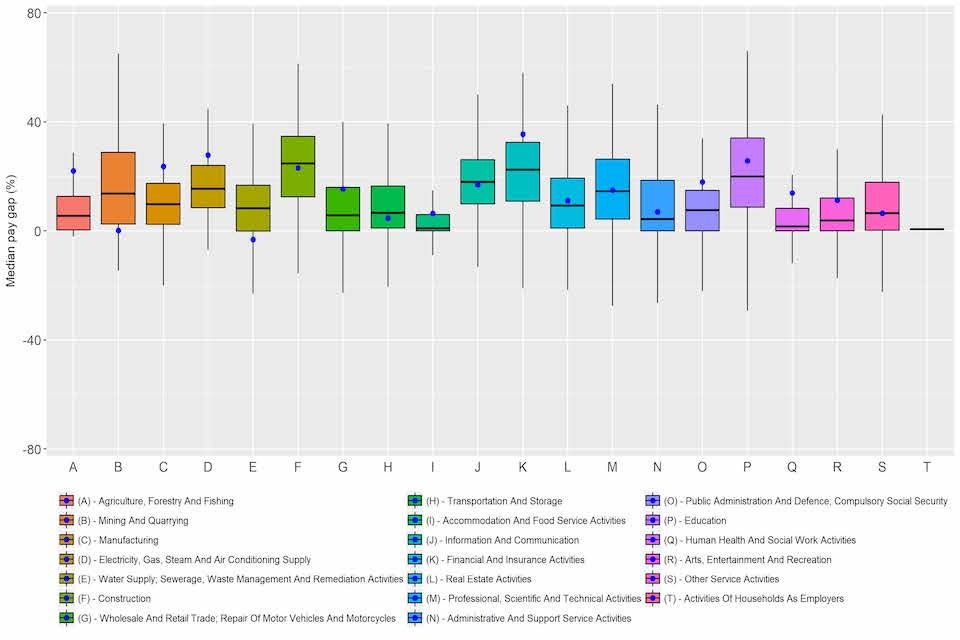
n = 10,533, Blue dots illustrate the cross-industry comparisons drawn from ASHE data. Note that data for sector (T) is not available in the ASHE sample.
Figure 6: Range of reported mean GPGs by industry, with cross-industry comparison
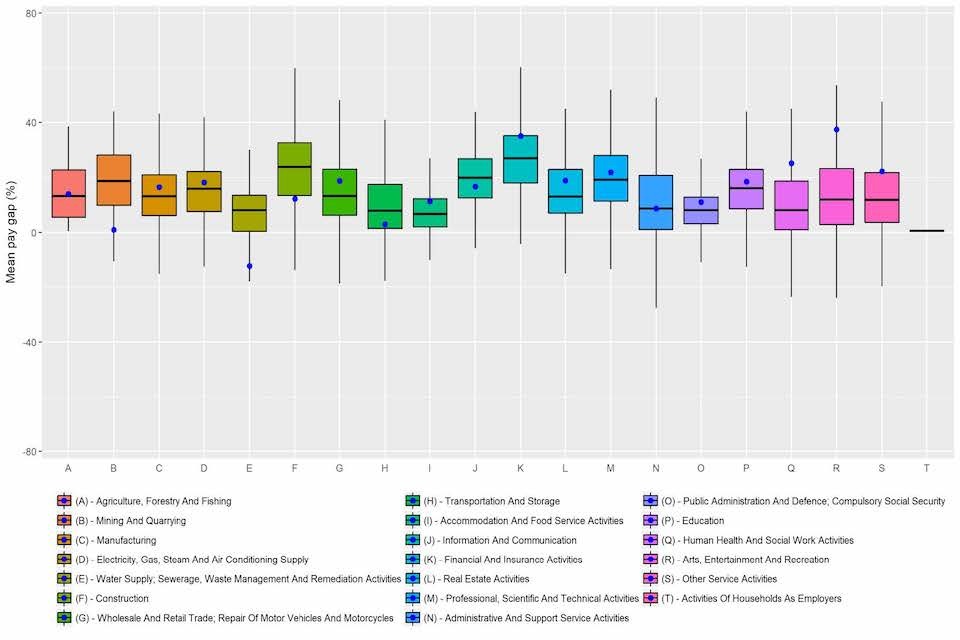
n = 10,533, Blue dots illustrate the cross-industry comparisons drawn from ASHE data. Note that data for sector (T) is not available in the ASHE sample.
Figure 7: Range of reported median GPGs by employer size band, with cross-industry comparison
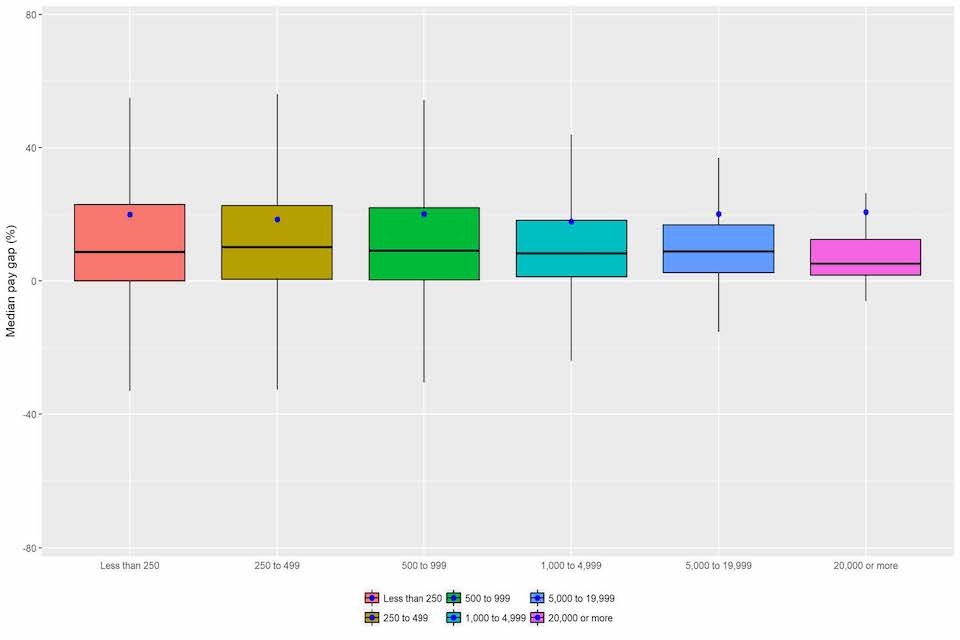
n = 10,533, Blue dots illustrate the cross-industry comparisons drawn from ASHE data.
Figure 8: Range of reported mean GPGs by employer size band, with cross-industry comparison
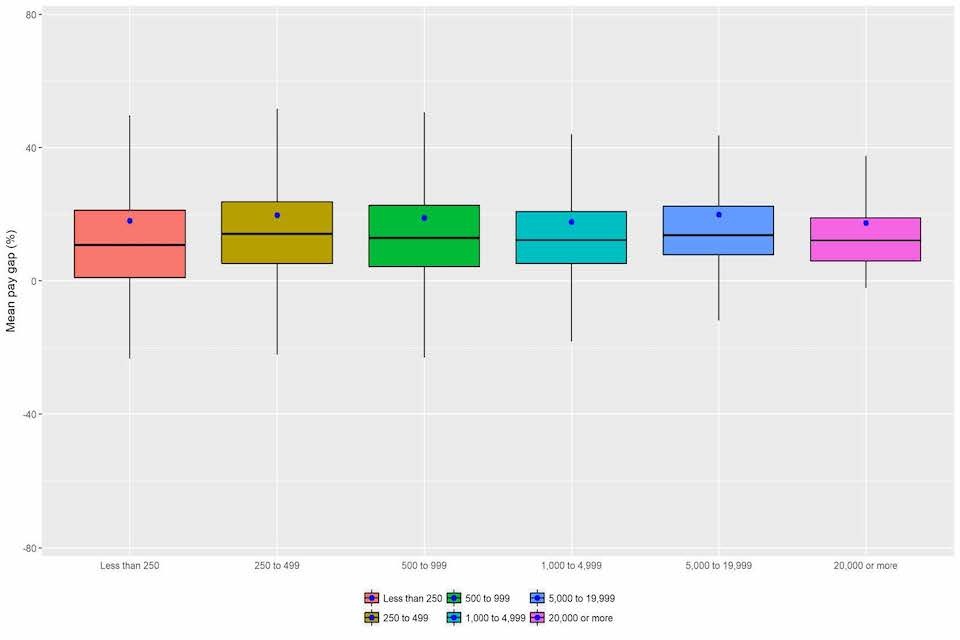
n = 10,533, Blue dots illustrate the cross-industry comparisons drawn from ASHE data.
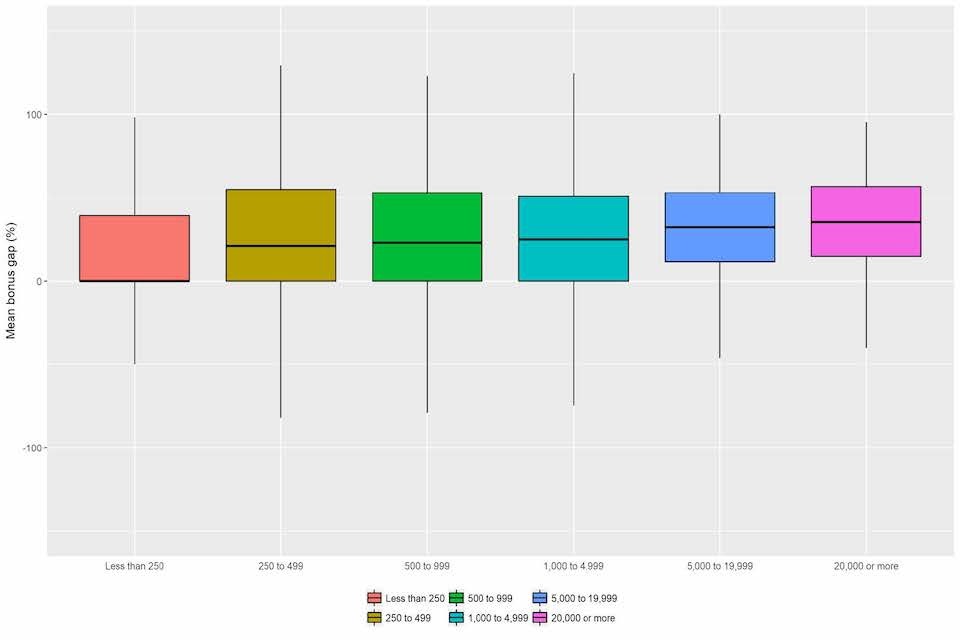
Distribution of reported bonus gaps
Figures 9 and 10 show the distribution of median and mean reported bonus pay gaps. A positive gap means that men are paid more than women on that measure. Though some of these may have a 0% bonus gap based on paying men and women equal bonuses or, as mentioned previously, the data may have been miscalculated or misreported. Note that where an employer does not pay bonuses, they will have a mean and median bonus gap of 0% - this was the case for 2,326 (22%) of reporting employers.
- 53% of reported median bonus gaps were positive, 15% were negative, and 33% of employers reported a median bonus gap of 0%.
- 62% of reported mean gender pay gaps were positive, 14% were negative, and 24% of employers reported a median bonus gap of 0%.
Figure 9: Distribution of reported median bonus gaps
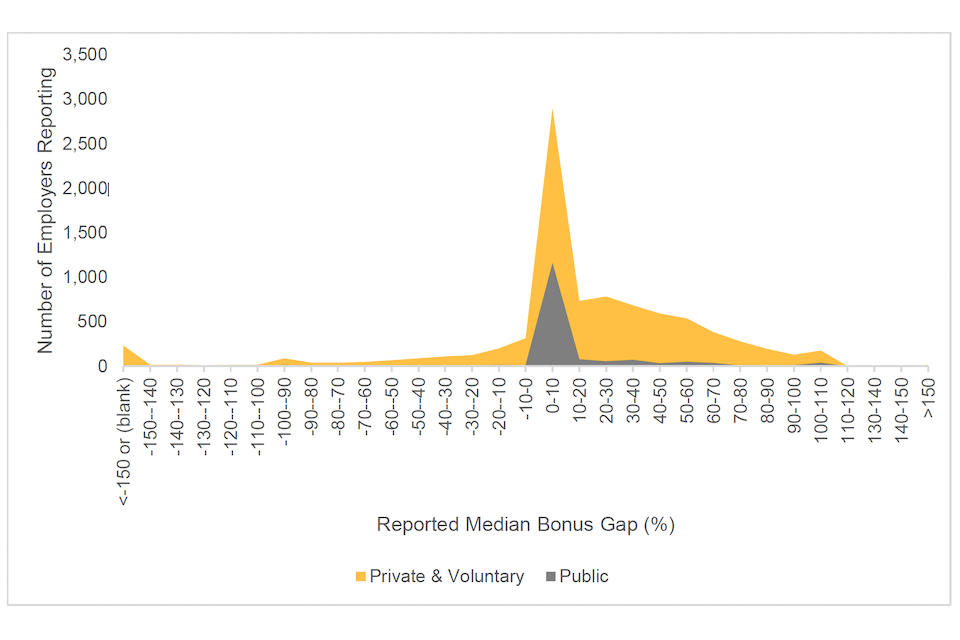
n = 10,533
Figure 10: Distribution of reported mean bonus gaps
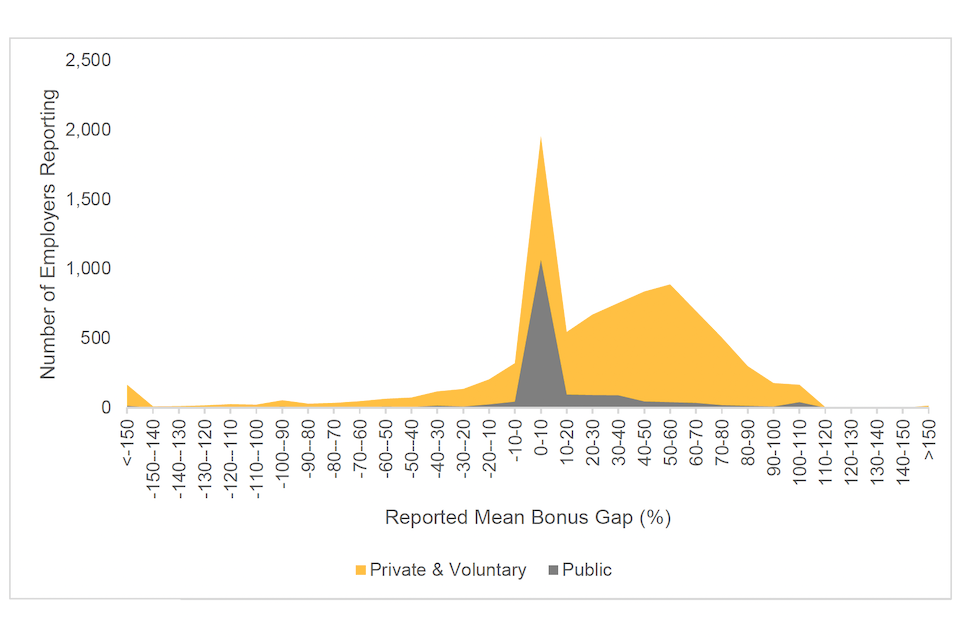
n = 10,533
Figures 11 to 14 show the range of median and mean reported bonus gaps by industry and employer size band. Note that no comparable ASHE data exist on bonuses, so we are unable to provide an industry-level comparison.
Figure 11: Range of reported median bonus gaps by industry
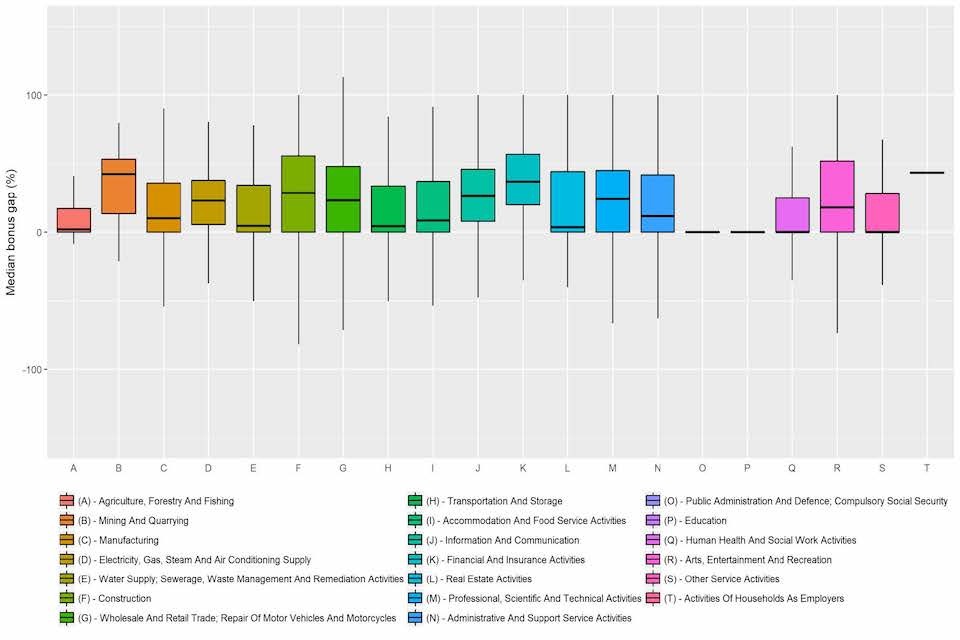
Figure 12: Range of reported mean bonus gaps by industry
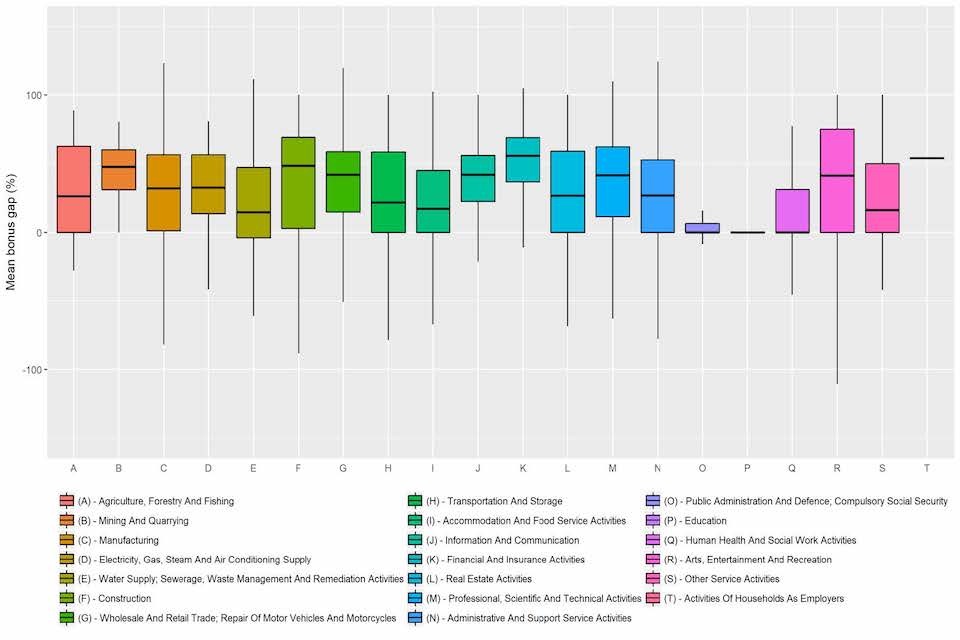
Figure 13: Range of reported median bonus gaps by employer size band
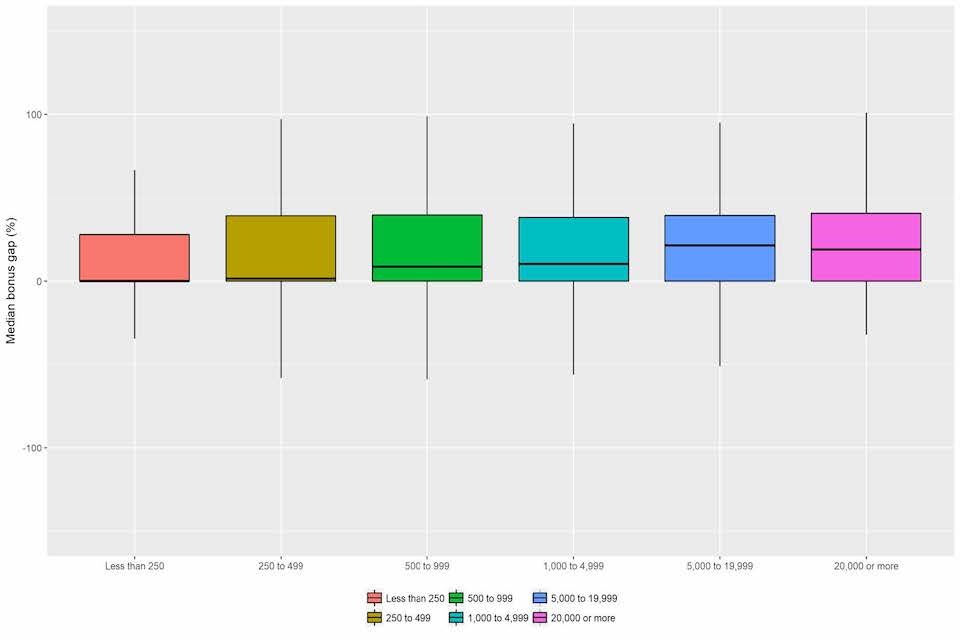
Figure 14: Range of reported mean bonus gaps by employer size band
Distribution of reported quartiles
Figure 15 summarises the reported proportions of women in each pay quartile, across all employers.
If all firms were gender balanced across pay quartiles, we would expect each column to be evenly distributed between the 4 quartile blocks. However, the reported data show that women are more likely than men to be in the lower pay quartiles.
Figure 15: Proportion of women in quartile, by numbers of employers reporting
| Percentage of women in quartile | Lower pay quartile | Lower middle pay quartile | Upper middle pay quartile | Upper pay quartile |
| 76% to 100% | 20.9% | 18.4% | 14.6% | 8.5% |
| 51% to 75% | 36.0% | 32.5% | 29.7% | 24.9% |
| 26% to 50% | 26.9% | 25.7% | 25.9% | 30.6% |
| 0% to 25% | 16.2% | 23.5% | 29.7% | 35.9% |
n = 10,533.
The figures show that:
- around 57% (36.0% plus 20.9%) of firms reported a lower pay quartile that has more than 50% women – this in itself would not result in a GPG
- around 33% (24.9% plus 8.5%) of firms have an upper pay quartile that is more than 50% women – this trend towards imbalance is the fundamental cause of the GPG
Employer action plans
To gain a better picture of employer progress in reducing the gender pay gaps, GEO undertook an exercise to estimate the proportion of employers who had externally published an action plan outlining their intentions to tackle their GPG.
From this exercise, it was estimated that, as of May 2018, 48% of in-scope employers had published an action plan.
Approach
A random sample of 400 in-scope employers was drawn from the data reported at 25 May 2018. This sample size allowed an estimate to be made with a 5% margin of error.
A working definition of an action plan was established as follows: “a document in which the employer has considered their gender pay gap and has offered a next step (for example, a target, plan, or aim) to implicitly or explicitly reduce or maintain their GPG”. This definition was designed only to identify an action plan at the broadest level, not to reflect on their quality. Note that an action plan is treated as distinct from a supporting narrative in looking at ways to tackle a GPG, rather than simply explain the causes.
Two assessors then considered whether each of the 400 sampled employers had provided an action plan meeting this definition. This exercise took place over 27 to 29 June 2018. For each employer, assessors:
- looked at any URL provided in their GPG report (available for just under two-thirds of the sample)
- briefly reviewed the wider company website (including a search where available)
- undertook an internet search of the company name and the search term “gender+pay”
If an action plan could not be found via this approach, it was deemed not to be publicly available via reasonable access attempts. The 2 assessors compared results, and a third assessor moderated where any discrepancies emerged.
Findings
Of the sample, action plans meeting the above definition could be found for 194 employers (48%). We therefore estimate that 43% to 53% of employers have published an action plan to tackle their gender pay gap.
Further reading
For further information on employer attitudes towards tackling their GPG, please refer to the GEO-funded research report, Employers’ understanding of the gender pay gap and actions to tackle it by James Murray, Paul Rieger and Hannah Gorry.[^10]
Employer portal survey
Between 21 June and 16 July 2018, GEO surveyed registered users of the GPG reporting service as to their experiences in reporting their data. The survey was emailed out to all 2,400 users who consented to give feedback when registering with the service, and of these 1,000 (42%) responded.
The headline findings were as follows. Of those surveyed:
- 80% had made use of the GOV.UK guidance on GPG reporting, while 72% had used Acas guidance
- of those who had used the GOV.UK guidance, 86% said it was ‘very clear’ or somewhat clear, while 10% said it was ‘somewhat unclear’ or ‘very unclear’
- of those who had used the Acas guidance, 89% said it was ‘very clear’ or ‘somewhat clear’, while 6% said it was ‘somewhat unclear’ or ‘very unclear’
- 28% said it had been ‘very easy’ or ‘easy’ to gather the data required to make the GPG calculations, 35% said it had been ‘difficult’ or ‘very difficult’
- 40% said it had been ‘very easy’ or ‘easy’ to make the GPG calculations, while 17% said it had been ‘difficult’ or ‘very difficult’
- 87% said it had been ‘very easy’ or ‘easy’ to register with the GPG reporting service, while 6% said it had been ‘difficult’ or ‘very difficult’
- 95% said it had been ‘very easy’ or ‘easy’ to input their data. 1% said it had been ‘difficult’, and none said it had been ‘very difficult’
- 90% had produced a narrative to explain their GPG figures
- 63% had already taken some action towards compliance in the 2018/19 reporting year
- 78% had used the GPG viewing service, and 98% of those had found it “very useful” or “somewhat useful”