Economic and Labour Market Impacts
Published 1 October 2026

© Crown copyright 2026
This publication is licensed under the terms of the Open Government Licence v3.0 except where otherwise stated. To view this licence, visit nationalarchives.gov.uk/doc/open-government-licence/version/3 or write to the Information Policy Team, The National Archives, Kew, London TW9 4DU, or email: psi@nationalarchives.gov.uk.
Where we have identified any third party copyright information you will need to obtain permission from the copyright holders concerned.
This publication is available at https://www.gov.uk/government/publications/final-evaluation-of-bduk-legacy-vouchers-schemes/economic-and-labour-market-impacts
1. Summary of key findings
This report addresses the research questions: “What outcomes and impacts have vouchers generated for businesses?” and “Over what timeframe have these impacts emerged and persisted?”
The analysis shows that vouchers generated clear and positive outcomes for supported businesses. Employment grew significantly faster than in comparable unsupported firms, with effects of around 7–8 percentage points above the counterfactual. Turnover impacts were even stronger, with additional growth of over 15 percentage points in some cohorts. Productivity, measured as turnover per employee, declined across the economy during the pandemic but fell less sharply for voucher-supported firms. This indicates that vouchers helped businesses remain more resilient in challenging conditions.
These impacts were sustained for a period following support, with positive effects on employment and turnover evident for up to three years after vouchers were received. By the fourth year, differences between voucher-supported businesses and control groups had largely converged.
The positive impacts were driven largely by the Gigabit Broadband Voucher Scheme(GBVS). GBVS-supported businesses consistently outperformed their comparators on both employment and turnover, with effects strengthening over time. By contrast, the Rural Gigabit Connectivity(RGC) scheme showed weaker or, in some cases, negative results.
Impacts also varied according to the type of business supported. Medium-sized firms (51–250 employees) recorded the strongest employment growth, while micro-businesses saw the largest turnover gains. By sector, manufacturing and real estate recorded the most positive results, while knowledge-intensive services were broadly in line with the average. Rural businesses performed similarly to the overall sample, showing neither stronger nor weaker effects.
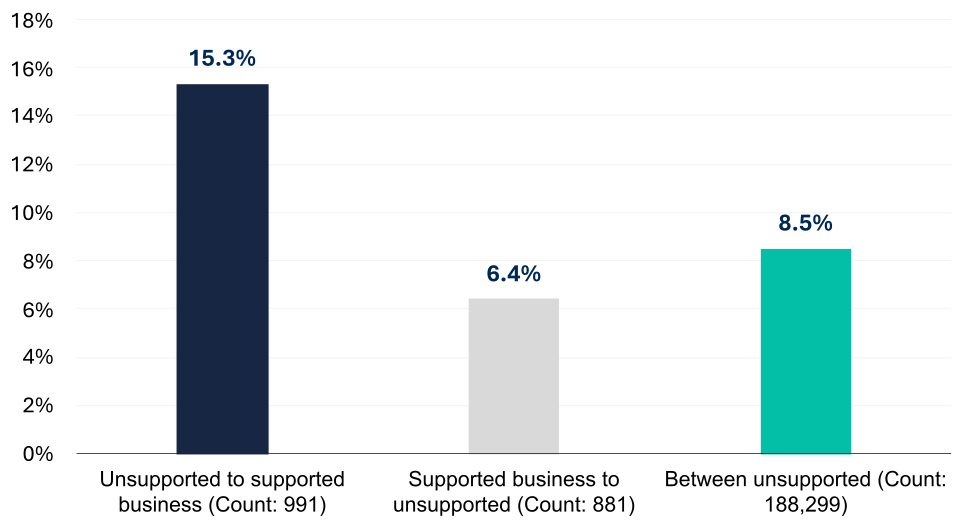
Vouchers also contributed to the creation of higher-quality jobs. Workers moving into voucher-supported businesses received wage increases of 15.3% on average, compared with 8.5% for other job movers. Applying this premium to the estimated number of additional jobs created suggests earnings benefits with a present value of around £175 million (2024 prices). Almost all of these benefits are attributable to GBVS (£174 million), with RGC contributing around £1 million. This difference reflects the much larger scale of business vouchers delivered through GBVS, the fact that GBVS businesses on average had higher levels of baseline employment, and the stronger employment effects observed for GBVS recipients.
The evaluation also examined whether vouchers reduced unemployment at local level using claimant count data. The analysis found no clear or consistent impacts: in most years there were no significant differences between voucher areas and controls, and trends were dominated by wider economic conditions, particularly the sharp rise in unemployment during the Covid-19 pandemic and subsequent recovery. This suggests that any effect of vouchers on unemployment was limited and difficult to isolate from broader labour market changes.
2. Purpose of report
This report examines the economic impacts of the Building Digital UK(BDUK) voucher schemes, updating and extending the analysis undertaken in the previous evaluation. It applies counterfactual impact evaluation methods to assess how voucher-subsidised gigabit connections have influenced business performance, looking at changes in turnover, employment, productivity and related outcomes.
The analysis is undertaken at two levels:
-
Firm-level impacts: the performance of individual businesses that received a voucher, compared to appropriate control groups.
-
Area-level impacts: aggregate changes in employment, turnover and productivity in Output Areas(OAs) where vouchers have been used.
The report also provides, for the first time, separate analysis of businesses that received support through the GBVS and RGC programme, which was not possible in the previous evaluation due to data lags. In addition, the final evaluation includes a new strand of analysis assessing the impact of vouchers on unemployment at Lower Super Output Area(LSOA) level, drawing on claimant count data. This provides further evidence on the extent to which improved broadband connectivity has contributed to labour market outcomes.
3. Methodology and data limitations
The method is described in full in the appendices and summarised here.
Voucher recipients were identified in the Office for National Statistics Secure Research Service and linked to the Business Structure Database (BSD), which provides consistent annual data on business characteristics, employment and turnover.
To understand the impact of vouchers, we created comparison groups of unsupported businesses using Propensity Score Matching. This technique matches businesses that received a voucher with otherwise similar businesses that did not. Matching is based on characteristics such as size, sector, and location, as well as broadband-related factors like the estimated cost to connect. Additional controls were included to account for the effects of the pandemic, such as whether a business received furlough support.
Three pools of unsupported businesses were used to construct control groups:
-
The wider business population in England and Wales.
-
Businesses in the same exchange areas as voucher recipients, allowing comparisons with firms in the same locality and broadband environment.
-
Businesses that later received a UK Gigabit Voucher(UKGV) scheme voucher (the successor scheme to GBVS and RGC). This pool was not available for the previous evaluation but is included here. Because these businesses eventually received a voucher, we can use their performance before the upgrade as a comparison for earlier recipients. This provides an additional way of accounting for unobservable factors that may influence whether a business applies for and takes up a voucher.
In total, nine models were estimated, using different combinations of matching variables and the business pools above. This created a range of control groups rather than relying on just one, enabling us to test whether the results are consistent across models and therefore more reliable.
To check the reliability of the results, we tested whether the control groups were sufficiently similar to voucher recipients and whether their employment and turnover followed similar paths before receiving support. More detail of this approach can be found in the appendices. This enables us to have more confidence that differences after vouchers were used are because of the treatment and not due to pre-existing trends.
Based on these tests, the model that performed best, and was therefore judged to be the most robust, used businesses that went on to receive a UKGV scheme voucher at a later date as the control group. Matching was based on a wide set of business, sector and location characteristics, such as firm size, age of business, growth and innovation. A full list of variables is provided in the technical annex.
While future UKGV beneficiaries were more likely to be located in rural or non-commercial areas, their pre-treatment business characteristics (such as size, sector and turnover) were very similar to earlier voucher recipients. After matching, these characteristics, including location factors such as the percentage in rural and non-commercial areas were even more closely aligned, providing confidence that they form a suitable counterfactual group.
Finally, we applied a difference-in-differences approach by tracking the performance of voucher recipients and their matched control businesses in the BSD, measuring changes in employment, turnover and productivity over time. For productivity, we used turnover per employee as a proxy measure. This approach compares how outcomes changed for the treated group relative to similar businesses that did not receive a voucher. Where the difference in these changes is statistically significant, we can be confident that the improvement is attributable to the vouchers rather than underlying trends.
As of September 2025, the most recent year of data available in the BSD relates to the financial year 2023/24. It is based on a snapshot in time of the Inter-Departmental Business Register (IDBR) taken in around April 2024, with the reporting period for the firm generally being the most recent financial year. This means we cannot assess the effects of vouchers on businesses beyond this date.
Because the BSD is created from an April snapshot, many businesses will not yet have submitted or had processed their financial accounts for the year that ended only a few weeks earlier. As a result, some firms’ turnover data in the BSD reflects the previous financial year rather than the most recent one. This timing gap means that major events, such as the Covid-19 pandemic, may only appear gradually in the BSD over two successive years (202/21 and 2021/22), depending on when individual businesses file their accounts.
4. Firm level impacts
4.1 Impacts on employment
This section examines how vouchers have affected employment in supported businesses. The analysis compares changes in employment for businesses that received a voucher with a range of control groups of unsupported businesses.
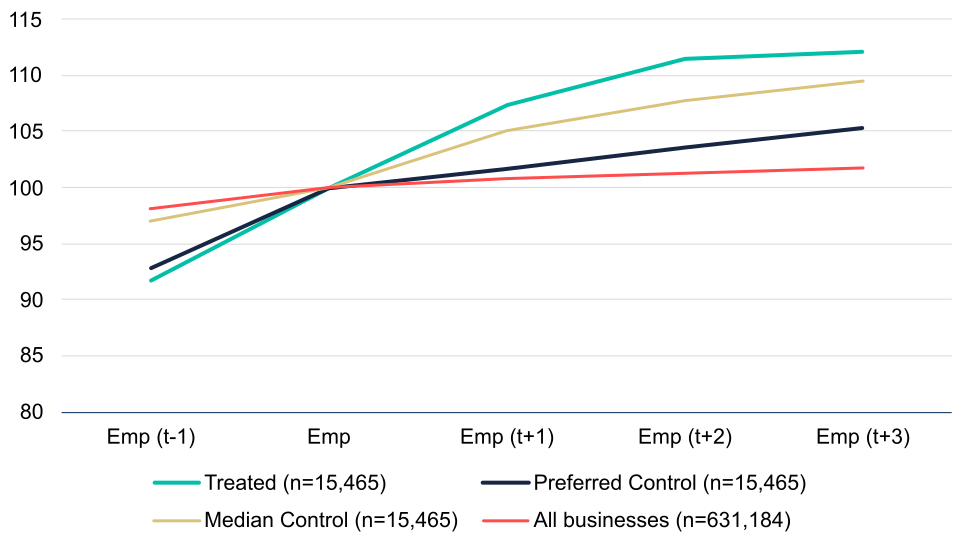
The chart shows indexed employment growth for voucher recipients (“treated”) against selected control groups. The chart is based on a stacked dataset, which means results are shown relative to the point when each business received its voucher rather than by calendar year. Businesses that received a voucher in 2018 is grouped together with businesses that received vouchers in 2019, 2020 and 2021, with their employment levels re-based to the year before they were supported (t). The chart then tracks how employment changed in the following years (t+1, t+2, t+3).
For clarity, not all of the 11 control groups are shown. The chart highlights four comparisons:
-
Treated businesses (those that received a voucher).
-
All businesses (the average across the wider business population; this group is not matched and includes firms of all sizes).
-
Preferred control group (based on businesses that received a voucher at a later date through UKGV).
-
Median control group (the mid-point outcome across all 11 models).
The analysis uses logged variables, meaning that employment and turnover are expressed in logarithmic form rather than as raw numbers. This is standard practice in impact evaluation because it reduces the influence of outliers and generally makes the statistical modelling more reliable.
Employment across all UK businesses remained relatively stable over the five-year period shown, increasing by only 1.7%. In contrast, businesses that received a voucher experienced much stronger growth. Over the three years after receiving a voucher, employment in supported businesses grew by the equivalent of 12.2% in logarithmic terms, compared to 5.3% in the preferred control group and 9.6% in the median control group. These results indicate that vouchers were associated with stronger employment growth than would have been expected in the absence of support.
Employment growth was much higher in the median control group than in the preferred control group. This reflects the fact that several models using businesses in the same exchange area as the control group (not shown in the chart) showed strong employment growth that closely matched that of supported businesses. However, because these firms were located near voucher recipients, it is possible that many gained access to gigabit connectivity themselves, especially if they were located within the same project area, which could explain why their employment performance was similar to that of treated businesses.
Logged employment change in voucher beneficiaries and control groups
Source: Belmana.
The table below presents the results of the Difference-in-Difference (DiD) analysis of employment growth. It compares businesses that received a voucher with two sets of control groups: the preferred control group and the median across all 11 models.
The results show that employment grew significantly faster in supported businesses than in comparable businesses. In the year of support, treated firms grew by 7.4% compared with 1.6% in the preferred control group, giving an additional 5.8 percentage point growth that can be attributed to vouchers. By the second year, this additional growth rose to 7.9 pp, and remained at 6.9 pp in the third year. All of these differences are statistically significant, which means we can be confident that they reflect real impacts rather than chance variation. This means that, by the third year, employment in firms that received a voucher was on average 6.9 percentage points higher than it would have been without support, equivalent to around 38,500 additional jobs in total (based on baseline employment of 557,600), though this does not take account of displacement.
By the fourth year, the gap between the treated group and the preferred control group narrows to 0.9 percentage points. This is only significant at the 10% level, which is below the standard 5% threshold typically used in evaluation to establish that a difference is unlikely to be due to chance. This suggests that the positive effects on employment persist for around three years.
When compared with the median model, the additional employment growth is smaller: 2.5 percentage points in the year of support, 3.6 pp in the second year, 2.7pp in the third year and 1.1pp in the fourth year. Nevertheless, these differences are still statistically significant. Overall, the results indicate that vouchers are associated with a clear and statistically significant contribution to stronger employment growth in supported businesses.
Difference in difference analysis for firm-level employment impacts (n=15,465)
| Time period | Treated | Preferred Control Group | Median Control Group | ||
|---|---|---|---|---|---|
| Growth (%) | Growth (%) | DiD (pp) | Growth (%) | DiD (pp) | |
| Yr of support | 7.4 | 1.6 | 5.8*** | 5.0 | 2.5** |
| Second year | 11.4 | 3.5 | 7.9*** | 7.8 | 3.6*** |
| Third year | 12.2 | 5.3 | 6.9*** | 9.5 | 2.7*** |
| Fourth year | 0.3 | -0.6 | 0.9* | -0.8 | 1.1** |
| Source: Belmana |
| Note: Significance levels are 1% (***), 5% (**) and 10% (*).The analysis presented above pooled businesses from different treatment years together. This approach was used because combining businesses across years maximises the sample size, which helps produce more robust estimates. |
Pooling all of the different cohorts has some limitations. In particular, it may mask important differences between treatment years, especially given the impact of the Covid-19 pandemic, which disrupted business performance through widespread closures and a sharp rise in online activity. The tables below therefore re-runs the analysis by individual treatment year. The same methods are used, but Propensity Score Matching is applied separately to businesses that received vouchers in each year. This allows us to explore how impacts varied year by year.
It is important to note that, because matching is carried out separately for each treatment year, the control groups are not the same as in the pooled analysis. As a result, the figures presented here are not directly consistent with the pooled results above.
The results by treatment year show that businesses using vouchers recorded strong employment growth across all cohorts (except the 2018/19 cohort, which experienced a fall in employment over four years). However, the scale of the impacts from vouchers differs between cohorts. Statistically significant effects are found only for the first two treatment years (2018/19 and 2019/20), where supported firms grew around 2–3 percentage points per annum faster than comparable businesses. These effects persisted for three years for businesses supported in 2018/19, and for up to four years for those supported in 2019/20 (five-year data for this cohort is not yet available).
However, for businesses supported in 2020/21, no statistically significant differences are observed compared with control groups. This suggests that the employment effects of vouchers were stronger for businesses that received vouchers in earlier years, with weaker evidence of impact for those supported in 2020/21.
Whilst not tested through evaluation, there are a few possible theories that could explain this trend. One possible explanation for the weaker relative impacts in 2020/21 is that the earlier cohorts of businesses had greater unrealised potential at a time when gigabit-capable connectivity was less widely available, meaning we may be observing stronger early demand from firms that were ready to make use of an upgraded connection. In contrast, businesses supported in 2020/21 may have had less scope to realise similar gains, as gigabit-capable connectivity had become more widespread and the additional benefits from upgrading may have been smaller.
Another possible related explanation is that businesses receiving vouchers in 2020/21 did so during the pandemic, when many firms, regardless of voucher support, had to move operations online. This may have reduced the observable difference between supported and unsupported businesses, as digital adoption was accelerating across the whole economy.
Difference-in-differences results for employment growth by year of voucher support
| Businesses supported in 2018/19 (n=7,542) | Treated | Preferred Control Group | Median Control Group | ||
|---|---|---|---|---|---|
| Baseline: 2017/18 | Growth (%) | Growth (%) | DiD (pp) | Growth (%) | DiD (pp) |
| 2018/19 | 6.7 | 4.3 | 2.4*** | 6.0 | 0.7 |
| 2019/20 | 11.5 | 8.8 | 2.6** | 10.0 | 1.5 |
| 2020/21 | 11.9 | 8.8 | 3.0** | 12.2 | -0.3 |
| 2021/22 | -0.6 | -0.8 | 0.2 | -0.1 | -0.6 |
| Businesses supported in 2019/20 (n=7,197) | Treated | Preferred Control Group | Median Control Group | ||
|---|---|---|---|---|---|
| Baseline: 2018/19 | Growth (%) | Growth (%) | DiD (pp) | Growth (%) | DiD (pp) |
| 2019/20 | 6.3 | 4.1 | 2.3*** | 6.5 | -0.2 |
| 2020/21 | 7.7 | 5.4 | 2.4** | 6.0 | 2.0* |
| 2021/22 | 7.5 | 4.9 | 2.8** | 7.9 | -0.4 |
| 2022/23 | 1.2 | -0.4 | 1.6*** | -1.5 | 2.7* |
| Businesses supported in 2020/21 (n=1,769) | Treated | Preferred Control Group | Median Control Group | ||
|---|---|---|---|---|---|
| Baseline: 2019/20 | Growth (%) | Growth (%) | DiD (pp) | Growth (%) | DiD (pp) |
| 2020/21 | 4.0 | 3.9 | 0.0 | 1.1 | 2.9* |
| 2021/22 | 7.7 | 7.7 | -0.1 | 8.0 | -0.3 |
| 2022/23 | 8.2 | 8.2 | -0.1 | 9.0 | -0.8 |
| 2023/24 | 7.9 | 8.2 | -0.3 | 8.7 | -0.8 |
| Source: Belmana |
| Note: The figures in each row show the difference with the baseline in that year. Significance levels are 1% (***), 5% (**) and 10% (*). |
The table below presents the difference-in-differences estimates for businesses supported through the RGC and GBVS schemes separately. For each scheme, employment outcomes for voucher recipients were compared with those of their matched comparator from the preferred control group.
The results show that GBVS recipients experienced consistently positive and statistically significant employment impacts. Employment in GBVS businesses was 5.3 percentage points higher in the year of support and just over 9 percentage points higher two and three years afterwards, compared with similar businesses that did not receive a voucher. For RGC recipients, the estimated effects are much smaller. The coefficient is negative in the year of support and then +1.7pp and +1.3pp in years two and three respectively, although these differences are still statistically significant at the 5% level.
This suggests that the employment impacts for RGC recipients were notably weaker than those observed for GBVS recipients. The same factors that help explain differences between earlier and later voucher cohorts are relevant here, as the timing of support differs substantially across the two schemes. Although the schemes overlap, GBVS activity was concentrated in 2018/19 and 2019/20 (93% of GBVS recipients), whereas just over half of RGC recipients received support in 2020/21.
As a result, many RGC businesses received vouchers at a point when the pandemic had already begun and gigabit-capable broadband was becoming more widely available. This meant digital adoption was accelerating across the whole economy, which may have reduced the relative advantage that earlier GBVS recipients experienced.
Difference-in-differences effects for employment by voucher scheme (percentage points)
| Characteristic | RGC (n=858) | GBVS (n=13,226) |
|---|---|---|
| Year of support | -1.1** | 5.3*** |
| 2 years after | 1.7** | 9.3*** |
| 3 years after | 1.3** | 9.2*** |
| Source: Belmana |
| Note: Significance levels are 1% (***), 5% (**) and 10% (*). |
4.2 Impacts on turnover
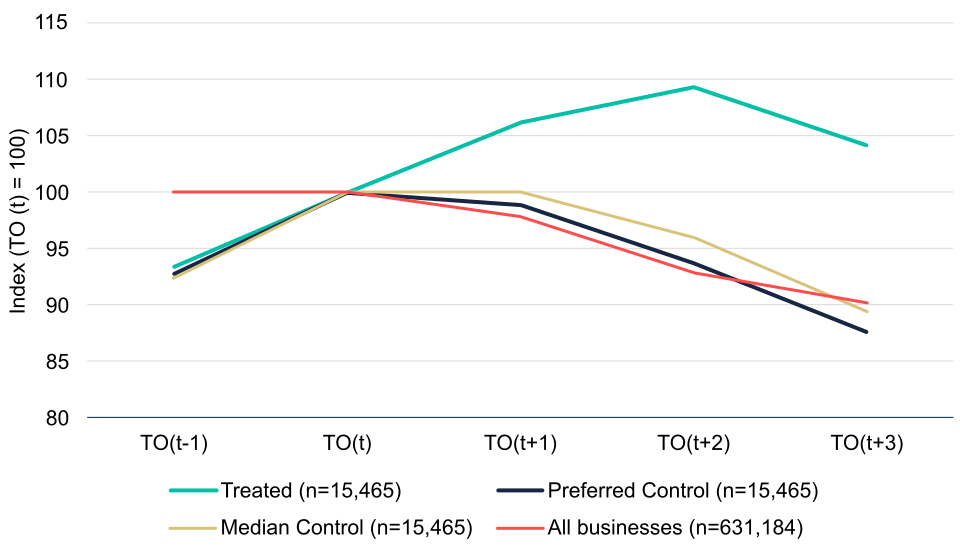
The chart shows changes in real turnover (i.e. adjusted for inflation) for businesses supported through vouchers compared with control groups. As above, this analysis is based on a stacked dataset, which pools together all businesses and tracks changes relative to the year of voucher receipt.
The red line in the chart shows that turnover across all UK businesses declined over the period shown, reflecting a challenging economic environment. Against this backdrop, turnover in supported businesses grew much more strongly than in any comparison group. In the year of support, turnover increased by 6.3% relative to the baseline, followed by a further 9.3% increase in the year after support.
By the second year after support turnover in supported firms began to fall. This is likely to reflect the impact of the Covid-19 pandemic, which would have occurred around this point for the majority of voucher beneficiaries. The effects of the pandemic are more pronounced for turnover than for employment where furlough payments are likely to have moderated any negative effects. Despite this fall, turnover remained above the pre-treatment baseline and the level observed in control groups, indicating that voucher recipients performed more strongly overall. This suggests vouchers helped to make businesses more resilient in the face of challenging economic conditions.
Change in logged real turnover in voucher beneficiaries and control groups
Source: Belmana
The table shows the results of the DiD analysis for changes in turnover. The findings indicate that vouchers had a large and statistically significant effect on firm’s turnover in the first three years after support. Over this period, turnover in supported businesses grew substantially faster than in all control groups. The estimated additional impact is sizeable, ranging from around 7.4 percentage points in the year of support to 16.5 percentage points by the third year. Given an average baseline turnover of £3.44 million among voucher recipients, this is equivalent to an additional £568,000 in turnover by the third year. Applied across all businesses that received a voucher, this implies total turnover benefits of around £14.4 billion by year three, although these figures do not account for displacement.
By the fourth year, the change in turnover for the treated group is 1.1 percentage point lower than the preferred control group, meaning comparator businesses have caught up with voucher beneficiaries. This suggests that the positive effects of vouchers on turnover persist for three years.
The findings are broadly consistent when using the median of the 11 models tested, which also show strong and statistically significant impacts, ranging from 8.3 percentage points in the year of support to 16.3pp by the third year. By the fourth year, growth is still significantly higher than the median control group, but the difference narrows to just 3.1 pp.
These results indicate that vouchers had a substantial positive effect on firm turnover, with impacts persisting over multiple years.
Difference in difference analysis for firm-level real turnover impacts (n=15,465)
| Time period | Treated | Preferred Control Group | Median Control Group | ||
|---|---|---|---|---|---|
| Growth (%) | Growth (%) | DiD (pp) | Growth (%) | DiD (pp) | |
| Yr of support | 6.2 | -1.2 | 7.4*** | -2.0 | 8.3*** |
| Second year | 9.3 | -6.3 | 15.6*** | -6.7 | 15.9*** |
| Third year | 4.1 | -12.3 | 16.5*** | -12.1 | 16.3*** |
| Fourth year | -1.5 | -0.4 | -1.1* | -5.0 | 3.1** |
| Source: Belmana |
| Note: Significance levels are 1% (***), 5% (**) and 10% (*). |
The table below shows turnover results by year of voucher support. The influence of the Covid-19 pandemic on turnover is easier to detect in these tables: for each cohort, the fall in turnover occurs in the years 2020/21 and particularly 2021/22. As explained above, although Covid-related effects should begin to appear in the 2020/21 BSD, there is a lag because the data is based on an April 2021 snapshot of the IDBR. For many businesses, their Covid-affected financial statements were not yet available at that point, meaning the full impact only becomes visible in the 2021/22 data.
The results provide some evidence that vouchers helped businesses adapt during this period. For firms supported in 2018/19, turnover growth was consistently stronger than in the control groups, with additional growth of 10.1 percentage points in the year of support and more than 14–15 percentage points in the following two years. Notably, in 2020/21, control group businesses saw a drop in turnover, while treated businesses continued to grow by 9.9% relative to the baseline. By the fourth year (2021/22), however, turnover fell sharply for both supported and control groups, with supported businesses performing slightly worse.
A similar pattern is found for the 2019/20 cohort, with vouchers associated with 10.4pp higher turnover growth in the year of support, 14.6pp in the second year and 16.5pp in the third year. Although supported businesses experienced a fall in turnover in 2021/22, the drop was far smaller than that seen in the control groups (-20.6%), indicating that the broadband upgrades may have helped firms adapt during the pandemic. By the fourth year, however, the control groups had caught up, with both groups showing similar turnover levels relative to the baseline.
Like the employment analysis above, the picture is different for the 2020/21 cohort, where no positive impacts are observed. The only statistically significant results are small negative effects (around –0.4 percentage points), suggesting that voucher-supported firms performed slightly worse than comparable businesses during this period.
Overall, these results indicate that vouchers made a substantial difference to business turnover for many firms, but only for those businesses that received vouchers in the 2018/19 and 2019/20 financial years. In both cases, the evidence shows that these additional benefits lasted for three years before control groups caught up.
There is no evidence of additional turnover benefits for businesses supported in 2020/21. The one exception to this is after four years when there is a positive difference, although this is unlikely to be explained by vouchers, given there are no effects in earlier years. As noted above, these businesses received their upgrade at a time when gigabit connectivity was already more widely available and digital adoption was accelerating across the whole economy due to the Covid-19 pandemic. This meant that firms without a voucher were also rapidly improving their online capabilities, reducing the scope for voucher-supported businesses to pull ahead in terms of turnover growth.
Difference-in-differences results for real turnover growth by year of voucher support
| Businesses supported in 2018/19 (n=7,542) | Treated | Preferred Control Group | Median Control Group | ||
|---|---|---|---|---|---|
| Baseline: 2017/18 | Growth (%) | Growth (%) | DiD (pp) | Growth (%) | DiD (pp) |
| 2018/19 | 8.3 | -1.8 | 10.1*** | -1.7 | 10.0*** |
| 2019/20 | 14.8 | 0.2 | 14.6*** | 0.6 | 14.2*** |
| 2020/21 | 9.9 | -5.7 | 15.6*** | -3.1 | 13.0*** |
| 2021/22 | -11.8 | -9.3 | -2.5** | -14.5 | 2.7** |
| Businesses supported in 2019/20 (n=7,197) | Treated | Preferred Control Group | Median Control Group | ||
|---|---|---|---|---|---|
| Baseline 2018/19 | Growth (%) | Growth (%) | DiD (pp) | Growth (%) | DiD (pp) |
| 2019/20 | 7.7 | -2.4 | 10.4*** | 2.0 | 6.0*** |
| 2020/21 | 7.0 | -7.4 | 14.6*** | -3.7 | 10.9*** |
| 2021/22 | -4.2 | -20.6 | 16.5*** | -17.5 | 13.3*** |
| 2022/23 | 8.1 | 8.6 | -0.5 | 4.5 | 2.1* |
| Businesses supported in 2020/21 (n=1,769) | Treated | Preferred Control Group | Median Control Group | ||
|---|---|---|---|---|---|
| Baseline: 2019/20 | Growth (%) | Growth (%) | DiD (pp) | Growth (%) | DiD (pp) |
| 2020/21 | -0.6 | -0.2 | -0.4 | -2.7 | 2.0 |
| 2021/22 | -0.2 | 0.3 | -0.4* | -12.5 | 12.4*** |
| 2022/23 | 5.5 | 5.7 | -0.2* | -5.8 | 11.3*** |
| 2023/24 | 7.5 | 1.2 | 6.3** | 3.7 | 3.8* |
| Source: Belmana |
| Note: The figures in each row show the difference with the baseline in that year. Significance levels are 1% (***), 5% (**) and 10% (*). |
The results in the table below show a sharp contrast between the two voucher schemes. For businesses supported through GBVS, turnover was consistently higher than matched businesses. In the year of support, turnover was around 8 percentage points higher, rising to 15–16pp higher two and three years later. This suggests that the positive effects of GBVS vouchers appeared quickly and then strengthened in the second and third year.
For RGC businesses, the picture is very different. Turnover impacts are negative across all three years, at around 6–8 percentage points below matched comparators.
Taken together, these results suggest that the strong positive turnover impacts identified in the overall analysis are being driven by GBVS vouchers.
Difference-in-differences effects for turnover by voucher scheme (percentage points)
| Characteristic | RGC (n=858) | GBVS (n=13,226) |
|---|---|---|
| Year of support | -6.0** | 8.4*** |
| 2 years after | -7.1** | 15.0*** |
| 3 years after | -8.1** | 16.1*** |
| Source: Belmana |
| Note: Significance levels are 1% (***), 5% (**) and 10% (*). |
4.3 Impacts on productivity
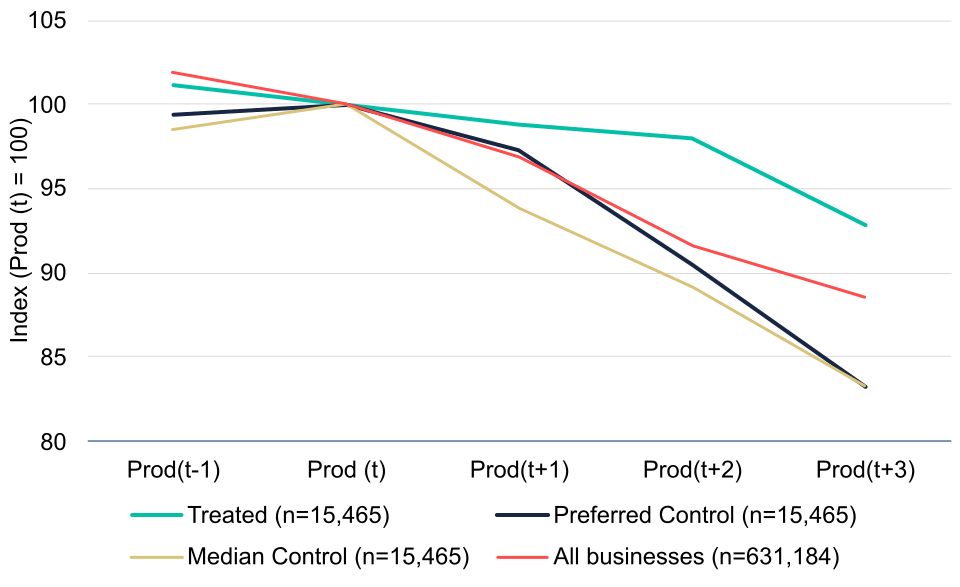
The chart shows changes in productivity, measured as turnover per employee. This indicator is calculated by bringing together the analysis of turnover and employment presented above. As above, this analysis is based on a stacked dataset, which pools together all businesses and tracks changes relative to the year of voucher receipt.
The main trend observable in the chart is a decline in productivity across all groups. The red line represents all businesses in the BSD, and shows that productivity declined across the economy. This is likely to reflect the impact of the Covid-19 pandemic, which reduced turnover more sharply than employment due to furlough payments helping firms to retain staff.
However, the decline was less pronounced among voucher recipients. Over the three-year period, turnover per employee in supported businesses fell by around 7.1%, compared with a much larger fall of 16.7% in the preferred control group and 11.5% across all businesses. This suggests that, while productivity fell for most businesses, firms with vouchers were better able to limit the scale of the decline.
4.4 Change in logged turnover per employee in voucher beneficiaries and control groups
Source: Belmana
The pooled DiD results show that, on average, turnover per employee in voucher-supported businesses fell by 1.1% in the year of support, 2% by the second year, and 7.1% by the third year. Productivity therefore declined in the first three years, but the fall was sharper in the preferred control group. As a result, vouchers are estimated to have provided an effect of 1.6 percentage points in the first year, rising to 9.6 percentage points by the third year.
By the fourth year, productivity of treated and control group businesses had returned to growth, but the difference between groups was only significant at the 10% level, which is below the minimum standard required to conclude vouchers’ effects persisted for a fourth year.
The table also shows a positive and statistically significant impact when compared with the median control group, which strengthens confidence in the results. In this case, the difference is significant in the fourth year.
This means that, while productivity in supported businesses did fall, the evidence suggests it would have fallen by considerably more without voucher support.
Difference in difference analysis for firm-level productivity impacts (n=15,465)
| Time period | Treated | Preferred Control Group | Median Control Group | ||
|---|---|---|---|---|---|
| Growth (%) | Growth (%) | DiD (pp) | Growth (%) | DiD (pp) | |
| Yr of support | -1.1 | -2.7 | 1.6*** | -7.8 | 6.7*** |
| Second year | -2.0 | -9.5 | 7.5*** | -14.4 | 12.5*** |
| Third year | -7.1 | -16.7 | 9.6*** | -19.8 | 12.7*** |
| Fourth year | 3.1 | 0.9 | 2.2* | -2.8 | 5.9*** |
| Source: Belmana |
| Note: Significance levels are 1% (***), 5% (**) and 10% (*). |
The table below shows the DiD results for turnover per employee when matching is carried out separately for each treatment year. Across all cohorts, labour productivity in voucher-supported businesses declined during the two years of the pandemic (2020/21 and 2021/22).
In the preferred control group, productivity fell in the first three years for every cohort. The DiD estimates suggest that vouchers helped to cushion this decline, adding between 7.2 and 11.5 percentage points for businesses supported in 2018/19, and between 7.8 and 13.3 percentage points for those supported in 2019/20. However, in both cohorts, productivity of control group businesses had caught up with and marginally exceeded that of supported businesses by the fourth year.
For the 2020/21 cohort, the differences between supported and control businesses were small, indicating that vouchers did not have a positive effect on productivity. If anything, control group businesses performed slightly better, though most of the results are not statistically significant enough to infer an overall trend.
Difference-in-differences results for change in turnover per employee by year of voucher support
| Businesses supported in 2018/19 (n=7,542) | Treated | Preferred Control Group | Median Control Group | ||
|---|---|---|---|---|---|
| Baseline: 2017/18 | Growth (%) | Growth (%) | DiD (pp) | Growth (%) | DiD (pp) |
| 2018/19 | 1.4 | -5.8 | 7.2*** | -5.5 | 6.9*** |
| 2019/20 | 2.9 | -7.9 | 10.8*** | -8.6 | 11.5*** |
| 2020/21 | -1.9 | -13.3 | 11.5*** | -12.2 | 10.3*** |
| 2021/22 | -11.1 | -8.5 | -2.7** | -14.1 | 2.9** |
| Businesses supported in 2019/20 (n-7,197) | Treated | Preferred Control Group | Median Control Group | ||
|---|---|---|---|---|---|
| Baseline: 2018/19 | Growth (%) | Growth (%) | DiD (pp) | Growth (%) | DiD (pp) |
| 2019/20 | 1.3 | -6.5 | 7.8*** | -5.3 | 6.7*** |
| 2020/21 | -0.7 | -12.5 | 11.8*** | -11.5 | 10.8*** |
| 2021/22 | -11.0 | -23.7 | 13.3*** | -24.9 | 14.5*** |
| 2022/23 | 6.9 | 9.0 | -2.1* | 4.5 | 0.4 |
| Businesses supported in 2020/21 (n=1,769) | Treated | Preferred Control Group | Median Control Group | ||
|---|---|---|---|---|---|
| Baseline: 2019/20 | Growth (%) | Growth (%) | DiD (pp) | Growth (%) | DiD (pp) |
| 2020/21 | -4.5 | -4.0 | -0.4 | -8.8 | 4.3 |
| 2021/22 | -7.2 | -6.9 | -0.2* | -15.1 | 8.0*** |
| 2022/23 | -2.6 | -2.3 | -0.3* | -10.1 | 7.5* |
| 2023/24 | 0.1 | -4.9 | 5.0** | -2.8 | 2.9* |
| Source: Belmana |
| Note: Significance levels are 1% (***), 5% (**) and 10% (*). |
The table below compares the effects of vouchers from each scheme on productivity, measured as turnover per employee.
For GBVS recipients, the results show consistently positive and statistically significant effects. In this context, a positive coefficient means that productivity declined, but by less than in similar businesses that did not receive a voucher. The change in productivity in GBVS firms relative to the baseline was 2.9 percentage points higher than in the control group in the year of support, rising to 6.3 pp by year three. For RGC recipients, the coefficients are negative in every year after support, indicating that productivity fell faster than in comparable businesses.
Overall, this suggests that only GBVS vouchers had a positive and statistically significant effect on productivity; that is, they helped to reduce the scale of the productivity decline relative to similar firms. There is no evidence of a similar effect for businesses supported through the RGC scheme..
Difference-in-differences effects for productivity (turnover per employee) by voucher scheme (percentage points)
| Characteristic | RGC (n=858) | GBVS (n=13,226) |
|---|---|---|
| Year of support | -5.0** | 2.9** |
| 2 years after | -8.7** | 5.2** |
| 3 years after | -9.3** | 6.3** |
| Source: Belmana |
| Note: Significance levels are 1% (***), 5% (**) and 10% (*). |
4.5 Differences between rural and urban businesses
The analysis presented so far shows that the main economic benefits of vouchers, particularly for turnover and productivity, have been concentrated among businesses supported through the GBVS scheme, with much more limited evidence of benefits for RGC recipients. This distinction matters because the two schemes had different objectives and design principles. GBVS was introduced earlier and had no geographical restrictions, whereas RGC was launched later as BDUK shifted its strategy towards prioritising investment in rural and hard-to-reach areas.
These findings raise an important question for BDUK. If RGC appears to generate fewer economic benefits, is this because rural businesses genuinely experience smaller gains from broadband upgrades, or is it due to timing? Understanding the answer is important, particularly as BDUK’s current programme, Project Gigabit, continues to focus investment on rural areas. Robust evidence on whether rural businesses benefit to the same extent as urban businesses is therefore critical for assessing whether this focus is justified in terms of economic impact.
To explore this issue, we carried out separate difference-in-differences analyses for rural and urban businesses. Because GBVS vouchers were used in both settings, this allows us to distinguish between differences that arise from location and those that stem from the timing of when support was received.
The analysis in the table below provides strong evidence that rural businesses have benefitted from vouchers. It shows that the DiD coefficients (the difference between the change in supported businesses and their control groups) were consistently higher for rural businesses than for urban businesses for both turnover and employment in the first two treatment years (2018/19 and 2019/20).
For the 2020/21 cohort, vouchers continued to have a significant and positive effect on turnover for rural businesses, with turnover 10.4 percentage points higher than the control group in the year of support, 17.5 pp higher by year two, and 10.2 pp higher by year three. In contrast, there were no significant differences between urban voucher recipients and their matched control groups in this cohort.
This strongly suggests that the limited evidence of impacts for RGC businesses is not due to their rural location. In fact, vouchers have continued to generate substantial performance benefits for rural businesses, even in the later cohorts. In contrast, the benefits observed for urban businesses are smaller for the later cohorts than for those supported in earlier years. This may reflect the increasing availability of gigabit-capable broadband in urban areas, allowing control group businesses to access similar connectivity and achieve similar gains. While in rural areas, where coverage remains lower, voucher recipients appear to retain a clearer advantage over comparable businesses that did not receive a voucher.
Difference in difference coefficients for rural and urban businesses (percentage points)
| Year | 2018/19 | 2019/20 | 2020/21 | |||
|---|---|---|---|---|---|---|
| Rurality of business | Rural | Urban | Rural | Urban | Rural | Urban |
| Treated businesses | 1,278 | 5,337 | 1,240 | 5,073 | 483 | 867 |
| Employment | ||||||
| Year of support | 4.6*** | 4.5*** | 4.9*** | 2.8*** | 3.1** | 0.0 |
| 2 years after | 7.8*** | 5.8*** | 5.4*** | 3.3*** | -0.2 | -5.1** |
| 3 years after | 6.1*** | 4.8*** | 3.2*** | 1.4 | 0.6 | -4.7* |
| Real turnover | ||||||
| Year of support | 8.2*** | 5.8*** | 8.8*** | 5.9*** | 10.4*** | -2.4 |
| 2 years after | 18.1*** | 12.2*** | 17.0*** | 11.4*** | 17.5*** | 2.6 |
| 3 years after | 24.0*** | 17.5*** | 13.1*** | 9.3*** | 10.2** | -2.4 |
| Source: Belmana |
| Note: Significance levels are 1% (***), 5% (**) and 10% (*). |
4.6 Differences by business size
The table below examines whether the impacts of vouchers differ by business size. This analysis is different from the tables above, which presented full difference-in-differences estimates separately for each scheme or for rural and urban businesses. In this case, the figures do not represent full DiD effects. Instead, they show the incremental effect associated with businesses of different sizes relative to the overall average impact across all voucher recipients. For example, a result of +10% means that the effect for that size group is 10 percent higher than the average effect. These incremental effects were estimated by taking the overall DiD impact on employment and turnover and testing whether the results vary systematically with business size.
The results suggest that the largest effects on employment were experienced by medium sized businesses (51-250 employees), where impacts were around 10% higher than the model average in the year of support, rising to 27% higher three years later. In contrast, the effects for micro-businesses (up to 10 employees) and small businesses (11–50 employees) were below the overall average, indicating that the additional employment gains from vouchers were weaker for these firms.
For turnover, the pattern is reversed. The strongest effects were observed for micro-businesses, with impacts 19% above the model average in the year of support, 25% above in year two and 10% above in year three. Turnover effects were generally weaker for small and medium-sized firms, except for medium-sized businesses in year three, where the effect exceeded the average.
Variation in employment impacts between by size of business
| Micro-business (n=7,735) | Small businesses (n = 5,194) | Medium sized (n = 1,419) | |
|---|---|---|---|
| Employment | |||
| Year of support | -1.1%** | -12.0%** | 10.1%** |
| 2 years after | -1.7%** | -17.7%** | 15.9%** |
| 3 years after | -11.0%** | -17.9%** | 27.0%** |
| Real turnover | |||
| Year of support | 18.8%** | -12.2%** | -6.1%** |
| 2 years after | 25.1%** | -18.6%** | -4.8%** |
| 3 years after | 10.0%** | -17.0%** | 15.0%** |
| Source: Belmana |
| Note: Figures in brackets are the standard errors, which show the level of uncertainty around each estimate. Significance levels are 1% (***), 5% (**) and 10% (*). |
4.7 Differences by sector
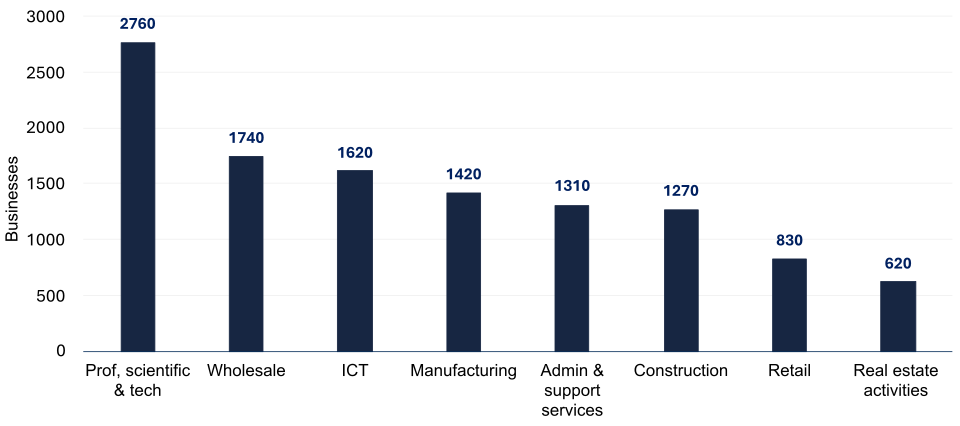
Vouchers were used by businesses across a wide range of sectors. The chart shows the largest sectors among voucher-supported businesses that could be identified in the BSD. Within this sample, the largest numbers of recipients are in professional, scientific and technical services, followed by wholesale, ICT, and manufacturing.
Business voucher recipients by sector (BSD-identified businesses)
Source: Belmana using BSD
The table below looks at how the employment and turnover impacts of vouchers vary by sector. The analysis focuses on three of the largest sectors in the sample: manufacturing, knowledge-intensive services (including professional, scientific and technical services, finance, and information and communication), and real estate. As with the previous table, the figures do not represent full DiD effects; instead they show how outcomes in each sector differ from the overall average effect for all businesses.
The results suggest that impacts were strongest in the manufacturing and real estate sectors. In manufacturing, employment effects were consistently above the average, reaching 14% higher by the third year after support, while turnover effects were 13% above the average by the same point. Real estate businesses also showed increasingly positive impacts over time, with employment around 17% above the average and turnover 22% above the average by year three.
Knowledge-intensive services show results show effects close to the overall average for employment in all years, indicating that the employment impact of vouchers in this sector was broadly typical. Turnover impacts were above the average in the year of support but had fallen to 11% below the average by the third year.
Variation in impacts by sector
| Characteristic | Manufacturing (n=1,419) | KI services (n=4,777) | Real Estate (n=623) |
|---|---|---|---|
| Employment | |||
| Year of support | 5.8%** | -3.3%** | 4.7%** |
| 2 years after | 7.0%** | 0.1%** | 11.2%** |
| 3 years after | 13.9%** | -3.0%** | 17.0%** |
| Real turnover | |||
| Year of support | 1.9%** | 10.9%** | 15.6%** |
| 2 years after | 10.1%** | -8.1%** | 16.0%* |
| 3 years after | 13.0%** | -11.2%** | 22.0%* |
| Source: Belmana |
| Note: Figures in brackets are the standard errors, which show the level of uncertainty around each estimate. Significance levels are 1% (***), 5% (**) and 10% (*). |
4.8 Earnings impacts
The evaluation not only considers the number of jobs created by voucher-supported businesses but also the quality of these jobs. Higher-quality employment is reflected in the wages people earn. When a worker is paid more in their new role than in their previous role, given the same skills and experience, this “wage premium” can be counted as an additional effect of vouchers. It indicates that the jobs created through voucher support are using workers’ skills more productively than their previous employment, and the associated increase in earnings can therefore be treated as a net benefit of the programme.
To measure this, the analysis draws on the Annual Survey of Hours and Earnings (ASHE), which tracks around one percent of UK employees each year, including individuals that move between employers. By following the same people as they change jobs, it is possible to compare wages before and after they enter a voucher-supported firm, while holding their personal characteristics constant. This allows the analysis to focus on the effect of moving into supported businesses, rather than differences in the types of workers they employ.
The findings show that voucher-supported firms tend to pay higher wages than the average. In 2018, employees in supported businesses earned £494 per week (in 2020 prices), compared with £432 across all firms.
The panel structure of the data also allows us to analyse the impact of job moves. The analysis of ASHE data has looked at five years of switching data between 2019 and 2024 to ensure we can also understand trajectories before voucher receipt. The dataset covers around 188,000 job moves in total, and all job switchers received a pay rise on average. Workers moving between unsupported firms saw increases of 8.5% (green bar in the table below). But those moving into a supported business enjoyed a much larger rise of 15.3% (dark blue bar), significantly above the economy-wide average. Moves in the opposite direction were less common and associated with smaller pay rises (6.4% - grey bar), reflecting that voucher-supported firms are creating rather than losing jobs.
Earnings changes for individuals who moved into a job with a business that received a voucher
Source: Belmana analysis of ASHE
Breaking this down by scheme, both GBVS and RGC beneficiaries show clear evidence of a wage premium. Job movers into GBVS-supported firms saw average pay rises of 13.2%, and those moving into RGC-supported firms saw increases of 11.7%, in both cases well above the 8.5% seen across unsupported firms. For employees who stayed in supported businesses, real wages grew by around 3.6% per year in both schemes.
Taken together, these findings suggest that voucher-supported businesses are not only generating additional jobs but are also offering roles of higher quality than the average. This does not mean vouchers caused the wage premium directly, but rather that the new jobs created used individuals’ skills and experience more effectively than their previous roles. While pay rises are common when people change jobs, the premium associated with moving into a supported business is significantly larger. Since these jobs would not have existed without vouchers, the associated wage effects can be considered a net additional benefit of the programme.
To estimate the earnings benefits of vouchers, we assessed both the number of additional jobs created in voucher-supported businesses and the wage premium earned by workers in these roles. Additional job creation was estimated using the difference-in-differences results for employment growth, calculated separately for GBVS and RGC, in line with BDUK’s requirement to assess the schemes individually. These DiD estimates were applied to baseline employment data for voucher-supported businesses to calculate the number of jobs attributable to vouchers.
The results show that voucher-related job creation was far higher in GBVS businesses than in RGC businesses. By the third year, employment is estimated to be nearly 44,000 higher in GBVS businesses as a result of vouchers, compared with around 500 jobs in RGC businesses. This difference reflects three main factors:
-
Scale: many more businesses received vouchers through GBVS than RGC (22,601 compared with 2,748).
-
Business size: GBVS businesses were larger at the outset, with an average of 21 employees per business, compared with 13 employees in RGC businesses.
-
Voucher effects: the estimated DiD effect on employment growth was much stronger for GBVS. By year three, employment growth was 9.2 percentage points higher in GBVS businesses as a result of vouchers, compared with 1.3 percentage points in RGC businesses.
We then adjusted these job estimates to reflect the share of new roles filled by people moving from other jobs. These adjusted job numbers were combined with evidence from ASHE on the typical pay increase for job-to-job movers to estimate earnings impacts. Full details of the methods, assumptions and sensitivity testing are provided in the technical annex.
Additional jobs attributable to vouchers by scheme
| Growth in employment attributable to vouchers (%) | Additional jobs attributable to vouchers | |||
|---|---|---|---|---|
| GBVS | RGC | GBVS | RGC | |
| Year of support | 5.3% | -1.1% | 25,200 | -400 |
| Second year | 9.3% | 1.7% | 44,100 | 600 |
| Third year | 9.2% | 1.3% | 43,700 | 500 |
| Source: GC Insight using analysis by Belmana and BDUK voucher data |
Applying the observed wage premium to these additional jobs results in total discounted earnings benefits of approximately £174.5 million. However this is driven almost entirely by GBVS businesses (£173.5m), with only £1m delivered through RGC businesses.
As shown earlier in this report, the analysis of turnover per employee indicated that productivity in voucher-supported firms declined, but by significantly less than in comparable unsupported firms. This provides evidence that vouchers had a statistically significant positive impact on relative productivity performance, and in principle these results could be monetised. However, we have chosen to focus on the wage premium analysis for the cost-benefit analysis. This is because the wage premium captures the additional earnings from new jobs created in supported businesses, while the productivity analysis measures a related effect at firm level. Counting both could therefore risk double counting the same underlying benefit. We therefore use the wage premium estimates as the measure of labour market benefits in the cost-benefit analysis, with the productivity findings presented as supporting context.
5. Impacts on local area economies
Up to this point, the report has focused on the economic impacts experienced by individual businesses that received a gigabit voucher. However, BDUK is also interested in understanding whether vouchers generated wider economic benefits within the local areas where these businesses operate.
There are two reasons why area-level impacts may arise. First, improvements in connectivity for voucher-supported businesses may influence their surrounding economy, for example, through local supply chains, labour markets or customer bases. Second, and importantly, voucher projects can extend gigabit-capable infrastructure beyond the premises that directly received a voucher. Businesses located in the same project area may therefore gain access to improved broadband even if they did not claim a voucher themselves. Area-level effects should therefore capture some of these indirect impacts, providing a fuller picture of how vouchers may have contributed to local economic performance.
To test for these broader effects, we carried out a separate analysis at OA level, examining how employment and turnover evolved in places where voucher activity occurred compared with similar areas that did not receive support.
5.1 Method
To assess whether vouchers generated wider economic impacts within local areas, we examined changes in business activity at OA level. The OAs that had received support were identified by linking business voucher beneficiaries to their location in the BSD.
The area-level analysis draws on BSD data for local units. These are individual business locations such as shops, offices, depots and branches. A key limitation of this data is that the BSD does not provide turnover at local-unit level. If a firm has only one site, enterprise-level turnover can be used directly. However, for multi-site firms, turnover of local units needs to be estimated by apportioning across local units using each unit’s share of the firm’s total employment (e.g. a retailer with £1m turnover and ten shops of equal employment is assumed to generate £100k per shop). This means that turnover estimates for local areas are approximate and should not be considered as reliable as employment measures.
To assess the counterfactual (what would have happened without vouchers) we developed and tested a series of propensity score matching models designed to create control OAs that closely resembled those receiving support. The models incorporated a broad set of indicators describing local business structure, economic performance and connectivity. A preferred and an alternative model were then identified by examining how effectively each one balanced the characteristics of treated and control areas and whether they followed similar trends before support. To reduce the risk of unobserved geographic differences affecting results, matching was limited to areas within the same local authority district or, if this was not possible, the wider region.
The two models are summarised below:
-
Preferred model: matched areas on employment levels, past employment growth, turnover, the level of new business creation before support, the level of relocations into the area before support, and average download speed.
-
Alternative model: used the same variables as the preferred model, but excluded past employment growth and pre-support relocations.
Once comparable control areas were identified, outcomes were tracked over time in both groups using BSD data on employment and turnover. Where statistically significant differences are observed, these provide evidence that vouchers may have contributed to wider local economic impacts.
5.2 Interpreting findings for area-level analysis
The findings in this section should be interpreted with care, as they can give what at first appear to be counter-intuitive results. Challenges arise because a high proportion of employment and turnover growth is driven by a relatively small number of OAs, particularly those with very high employment and business density. This creates challenges when comparing changes across areas and when choosing the most appropriate measure of growth.
To reduce the influence of a few very large areas, we report changes in employment and turnover using logged growth measures. These focus on percentage change and give a more balanced picture of what is happening across the full set of areas. This is a standard approach in area-level economic analysis and helps ensure that the results reflect the typical experience of OAs rather than being dominated by outliers.
However, using logged growth also introduces some difficulties. Logged measures “downweight” very large increases in high-density areas, while giving equal importance to the smaller changes seen in most areas. This means the analysis can show:
-
large total increases in employment or turnover (driven by strong growth in a small number of large areas), but
-
weak or negative logged growth (because many smaller areas show little change or modest declines).
This divergence does not make the analysis unreliable. Instead, it highlights that impacts are unevenly distributed, with a small number of large areas accounting for much of the total job and turnover change. Logged growth therefore provides a better view of the typical impact across all areas, while total change figures show the overall scale of change but can be influenced heavily by outliers.
5.3 Impact results
Before estimating the additional impact of vouchers, it is useful to examine the gross changes in employment and turnover observed in the OAs that received support. The table below presents these changes over a three-year period for each cohort of areas that first received vouchers in 2018/19, 2019/20 or 2020/21. For each cohort, results are shown relative to the baseline year immediately before support was received.
An OA is counted as “treated” only in the first year it receives vouchers. If an area received vouchers in 2018/19 and again in later years, it is included only in the 2018/19 cohort, not in the 2019/20 or 2020/21 groups. This avoids double-counting and ensures each area is assigned a single baseline year.
The results show that most of the gross employment and turnover growth occurred in the 2018/19 cohort. Employment in these areas increased by around 162,500 jobs over three years, while the 2019/20 cohort experienced a slight decline and the 2020/21 cohort recorded only modest growth. A similar pattern is seen for turnover, with the earlier cohort accounting for the majority of the increase. As a result, the overall totals across all cohorts largely reflect the strong performance of areas that first received vouchers in 2018/19.
5.4 Gross change in employment and turnover in supported OAs
| Cohort of support | 2018/19 (n=4,509) | 2019/20 (n=3,582) | 2020/21 (n=557) | Total (n=8,648) |
|---|---|---|---|---|
| Period of analysis | 2017/18 to 2020/21 | 2018/19 to 2021/22 | 2019/20-2022/23 | Various |
| Employment in supported areas | ||||
| Baseline employment | 5,587,800 | 2,962,000 | 313,700 | 8,863,400 |
| Employment change | 162,500 | -36,000 | 3,800 | 130,300 |
| Real turnover in supported areas | ||||
| Baseline turnover | £8,948m | £4,681m | £444m | £14,073m |
| Real turnover change | £2,479m | £578m | £168m | £3,224m |
| Source: Belmana, using BSD. |
| Note: Employment and turnover figures show the total across all treated areas within each cohort. Gross change is calculated relative to the cohort’s baseline year. The “Total” column presents the combined baseline values and combined gross changes across all cohorts. |
As with the firm-level analysis, the area-level analysis shown in the chart below uses a stacked dataset that combines all cohorts and measures change relative to each area’s baseline year.
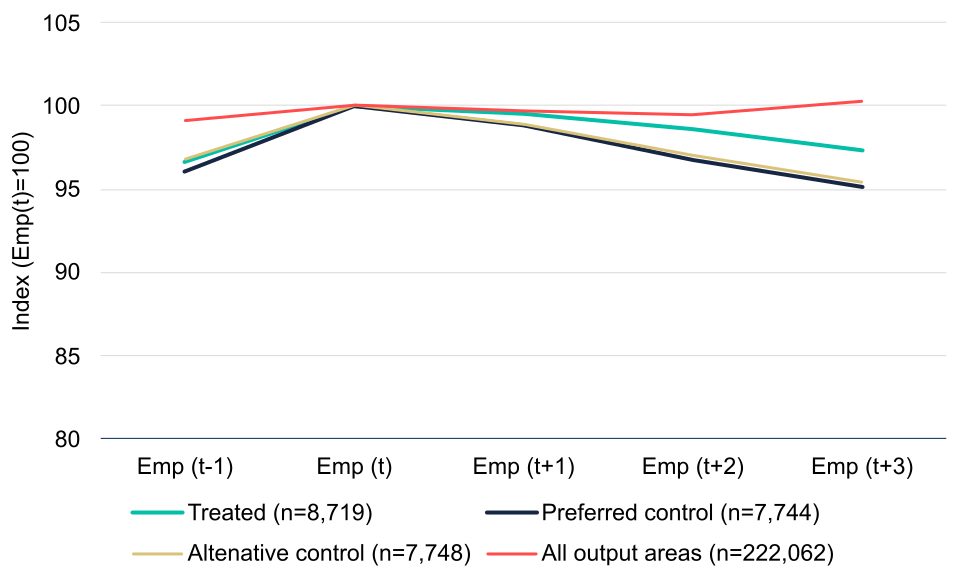
The red line shows the average trend for all OAs in Great Britain, and shows that, on average, employment was broadly stable. The green line shows the pattern for treated OAs. On average, employment falls by around 2.6% over the three years after support. This contrasts with the earlier gross analysis, which showed a total increase of 133,000 jobs (around 1.5%). The difference arises because the chart uses logged employment, which reflects the experience of a typical treated area. The gross figures, by contrast, are heavily influenced by a relatively small number of large, high-density areas that saw substantial employment growth.
The gold and dark blue lines show the trends for the two control groups, both of which experience larger declines (4.5% to 4.8%) over the same period. This indicates that employment was falling in many comparable areas during this time, and suggests that without voucher support, employment in treated areas may have declined by even more.
Indexed change in logged employment in treated and control areas
Source: Belmana
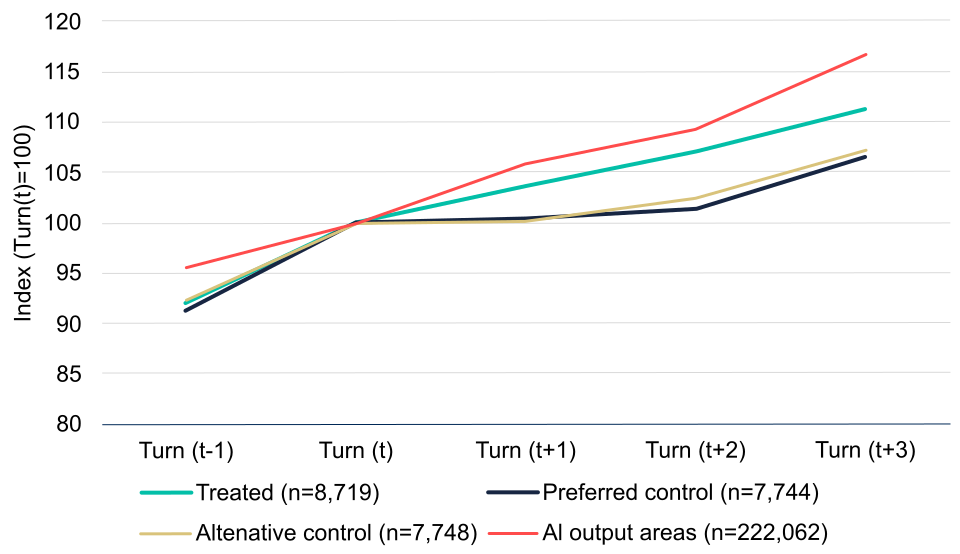
The chart below presents the average change in logged turnover for treated and comparator areas, presented as a stacked dataset. The chart shows a steady increase in average turnover for all groups over time. By the third year, turnover in treated areas had increased by 11%, which was higher than both control groups (6-7%) but lower than the average for all OAs (17%).
The analysis suggests that vouchers were associated with higher turnover growth in the areas where they were used compared with similar areas that did not receive support. However, this finding should be interpreted with caution for two main reasons. First, turnover at the level of individual business locations is not recorded in the BSD and must therefore be estimated, which introduces potentially large margins of error. Second, although treated areas outperform the matched control groups, their turnover growth remains well below the average for all OAs. While this is not a counterfactual comparison, it indicates that the scale of growth in treated areas is modest in the context of wider economic trends. Together, these factors suggest that the estimated effects should be viewed as indicative rather than precise.
Indexed change in logged real turnover in treated and control areas
Source: Belmana
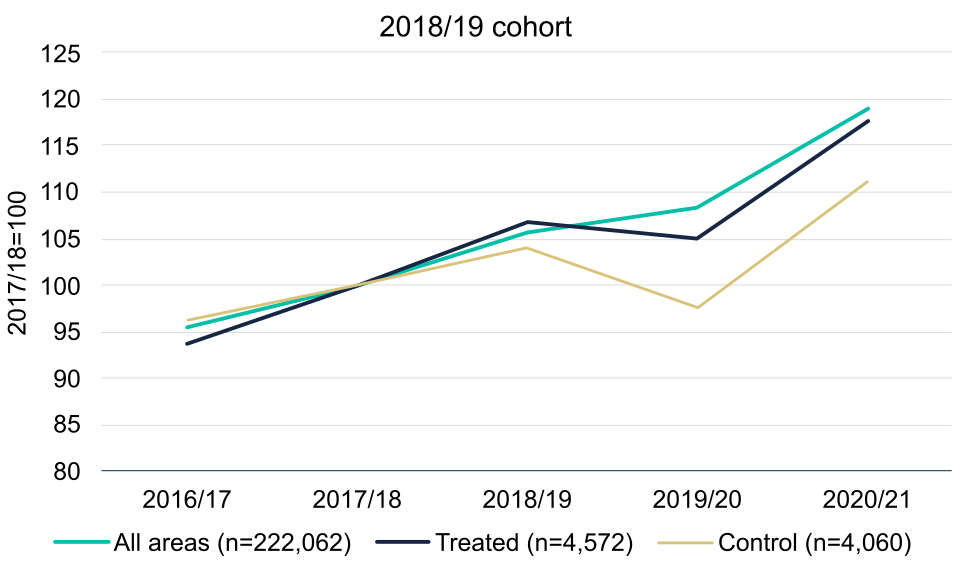
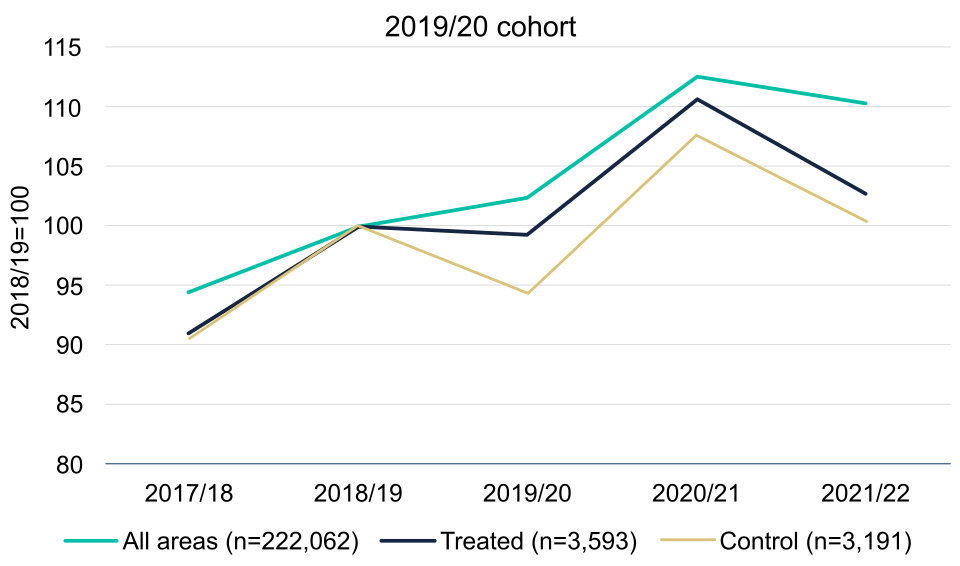
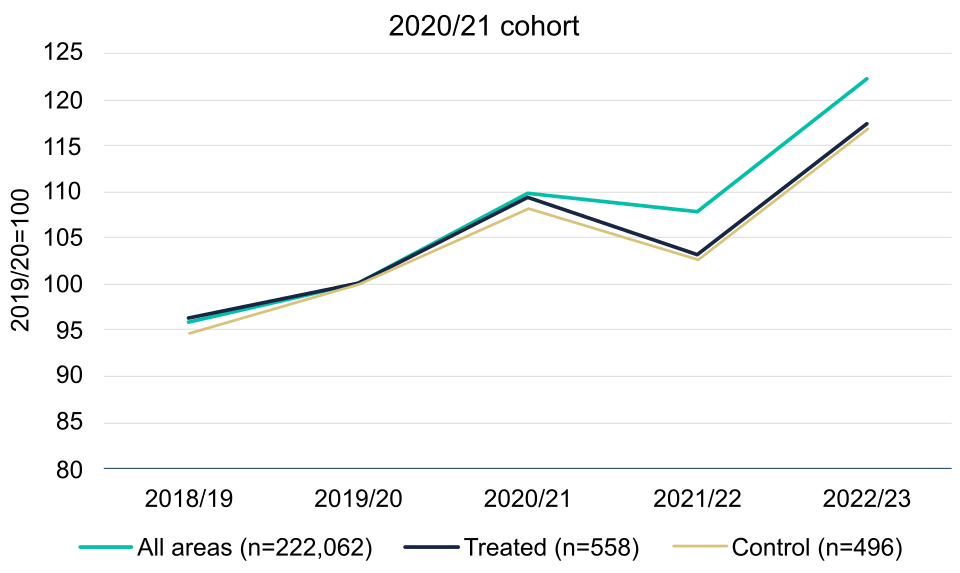
The charts below separate the three main cohorts of treated areas that were combined in the previous stacked analysis. Each chart shows how average logged turnover changed over time for treated areas, the preferred control group, and the average for all OAs.
By looking at the cohorts separately, it becomes clear that turnover in treated areas has not followed the smooth upward trend implied by the combined chart. Instead, turnover growth has fluctuated from year to year, and the stacked dataset used earlier effectively smooths out these fluctuations. For example, declines in turnover in one cohort can be offset by increases in another cohort in the same relative year, resulting in a more stable average when the cohorts are combined.
This breakdown also helps to explain why the combined analysis did not show a clearer effect from the Covid-19 pandemic. The decline in turnover associated with the pandemic appears in 2021/22, when both the 2019/20 and 2020/21 cohorts experienced a fall in turnover. However, the three-year period for the 2018/19 cohort ends in 2020/21, meaning any decline in turnover experienced by this cohort in 2021/22 is not captured in the stacked analysis. As the 2018/19 cohort is the largest of the three, its exclusion from the key pandemic year has a strong influence on the overall trend in the combined chart.
The cohort-level charts suggest that the difference between treated and control areas observed in the combined analysis is largely driven by the 2018/19 cohort, where treated areas show noticeably stronger turnover growth than the preferred control group in the years following support. For the 2019/20 and 2020/21 cohorts, there are still differences between treated and control areas, but these are much smaller and less consistent over time than those seen for the earlier cohort. This indicates that the overall gap between treated and control areas in the combined analysis is influenced primarily by the stronger performance of the 2018/19 cohort, rather than a uniform effect across all cohorts.
Finally, across all cohorts, treated areas consistently show lower turnover growth than the average for all OAs. This comparison does not represent a robust counterfactual, but it does provide helpful context and reinforces the need for caution when interpreting the scale of turnover change.
Indexed change in logged average turnover by cohort
Source: Belmana
The table below summarises the results of the difference-in-differences analysis for employment and turnover in OAs that received vouchers, compared with matched control areas. The results show a statistically significant difference in growth between treated areas and both control groups for both employment and turnover, indicating that outcomes in treated areas were stronger than would otherwise have been expected.
For employment, although average employment declined in treated areas over time, the analysis suggests that this decline would have been around 2.3 percentage points larger in the absence of voucher support by the third year, based on the comparison with the preferred control group. For turnover, the results indicate that growth in treated areas was around 4.4 percentage points higher by the third year than in comparable areas that did not receive vouchers.
Difference in differences analysis for employment and turnover impacts in supported OAs
| Time period | Treated (n-8,719) | Preferred Control (n=7,744) | Alternative Control (n=7,748) | ||
|---|---|---|---|---|---|
| Growth (%) | Growth (%) | DiD (pp) | Growth (%) | DiD (pp) | |
| Employment | |||||
| Yr of support | -0.4 | -1.1 | 0.7 | 0.0 | 0.7 |
| Second year | -1.4 | -3.4 | 2.0** | 0.3 | 1.7** |
| Third year | -2.6 | -4.9 | 2.3** | 0.3 | 2.0** |
| Turnover | |||||
| Yr of support | 3.7 | 0.3 | 3.4*** | -0.2 | 3.6*** |
| Second year | 7.1 | 1.5 | 5.6*** | 1.1 | 4.5*** |
| Third year | 11.2 | 6.8 | 4.4*** | 0.6 | 3.8*** |
| Source: Belmana |
| Note: Figures in brackets are the standard errors, which show the level of uncertainty around each estimate. Significance levels are 1% (***), 5% (**) and 10% (*). |
The table below presents the difference-in-differences estimates for turnover growth, split by cohort and using two alternative approaches to handling business sites that are part of multi-site enterprises.
As noted earlier in the report, the BSD does not provide turnover data at the level of individual business locations for multi-site firms. In the main analysis, turnover for these sites is estimated by apportioning enterprise-level turnover according to each site’s share of employment. The first set of results in the table uses this approach and is consistent with the turnover analysis presented earlier in the report.
Using this method, the results suggest positive and statistically significant differences between treated and control areas for the 2018/19 and 2019/20 cohorts across most time periods, indicating higher turnover growth in supported areas. The effects are strongest for the 2018/19 cohort and tend to diminish over time and across later cohorts.
The second set of results takes a different approach by excluding all multi-site businesses and focusing only on single-site businesses, for which the BSD provides actual observed turnover. This has the advantage of using more accurate turnover data, but the disadvantage that around 20% of business sites are removed from the analysis.
The results using this restricted sample differ markedly from the main analysis. Once multi-site businesses are excluded, there is no consistent or statistically significant difference in turnover growth between treated and control areas across most cohorts and time periods. In several years, control areas show stronger turnover growth than treated areas.
This contrast highlights an important limitation of the area-level turnover analysis. The estimated positive effects observed in the main results appear to be sensitive to how turnover is constructed for multi-site businesses. As a result, the evidence that vouchers had a significant positive impact on turnover growth at the area level is weaker and less robust than suggested by the headline results alone.
Difference-in-differences coefficients for turnover by cohort (percentage points)
| 2018/19 (n=4,572) | 2019/20 (n=3,593) | 2020/21(n=558) | |
|---|---|---|---|
| Turnover estimated based on share of employment | |||
| Year of support | 2.7*** | 5.6*** | 1.9 |
| 2yrs after | 7.8*** | 3.8*** | 0.5 |
| 3 yrs after | 5.6*** | 3.0** | 0.1 |
| Single site businesses only | |||
| Year of support | -1.2 | 1.0 | -5.0 |
| 2yrs after | -0.1 | 3.6** | 1.3 |
| 3 yrs after | 2.3 | 2.7 | -10.1** |
| Source: Belmana |
| Note: Figures in brackets are the standard errors, which show the level of uncertainty around each estimate. Significance levels are 1% (***), 5% (**) and 10% (*). |
5.5 Conclusions for area-level analysis
The area-level analysis suggests that vouchers were associated with more positive employment outcomes in the areas where they were used, compared with similar areas that did not receive support. Although employment declined in many treated areas over time, the decline was generally smaller than in matched control areas. This indicates that vouchers may have helped to limit employment losses.
The evidence on turnover impacts is less clear and should be treated with greater caution. While some analyses suggest stronger turnover growth in treated areas than in control areas, these results are sensitive to how turnover is estimated, particularly for multi-site businesses. When the analysis is restricted to businesses where turnover is directly observed, differences between treated and control areas are smaller and less consistent. In addition, turnover growth in treated areas remains below the average for all OAs. Taken together, this means that any positive turnover effects at the area level should be viewed as indicative rather than robust, and confidence in their scale is limited.
6. Impacts on unemployment
The final phase of the evaluation included exploratory analysis of whether vouchers had any effect on local unemployment, using Claimant Count data from the Department for Work and Pensions. The claimant count measures the number of people receiving Jobseeker’s Allowance or Universal Credit with work-search requirements and is widely used as a proxy for unemployment. Data is only available at LSOA level, which are much larger than OAs, with an average population of around 1,500 people. Given the size of these areas and the relatively small number of vouchers delivered, any effects of vouchers on local unemployment may be difficult to detect in the data, particularly given that the period of analysis includes the Covid pandemic when the labour market was very volatile.
The matching approach used for this analysis was similar to that applied to download speeds in Report 1(Impacts on Local Area Broadband Performance), but adapted to LSOAs. Variables included broadband measures (average download speeds, coverage, F-score), employment levels, deprivation, urban/rural category and population density. An additional variable was also included: the percentage of working-age residents claiming Universal Credit in the year before voucher support.
The results for the year after support are shown in the table below. Across all treatment years, the number of claimants increased in the year following support. This includes a sharp rise of 22.5% for areas treated in 2020, reflecting the impact of the Covid-19 pandemic on unemployment. This was an economy-wide trend rather than an increase that was specific to voucher areas. For areas supported in 2021, claimant numbers fell by 6.9% as the labour market began to recover.
When comparing treated areas with matched controls, there is very limited evidence that vouchers had a measurable effect on unemployment. For the 2018, 2019 and 2020 cohorts, differences between treated and control areas were not statistically significant in all of the models. For 2021, three of the models found significant positive effects, but this did not include the median model, so the evidence is not consistent.
Similar results were found over two- and three-year periods. Across the different treatment years, the estimated additional changes in claimant numbers are generally small, vary in direction, and are not statistically significant in most models. Although a small number of models for 2021 suggest a reduction in claimant numbers, these effects are modest, are not reflected in the median result, and are not consistent across models or over time. Taken together, the evidence does not point to a clear or sustained impact of vouchers on local unemployment. If vouchers were having a meaningful effect on claimant numbers, we would expect to see a more consistent pattern across years and model specifications.
Change in claimant count in voucher supported areas after one year
| Treatment year | Gross change (%) | Median additionalChange (pp) | Additionalchange range (pp) | Models significant | Median additionality |
|---|---|---|---|---|---|
| 2018 | 4.3 | 0.7 | 0.2 to 1.0* | 0 out of 9 | Not significant |
| 2019 | 3.5 | 0.3 | -0.2 to 0.5 | 0 out of 9 | Not significant |
| 2020 | 22.5 | 1.2 | -0.3 to 1.6* | 0 out of 9 | Not significant |
| 2021 | -6.9 | -0.7 | -1.4*** to -0.2 | 3 out of 9 | Not significant |
| Source: Belmana |
| Note: Significance levels are 1% (***), 5% (**) and 10% (*). |