Extractive industries in the UK: background information on the extractive industries
Published 25 February 2019

© Crown copyright 2019
This publication is licensed under the terms of the Open Government Licence v3.0 except where otherwise stated. To view this licence, visit nationalarchives.gov.uk/doc/open-government-licence/version/3 or write to the Information Policy Team, The National Archives, Kew, London TW9 4DU, or email: psi@nationalarchives.gov.uk.
Where we have identified any third party copyright information you will need to obtain permission from the copyright holders concerned.
This publication is available at https://www.gov.uk/government/publications/extractive-industries-transparency-initiative-payments-report-2017/extractive-industries-in-the-uk-background-information-on-the-extractive-industries
The extractive sector has made a sizeable contribution to the UK economy for many years, supporting substantial added value in downstream industries and related supply chains in addition to its direct output. As illustrated in Figure 1, below, by far the largest economic contribution comes from oil and gas production even though the value of that sector has halved in recent years. There is currently no UK state participation in the extractive industries.
Figure 1. Extractive Industry Gross Value Added (GVA)
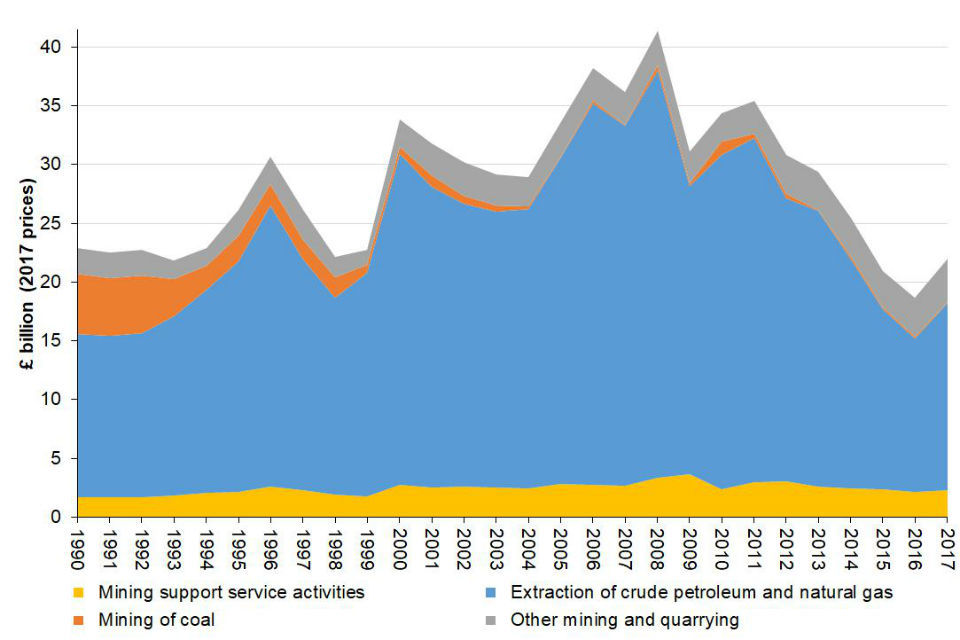
Graph showing extractive industry Gross Value Added (GVA) in £billion (2017 prices) for mining support service activities, mining of coal, extraction of crude petroleum and natural gas and other mining and quarrying.
Source: UK GDP(O) low level aggregates, ONS, December 2018.
In some of the summary information below, coal is grouped with oil and gas (for example where data are available for fossil fuels but not for other parts of the sector). However, for most of this chapter, oil and gas are treated separately from mining and quarrying, including coal. In addition, it should be noted that the phrase “mining and quarrying” as used in UK national statistics embraces the whole UK extractive sector including oil and gas production as well as coal production. Mining support services are also included in this sector. Some of the data reported below include those activities while other data exclude them.
Value of the sector
Table 1 shows GVA for the main components of the mining and quarrying sector as reported in UK national statistics. As noted above, this sector includes fossil fuel production, other mining and quarrying and mining support service activities, but excludes the value of products manufactured with extracted minerals. The table gives for each subsector its percentage share of total UK GVA for the most recent year. It also shows the whole sector’s GVA as a percentage of national gross domestic product (GDP) for each year.[footnote 1]
Table 1. Gross Value Added (GVA) (£ million)
| Mining of coal and lignite | Extraction of crude petroleum and natural gas |
Other mining and quarrying |
Mining support service activities | Total mining and quarrying etc |
Total GVA | Total GDP | Total | |
|---|---|---|---|---|---|---|---|---|
| (A) | (B) | (C) | (D) | (E) = (A)-(D) |
(F) | (G) | (E) / (G) | |
| 1990 | 2,876 | 7,815 | 1,207 | 944 | 12,843 | 611,573 | 1.3% | 656,249 |
| 1991 | 2,962 | 8,234 | 1,272 | 994 | 13,463 | 641,456 | 1.3% | 694,472 |
| 1992 | 3,026 | 8,618 | 1,331 | 1,042 | 14,018 | 663,486 | 1.3% | 722,555 |
| 1993 | 2,008 | 9,674 | 1,011 | 1,167 | 13,861 | 699,486 | 1.4% | 755,783 |
| 1994 | 1,300 | 11,069 | 985 | 1,335 | 14,690 | 733,775 | 1.5% | 795,283 |
| 1995 | 1,427 | 12,903 | 1,461 | 1,412 | 17,204 | 767,205 | 1.7% | 836,686 |
| 1996 | 1,230 | 16,371 | 1,602 | 1,790 | 20,994 | 820,116 | 2.0% | 889,454 |
| 1997 | 1,124 | 13,564 | 1,745 | 1,559 | 17,993 | 857,444 | 1.6% | 939,407 |
| 1998 | 1,222 | 11,673 | 1,203 | 1,325 | 15,424 | 893,067 | 1.3% | 976,101 |
| 1999 | 463 | 13,361 | 919 | 1,241 | 15,985 | 924,758 | 1.4% | 1,023,888 |
| 2000 | 420 | 20,187 | 1,696 | 1,973 | 24,277 | 976,824 | 2.1% | 1,076,299 |
| 2001 | 692 | 18,500 | 1,997 | 1,814 | 23,004 | 1,015,239 | 1.8% | 1,118,669 |
| 2002 | 499 | 17,764 | 2,095 | 1,946 | 22,305 | 1,064,659 | 1.7% | 1,166,105 |
| 2003 | 400 | 17,730 | 1,994 | 1,908 | 22,033 | 1,127,457 | 1.6% | 1,234,309 |
| 2004 | 218 | 18,395 | 1,908 | 1,906 | 22,428 | 1,180,753 | 1.6% | 1,300,783 |
| 2005 | 89 | 21,978 | 2,294 | 2,271 | 26,633 | 1,251,115 | 1.8% | 1,363,898 |
| 2006 | 213 | 26,571 | 2,250 | 2,227 | 31,262 | 1,321,047 | 2.0% | 1,451,140 |
| 2007 | 87 | 25,706 | 2,349 | 2,227 | 30,370 | 1,388,286 | 1.9% | 1,519,969 |
| 2008 | 433 | 29,882 | 2,529 | 2,890 | 35,735 | 1,429,641 | 2.1% | 1,584,212 |
| 2009 | 205 | 21,475 | 2,398 | 3,213 | 27,292 | 1,399,987 | 1.5% | 1,539,850 |
| 2010 | 993 | 25,325 | 2,129 | 2,136 | 30,584 | 1,429,621 | 1.8% | 1,572,710 |
| 2011 | 399 | 26,572 | 2,525 | 2,670 | 32,167 | 1,468,323 | 1.8% | 1,631,374 |
| 2012 | 359 | 22,151 | 3,076 | 2,811 | 28,398 | 1,514,910 | 1.5% | 1,678,699 |
| 2013 | 107 | 22,035 | 3,053 | 2,407 | 27,603 | 1,573,223 | 1.4% | 1,743,711 |
| 2014 | 211 | 18,595 | 3,140 | 2,339 | 24,286 | 1,645,955 | 1.1% | 1,827,014 |
| 2015 | 164 | 14,686 | 2,957 | 2,285 | 20,093 | 1,692,039 | 0.9% | 1,883,051 |
| 2016 | 116 | 12,747 | 3,277 | 2,134 | 18,275 | 1,756,045 | 0.7% | 1,946,324 |
| 2017 | 127 | 15,870 | 3,636 | 2,330 | 21,964 | 1,844,287 | 0.9% | 2,027,471 |
| % | 0.0% | 0.9% | 0.2% | 0.1% | 1.2% | 100.0% | - | - |
The percentages in the last row are shares of total GVA for all industries in the latest year shown.
Source: GDP output approach – low-level aggregates, ONS, February 2019
UK Economic Accounts: main aggregates, ONS, December 2018.
The following table gives a finer breakdown of the sector in the latest recent year for which data are available to give a sense of the scale of activity in each subsector. Although the data in both this table and the one above are sourced from official Office of National Statistics (ONS) data, they are not identical. Note that in value terms support service activities are almost entirely related to extraction of petroleum and natural gas.
Table 2. Mining and Quarrying (including Oil and Gas) – number of enterprises, GVA and employment costs in 2017
| SIC 07 Code | Description | Number of enterprises | Approximate gross value added at basic prices (aGVA) | Total employment costs |
|---|---|---|---|---|
| Number | £ million | £ million | ||
| 06 | Extraction of crude petroleum and natural gas | 150 | 12,618 | 2,079 |
| 09.1 | Support activities for petroleum and natural gas extraction | 218 | 2,378 | 1,674 |
| 08.11 | Quarrying of ornamental and building stone, limestone, gypsum, chalk and slate | 232 | 857 | 410 |
| 08.12 | Operation of gravel and sand pits; mining of clays and kaolin | 168 | 791 | 381 |
| 08.92 | Extraction of peat | 16 | 20 | 4 |
| 08.93 | Extraction of salt | 8 | 89 | 27 |
| 09.9 | Support activities for other mining and quarrying | 161 | 27 | 9 |
| B | Mining and quarrying | 1,234 | 16,984 | 4,716 |
Source: Non-financial business economy, UK (Annual Business Survey): 2017 provisional results, ONS, November 2018.
Government revenues
UK government accounts cover a financial year running from April–March rather than a calendar year, so some of the data on government revenues reported in this chapter are of necessity on a financial year basis. Where possible, calendar year data are (also) provided. The data relate only to the oil and gas sector, not mining and quarrying. This is because oil and gas companies have a distinct tax regime, allowing identification of their extractive-related tax payments (and repayments), whereas mining and quarrying companies pay mainstream corporation tax. This means the data for extractive-related tax receipts from mining and quarrying companies cannot be separated out. More details on tax revenues can be found in the oil and gas and mining and quarrying standalone chapters.
Section 106[footnote 2] payments are made (in England, plus equivalent payments made elsewhere in the UK) to local authorities relating to the granting of planning permission for mining operations to cover, for example, local road and infrastructure improvements. These are the only mandated social expenditure by extractive companies.
There are no non-monetary arrangements between extractive companies and the government in the UK.
Forecasts of UK government oil and gas revenues are published by the independent Office for Budget Responsibility (OBR). The OBR also publishes details of its underlying forecasts of oil and gas production, prices and expenditure broken down between exploration and appraisal, development capital expenditure, operating costs and decommissioning costs.
Exports
Table 3 includes ONS trade data for the mining and quarrying sector (including oil and gas) on the value of gross exports, gross imports and net imports. The UK both imports and exports all types of mining and quarrying production but is generally a net importer of each type.
Table 3. Value of Mining and Quarrying (including Oil and Gas) Exports and Imports
Gross exports
| £ million BOP Basis | Gross Exports 2013 |
Gross Exports 2014 |
Gross Exports 2015 |
Gross Exports 2016 |
Gross Exports 2017 |
|---|---|---|---|---|---|
| Coal | 91 | 60 | 49 | 49 | 61 |
| Lignite | 0 | 0 | 0 | 0 | 0 |
| Coal & lignite | 91 | 60 | 49 | 49 | 61 |
| Crude petroleum | 18,652 | 17,653 | 10,653 | 9,920 | 15,236 |
| Natural gas | 2,149 | 1,862 | 2,255 | 1,292 | 1,798 |
| Crude petroleum & natural gas | 20,801 | 19,515 | 12,908 | 11,212 | 17,034 |
| Iron ores | 3 | 6 | 3 | 0 | 0 |
| Non-ferrous metal ores | 11 | 8 | 20 | 39 | 56 |
| Metal ores | 14 | 14 | 23 | 39 | 56 |
| Unworked stone, gravel, sand etc | 253 | 291 | 264 | 265 | 289 |
| Mining & quarrying products n.e.c | 3,747 | 612 | 533 | 799 | 1,281 |
| Other mining & quarrying product | 4,000 | 903 | 797 | 1,064 | 1,570 |
| Mining & quarrying | 24,906 | 20,492 | 13,777 | 12,364 | 18,721 |
| Total Goods | 300,390 | 293,116 | 286,752 | 299,073 | 338,739 |
| Total Trade | 523,526 | 520,292 | 519,610 | 556,961 | 617,039 |
Gross imports
| £ million BOP Basis | Gross imports 2013 |
Gross imports 2014 |
Gross imports 2015 |
Gross imports 2016 |
Gross imports 2017 |
|---|---|---|---|---|---|
| Coal | 2,878 | 2,179 | 1,138 | 487 | 739 |
| Lignite | 0 | 0 | 0 | 0 | 0 |
| Coal & lignite | 2,878 | 2,179 | 1,138 | 487 | 739 |
| Crude petroleum | 25,477 | 21,497 | 11,817 | 10,508 | 16,242 |
| Natural gas | 10,442 | 7,407 | 6,478 | 6,011 | 8,420 |
| Crude petroleum & natural gas | 35,919 | 28,904 | 18,295 | 16,519 | 24,662 |
| Iron ores | 1,127 | 892 | 495 | 423 | 619 |
| Non-ferrous metal ores | 469 | 420 | 371 | 404 | 613 |
| Metal ores | 1,596 | 1,312 | 866 | 827 | 1,232 |
| Unworked stone, gravel, sand etc | 277 | 319 | 312 | 334 | 389 |
| Mining & quarrying products n.e.c | 3,757 | 876 | 692 | 1,009 | 1,419 |
| Other mining & quarrying product | 4,034 | 1,195 | 1,004 | 1,343 | 1,808 |
| Mining & quarrying | 44,427 | 33,590 | 21,303 | 19,176 | 28,441 |
| Total Goods | 419,380 | 415,187 | 404,562 | 431,725 | 475,774 |
| Total Trade | 552,562 | 549,967 | 546,594 | 587,848 | 641,472 |
Net imports
| £ million BOP Basis | 2013 | 2014 | 2015 | 2016 | 2017 |
|---|---|---|---|---|---|
| Coal | 2,787 | 2,119 | 1,089 | 438 | 678 |
| Lignite | 0 | 0 | 0 | 0 | 0 |
| Coal & lignite | 2,787 | 2,119 | 1,089 | 438 | 678 |
| Crude petroleum | 6,825 | 3,844 | 1,164 | 588 | 1,006 |
| Natural gas | 8,293 | 5,545 | 4,223 | 4,719 | 6,622 |
| Crude petroleum & natural gas | 15,118 | 9,389 | 5,387 | 5,307 | 7,628 |
| Iron ores | 1,124 | 886 | 492 | 423 | 619 |
| Non-ferrous metal ores | 458 | 412 | 351 | 365 | 557 |
| Metal ores | 1,582 | 1,298 | 843 | 788 | 1,176 |
| Unworked stone, gravel, sand etc | 24 | 28 | 48 | 69 | 100 |
| Mining & quarrying products n.e.c | 10 | 264 | 159 | 210 | 138 |
| Other mining & quarrying product | 34 | 292 | 207 | 279 | 238 |
| Mining & quarrying | 19,521 | 13,098 | 7,526 | 6,812 | 9,720 |
| Total Goods | 118,990 | 122,071 | 117,810 | 132,652 | 137,035 |
| Total Trade | 29,036 | 29,675 | 26,984 | 30,887 | 24,433 |
Source: UK trade in goods, CPA (08) ONS, December 2018
Balance of Payments: Trade in Goods & Services: Total imports: CP SA £m ONS, December 2018.
Gross exports in 2017 amounted to 3.0% of total UK gross exports.
Table 4 includes data published by BEIS on the volume and value of gross exports, gross imports and net imports of fossil fuels (coal, oil and gas).
Table 4. Volume and Value of Coal, Oil and Gas Exports and Imports
Volume of exports
| Year | Coal (mtoe) |
Oil (mtoe) |
Natural Gas (mtoe) |
Oil & Gas (mtoe) |
|---|---|---|---|---|
| 2013 | 0.448 | 36.192 | 9.429 | 45.622 |
| 2014 | 0.319 | 33.774 | 10.998 | 44.772 |
| 2015 | 0.290 | 36.867 | 13.716 | 50.583 |
| 2016 | 0.333 | 38.180 | 10.048 | 48.228 |
| 2017 | 0.369 | 42.040 | 10.802 | 52.842 |
Value of exports
| Year | Coal (£ million) |
Oil (£ million) |
Natural Gas (£ million) |
Oil & Gas (£ million) |
|---|---|---|---|---|
| 2013 | 90 | 17,460 | 2,510 | 19,970 |
| 2014 | 55 | 14,625 | 2,000 | 16,625 |
| 2015 | 45 | 9,915 | 2,310 | 12,225 |
| 2016 | 50 | 9,200 | 1,350 | 10,550 |
| 2017 | 60 | 12,835 | 1,830 | 14,665 |
Volume of imports
| Year | Coal (mtoe) |
Oil (mtoe) |
Natural Gas (mtoe) |
Oil & Gas (mtoe) |
|---|---|---|---|---|
| 2013 | 32.888 | 64.489 | 47.139 | 111.628 |
| 2014 | 27.581 | 58.676 | 42.041 | 100.718 |
| 2015 | 14.885 | 55.407 | 43.127 | 98.534 |
| 2016 | 5.812 | 53.479 | 45.980 | 99.458 |
| 2017 | 5.807 | 58.480 | 45.133 | 103.613 |
Value of imports
| Year | Coal (£ million) |
Oil (£ million) |
Natural Gas (£ million) |
Oil & Gas (£ million) |
|---|---|---|---|---|
| 2013 | 3,235 | 30,010 | 10,985 | 40,995 |
| 2014 | 2,260 | 24,335 | 7,635 | 31,970 |
| 2015 | 985 | 12,645 | 6,990 | 19,635 |
| 2016 | 565 | 11,200 | 6,150 | 17,350 |
| 2017 | 710 | 16,165 | 7,565 | 23,730 |
Volume of net exports
| Year | Coal (mtoe) |
Oil (mtoe) |
Natural Gas (mtoe) |
Oil & Gas (mtoe) |
|---|---|---|---|---|
| 2013 | -32.440 | -28.297 | -37.710 | -66.006 |
| 2014 | -27.262 | -24.902 | -31.043 | -55.945 |
| 2015 | -14.596 | -18.540 | -29.411 | -47.951 |
| 2016 | -5.479 | -15.299 | -35.931 | -51.230 |
| 2017 | -5.437 | -16.441 | -34.330 | -50.771 |
Value of net exports
| Year | Coal (£ million) |
Oil (£ million) |
Natural Gas (£ million) |
Oil & Gas (£ million) |
|---|---|---|---|---|
| 2013 | -3,145 | -12,550 | -8,475 | -21,025 |
| 2014 | -2,205 | -9,710 | -5,635 | -15,345 |
| 2015 | -940 | -2,730 | -4,680 | -7,410 |
| 2016 | -515 | -2,000 | -4,800 | -6,800 |
| 2017 | -650 | -3,330 | -5,735 | -9,065 |
Source: Digest of UK Energy Statistics (DUKES) 2018
Employment
Table 5 gives estimates of the total UK workforce jobs directly supported by the UK mining and quarrying sector including its major sub-sectors. It also shows the estimates as shares of the total workforce jobs for all industries. The extractive industries are typically capital- rather than labour-intensive and correspondingly represent a significantly smaller share of workforce jobs than of GVA.
Table 5. Workforce jobs estimates
| (thousand) | Mining of coal and lignite Extraction of crude petrol / gas [SIC (2007) Divisions 05-06] |
Mining of metal ores Other mining and quarrying [SIC (2007) Divisions 07-08] |
Mining support service activities [SIC (2007) Division 09] |
Total mining & quarrying etc [SIC (2007) Section B] |
Total Industries [SIC (2007) Sections A-T] |
|---|---|---|---|---|---|
| 2013 | 22 | 18 | 30 | 70 | 32,168 |
| 2014 | 21 | 17 | 29 | 68 | 33,223 |
| 2015 | 20 | 21 | 30 | 71 | 33,763 |
| 2016 | 18 | 21 | 24 | 63 | 34,339 |
| 2017 | 15 | 19 | 25 | 59 | 34,682 |
| 2017 | 0.0% | 0.1% | 0.1% | 0.2% | 100.0% |
Source: Regional labour market statistics in the UK, ONS, December 2018
Table 6 shows estimates of extractive industry employment in Great Britain (GB) (for instance the UK excluding Northern Ireland) at a finer level of disaggregation than is available for the workforce jobs estimates for the UK.
Table 6. Extractive Industry Employment in Great Britain and United Kingdom (in thousands)
| SIC 2007 | Industry | 2013 | 2014 | 2015 | 2016 | 2017 |
|---|---|---|---|---|---|---|
| GB 05101 | Deep coal mines | 2.2 | 1.6 | 0.9 | * | - |
| GB 05102 | Open cast coal working | 2.4 | 1.3 | 1.1 | * | 1.2 |
| GB 05 | Mining of coal | 4.6 | 2.9 | 2.0 | 1.1 | 1.3 |
| GB 06 | Extraction of crude petroleum and natural gas | 15.5 | 16.6 | 15.7 | 15.2 | 12.2 |
| GB 08110 | Quarrying of ornamental and building stone; limestone; gypsum; chalk and slate | 4.9 | 6.7 | 7.4 | 8.6 | 7.7 |
| GB 08120 | Operation of gravel and sand pits; mining of clays and kaolin | 7.0 | 7.1 | 7.7 | 6.9 | 7.0 |
| GB 081 | Quarrying of stone; sand and clay | 12.0 | 13.8 | 15.1 | 15.5 | 14.7 |
| GB 08930 | Extraction of salt | 0.3 | 0.4 | 0.4 | 0.3 | 0.3 |
| GB 08990 | Other mining and quarrying n.e.c. | 1.1 | 1.1 | 1.3 | 1.2 | 0.9 |
| GB 089 | Mining and quarrying n.e.c. | 2.4 | 2.7 | 3.2 | 2.4 | 2.0 |
| GB 08 | Other mining and quarrying (other than mining of metal ores) | 14.4 | 16.4 | 18.3 | 17.9 | 16.7 |
| GB 091 | Support activities for petroleum and natural gas extraction | 21.2 | 25.1 | 22.4 | 18.8 | 19.4 |
| GB 099 | Support activities for other mining and quarrying | 0.4 | 0.3 | 0.4 | 0.4 | 0.3 |
| GB 09 | Mining support service activities | 21.6 | 25.4 | 22.9 | 19.2 | 19.8 |
| GB 05–09 | Total Extractive Industries | 56.1 | 61.3 | 58.9 | 53.4 | 50.0 |
| GB 06, 09 | of which Oil and Gas Extraction and Support Services | 36.7 | 41.7 | 38.1 | 34.0 | 31.6 |
| UK 05, 06 | Mining of coal and lignite; Extraction of crude petrol/gas | 22 | 21 | 20 | 18 | 16 |
| UK 07, 08 | Mining of metal ores; Other mining and quarrying | 18 | 17 | 21 | 21 | 19 |
| UK 09 | Mining support service activities | 30 | 29 | 30 | 25 | 27 |
| UK 05–09 | Total Extractive Industries | 70 | 68 | 71 | 64 | 63 |
Notes:
- data for 2014 and 2015 come from the provisional rather than revised results.
- employment is defined as employees plus working proprietors.
- figures are rounded to the nearest thousand and to one decimal place. For example, 2.4 is equal to 2,400 and represents a figure in the range 2,350–2,449. Figures may not add up due to rounding.
- cells containing an asterisk (*) represent disclosive data that cannot be published.
- cells containing a hyphen (-) represent a zero or less than 50.
Source: ONS, Business Register and Employment Survey (Table 2a).
All extractive employment shown in the tables above is in the private sector.
Extractive industry employment levels have fallen markedly from their historic peak decades ago, mainly due to the decline of the coal industry, but extractive-related activities still contribute significantly to local employment in a number of regions.
Regional location of extractive industries
The broad geographic spread of employment in the UK extractive sector (including oil and gas and mining support service activities) is illustrated in Table 7. The concentration of employment in Scotland reflects the dominance of the Aberdeen area in terms of oil and gas-related activity. While the importance of the sector for the Scottish economy is no surprise, the relatively high share of activity in the East Midlands is noteworthy.
Table 7. Regional distribution of extractives activity
Gross Value Added (Income Approach – see notes 1 and 2) at current basic prices (£ billion): Mining and quarrying including oil and gas
| Region name | 2013 (£ billion) |
2014 (£ billion) |
2015 (£ billion) |
2016 (£ billion) |
2017 (see note 3) (£ billion) |
|---|---|---|---|---|---|
| North East | 0.34 | 0.38 | 0.28 | 0.25 | 0.28 |
| North West | 0.17 | 0.18 | 0.27 | 0.27 | 0.31 |
| Yorkshire and The Humber | 0.32 | 0.33 | 0.29 | 0.29 | 0.32 |
| East Midlands | 0.48 | 0.56 | 0.46 | 0.50 | 0.59 |
| West Midlands | 0.10 | 0.11 | 0.12 | 0.11 | 0.13 |
| East of England | 0.17 | 0.24 | 0.23 | 0.23 | 0.29 |
| London | 0.27 | 0.19 | 0.18 | 0.21 | 0.22 |
| South East | 0.47 | 0.45 | 0.33 | 0.32 | 0.36 |
| South West | 0.45 | 0.39 | 0.22 | 0.22 | 0.31 |
| England | 2.76 | 2.82 | 2.37 | 2.39 | 2.81 |
| Wales | 0.25 | 0.24 | 0.23 | 0.25 | 0.29 |
| Scotland | 2.74 | 2.72 | 2.62 | 2.76 | 3.28 |
| Northern Ireland | 0.13 | 0.13 | 0.14 | 0.15 | 0.18 |
| Extra-Regio (see note 4) |
21.72 | 18.38 | 14.74 | 12.73 | 14.84 |
| United Kingdom | 27.60 | 24.29 | 20.09 | 18.28 | 21.40 |
Notes:
1. Estimates of workplace based GVA allocate incomes to the region in which the economic activity takes place
2. Components may not sum to totals as a result of rounding.
3. Provisional.
4. The GVA for Extra-Regio comprises compensation of employees, holding gains and gross trading profits which cannot be assigned to regions.
2017 shares of UK less Extra-Regio (Extra-Regio of UK): Mining and quarrying including oil and gas
| Region name | Gross Value Added | Gross Trading Profits | Compensation of Employees |
|---|---|---|---|
| North East | 4.3% | 5.2% | 3.3% |
| North West | 4.8% | 6.4% | 2.7% |
| Yorkshire and The Humber | 4.8% | 5.4% | 4.0% |
| East Midlands | 8.9% | 11.4% | 6.7% |
| West Midlands | 2.0% | 2.1% | 1.5% |
| East of England | 4.4% | 5.2% | 3.2% |
| London | 3.4% | 3.2% | 2.1% |
| South East | 5.5% | 6.7% | 3.9% |
| South West | 4.7% | 4.7% | 4.5% |
| England | 42.9% | 50.3% | 31.8% |
| Wales | 4.4% | 5.4% | 3.4% |
| Scotland | 49.9% | 41.2% | 62.4% |
| Northern Ireland | 2.8% | 3.1% | 2.4% |
| Extra-Regio (see note 4) | 69.3 % | 79.2% | 56.8% |
| Share of GVA | 100.0% | 64.7% | 33.8% |
Note 4. The GVA for Extra-Regio comprises compensation of employees, holding gains and gross trading profits which cannot be assigned to regions.
2017 shares of UK less Extra-Regio (Extra-Regio of UK): all industries
| Region name | Gross Value Added | Gross Trading Profits | Compensation of Employees |
|---|---|---|---|
| North East | 3.0% | 2.7% | 3.1% |
| North West | 9.5% | 9.7% | 9.8% |
| Yorkshire and The Humber | 6.6% | 5.8% | 7.0% |
| East Midlands | 5.8% | 5.5% | 6.1% |
| West Midlands | 7.4% | 7.2% | 7.8% |
| East of England | 8.7% | 8.7% | 8.6% |
| London | 23.5% | 26.1% | 22.3% |
| South East | 14.7% | 14.9% | 14.2% |
| South West | 7.4% | 6.8% | 7.5% |
| England | 86.6% | 87.3% | 86.4% |
| Wales | 3.4% | 3.0% | 3.6% |
| Scotland | 7.8% | 7.5% | 7.9% |
| Northern Ireland | 2.2% | 2.2% | 2.2% |
| Extra-Regio (see note 4) |
0.9% | 2.7% | 0.6% |
| Share of GVA | 100.0% | 22.5% | 55.4% |
Note 4. The GVA for Extra-Regio comprises compensation of employees, holding gains and gross trading profits which cannot be assigned to regions.
Source: Regional gross value added (income approach), UK: 1997 to 2017, ONS, December 2018.
Almost all UK oil and gas production comes from fields located offshore. Maps showing the location of oil and gas fields in GB and on the UK Continental Shelf (UKCS) are published online by the Oil and Gas Authority (OGA). These maps also show which areas are under licence offshore and onshore in Great Britain. A map showing which areas are under licence in Northern Ireland is published by the Northern Ireland Department for the Economy (DfE) but there is as yet no production there.
The majority of coal production comes from sites in Scotland, England and South Wales, as mapped by the Coal Authority. The mining and quarrying of non-hydrocarbon minerals are widely distributed across the UK. There are no significant hard-rock aggregate deposits in the South and East of England, so these materials are transported for use in these regions from further afield in the Midlands and South West in particular.
UK fossil fuel production and UK energy demand
UK production of fossil fuels has been, and continues to be, significant in terms of meeting UK energy demand. This is particularly true of oil and gas but, nowadays, much less so for coal. While the share of total demand represented by fossil fuels has been declining, they still account for more than four fifths of total primary energy demand and are forecast to account for more than two thirds of total primary energy demand even in 2035.[footnote 3]
Figure 2. UK fossil fuel production and primary energy demand
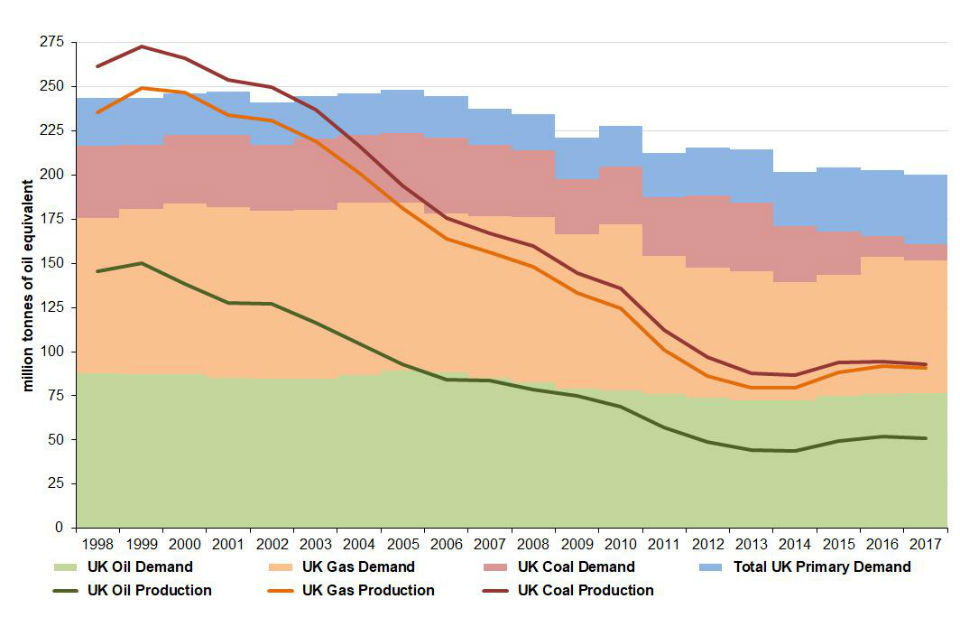
Graph showing UK fossil fuel production and primary energy demand graph for 1998-2017 for million tonnes of oil equivalent. Demand and production covers oil, gas and coal.
Source: Energy Trends: total energy, Table 1.3, December 2018.
Figure 3. Destination of UK oil production and sources of UK oil supply, 2017

Graph showing destination of UK oil production and sources of UK oil supply in 2017 in million tonnes for both UK production and UK refinery crude supply.
Source: Digest of UK Energy Statistics (DUKES), July 2018 (principally Table G4).
Figure 4. UK monthly gas supply
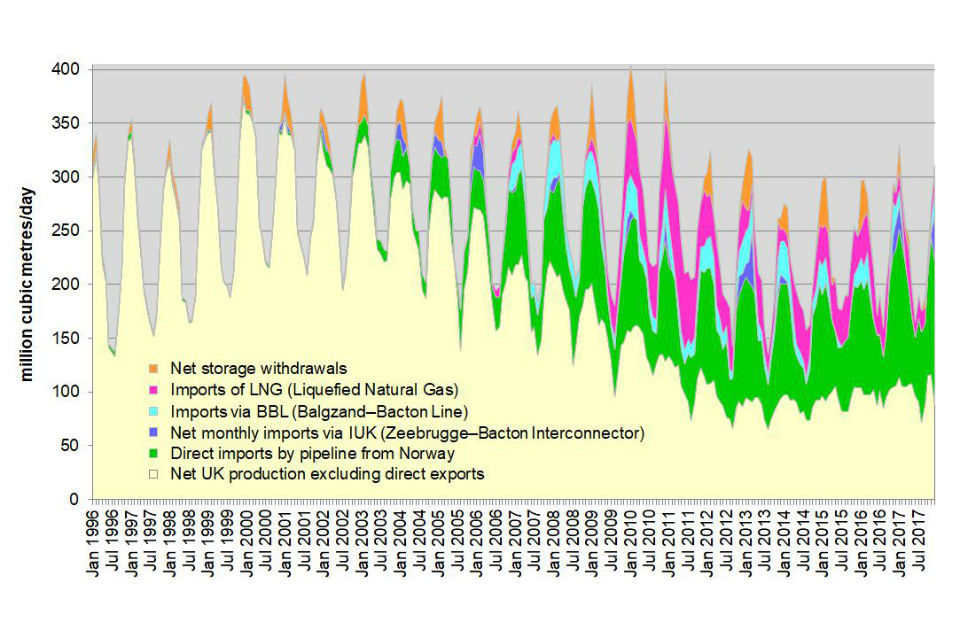
Graph showing UK monthly gas supply in million cubic metres a day from January 1996 to July 2018.
Source: Energy Trends: gas, tables 4.2 and 4.3, December 2018.
Figure 5. Sources of UK gas supply on a rolling 12 month basis
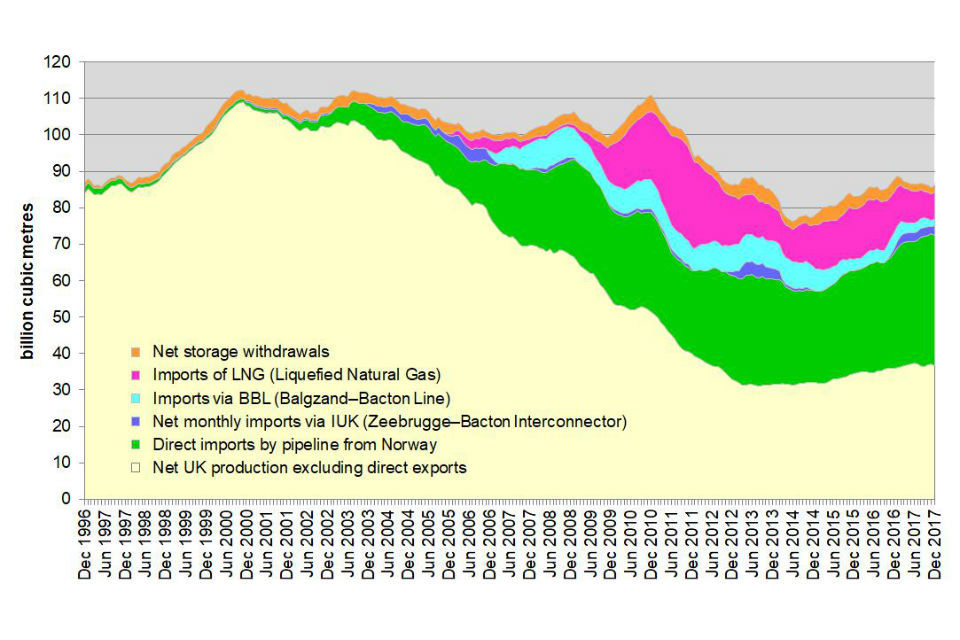
Graph showing sources of UK gas supply on a rolling 12 month basis in billion cubic metres for the period December 1996 to June 2018.
Source: Energy Trends: gas, tables 4.2 and 4.3, December 2018.
-
Generally, in this chapter, unlike in the ONS table and some other official sources, a terminological distinction is made between “oil and gas” and “[other] mining and quarrying”, the latter comprising the extraction of coal and of all non-hydrocarbon minerals. In this report, as in last year’s, we have included mining support service activities in the total for the sector when calculating its contribution to GDP. ↩
-
Section 106 of the Town and Country Planning Act 1990. ↩