Evaluation of endpoint PCR (EPCR) as a central laboratory based diagnostic test technology for SARS-CoV-2
Published 28 January 2021

© Crown copyright 2021
This publication is licensed under the terms of the Open Government Licence v3.0 except where otherwise stated. To view this licence, visit nationalarchives.gov.uk/doc/open-government-licence/version/3 or write to the Information Policy Team, The National Archives, Kew, London TW9 4DU, or email: psi@nationalarchives.gov.uk.
Where we have identified any third party copyright information you will need to obtain permission from the copyright holders concerned.
This publication is available at https://www.gov.uk/government/publications/evaluation-of-endpoint-pcr-epcr-as-a-diagnostic-test-technology-for-sars-cov-2/evaluation-of-endpoint-pcr-epcr-as-a-central-laboratory-based-diagnostic-test-technology-for-sars-cov-2
Executive summary
The UltraDX SARS-CoV-2 N1/N2/RP assay (LGC, Biosearch Technologies) was evaluated according to the published Technical Validation Group protocol.
UK BioCentre Ltd (UKBC) evaluated EPCR molecular testing technologies, which are designed as high-sensitivity, ultra-high capacity (more than 150,000 tests per day, per instrument) diagnostic assays to detect SARS-CoV-2 RNA extracted from combined throat and nose swab specimens.
The EPCR assay was assessed on combined throat and nose swab samples received by NHS Test and Trace at the Milton Keynes Lighthouse Laboratory. Over 65,000 specimens were tested over multiple pilot-stage trials and subsequent deployment readiness studies.
The results of these studies were that EPCR testing on combined throat and nose swabs, with RNA extraction, had a sensitivity of 98.56% (CI 0.976% to 0.992%) and specificity of 99.8% (CI 0.997 to .998) across all samples tested (CT less than 40 by real-time PCR comparator). Concordance testing showed near total concordance (Cohen’s Kappa 0.94) with existing Taqpath real time PCR. Analytical sensitivity of EPCR is 50 digital copies / ml which is slightly better than standard of care Taqpath real-time PCR. This demonstrates that EPCR technology gives viral detection with excellent sensitivity and specificity, offering the option to use it as an alternative to real-time PCR.
EPCR offers highly scalable assay technology; this can be used to expand the national test programme capability through development of ultra-high-throughput diagnostic laboratories. UKBC has now established an expanded facility ready for routine ultra-high-throughput testing (greater than 125,000 EPCR tests per day).
1. Background
1.1 While central lab testing using gold-standard real-time PCR assays has been essential to help mitigate and manage the SARS-CoV-2 (COVID-19) pandemic, growing overall central lab test capacity to meet our substantial community needs require new, highly scalable test technologies that do not sacrifice high test quality.
1.2 Assay batch size and unit-based test manufacturing limits real-time PCR capacity: standard laboratory consumables and instruments are anchored around single-unit 96- or 384-well assay plate configurations created for basic research applications. Additionally, quantitative real-time PCR assay methods use time-intensive and complex assay monitoring approaches to derive simple ‘positive’ or ‘negative’ qualitative outcomes for patients. Viral detection through real-time PCR testing estimates relative viral RNA quantity by periodically measuring the assay reaction in real time.
1.3. EPCR offers a simple but efficient means to boost PCR test capacity. The technology incorporates rapid sample testing into a large batch-size, continuous manufacturing process (greater than or equal to 15,000 samples per run), and takes a single, highly sensitive measurement of the PCR assay end-products, to speed viral RNA detection to less than 1.5 hours per each assay run time. Through modest re-configurations of the same underlying test technology as real-time PCR testing, EPCR can maintain high test performance while greatly expanding test capacity. Two EPCR instrument systems are designed to have greater capacity than 60 to 70 real-time PCR instruments running on a continuous basis.
1.4. This report outlines the technical validation undertaken in conjunction with the NHS Test and Trace Technical Validation Group (TVG). The studies were conducted using samples obtained directly through the NHS Test and Trace Lighthouse laboratory network campaign, and therefore provide real-world evidence from ongoing community mass-testing efforts. With an intent to utilise EPCR technology within the National Testing Programme, UBKC has recently sought diagnostic use approval under a derogation application with the Medicines and Healthcare products Regulatory Agency (MHRA). UKBC's application to provide an EPCR mass-test offering was built from a series of pilot readiness and deployment studies run at the facility, and the company intends to offer greater than 125,000 EPCR tests per day.
2. Technical validation
2.1. The Technical and Validation Group was established under NHS Test and Trace. It includes NHS and PHE experts and working closely with MHRA and research bodies. The Technical and Validation function considers manufacturers of SARS-CoV-2 (COVID-19) tests for viral detection and registers their interest in the national procurement process if their test meets, or is intended to meet, the requirements of the relevant MHRA target product profiles. The Technical and Validation function reviews product information; undertakes technical and clinical validation; and establishes and/or works with service evaluation projects and pilots.
Assay description and intended purpose
2.2 Endpoint polymerase chain reaction (EPCR) technology is a high-processivity PCR assay alternative to diagnostic testing using standard real-time PCR instruments. EPCR can be configured for reverse-transcription and PCR assays that detect viral RNA in human specimens. EPCR instruments rapidly formulate large numbers of PCR reactions into reaction vessel ‘arrays’ using micro-jet dispense technology, which also further miniaturises assay volumes below those typical for 96- or 384-well plate tests. EPCR thermocycling and assay detection can be scaled up to batch sizes exceeding 15,000 diagnostic tests per 1.5 hour end-to-end process run, while providing sensitive qualitative diagnostic determinations of viral gene presence (similar to real-time PCR), according the total fluorescence generated upon PCR assay completion.
2.3 An EPCR assay specific for SARS-CoV-2, called UltraDx SARS-CoV-2 N1/N2/RP assay (LGC, Biosearch Technologies), contains 2, CDC-characterised amplicon primer sets with 2 separate probes using same fluorescence-based (FAM dye) detection of the viral N-Gene RNA segment in standard RT-PCR reaction conditions. Input RNA extracted from swab specimens is combined with RT-PCR reaction mixes (in NEXAR), and then reaction arrays for up 15,000 test assays can be amplified using a water-bath tank thermocycler (Hydrocycler). EPCR assays are run to completion following 50 cycles of PCR, and the reactions are then measured by a single scan on a multi-channel fluorescence reader (Araya) —a rolling spool feeds the entire assay set through the array detector during measurement. A multiplex RNase P primer set is utilised as an internal extraction process control, and a passive reference monitoring dye (ROX) is added to each reaction as a dispense and assay interference process control.
2.4 The UltraDx SARS-CoV-2 N1/N2/RP assay is a test for the detection of SARS-CoV-2 in clinical specimens (combined throat and mouth swabs). The assay is intended for use by professionals trained in laboratory settings in the detection of SARS-CoV-2 RNA in association with the LGC’s Biosearch Technologies SARS-CoV-2 PCR-based testing systems.
2.5 All samples were collected in community surveillance and epidemiologic monitoring settings through pillar 2 of the NHS Test and Trace programme. The EPCR validation was performed on combined throat and mouth) swabs. Swabs were collected in viral transport medium (various manufacturers, previously evaluated and validated in the pillar 2 programme).
2.6 The specific equipment required to perform testing on the UltraDx SARS-CoV-2 N1/N2/RP assay was supplied by UKBC (the MHRA derogation sponsor, and supply manufacturer for approved use in the UK prior to CE-IVD authorisation). Laboratory consumables, including RNA extraction kits already validated in standard real-time PCR workstreams (Thermo MagMax platform), were also supplied by UKBC.
Performance characteristics
2.7 Analytical Sensitivity of SARS COV-2 targets
The analytical sensitivity (ASe) for the UltraDx SARS-CoV-2 N1/N2/RP assay was evaluated using RNA extracted from a panel of inactivated virus inputs ranging from 106/ml to 101/ml (Qnostics Analytical Q Panel, Product Number: SCV2AQP). Samples were extracted using standard RNA extraction procedures with Thermo MagMax reagents and consumables, and RNA inputs were assayed in parallel by real-time PCR using the TaqPath™ COVID‑19 CE‑IVD RT‑PCR Kit (Thermo) (called Taqpath real-time PCR in this document) as a comparator. Similar to the manufacturer's instructions for use, real-time PCR detected to 102 copies/ml (500 copies/ml).
Analytical sensitivity of EPCR is 101 copies / ml (50 digital copies / ml) (see table 1 below).
Table 1: analytical range performance of EPCR on inactivated whole virus
| Concentration (digital copies/ml) | Positive control specimen replicate 1 |
Positive control specimen RNA extraction replicate 2 |
Positive control specimen RNA extraction replicate 3 |
|---|---|---|---|
| 1,000,000 | Positive | Positive | Positive |
| 100,000 | Positive | Positive | Positive |
| 10,000 | Positive | Positive | Positive |
| 5,000 | Positive | Positive | Positive |
| 1,000 | Positive | Positive | Positive |
| 500 | Positive | Positive | Positive |
| 100 | Positive | Positive | Positive |
| 50 | Positive | Positive | Positive |
| Negative | Negative | Negative | Negative |
Table 1 criteria for acceptance: in at least 2 of 3 independent extraction control specimens, confirmation of positive detection to at least 50 digital copies per ml. Samples were collected and tests were performed between 26 September and 28 September 2020.
2.9 Precision and robustness
Repeatability was measured by running was measured by testing 188 replicates of an RNA extracted from whole inactivated virus control at 500 copies / ml (Qnostics). Samples were run over 3 separate days, with a minimum of 36 samples a day, assayed on at least 2 separate instrument assay runs. Total PCR assay signal at endpoint (normalised N gene fluorescence) showed a coefficient of variation of 16.4% across all three days. response signal appeared digital, with a rate of qualitative failure to detect the positive control less than 6% on any day, and 4.10% across all 3 days.
Table 2: repeatability
| Factor | Day 1 | Day 2 | Day 3 | All Days |
|---|---|---|---|---|
| All specimens | 36 | 56 | 96 | 188 |
| Normalised N1/N2 endpoint fluorescence (arbitrary units) | 10.44 | 10.74 | 10.63 | 10.62 |
| Standard deviation | 1.69 | 0.95 | 2.07 | 1.73 |
| Coefficient of variation | 16.2% | 8.9% | 19.5% | 16.3% |
| Control specimens below detected threshold (FU \<8) | 2 | 2 | 4 | 8 |
| Rate of positive control failure | 5.26% | 3.45% | 4.00% | 4.08% |
Table 2 criteria for acceptance: less than 5% test failure over all days. Samples were collected and tests were performed on 26 September and 28 September 2020.
Inter-operator precision was assessed by assaying 7,068 RNA specimens obtained under routine swab testing operations and provided to 2 independent operator teams in a blinded fashion. Test agreement between the 2 teams was 96.74%.
Table 3: inter-operator precision
| Staff team 1 | Staff team 2 | Numbers |
|---|---|---|
| Positive | Positive | 605 |
| Positive | Negative | 32 |
| Negative | Positive | 77 |
| Negative | Negative | 4,973 |
| Negative | Void | 32 |
| Void | Positive | 0 |
| Void | Negative | 0 |
| Void | Void | 19 |
Table 3 criteria for acceptance: inter-operator precision. at least 95% test agreement between independent operator teams. Samples were collected and tests were performed on 10 December and 11 December 2020.
2.10 Analytical specificity (cross-reactions)
The analytical specificity of the panel of sequences used in the SARS-CoV-2 endpoint PCR diagnostic testing (EPCR test) was assessed for cross-reactivity in an external publication from the CDC. No cross-reactivity is reported for a wide range of viral respiratory pathogens including other corona and influenza viruses. (See table 4 below).
Table 4: cross-reactivity of the US CDC rtPCR panel for detection of SARS-CoV-2 against other respiratory pathogens
Reproduced from Lu X, Wang L, Sakthivel SK, Whitaker B, Murray J, Kamili S, et al., US CDC Real-Time Reverse Transcription PCR Panel for Detection of Severe Acute Respiratory Syndrome Coronavirus 2, (Emerg Infect Dis. 2020;26(8):1654 to 1665).
| Pathogen (strain) | Source | Other pathogens rtPCR (Ct) | N1 SARS-CoV-2 rtPCR | N2 SARS-CoV-2 rtPCR |
|---|---|---|---|---|
| Adenovirus C1 (Ad.71) | Virus isolate | Pos (14.0) | Neg | Neg |
| Bocavirus | Clinical specimen | Pos (14.9) | Neg | Neg |
| Coronavirus 229E | Virus isolate | Pos (9.6) | Neg | Neg |
| Coronavirus OC43 | Virus isolate | Pos (12.9) | Neg | Neg |
| Coronavirus HKU1 | Clinical specimen | Pos (22.3) | Neg | Neg |
| Coronavirus MERS | Virus isolate | Pos (14.3) | Neg | Neg |
| Coronavirus NL63 | Clinical specimen | Pos (21.9) | Neg | Neg |
| Coronavirus SARS (Urbani) | Virus isolate | Pos (27.3) | Neg | Neg |
| Enterovirus D68 | Virus isolate | Pos (21.3) | Neg | Neg |
| Human metapneumovirus (CAN 99–81) | Virus isolate | Pos (13.8) | Neg | Neg |
| Influenza A H1N1 (A/India/2012) | Virus isolate | Pos (14.7) | Neg | Neg |
| Influenza B (B/Massachusetts/1999) | Virus isolate | Pos (8.4) | Neg | Neg |
| Influenza B (B/Massachusetts/1999) | Virus isolate | Pos (8.4) | Neg | Neg |
| Parainfluenza 1 (C35) | Virus isolate | Pos (17.2) | Neg | Neg |
| Parainfluenza 2 (Greer) | Virus isolate | Pos (17.1) | Neg | Neg |
| Parainfluenza 3 (C-43) | Virus isolate | Pos (20.4) | Neg | Neg |
| Parainfluenza 4a (M-25) | Virus isolate | Pos (16.7) | Neg | Neg |
| Parainfluenza 4b (CH 19503) | Virus isolate | Pos (18.2) | Neg | Neg |
| Respiratory syncytial virus (Long) | Virus isolate | Pos (15.1) | Neg | Neg |
| Rhinovirus 1A | Virus isolate | Pos (15.9) | Neg | Neg |
| Mycoplasma pneumoniae | Cultured bacteria | Pos (20.7) | Neg | Neg |
| Streptococcus pneumoniae | Cultured bacteria | Pos (21.1) | Neg | Neg |
3. Diagnostic sensitivity and specificity
Clinical validation with confirmed positives and negatives
3.1 Incoming combined throat and nose swab samples (n= 39,986), excluding voids, from the Milton Keynes Lighthouse Laboratory were tested and analysed for test method validation
Validation study specimens were selected randomly during routine daily processing at the Milton Keynes Lighthouse Laboratory and are therefore fully representative of the range of clinical sample diversity.
3.2 Diagnostic sensitivity: confirmed clinical samples from patients (positive real-time PCR result) were compared across platforms. The qualitative diagnostic determination for both the assessed and comparator assays were included in the submitted validation data. Cycle threshold (real-time PCR) and endpoint fluorescence EPCR data were supplied.
- 906 positive swabs as determined by real-time PCR were analysed by EPCR inclusive of voids
3.3 Diagnostic assay performance: confirmed clinical samples from patients (negative Real-time PCR result) were used. The CT values or equivalent for both the assessed and comparator assays were included in the submitted validation data.
- 39,157 negative swabs as determined by real-time PCR were analysed by EPCR inclusive of voids
3.4 The diagnostic sensitivity (DSe) and specificity (DSp) derived from section 3.2 and 3.3 are as follows (see table 5 below). DSe and DSp (95% Confidence Intervals (CI)) for all samples are summarised below:
• EPCR on swabs: DSe 98.6% (CI 0.976-0.992); DSp 99.8% (CI 0.997-0.998).
The calculation of diagnostic sensitivity assumes TaqPathTM COVID-19 CE-IVD RT-PCR Kit is the most-sensitive standard index test.
Cohen’s Kappa
3.5 Cohen's kappa was 0.94, which passed acceptance criteria set at minimum of 0.8 (above a level of good to excellent). This is near-total concordance.
Cohen’s kappa assesses predictive performance corrected joint test trial size: measures in excess of 0.8 suggest testing agreement performance should be robust to higher sample capacity and life-time diagnostic run performance. Alongside confidence level boundaries for sensitivity and specificity, Cohen's measure indicates that test trial size and random effects did not materially impact our assessments.
Table 5: concordance testing summary (post- analytical QC filtering)
| EPCR (UltraDx SARS-CoV-2 N1/N2/RP assay) | Taqpath real-time PCR positive | Taqpath real-time PCR negative | Taqpath real-time PCR void |
|---|---|---|---|
| Positive | 889 | 92 | 0 |
| Negative | 13 | 38,915 | 0 |
| Void | 2 | 75 | 0 |
4. Verification of central lab technical failure rates in process validation studies
4.1 In process validation studies, the re-testing and total technical failure rates were assessed under business-as-usual operational trials at the newly established Milton Keynes EPCR test lab unit.
4.2 For 7,068 samples tested over 2 processing days, 619 samples (8.76%) either required a repeat-test assay test run (by EPCR or real-time PCR, in order), or yielded an inconclusive outcome where repeated swab testing was indicated. See table 7.
4.3 Following assay re-testing, 60 of 7,068 samples yield an inconclusive outcome, yielding a total technical failure rate at our combined EPCR and real-time PCR test facility of 0.86% (see table 6).
Table 6: EPCR re-test rate during process validation studies
| EPCR outcomes | Specimens | Percentages |
|---|---|---|
| Test outcomes available on first run | 6,449 | 91.24 |
| Retest outcome following first run | 619 | 8.76 |
| Void outcome on 1st EPCR run and no more rerun | 55 | 0.09 |
| 1st EPCR rerun | 372 | 5.76 |
| 1st qPCR rerun | 192 | 2.98 |
| Test outcomes available (not void) after re-testing runs | 7,008 | 99.14 |
| Total technical failure rate (after re-testing runs) | 60 | 0.86 |
| Total reactions | 7,068 | 100 |
Table 6 criteria for acceptance: re-test rate: no more than 10% re-test rate after first EPCR assay run. Total technical failure rate: less than 1.0%
5. Clinical reporting algorithm
5.1 While it delivers qualitative outcomes equivalent to Taqpath real-time PCR, EPCR employs a different clinical decision tree to evaluate process control and specimen target analyte PCR products (see figure 1 below).
- the EPCR process utilises a fluorescent dye (ROX) as a passive reference signal to control for proper reaction assay dispense
- a positive control assay amplifying any pan-species RNase P transcripts present in the specimen analyte is allocated to a second fluorescence channel (VIC)
- the SARS-CoV-2 target N gene amplicon is assayed using FAM fluorescent dye as a reporter
5.2 EPCR assay scoring, using either automated software assistance or manual inspection, delivers ‘positive’ infected status outcome determinations when reference dye and RNase P signals are adequate, and when a high N gene signal is observed. A ‘negative’ outcome is determined when low N gene fluorescence is observed along with suitable process control results.
5.3 EPCR delivers an outcome of positive at limit of detection (PLOD) and instruction to repeat swab sampling, when N gene signal is in an inconclusive range between clear positive or negative signal ranges.
5.4 A variety of scenarios will result in a ‘void’ outcome and instruction to repeat swab testing, whenever assay signal or process control results are not suitable to provide a conclusive outcome.
Figure 1: clinical reporting algorithm to arrive at positive, positive at limit of detection (PLOD), negative and void results
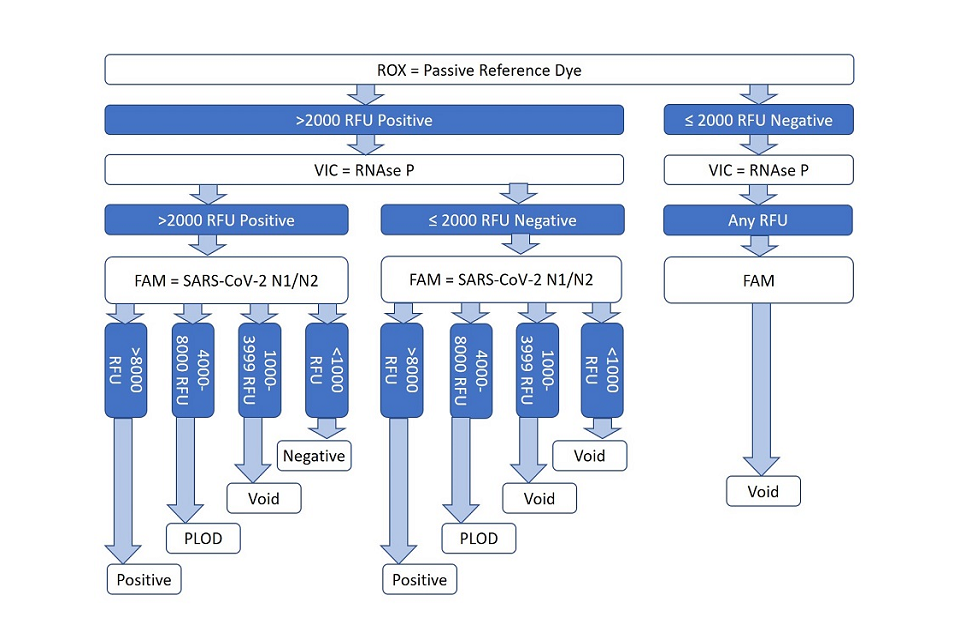
Description of figire 1, the clinical reporting algorithm:
-
a ‘positive’ infected status outcome is determined when reference dye and RNase P signals are adequate, and when a high N gene signal is observed
-
a ‘negative’ outcome is determined when low N gene fluorescence is observed along with suitable process control results
-
a ‘positive at limit of detection’ outcome is determined when the N gene signal is in an inconclusive range (4000 to 8000 RFU)
-
other scenarios result in a void outcome
6. Workforce requirement
6.1 Workforce calculations were made to process 225,000 samples per day based on staffing requirements using Taqpath real-time PCR and EPCR.
Table 7: workforce requirement to process 225,000 swabs per day using real-time PCR, EPCR and a hybrid of real-time PCR:EPCR workflows
| Work station | Real-time PCR: 75,000/day | EPCR: 150,000/day | Real-time PCR 750000/day, plus EPCR 150,000/day |
|---|---|---|---|
| Swab container reception | 16 | 24 | 40 |
| Sample inactivation and aliquoting | 12 | 20 | 32 |
| RNA extraction | 12 | 20 | 32 |
| PCR assay dispense | 20 | 12 | 32 |
| PCR thermocycling and detection | 12 | 0 | 12 |
| Assay analysis and QC | 6 | 4 | 10 |
7. Conclusions
7.1 In the setting of a centralised diagnostic testing lab, and across a variety samples from the Lighthouse laboratory service, EPCR demonstrated excellent test sensitivity and specificity. The technical performance of the UltraDx SARS-CoV-2 N1/N2/RP endpoint PCR (EPCR) assay demonstrated a sensitivity of 98.6% (CI 0.976 to 0.992) and specificity of 99.8% (CI 0.997 to 0.998) in comparison to current standard of care Taqpath real-time PCR testing after RNA extraction. Concordance testing showed near total concordance (Cohen's Kappa 0.94) with an existing Taqpath real-time PCR in our lab. Analytical sensitivity of EPCR is 50 digital copies / ml which is slightly better than standard of care Taqpath real-time PCR. These data support the potential application of this alternative PCR-based assay detection technology following viral RNA extraction.
7.2 Additionally, test batch-size and continuous manufacturing principles underlying the EPCR test process make this assay type uniquely suitable for use in ultra-high capacity service lines: the technology is projected to attain run capacity of greater than 150,000 test samples per day, per instrument line. Within the Milton Keynes Lighthouse lab facility, EPCR has been added as a supplement to ongoing the real-time PCR service line: with minimal facility or operational changes, introduction of the EPCR service line should raise total facility test capacity from 75,000 to approximately 225,000 test samples per day.
7.3 The high scalability and excellent performance of EPCR should enable use of the technology for daily, routine whole-population diagnostic pandemic monitoring, delivered by a limited number of centralised testing labs.
8. Additional data and references
8.1 Data tables are available on request from queries@ukbiocentre.com
8.2 Cohen's Kappa measure is summarised by Robert Kwiecien, Annette Kopp-Schneider, Maria Blettner, Concordance analysis, (Deutsches Ärzteblatt International. Dtsch Arztebl Int 2011; 108(30): 515 to 521).
9. Authors
Jeff Roix, Malur Sudhanva, Tony Cox, Jonathan Curry, Emma Millican, Derek Craston, Paul Mark Martin, Phil Eeles