Evaluation of Additional Work Coach Support: evaluation report
Published 25 June 2026

© Crown copyright 2026
This publication is licensed under the terms of the Open Government Licence v3.0 except where otherwise stated. To view this licence, visit nationalarchives.gov.uk/doc/open-government-licence/version/3 or write to the Information Policy Team, The National Archives, Kew, London TW9 4DU, or email: psi@nationalarchives.gov.uk.
Where we have identified any third party copyright information you will need to obtain permission from the copyright holders concerned.
This publication is available at https://www.gov.uk/government/publications/evaluation-of-additional-work-coach-support/evaluation-of-additional-work-coach-support-evaluation-report
DWP research report no. 1146
A report of research carried out by IFF Research on behalf of the Department for Work and Pensions.
Crown copyright 2026.
You may re-use this information (not including logos) free of charge in any format or medium, under the terms of the Open Government Licence. To view this licence, visit Open Government Licence for public sector information or write to the Information Policy Team, The National Archives, Kew, London TW9 4DU, or email psi@nationalarchives.gov.uk.
This document/publication is also available on our website at: Research at DWP
If you would like to know more about DWP research, email socialresearch@dwp.gov.uk
First published June 2026.
ISBN 978-1-80786-018-9
Views expressed in this report are not necessarily those of the Department for Work and Pensions or any other government department.
Voluntary statement of compliance with the Code of Practice for Statistics
The Code of Practice for Statistics (the Code) is built around 3 main concepts, or pillars, of trustworthiness, quality and value:
- trustworthiness – is about having confidence in the people and organisations that publish statistics
- quality – is about using data and methods that produce assured statistics
- value – is about publishing statistics that support society’s needs for information
The following explains how we have applied the pillars of the Code in a proportionate way.
Trustworthiness
This survey fieldwork and analysis was carried out by IFF Research, and advanced statistical analysis to estimate the impact of Additional Work Coach Support (AWCS) was carried out by Bryson Purdon Social Research. Fieldwork and analysis were carried out impartially and in compliance with the Market Research Society Code of Conduct and Government Social Research Code of Practice. This report was written by the research team at IFF Research and has been checked thoroughly by analysts and the Department for Work and Pensions to ensure it meets the highest standards of analysis and drafting.
Quality
The survey was carried out using established quantitative research methodology and statistical methods. Details of these methods are in Chapter 1. The research has been quality assured using IFF Research internal quality checking processes, which have been shared with the Department for Work and Pensions. All work conducted by Bryson Purdon Social Research was quality assured by IFF Research as lead contractors. The analysis of findings and report writing has been quality assured by analysts at the Department for Work and Pensions.
Value
This survey provides evidence of the impact of Additional Work Coach Support (AWCS) on those who are claiming the health element of Universal Credit (UC) and equivalent customers receiving Employment and Support Allowance (ESA). The findings of this research will support future policy development and help monitor progress against key DWP objectives.
Executive summary
This report outlines the findings from a mixed-method study evaluating Additional Work Coach Support (AWCS). The evaluation involved qualitative interviews with AWCS customers, and a quantitative longitudinal survey with AWCS customers and a matched comparison group of non-AWCS customers.
AWCS is a policy which gives Universal Credit (UC) health journey customers and Employment and Support Allowance (ESA) customers additional appointment time with a work coach. It gives work coaches more time to understand health related barriers to work, provide relevant signposting to address barriers, and ultimately move customers towards or into work. AWCS was first rolled out to a select number of Jobcentres from 2022, with full roll-out to Jobcentres across Great Britain completed in 2025.
The background and findings are summarised below:
Introduction (Chapter 1)
As part of the evaluation, 90 in-depth qualitative interviews were conducted with UC health journey and ESA customers in receipt of AWCS. The interviews explored customers’ experience of the additional time with a work coach, including the format and structure of appointments, as well as their relationship with their work coach and the type of support they had provided.
In addition, a longitudinal survey was conducted. This comprised 3,990 baseline surveys and 2,008 follow-up surveys with AWCS customers and 1,932 surveys with matched a comparison group who did not receive AWCS. The responses to these surveys were used to conduct an impact evaluation using a quasi-experimental design (QED). The outcomes of those receiving AWCS measured at the follow-up survey were compared with the outcomes of the matched comparison group who did not receive AWCS, to estimate the impact of the programme.
Profile of AWCS customers (Chapter 2)
The characteristics of AWCS customers at baseline were closely aligned with the circumstances that led them to being assigned in their group.
Pre‑work capability assessment (pre-WCA) customers were more likely to have been in work before starting AWCS (18% compared with 10% of limited capability for work (LCW)/work related activity group (WRAG) customers and 11% of limited capability for work related activity (LCWRA)/support group (SG) customers). Furthermore, pre-WCA customers not in employment before starting AWCS were more likely to have had recent work experience (23% were in work less than 6 months earlier, compared with 6% of LCW/WRAG customers and 11% of LCWRA/SG customers, and 25% were in work between 6 months and less than a year earlier, compared with 8% of LCW/WRAG customers and 12% of LCWRA/SG customers). Despite this, uncertainty about their health and WCA outcome was linked to lower confidence and readiness, indicating a need to focus first on identifying suitable work that could accommodate their health needs.
LCW/WRAG customers faced significant barriers to employment. While slightly more positive about work than pre‑WCA customers (19% reported they could return to work now if the right job or support was available, compared with 15% of pre-WCA customers not in work at baseline and disclosed a health condition), only a minority felt ready. Longer periods out of work, ongoing health management, and a higher likelihood of caring responsibilities, indicates a need for initial confidence‑building support before more focused job search.
Although LCWRA/SG customers are not required to undertake work‑related activity, those who voluntarily engaged with AWCS were relatively positive about work (26% reported they could return to work now if the right job or support was available, compared with 15% of pre-WCA customers and 19% of LCW/WRAG customers not in work at baseline and disclosed a health condition). However, their complex health conditions and distance from employment suggested there would be significant challenges to moving even these more positive customers into work.
Experiences of AWCS (Chapter 3)
Appointment frequency generally aligned with policy design for pre-WCA and LCWRA/SG customers. Policy design mandated that participating pre-WCA customers met with a work coach for around 30 minutes per fortnight, and around 7 in 10 (71%) reported receiving this amount of time or more at baseline. Furthermore, policy design generally offered LCWRA/SG customers 30 minutes per month, and around three quarters (76%) reported receiving the offered amount of time. However, LCW/WRAG customers were less likely to have reported receiving the expected level of contact with a work coach. Similar to pre-WCA customers, policy design mandated that this group met with a work coach for around 30 minutes per fortnight. Only three-fifths (59%) reported receiving this level of contact.
At the start of support, nearly three quarters (72%) of AWCS customers who recalled work coach support felt the frequency of appointments was ‘about right’. Satisfaction increased over time, rising to 78% of AWCS customers at follow-up. Qualitative interviews suggested satisfaction was often correlated with customers being closer to work, improved health needs, and expectations of progress. Furthermore, the majority (88%) of AWCS customers who recalled work coach support felt the length of appointments were ‘about right’.
In qualitative interviews, customers were most satisfied when appointments felt tailored and proportionate to their circumstances. For those closer to work, more proactive and work-focused engagement enhanced satisfaction. For those further away from work, satisfaction was higher when support was adapted to their health condition, including the offer of accessible appointment mode.
At the start of support, most AWCS customers (69%) who recalled work coach support reported they saw the same work coach every time they had an appointment with the Jobcentre. Though still in the majority, customers were less likely to report this at follow-up (64%).
Telephone appointments were the main appointment mode, with almost three quarters (74%) of AWCS customers who recalled work coach support reporting they met with their work coach over the phone. However, mode of appointment varied by health needs, claim length, and age.
Qualitative research highlighted that flexibility in delivery was valued, particularly by those with complex health needs or mobility barriers.
Impact of AWCS on employment outcomes and job search activity (Chapter 4)
Due to small number of LCWRA/SG customers enrolled in AWCS during the evaluation period, and corresponding low sample size in the longitudinal surveys, it was not possible to robustly estimate the impacts of AWCS on this health journey group. Statistical impact analysis therefore only related to customers in pre-WCA and LCW/WRAG health journey groups, as combined (referred to as “AWCS customers”) and separate groups.
Furthermore, the impact analysis was primarily concerned with the statistical differences between AWCS customers and the matched comparison group. Where the p-value is below 0.05, that indicates the differences between the groups are unlikely to be due to chance and AWCS has likely had an impact on that outcome.
Overall, there was no significant evidence, either overall or within particular customer subgroups, that AWCS had an impact on whether customers reporting being in paid work within the timeframe of the evaluation. Around a fifth (18%) of AWCS and non-AWCS customers were in paid work at the time of the follow-up survey (0 percentage points difference (pp diff), p-value 0.979). Furthermore, there was no significant evidence that AWCS had an impact on benefits claimed within the timeframe of the evaluation. Almost 4 in 10 (38%) AWCS customers reported claiming employment-related or means tested benefits at the time of the follow-up survey, compared with 39% of non-AWCS customers (-1pp diff, p-value 0.630).
Overall, there was some evidence that AWCS brought LCW/WRAG customers closer to the labour market. They were more likely to report being economically active than non-AWCS LCW/WRAG customers (36% compared with 29% of non-AWCS LCW/WRAG customers, 8pp diff, p-value 0.009).
There was also significant evidence among the LCW/WRAG group (and particular demographic subgroups) that AWCS increased customers’ job search activity. LCW/WRAG AWCS customers not working full-time (i.e., not more than 30 hours a week) scored significantly higher (1.38 out of 4) on the Finnish Institute of Occupational Health (FIOH) job search activity scale, compared with LCW/WRAG non-AWCS customers (1.31 out of 4) (0.08 mean difference (diff), p-value 0.016). In addition, LCW/WRAG job search activity as defined by the FIOH scale was influenced by length of time on benefits, age, and health needs.
Furthermore, there was significant evidence that AWCS was associated with more pre-WCA customers participating in training (22% compared with 18% pre-WCA non-AWCS customers, 4pp diff, p-value 0.046) and more LCW/WRAG customers participating in volunteering (14% compared with 9% LCW/WRAG non-AWCS customers, 5pp diff, p-value 0.021).
However, there was no evidence of AWCS having had an impact on customers’ levels of job search self-efficacy. AWCS customers scored similarly to non-AWCS customers (2.87 out of 5, compared with 2.82 out of 5 for non-AWCS customers) on the Job-Search Self-Efficacy (JSSE) scale (0.04 mean diff, p-value 0.387).
Impact of AWCS on perceived distance from work (Chapter 5)
Overall, there was some evidence that AWCS had a positive impact on customers’ perceptions of whether they could return to work with the right job or support. Around 1 in 7 (15%) of AWCS customers said they could return to work with the right job or support, compared with 13% of non-AWCS customers (2 percentage point difference (pp diff), p-value 0.032).
However, there was no significant evidence that AWCS had an impact on whether AWCS customers felt ‘ready for work’, as defined by either being in work or feeling like they could return to work now if the right job was available or if they had the right support. Around a third of AWCS customers (34%) were in work or felt they could return to work now if the right job was available or with the right support, compared with 31% of non-AWCS customers (2pp diff, p-value 0.168).
Similarly, there was no significant evidence that AWCS had an impact on customers’ perceptions of the benefits of working or how work could affect their health. AWCS had no impact on whether customers (compared with non-AWCS customers) felt like they are/would be happier and more fulfilled if working (54% compared with 51% of non-AWCS customers, 3pp diff, p-value 0.086); whether they felt their work can/could accommodate their needs (30% compared with 28% of non-AWCS customers, 1pp diff, p-value 0.513), whether they felt like having a job is/would be beneficial for their health (41% compared with 39% of non-AWCS customers, 2pp diff, p-value 0.273); or whether they felt like they know how to present themselves/their condition in CV/interviews (37% compared with 35% of non-AWCS customers, 2pp diff, p-value 0.284). These findings support evidence from the qualitative strand of research, which found that most customers did not feel meaningfully closer to work as health remained the overriding barrier.
There was some evidence that AWCS had a negative impact on customers’ perceptions about the impact of work on their condition. A higher proportion of those receiving AWCS were worried that their condition fluctuates too much to work (70% compared with 66% of non-AWCS customers, 4pp diff, p-value 0.036). This was mainly driven by pre-WCA customers.
However, there was no significant evidence that AWCS had an impact on customers’ perceptions of other ways in which work and health may interact, such as concerns about not getting employed because of their condition or work making their health condition worse (67% compared with 65% of non-AWCS customers, 2pp diff, p-value 0.338). Finally, there was no evidence that AWCS had an impact on customers’ confidence in looking for work in the future (57% of customers were very or fairly confident about looking for work in the future compared with 53% of non-AWCS customers, 4pp diff, p-value 0.223).
Impact of AWCS on work coach relationship and support received (Chapter 6)
Overall, there was strong evidence that AWCS had a positive impact on customers’ perceptions of their relationship with their work coach, particularly around having a good relationship with their work coach and work coach contact. Around 8 in 10 (82%) of AWCS customers agreed/strongly agreed they had a good relationship with their work coach, compared to three quarters (75%) of non-AWCS customers (7 percentage point difference (pp diff), p-value 0.001). In addition, perceptions of work coach relationship were influenced by length of claim, age, and health needs. Furthermore, around 8 in 10 (82%) AWCS customers felt their work coach was good at keeping in touch, compared with 76% of non-AWCS customers (5pp diff, p-value 0.007).
There was also strong evidence the AWCS had a positive impact on whether customers felt the support provided by their work coach was tailored to their needs and circumstances. Around 8 in 10 (80%) AWCS customers felt that they received tailored support from their work coach, compared with around 7 in 10 (72%) of non-AWCS customers (7pp diff, p-value 0.001).
AWCS was found to have a positive impact on satisfaction with the support received among pre-WCA customers who recalled work coach support. Nearly three-quarters (72%) of these customers were very or fairly satisfied with the support from their work coach, compared to two thirds of their non-AWCS counterparts (66%) (6pp diff, p-value 0.029).
AWCS was also found to have a positive impact on the support and advice provided to pre-WCA customers by work coaches. For instance, there was evidence that AWCS had a positive impact on whether work coaches referred pre-WCA customers to health and work support programmes, such as Restart (34% reported being referred to support programmes by their work coach compared with 25% of non-AWCS pre-WCA customers (9 pp diff, p-value 0.002). Furthermore, there was evidence that AWCS had a positive impact on whether pre-WCA customers took up those referrals (23% reported taking up programmes they had been referred to by their work coach compared with 18% of non-AWCS pre-WCA customers (5 pp diff, p-value 0.039).
There was no evidence AWCS had an impact on referrals to support programmes for LCW/WRAG customers (28% reported being referred to support programmes by their work coach compared with 23% of non-AWCS LCW/WRAG customers, 6pp diff, p-value 0.084). However, AWCS did have a positive impact on whether work coaches made recommendations to local support programmes for LCW/WRAG customers, such as mental health community groups, physical health support services, or housing support (65% reported their work coach recommended support from local organisations compared with 55% of non-AWCS LCW/WRAG customers, 10pp diff, p-value 0.006).
Impact of AWCS on wellbeing (Chapter 7)
Overall, there was very little significant evidence that AWCS had an impact on customers’ level of wellbeing.
There was no evidence that AWCS had a significant impact on AWCS customers’ wellbeing as defined by the ONS wellbeing measures. This includes their life satisfaction score (4.82 out of 10 compared with 4.66 for non-AWCS customers, 0.16 mean difference (diff), p-value 0.120); their life worthwhile score (5.06 out of 10 compared with 5.02 for non-AWCS customers, 0.04 mean diff, p-value 0.700); their happiness score (4.75 out of 10 compared with 4.72 for non-AWCS customers, 0.03 mean diff, p-value 0.757); or their anxiety score (5.24 out of 10 compared to 5.14 for non-AWCS customers, 0.10 mean diff, p-value 0.409).
However, there was some evidence that AWCS had a positive impact on customers’ wellbeing as defined by the Short Warwick Edinburgh Mental Wellbeing Scale (SWEMWBS). They scored 19.17 out of 35 compared to 18.84 for non-AWCS customers (0.33 mean diff, p-value 0.044). However, there were no significant differences when looking separately at pre-WCA and LCW/WRAG customers. Customers’ SWEMWBS scores were also influenced by length of time on benefits and health needs.
Despite these mixed findings, many customers in the qualitative research reported improvements to their mental health and wellbeing because of the consistent, empathetic support they received from their work coach.
Conclusions (Chapter 8)
AWCS was generally delivered as intended, with AWCS customers being broadly satisfied with that delivery. Customers particularly valued the ways in which AWCS was flexible and able to be personalised to them.
However, there was little evidence to suggest that AWCS had an impact on customers’ employment outcomes, benefits claimed, or improvements to overall wellbeing, although there were some indications that LCW/WRAG customers had moved closer to work, for example, through increased job search activity and participation in volunteering.
Impacts being only modest may be underpinned by AWCS customers continuing to perceive their health to be a barrier to work, or at least that they would be unlikely to find work where their health would not be a barrier.
However, there was evidence that AWCS had a positive impact on how customers perceived their relationship and contact with their work coach, which may be what customers need at this stage in their journey.
Glossary of terms
| Key term | Explanation |
|---|---|
| Additional Work Coach Support (AWCS) | Additional appointment time offered to Universal Credit health journey customers and Employment and Support Allowance customers. |
| Customer | This report refers to customers receiving Universal Credit or Employment and Support Allowance. |
| Employment Support Allowance (ESA) | ESA is a social security benefit for individuals unable to work due to a health condition or disability. It is based on National Insurance contributions and provides financial assistance and additional support to help individuals meet their basic needs and access necessary services while they are unable to work. |
| Full-time | In this evaluation, customers were considered to be working full-time if they were in paid work or self-employment, on average, more than 30 hours a week. |
| Health journey customer group | Additional Work Coach Support is for three health journey customer groups: Pre-work capability assessment (pre-WCA) – Universal Credit or Employment and Support Allowance customers. Limited capability for work (LCW) and work-related activity group (WRAG) – Universal Credit and Employment and Support Allowance customers, respectively. Limited capability for work and work-related activity (LCWRA) and support group (SG) – Universal Credit and Employment and Support Allowance customers, respectively. |
| Jobcentre Plus (JCP) | JCP aims to help people of working age in Great Britain, who are in receipt of benefits, find employment. |
| Limited capability for work (LCW) | LCW is a term applied to Universal Credit customers. This is a group of customers who are limited by their physical or mental health condition and need to prepare for work in the future by taking part in work-related activities. However, they are not required to be available for or to start work as a condition of their benefit. |
| Limited capability for work and work-related activity (LCWRA) | LCWRA is a term applied to Universal Credit customers. This is a group of customers who are limited by their physical or mental health condition and it is not reasonable to require them to undertake work-related activity. This group have no work-related requirements in relation to their benefit claim. Customers in this group are entitled to a higher rate of benefit. |
| Mandatory participation | The health journey customer groups that are expected to undertake work related activity and for whom attendance at Jobcentre appointments, including Additional Work Coach Support (AWCS), is mandatory. They are the pre-work capability assessment (pre-WCA), limited capability for work (LCW) and work-related activity group (WRAG) customer groups. |
| Personal Independence Payment (PIP) | PIP is a social security benefit that provides a financial contribution to help individuals with long-term disabilities and/or health conditions to meet the additional costs related to their condition. PIP is based on the needs arising from a long-term health condition or disability rather than the condition or disability itself. PIP is not means-tested, is tax free and can be paid in addition to most other benefits received. Assessments for PIP involve a thorough evaluation of the individual’s ability to perform various tasks and activities. |
| Propensity score matching (PSM) | PSM is a statistical technique used to estimate the effect of an intervention (such as AWCS). It does this by matching those in receipt of an intervention to those not in receipt of an intervention that have similar probabilities (propensity scores) of receiving the intervention, based on specific characteristics. If a good match is achieved between groups, it increases confidence that any changes observed is due to the intervention, rather than individual characteristics. |
| Quasi-experimental design | A research approach used to estimate the impact of a policy or intervention without randomly assigning individuals to groups, for example, due to ethical or practical constraints. In the case of AWCS, a randomised approach was not possible as customers had already been allocated to the intervention by work coaches. |
| Support group (SG) | SG is a group of Employment and Support Allowance customers who are limited by their physical or mental health condition and so it is not reasonable to require them to undertake work-related activity. This group have no work-related requirements in relation to their benefit claim. Customers in this group are entitled to a higher rate of benefit. |
| Universal Credit (UC) | UC is a welfare benefit that supports individuals and families with their living costs, including those who have health conditions or disabilities. It is designed to replace several existing benefits, making the application and payment process more streamlined. For individuals with health conditions, UC considers their specific needs, and they may receive additional support or allowances based on their circumstances. |
| Voluntary participation | Customers in the UC limited capability for work and work-related activity (LCWRA) and Employment Support Allowance (ESA) support group (SG) who are not expected to undertake work-related activity as a condition of their benefit. For customers in these groups, attendance at appointments and participation in Additional Work Coach Support (AWCS) is voluntary. |
| Work Capability Assessment (WCA) | WCA is an assessment to find out how much a person’s health condition or disability affects their ability to work, which determines the amount of Universal Credit or Employment and Support Allowance they receive. It assesses what a person can do, as well as what they cannot do. Once an individual receives a WCA decision they are moved into the appropriate customer group. |
| Work coach | A work coach is a DWP professional who supports individuals in their employment journey. They provide guidance, assistance, and personalised advice to jobseekers, helping them develop job search skills, explore opportunities, and create tailored action plans for finding suitable employment. Work coaches may also facilitate access to training, education, and support programmes to enhance employability. |
| Work related activity group (WRAG) | WRAG is a group of Employment and Support Allowance customers who have limits on things they can do, including working, because of their illness, health condition or disability. Customers in this group are required to attend regular appointments with their work coach and undertake work-related activities to prepare for work in the future. |
Abbreviations
| Key term | Explanation |
|---|---|
| AWCS | Additional Work Coach Support |
| CA | Carer’s Allowance |
| CV | Curriculum Vitae |
| DLA | Disability Living Allowance |
| DWP | Department for Work and Pensions |
| ESA | Employment and Support Allowance |
| FIOH | Finnish Institute of Occupational Health |
| GP | General Practitioner |
| HB | Housing Benefit |
| IS | Income Support |
| JCP | Jobcentre Plus |
| JSA | Jobseeker’s Allowance |
| JSSE | Job-search self-efficacy scale |
| LCW | Limited capability for work |
| LCWRA | Limited capability for work and work-related activity |
| NHS | National Health Service |
| ONS | Office for National Statistics |
| PIP | Personal Independence Payment |
| PP | Percentage Point |
| PSM | Propensity score matching |
| QED | Quasi-Experimental Design |
| SG | Support group |
| SWEMWBS | Short Warwick-Edinburgh Mental Wellbeing Scale |
| UC | Universal Credit |
| WCA | Work Capability Assessment |
| WTC | Working Tax Credits |
| WRAG | Work-related activity group |
1. Introduction
This report outlines the findings from a mixed-method study evaluating Additional Work Coach Support (AWCS). The evaluation involved a longitudinal quantitative survey and qualitative interviews with customers.
The findings explore the experiences of those in receipt of AWCS and the outcomes they have achieved. This chapter covers the background of the project, evaluation objectives, research questions, and methodology.
Project background and context
As stated in the Get Britain Working White Paper[footnote 1], reversing the increase in economic inactivity caused by ill health is a national priority. The government aims to do this in part by reforming the system of health and disability benefits to promote and enable employment.
There are over 3 million people who are claiming the health element of Universal Credit (UC), or Employment and Support Allowance (ESA), due to a health condition or disability which limits their ability to work. They are called ‘health journey customers’.
Evidence shows that with regular support, health journey customers can move towards and into work.[footnote 2] AWCS aims to increase this support through providing health journey customers with additional appointment time with a work coach. This additional support aims to give work coaches more time to understand customers’ barriers to work and provide or signpost to appropriate support, to ultimately move customers towards work. AWCS was first rolled out to a select number of Jobcentres from 2022, with full roll-out to Jobcentres across Great Britain completed in 2025. This evaluation took place during the phase of rolling out AWCS nationally.
There are three health journey customer (‘conditionality’) groups:
- pre-work capability assessment (pre-WCA): Universal Credit (UC) or Employment and Support Allowance (ESA) customers who are either waiting to have a work capability assessment, or waiting for the outcome of their assessment
- UC limited capability for work (LCW) and ESA work-related activity group (WRAG): customers who are limited by their physical or mental health condition and are required to undertake work-related activities to prepare for work in the future
- UC limited capability for work and work-related activity (LCWRA) and ESA support group (SG): customers who are limited by their physical or mental health condition and are not required to undertake work-related activities to prepare for work in the future
Attending AWCS appointments is normally mandatory for customers identified as eligible and suitable for the support in the pre-WCA and LCW/WRAG health journey customer groups.
Work coaches assess eligibility and suitability as part of conversations with customers about their current health and wider circumstances during existing, regular (normally every three months) appointments with customers in these groups. AWCS policy states that suitable customers in these groups should receive 30 minutes of support per fortnight from their work coach, compared with 22 minutes every three months prior to the roll out of AWCS, with attendance at these appointments typically being mandatory (in line with normal conditionality for their customer group). This frequency is reviewed for pre-WCA customers when a decision is made and they move into another customer group.
For customers in the LCWRA and SG health journey customer groups, AWCS appointments are offered on a voluntary basis. This group had been assessed as having health conditions that limit their ability to work and prepare for work. AWCS policy states that customers that take up AWCS in these groups could receive 30 minutes of support from their work coach per month, compared with before AWCS where they did not widely have access to regular support.
Through additional support from a work coach, AWCS aims to help more health journey customers move towards and into paid work by helping individuals to develop work search skills and improve their confidence, motivation and attitudes towards work.
Evaluation objectives
The phased rollout of AWCS across Great Britain created an opportunity to evaluate the policy to help identify ‘what works’ for supporting disabled adults and those with long-term health conditions towards employment. This evaluation aimed to:
- understand the implementation and delivery of AWCS
- explore the employment barriers faced by each health journey group, and the extent to which AWCS helped them overcome these barriers
- measure the impact and outcomes of AWCS on customers’ wellbeing, progress towards employment, and work preparation behaviours
Research questions
This evaluation aimed to answer the following questions:
- How was AWCS communicated to customers, and what were their expectations or goals for the support?
- What were customers’ experiences of receiving AWCS in practice? Particularly in terms of frequency, length and mode of appointments.
- To what extent did customers feel comfortable discussing their health condition, and other barriers to work, with their work coach?
- What types of support were offered by work coaches under AWCS, and how was this viewed by customers? In particular, whether this was appropriately personalised to customers support needs.
- To what extent did AWCS have a positive impact on customers’ wellbeing, progress towards work, and work preparation behaviours?
- To what extent did the impact of AWCS differ between health journey customers?
Evaluation design
This evaluation involved in-depth qualitative interviews with health journey customers receiving AWCS, to understand their experience of the policy. The impact of the policy was measured using a quasi-experimental evaluation design, with data collected via longitudinal surveys with AWCS customers and a matched comparison group of non-AWCS customers.
Qualitative methodology
As part of the evaluation, 90 in-depth qualitative interviews were conducted with UC health journey and ESA customers in receipt of AWCS.
The qualitative report can be accessed online[footnote 3].
Sampling
The Department for Work and Pensions (DWP) drew the qualitative sample from internal records of AWCS customers.
The sample originally contained a mix of customers in the early (fewer than five appointments) and late (five or more appointments) stages of support to understand how, if at all, duration of work coach support influenced customer outcomes. However, fieldwork was paused during the 2024 election period, so most respondents were interviewed during later stages of support. This also meant that some respondents had moved customer group between the sample being drawn and their interview.
The duration of claim varied between respondents, though the majority had claimed for at least 100 days (around 3 months). Of the 90 respondents interviewed, 57 had a claim length between 100 days and three years, 27 had a claim length over three years, and six had a claim length fewer than 100 days.
Most respondents reported having more than one health condition. Of the 90 respondents, the most commonly reported health conditions were those linked to social, emotional, or mental health issues (63 respondents), followed by physical health conditions or disabilities (59 respondents) and learning difficulties or autism (18 respondents). Many respondents reported mental health issues resulting from their physical conditions.
Feelings about work prior to AWCS also varied between respondents. The majority of respondents felt they were unable to work now (68 out of 90). However, 36 of the 90 respondents thought they might be able to work in the future if their health condition or disability improved. A further 17 respondents felt they could return to work now if the right job was available or they had the right support. A small minority of respondents (5 out of 90) were working prior to AWCS.
Interview design
The interviews adopted a semi-structured approach guided by a topic guide. The topic guide explored AWCS customers’ experience of the additional time with a work coach, including the format and structure of appointments, as well as their relationship with their work coach and the type of support they had provided.
Though the primary purpose of the qualitative interviews was to understand policy delivery, they also explored early outcomes achieved following support.
Fieldwork
The first phase of interviews took place in May 2024 (32 before the election pause) and continued in August/September 2024 (58 following the election pause). Customers were invited to take part via letter or email, depending on the type of contact details available. Interviews were conducted through a mix of telephone and online video calls, to suit individual preferences.
Table 1.1 shows the number of interviews completed by conditionality group.
Table 1.1: Completed interviews, by conditionality group
| Customer group | Number of completed interviews |
|---|---|
| Pre-WCA | 20 |
| LCW and WRAG | 30 |
| LCWRA and SG | 40 |
| Total: | 90 |
Quantitative methodology
Impact evaluation design aims to measure the impact of a policy or intervention (in this case, AWCS). A quasi-experimental design (QED) was used to measure the impact of AWCS, where the outcomes of those receiving AWCS (AWCS customers) measured at the follow-up survey were compared with the outcomes of a matched comparison group who did not receive AWCS (non-AWCS customers).
To robustly measure outcomes for customers, the evaluation used longitudinal quantitative surveys with UC health journey and ESA customers in receipt of AWCS. A comparison group of similar UC/ESA customers not in receipt of AWCS also completed the surveys to enable impact analysis.
The baseline survey was launched in November 2024. The follow-up survey was launched 6 months later (in May 2025) with customers who had taken part in the baseline survey and had agreed to be recontacted. Customers were initially sampled for the evaluation 4-6 weeks after starting AWCS. Because of this, and the time taken to process the sample, the follow-up survey was conducted with customers around 7 to 9 months after they had started receiving support.
Propensity score matching (PSM) was applied during the sampling stage to ensure non-AWCS customers matched AWCS customers closely (see Appendix C for further information). The match between AWCS customers and non-AWCS customers was further strengthened at the analysis stage by matching the two groups, again using PSM.
This phase of PSM used variables collected as part of the baseline survey, as well as the DWP PSM variables (as described in Appendix C). This included:
- employment status at baseline
- employment history
- recent job search history
- health status
- attitudes and barriers to work
- qualifications level
- a range of demographic variables including ethnic group and marital status
Separate PSM weights were produced for pre-WCA and LCW/WRAG customers to ensure AWCS and non-AWCS customers within each health journey group were a close match.
Sampling
The Department for Work and Pensions (DWP) drew the quantitative sample from internal records of AWCS customers and a comparison group of similar customers not in receipt of AWCS.
Customers in the comparison group were selected using PSM, so that they would be sufficiently similar to the sample of AWCS customers on a range of characteristics in the DWP database (see Appendix C for further information).
Table 1.2 shows the starting sample of AWCS customers by conditionality group.
Table 1.2: Starting sample of AWCS customers, by conditionality group
| Customer group | Starting sample |
|---|---|
| Pre-WCA | 11,292 |
| LCW and WRAG | 5,915 |
| LCWRA and SG | 662 |
| Total: | 17,869 |
Questionnaire design
The baseline survey collected information on customers’ starting point across various measures, including:
- receipt of benefits
- health and wellbeing
- employment history and current employment status
- feelings about work
- feelings about the support they had received from their work coach
It was not possible to conduct the baseline survey prior to customers starting AWCS. As such, some questions were asked retrospectively to accurately measure customers’ starting point. The time frame in the question was linked to the month in which AWCS customers started receiving the support, with a pseudo start date for non-AWCS customers
The baseline survey was cognitively tested with 17 AWCS customers between 9 and 25 May 2024. Minor amends to the survey were made following testing.
Furthermore, the baseline survey was piloted between 17 and 24 September 2024. This included 32 interviews (30 Computer Assisted Telephone Interviewing (CATI) surveys; 2 online surveys) with AWCS customers. Pilot responses were not included in the final dataset due to post-pilot survey amends.
The follow-up survey measured customers’ progress over time across similar measures. It also included additional standardised health and employment measures that could not be asked at baseline due to the retrospective nature of the survey. They replaced some health and employment measures asked at the baseline survey, such as healthcare usage.
The follow-up survey was piloted between 19 and 24 March 2025. This included 25 Computer Assisted Telephone Interviewing (CATI) with AWCS customers. Pilot responses were included in the final dataset as minimal changes were made to the survey following testing.
Fieldwork
Mainstage fieldwork for the baseline survey was carried out between 7 November 2024 and 1 March 2025. Overall, 3,990 interviews were completed with AWCS customers (3,964 Computer Assisted Telephone Interviewing (CATI) surveys; 26 online surveys).
Mainstage fieldwork for the follow-up survey was carried out between 19 March and 16 September 2025. Overall, 2,008 interviews were completed with AWCS customers (2,005 CATI surveys; 3 online surveys).
Table 1.3 shows the number of baseline and follow-up surveys completed by AWCS customers, by conditionality group.
Table 1.3: Number of surveys completed by AWCS customers and non-AWCS customers (post-matching), by conditionality group
| Customer group | AWCS customers : Baseline survey | AWCS customers : Follow-up survey | Non-AWCS customers: Follow-up survey |
|---|---|---|---|
| Pre-WCA | 2,481 | 1,231 | 1,205 |
| LCW and WRAG | 1,350 | 692 | 727 |
| LCWRA and SG | 159 | 85 | N/A |
| Total: | 3,990 | 2,008 | 1,932 |
Weighting
The baseline AWCS customer data were weighted to the population profile of AWCS customers before exclusions were made during sampling, to ensure findings were representative of the AWCS population. Data were weighted by the following characteristics:
- benefit (UC or ESA)
- conditionality group (Pre-WCA; LCW/WRAG; or LCWRA/SG)
- age group (16-25; 26-35; 36-45; 46-55; 56-65; 66+)
- gender (male or female)
- claim length (0-3 months; 3-6 months; 6-12 months; 13-24 months; 25-36 months; more than 3 years)
Follow-up AWCS customer data were weighted to the profile of AWCS customers who completed a baseline survey, to account for non-response bias. Once non-response bias was accounted for, the follow-up data were then weighted to the population profile of AWCS customers before exclusions were made during sampling. Both phases weighted to the same characteristics listed above.
At baseline and follow-up, no weighting was applied to the data of non-AWCS customers. This is because non-AWCS customers were matched to AWCS customers using Propensity score matching after data was weighted.
Statistical impact analysis
Chapters 4 to 7 report the impacts of Additional Work Coach Support (AWCS) 7 to 9 months after customers started receiving the support. The impact analysis on outcomes is accompanied by descriptive analysis of customers’ broader experiences where relevant.
The primary analysis measured impacts on a range of outcomes for all AWCS customers, while the sub-group analysis measured impacts on selected outcomes for specific types of AWCS customers. Sub-group analysis was limited to a smaller number of outcomes to keep findings clear and interpretable.
The impacts were measured by comparing the outcomes of customers in receipt of AWCS (AWCS customers) to those of a matched comparison group of customers who did not receive AWCS (non-AWCS customers). The process of creating a matched comparison group is described in further detail in Appendix C.
While the original intention was to report the impacts of AWCS on all customers, a combination of small sample sizes and markedly different baseline profiles made it infeasible to achieve a sufficiently robust matched comparison group for LCWRA/SG customers. This is further discussed below. As such, the analysis in chapters 4 to 7 reports the impact of AWCS on pre-WCA and LCW/WRAG groups only, as combined (referred to as “AWCS customers”) and separate groups.
Impact on AWCS customers
The primary impact analysis measured the impact of AWCS, including on employment, work coach relationships and support, and wellbeing. Specifically:
- employment and job search outcomes (Chapter 4)
- perceived distance from work (Chapter 5)
- Work Coach relationship and the support received (Chapter 6)
- wellbeing (Chapter 7)
More information about these measures can be found at the beginning of chapters 4 to 7, and in Appendix A.
AWCS was not designed to provide intensive work and/or health support to customers. Furthermore, the evaluation took place during the phase of rolling out AWCS nationally and measured outcomes roughly 7 to 9 months after customers started receiving support, and so may not capture longer term impacts of the policy. Impact findings should be read with this context in mind.
While the original intention was to include impact estimates for the LCWRA/SG group, it proved infeasible to create a robust matched comparison group for this conditionality group. This means they are excluded from the overall impact estimates.
There were two main reasons for this. Firstly, very small follow-up survey sample sizes (85 AWCS customers and 80 non-AWCS customers) meant that, typically, impact estimates would have needed around 15 percentage point difference to reach significance. This made it unlikely that any impacts would have been found to be significant and the estimates would have had very wide confidence intervals.
Secondly, because those who received AWCS among the LCWRA/SG group had self-selected to do so (due to the voluntary nature of support for this group), the pre-AWCS profile of LCWRA/SG AWCS customers and their non-AWCS customer peers was very different. For example, 13% (non-response weighted) of AWCS LCWRA/SG customers said that they had ruled out work now and in the future, compared with 45% of their non-AWCS customer peers.
The small sample sizes combined with the size of the differences between the pre-AWCS profile of AWCS customers and non-AWCS customers meant that it was not feasible to obtain a good match between the two LCWRA/SG groups.
Impact on specific AWCS customers
Sub-group analysis was conducted to understand whether AWCS had a positive impact on specific types of AWCS customers. Specifically:
- length of time out of work at baseline
- length of time on benefits at baseline
- proximity to work at baseline
- age at baseline
- type of health condition at baseline
- number of health conditions at baseline
The full breakdown of sub-group characteristics can be found in Appendix A.
The sub-group impact analysis focussed on five key outcomes. Specifically:
- whether or not a customer was in paid work at follow up (Chapter 4)
- their level of job search activity, as measured by the Finnish Institute of Occupational Health (FIOH) scale (Chapter 4)
- whether or not they were in paid work or ready for work with the right support (Chapter 5)
- whether or not they had a good relationship with their work coach (Chapter 6)
- their level of wellbeing, as measured by the Short Warwick-Edinburgh Mental Wellbeing Scale (SWEMWBS) (Chapter 7)
For each of the demographic subgroups, separate PSM was undertaken where the sample size permits, to ensure that each set of subgroups had a good match between AWCS customers and non-AWCS customers where feasible. Impact estimates were produced for the five key outcomes, using two tests to look for evidence of differential impacts between subgroups (see Appendix C for further information).
The subgroup tables in Appendix B show the analysis of AWCS impact on particular groups, with commentary on the findings provided within each of chapters 4 to 7. The subgroup analysis was run for pre-WCA and LCW/WRAG customers, as combined and separate groups, following the approach in the main analysis. As a result, the sample sizes for some subgroups are modest, and this should be taken into account when interpreting the results. Some of the estimates of impact for sub-groups, especially those with fairly small sample sizes, were inevitably harder to interpret.
The tables in Appendix B follow the same format as those in the main body of the report, within each subgroup presenting the results for each follow-up outcome for those receiving AWCS support and those in the matched comparison group of non-AWCS customers. The subgroup tables include an additional column to the far right of each table (italicised and in green), showing the p-value for the interaction term (that is, the test of whether the impacts differ between the sub-groups) described in Test 2.
Impact analysis considerations
There were two main challenges in the AWCS impact evaluation:
- AWCS customers were expected to be different in their pre-AWCS profile to non-AWCS customers. This is because work coaches had an element of choice in which customers to refer to the intervention.
- The baseline survey collected some information retrospectively. This may have affected respondent recall.
These factors may have influenced the similarity of the AWCS customer and non-AWCS customer groups, which a QED design relies on.
Steps were taken at the design stage to mitigate these challenges, including the collection of data linked to outcomes or information about how work coaches make decisions around whether to refer a customer to AWCS. These steps increased confidence that the group of non-AWCS customers were a good match for AWCS customers. More information about the considerations for impact analysis can be found in Appendix C.
About this report
The findings in this report are based on qualitative and quantitative research.
Qualitative research aims to explore people’s experiences in depth and to understand how and why issues occur and does not seek to be statistically representative. The quantitative research aims to measure the impact of AWCS on customers in the pre-WCA and LCW/WRAG health journey groups.
Structure of the report
The report followed the structure outlines below:
- Chapter 2: Profile of Additional Work Coach Support (AWCS) customers. This chapter explains the baseline characteristics of AWCS customers by conditionality group (pre-WCA, LCW/WRAG, LCWRA/SG), including their health and employment status.
- Chapter 3: Experiences of AWCS. This chapter describes AWCS customers’ perceived experience of work coach support, including the consistency of work coach support and the frequency and length of their appointments. It compares changes between baseline and follow-up, where relevant.
- Chapter 4: Impact of AWCS on employment outcomes and job search activity. This chapter covers the extent to which AWCS had a positive impact on outcomes including employment status, number of hours worked, benefit receipt, job search and volunteering or training.
- Chapter 5: Impact of AWCS on perceived distance from work. This chapter covers the extent to which AWCS had a positive impact on how customers felt about work in general, and how they felt about managing their health at work.
- Chapter 6: Impact of AWCS on work coach relationship and support received. This chapter covers the extent to which AWCS had a positive impact on how customers felt about their relationship with their work coach.
- Chapter 7: Impact of AWCS on wellbeing. This chapter covers the extent to which AWCS had a positive impact on customers’ wellbeing.
- Chapter 8: Conclusions. This chapter synthesises the findings and assesses whether AWCS was delivered as intended.
2. Profile of AWCS customers
This chapter outlines the characteristics of AWCS customers at baseline by conditionality group, illustrating the different starting points for each of the conditionality groups and providing context for interpreting the impact findings that follow. While some customers across all conditionality groups expressed a desire to work, health limitations, confidence issues, and lack of suitable roles available strongly shaped engagement with the labour market and perceived feasibility of employment.
Summary of customer profiles
The characteristics of AWCS customers at baseline were closely aligned to the circumstances that led them to being assigned in their group:
- Although pre-WCA customers were more likely than other conditionality groups to have been in work before starting AWCS, or to have been in work more recently if not in employment prior to AWCS, uncertainty about their health and WCA outcome was linked to lower confidence and readiness, indicating a need to focus first on identifying suitable work that could accommodate their health needs.
- LCW/WRAG customers faced significant barriers to employment and, while slightly more positive about work than pre-WCA customers, only a minority felt ready. Longer periods out of work, ongoing health management, and a higher likelihood of caring responsibilities indicated a need for initial confidence building support before more focused job search.
- Although LCWRA/SG customers are not required to undertake work related activity, those who voluntarily engaged with AWCS were relatively positive about work. However, their complex health conditions and distance from employment suggested there would be significant challenges to moving even these more positive customers into work.
The key characteristics of each conditionality group are summarised in Image 2.1. This chapter reports figures where the baseline proportions for each conditionality group differ significantly from the other conditionality groups.
Image 2.1: Profile of AWCS customers
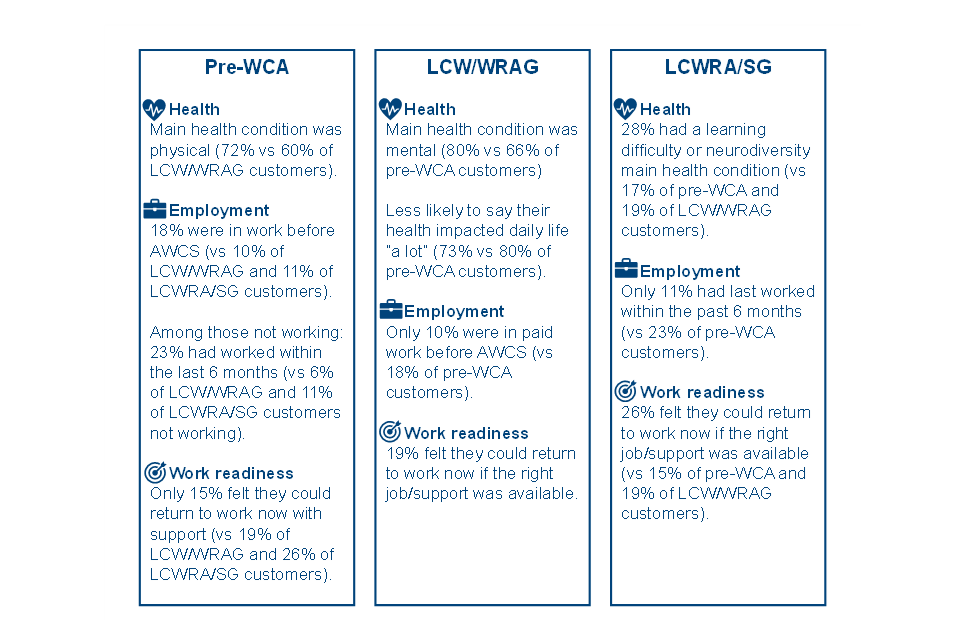
Image 2.1: Profile of AWCS customers: accessible version
Pre-WCA
Health:
- main health condition was physical (72% vs 60% of LCW/WRAG customers)
Employment:
- 18% were in work before AWCS (vs 10% of LCW/WRAG and 11% of LCWRA/SG customers)
- among those not working: 23% had worked within the last 6 months (vs 6% of LCW/WRAG and 11% of LCWRA/SG customers not working)
Work readiness:
- only 15% felt they could return to work now with support (vs 19% of LCW/WRAG and 26% of LCWRA/SG customers)
LCW/WRAG
Health:
- main health condition was mental (80% vs 66% of pre-WCA customers)
- less likely to say their health impacted daily life “a lot” (73% vs 80% of pre-WCA customers)
Employment:
- only 10% were in paid work before AWCS (vs 18% of pre-WCA customers)
Work readiness:
- 19% felt they could return to work now if the right job/support was available
LCWRA/SG
Health:
- 28% had a learning difficulty or neurodiversity main health condition (vs 17% of pre-WCA and 19% of LCW/WRAG customers)
Employment:
- only 11% had last worked within the past 6 months (vs 23% of pre-WCA customers)
Work readiness:
- 26% felt they could return to work now if the right job/support was available (vs 15% of pre-WCA and 19% of LCW/WRAG customers)
Profile of pre-WCA customers
Health
Pre‑WCA customers were more likely than LCW/WRAG customers to report physical health conditions as their main health condition (72% compared with 60%) and less likely to report mental health conditions as their main health condition (66% compared with 80% of LCW/WRAG customers).
In the qualitative research, many pre‑WCA customers reported either new or recently deteriorated conditions, or long‑term conditions that had worsened, indicating that they were typically early in their health journey at the point of engaging with AWCS, as may be expected given they were awaiting their assessment outcome.
Employment situation
Pre‑WCA customers were more likely to have been in work at the time of starting AWCS compared with the other conditionality groups (18% compared with 10% of LCW/WRAG customers and 11% of LCWRA/SG customers). Pre-WCA customers not in employment prior to AWCS and who had ever worked were significantly more likely to have been in work less than 6 months earlier than the other conditionality groups (23% compared with 6% of LCW/WRAG customers and 11% of LCWRA/SG customers), and between 6 months and less than a year (25% compared with 8% of LCW/WRAG customers and 12% of LCWRA/SG customers).
Findings from the qualitative research supported this pattern with many pre‑WCA customers reporting working within the last 2 years. These customers often mentioned leaving work because of recent deterioration in health or the onset of a new condition, though some customers also left work for non‑health reasons such as redundancy, the end of a contract, or the emergence of caring responsibilities. Overall, their employment circumstances were often new and still evolving, and many were recently adjusting to the implications of their health for work and daily life. This is consistent with their stage in the health journey as a transitional group awaiting assessment.
Feelings about work
As with other conditionality groups, the majority of pre-WCA customers (87%) saw their health issues as the main barrier to employment. Many of those participating in the qualitative research reported that they did not yet feel ready to return to work, particularly while managing a new condition or additional pressures such as caring responsibilities. For some, confidence in work had been affected by recent job loss and health changes, even among those who expressed a strong desire to work.
I can’t promise that I will be reliable enough to turn up to work on any given day or any given shift, because I might just wake up in the morning and not want to get out of bed. It’s one of those mental conditions that I know I’ve got it, and I can talk about it but I can’t really control when it happens and when it doesn’t happen.
(Pre-WCA customer)
Some customers also believed they would need to retrain, particularly to access home‑based or less physically demanding roles, but identified low or outdated digital and IT skills as a barrier.
A lack of awareness of suitable job options was a common barrier to employment for this conditionality group, especially roles that could accommodate their health needs.
I do need extra breaks and I do need to manage my time in my own way, and some jobs don’t really manage that well.
(Pre-WCA customer)
Pre-WCA customers that were not in employment at baseline and disclosed a health condition were less likely to feel they could return to work at that time if the right job was available or if they had the right support (15% compared with 19% of LCW/WRAG customers and 26% of LCWRA/SG customers). During qualitative interviews, while many pre-WCA customers expressed wanting to return to work in the future, some preferred to delay work‑focused activity until after their Work Capability Assessment decision, due to concerns that talking about or preparing for work before their assessment could potentially affect their benefit outcome. A minority felt ready to return immediately if appropriate and health‑accommodating roles were available, though concerns remained about the availability of suitable opportunities.
Implications for AWCS
Pre-WCA customers may appear closer to employment on paper given the recency of their work experience or given they had been out of work for a shorter period of time. However, the combined uncertainty of their health and outcome of their WCA were likely linked to their lower confidence and readiness for work. As such, it would be likely that support for this group would need to first focus on identifying suitable work that could accommodate work conditions before moving onto focused job search.
Profile of LCW/WRAG customers
Health
LCW/WRAG customers were more likely to report mental health conditions as their main health condition compared with pre-WCA customers (80% compared with 66% respectively), although they were less likely to say that their health conditions, illnesses or disabilities reduced their ability to carry out day-to-day activities “a lot” (73% compared with 80% of pre-WCA customers with a health condition). This aligns with there being higher expectations of this conditionality group’s capabilities to find and maintain employment.
Employment situation
LCW/WRAG customers had often been out of employment for longer than other conditionality groups. Among those not in employment prior to AWCS but who had worked in the past, a minority of LCW/WRAG customers were last in work less than 6 months ago (6% compared with 23% of pre-WCA customers and 11% of LCWRA/SG customers) or between 6 months and less than one year ago (8% compared with 25% of pre-WCA customers and 12% of LCWRA/SG customers). In line with the quantitative data, qualitative interviews found that most LCW/WRAG customers had not worked for over 2 years.
LCW/WRAG customers were less likely than pre-WCA customers to have been in paid work before AWCS (10% compared with 18%), and more likely to have classified themselves as economically inactive (73% compared with 69% of pre-WCA customers), despite the policy intending for this group to be moving towards employment.
Feelings about work
LCW/WRAG customers showed mixed feelings about returning to work. Prior to starting AWCS, they were more likely than pre-WCA customers to have felt positive about paid work and to report that they could return to work now if the right job or support was available (19% compared with 15% of pre-WCA customers not in work at baseline and disclosed a health condition), though still only a minority. The qualitative interviews found that a prolonged time out of employment left many in this conditionality group feeling de‑skilled, low in confidence, and disconnected from the labour market.
I really need to re-build my confidence. Because I want to go back into the work force. But I was starting from zero.
(LCW/WRAG customer)
As these customers’ health conditions were typically long‑standing, often worsening gradually over time rather than emerging suddenly, there was ongoing uncertainty and concern about managing health conditions in a work environment. These customers expressed doubts about whether workplaces would be flexible or accessible enough, and whether suitable roles are realistically available.
While some felt ready to return to work if appropriate, health‑accommodating roles could be identified, others believed their declining health, combined with lack of recent experience, meant they were not yet ready and would require confidence‑building, skills development, or time before re‑engaging with work‑focused activity.
In addition to health‑related barriers, LCW/WRAG customers were more likely than the other conditionality groups to have reported family or caring commitments as a barrier to gaining or maintaining employment before AWCS (12% compared with 9% of pre-WCA customers and 5% of LCWRA/SG customers). LCW/WRAG customers who took part in qualitative interviews often highlighted additional caring responsibilities, as well as limited availability and flexibility for work. Compared with pre‑WCA customers, those in the LCW/WRAG group were more aware that retraining may be necessary but often lacked clarity about what retraining would be realistic, appropriate, or supported.
I think companies are struggling to get past that [being out of work for 5 years], and I’m not getting interviews or getting called into places.
(LCW/WRAG customer)
Implications for AWCS
Although there are higher expectations for LCW/WRAG customers than LCWRA/SG, this group still faced significant barriers to employment. While slightly more positive about work than pre-WCA customers, it was still only a minority that felt this way. Taking into account the length of time out of work, ongoing management of their health conditions, and greater likelihood of having caring responsibilities, this conditionality group may also be likely to need initial support to build their confidence before more focused job search.
Profile of LCWRA/SG customers
Health
LCWRA/SG customers were more likely than the other conditionality groups to report experiencing any main health condition linked to a learning difficulty or neurodiversity (28% compared with 17% of pre-WCA customers and 19% of LCW/WRAG customers).
Qualitative findings provided more detail about their health journeys, which typically involved severe, long‑standing, and often degenerating health conditions. Many had lived with their condition for several years, with deterioration over time, and some were awaiting surgery or further treatment before their health can stabilise. While LCWRA/SG customers were typically furthest from the labour market, those who chose to take up AWCS did so knowing the support was voluntary. For some, this reflected a willingness to stay connected to support services and explore their options, even if they did not feel work was immediately realistic. Others engaged because they were hopeful that their situation might improve in the longer term. However, most still faced substantial health‑related barriers that limited the expectations of returning to work in the short term.
Employment situation
In the qualitative research, LCWRA/SG customers consistently described being further away from the labour market and generally had less recent employment experience than the other conditionality groups. This aligns with the quantitative data where customers in this conditionality group not in employment at the start of AWCS but who had worked in the past were less likely to have last worked less than 6 months ago (11% compared with 23% of pre-WCA customers not in work at baseline) and more likely to have last worked 20 years ago or more (6% compared with 3% of pre-WCA customers not in work at baseline).
LCWRA/SG customers were more likely than pre-WCA customers to report physical or mental health issues as a barrier to gaining or maintaining employment (91% compared with 87% respectively). In the qualitative research, many mentioned they felt that work was not currently realistic, or may never be realistic, given the severity and complexity of their health conditions. Nearly all had previous employment experience, but most left work several years ago as their health gradually worsened, often after long‑term or stable roles, heightening the sense of loss and distance from employment.
I want to work, like I’ve worked since I was 18 years old, but I was told by my consultant that because of what has happened [lower spine injury] and where it is, I can’t work.
(LCWRA/SG customer)
Feelings about work
LCWRA/SG customers were more likely than the other conditionality groups to have felt positive about working in the future, with a higher proportion reporting at baseline that they could return to work now if the right job or support were available (26% compared with 15% of pre-WCA customers and 19% of LCW/WRAG customers not in work at baseline and disclosed a health condition). However, it was still only a minority, which was reflected in the qualitative research which showed many believed that their health ruled out work entirely, both in the short and long term.
Among those interviewees who wanted to work in the future, most recognised it would require significant retraining, major health improvements, and highly specialised or flexible employment.
I’d love to go back to work, I really would, yeah, but because of my health conditions that I’ve got I can’t exactly go back in the job I used to do because I am too old for it.
(LCWRA/SG customer)
In the qualitative research, LCWRA/SG customers’ confidence was often very low, particularly among those out of work the longest or who had faced repeated setbacks. While many felt very distant from work, some still expressed a desire to work eventually, provided there was sustained confidence‑building, flexible roles, or support for gradual transitions, such as volunteering or part‑time work.
In addition to health barriers, qualitative findings found that some LCWRA/SG customers faced layered and intersecting challenges, including low confidence, lack of suitable jobs that can accommodate their condition, and a minority also faced complex barriers such as criminal records, history of addiction, or long‑term financial instability. These factors reinforced a sense for some customers that they would be unable to re-enter the job market.
I have lost my confidence completely. If I go somewhere strange, I start getting panic attacks…There’s nothing for me at all… No one would be able to employ me.
(LCWRA/SG customer)
Implications for AWCS
The LCWRA/SG conditionality group as a whole are not required to undertake work-related activities. Those that have voluntarily taken part in AWCS were a self-selecting group which would explain them being relatively positive about work. However, their complex health conditions and overall distance from employment suggests that likelihood AWCS would be able to support these individuals into immediate employment would be limited.
3. Experiences of AWCS
This chapter describes how AWCS customers experienced support and how these experiences evolved over time. The analysis in this chapter reports the significant experiences of AWCS customers at baseline and follow-up. Significant differences by characteristics within conditionality group are explored where relevant.
Summary of AWCS experience
- AWCS was generally delivered as intended, and customers were satisfied with how support was delivered.
- Appointment frequency generally aligned with policy design for pre-WCA and LCWRA/SG customers, though LCW/WRAG customers were less likely to report receiving the expected level of contact with a work coach.
- Overall, customers felt the frequency and length of appointments were ‘about right’. Satisfaction with the frequency of appointments increased over time, often correlated with customers being closer to work, improved health needs, and expectations of progress.
- Most customers reported consistent contact with the same work coach at the start of support, though this had reduced slightly by the follow-up survey 8-9 months after starting AWCS.
- Telephone appointments were the main appointment mode, although this often varied by health needs, claim length, and age.
- Qualitative interviews indicated that customers were most satisfied when support was tailored to their circumstances: this involved being work‑focused for those nearer employment and adapted to health needs for those further away from work. They also highlighted that flexibility in delivery was valued, particularly by those with complex health needs or mobility barriers.
Contact with a work coach
As shown in Figure 3.1, the majority (69%) of AWCS customers who recalled work coach support saw the same work coach each time they had an appointment with the Jobcentre at baseline (conducted in the first 4-6 weeks of receiving support). However, by follow-up – 7-9 months after support began – this figure declined to around two-thirds (64%) among those who recalled receiving work coach support.
Feedback from qualitative interviews indicated that in some cases changes in work coach were purposeful, enabling access to specialist advice, although for some customers these changes disrupted trust and required repeating sensitive information. Consistent contact was valued for relationship-building and confidence, particularly among those with complex or sensitive needs.
Figure 3.1: If customers usually spoke to the same work coach every time they had an appointment with the Jobcentre since starting support at baseline and follow-up, by conditionality group
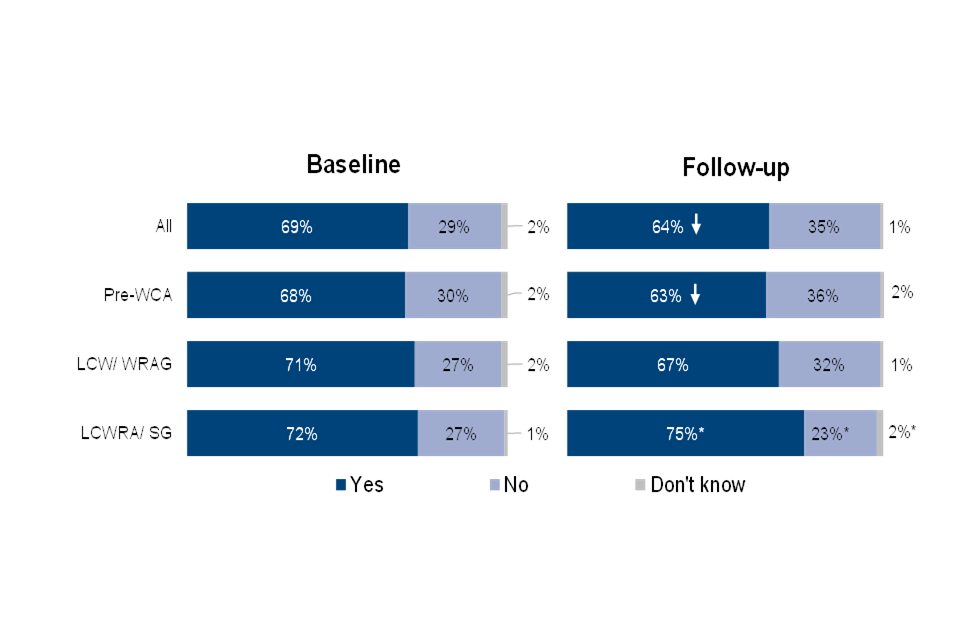
Baseline (accessible table)
| Conditionality group | Yes | No | Don’t know |
|---|---|---|---|
| All | 69% | 29% | 2% |
| Pre-WCA | 68% | 30% | 2% |
| LCW/WRAG | 71% | 27% | 2% |
| LCWRA/SG | 72% | 27% | 1% |
Follow up (accessible table)
| Conditionality group | Yes | No | Don’t know |
|---|---|---|---|
| All | 64% ↓ | 35% | 1% |
| Pre-WCA | 63% ↓ | 36% | 2% |
| LCW/WRAG | 67% | 32% | 1% |
| LCWRA/SG | 75%* | 23%* | 2%* |
Baseline: F1. Since [AWCS START MONTH], have you usually spoken to the same work coach every time you have had an appointment with the job centre? Base: If have a work coach: All AWCS customers (n=3,709); Pre-WCA (n=2,706); LCW/WRAG (n=915); LCWRA/SG (n=89).
Follow-up: F1. Since [AWCS START MONTH], have you usually spoken to the same work coach every time you have had an appointment with the job centre? Base: If have a work coach: All AWCS customers (n=1,417); Pre-WCA (n=796); LCW/WRAG (n=581); LCWRA/SG (n=40). *Low base size: Treat with caution. Arrows show significant changes between waves.
There were no notable differences in work coach consistency by conditionality group at follow-up, though younger customers aged 16-25 who recalled work coach support were more likely to have seen the same work coach (70%) compared with the overall proportion of AWCS customers who recalled work coach support (64%). Furthermore, customers who were unemployed on entry to AWCS but had been in employment less than 6 months before, were less likely than other customers to report seeing the same work coach (57%).
Qualitative findings suggested that where customers reported little or no contact with a work coach, this typically reflected low engagement with AWCS. Some customers had only attended one appointment, often because their physical or mental health worsened and moving towards work no longer felt realistic. Others recalled long gaps or cancellations, with abrupt or unclear ending of support from the customers perspective which limited opportunities to build rapport. Interviews indicated that fragmented support for pre-WCA customers often reflected uncertainty about health trajectories or Work Capability Assessment outcomes, which sometimes led to shifts in work coach involvement.
Customer perceptions of frequency of work coach appointments
In the baseline survey (approximately 4-6 weeks after being enrolled in AWCS), most customers reported receiving the expected amount of time with a work coach according to the policy design for their customer group:
- Pre‑WCA customers were expected to meet with a work coach for around 30 minutes per fortnight and around 7 in 10 (71%) reported receiving this amount of time or more, with 7% meeting their work coach once a week and 65% a couple of times a month.
- LCW/WRAG customers were also expected to receive around 30 minutes of support per fortnight, though only three-fifths (59%) reported receiving this level of contact, 3% saw their work coach once a week and 56% a couple of times a month.
- LCWRA/SG customers were generally offered 30 minutes per month, and around three‑quarters (76%) reported receiving the offered amount of time as 4% met with their work coach once a week, 38% a couple of times a month, and 33% once a month.
During qualitative interviews, customers also described a range of contact patterns over time. Pre‑WCA customers often experienced more frequent contact early in their journey, which could later reduce depending on health developments or Work Capability Assessment outcomes. LCW/WRAG customers commonly shifted from fortnightly to monthly appointments, while LCWRA/SG customers typically had monthly or less frequent contact, sometimes every 6 weeks. Most customers felt that these patterns reflected their individual circumstances rather than rigid rules linked to customer group.
There were also a minority of customers who had limited contact overall with a work coach, having just a few short appointments.
[After the first appointment] she phoned up a month later. Then she phoned up 6 weeks later, and then she never got back to me.
(LCWRA/SG customer)
Figure 3.2 shows the frequency of work coach appointments since starting AWCS support at baseline, by conditionality group.
Figure 3.2: Frequency of work coach appointments since starting support at baseline, by conditionality group
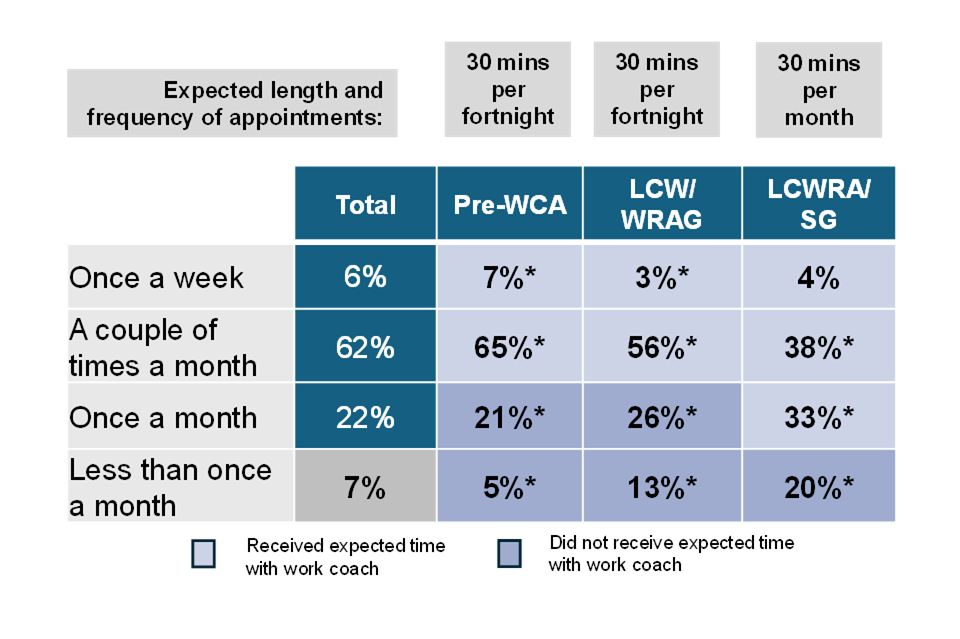
Figure 3.2: Frequency of work coach appointments since starting support at baseline, by conditionality group (accessible version)
Expected length of appointment:
- Pre-WCA: 30 minutes per fortnight
- LCW/WRAG: 30 minutes per fortnight
- LCWRA/SG: 30 minutes per month
(Accessible table)
| Total | Pre-WCA | LCW/WRAG | LCWRA/SG | |
|---|---|---|---|---|
| Once a week | 6% | 7%* | 3%* | 4% |
| A couple of times a month | 62% | 65%* | 56%* | 38%* |
| Once a month | 22% | 21%* | 26%* | 33%* |
| Less than once a month | 7% | 5%* | 13%* | 20%* |
Baseline: F2. On average, since [AWCS START MONTH], how often do you meet with your work coach(es) either face-to-face, via video or on the phone? Base: If have a work coach: All AWCS customers (n=3,692); Pre-WCA (n=2,288); LCW/WRAG (n=1,277); LCWRA/SG (n=127) *Significant against the average
Customer satisfaction with frequency and length of work coach appointments
Satisfaction with frequency of appointments
Overall, customers who recalled how often they met with a work coach generally felt the frequency of their appointments was about right, and satisfaction with the frequency of appointments increased over time for all conditionality groups. At the start of support, 72% of AWCS customers thought the frequency of appointments was ‘about right’, and this rose to 78% at follow-up. As shown in Figure 3.3, satisfaction increased among all conditionality groups at follow-up.
Figure 3.3: Frequency of work coach appointments since starting support at baseline and follow-up, by conditionality group
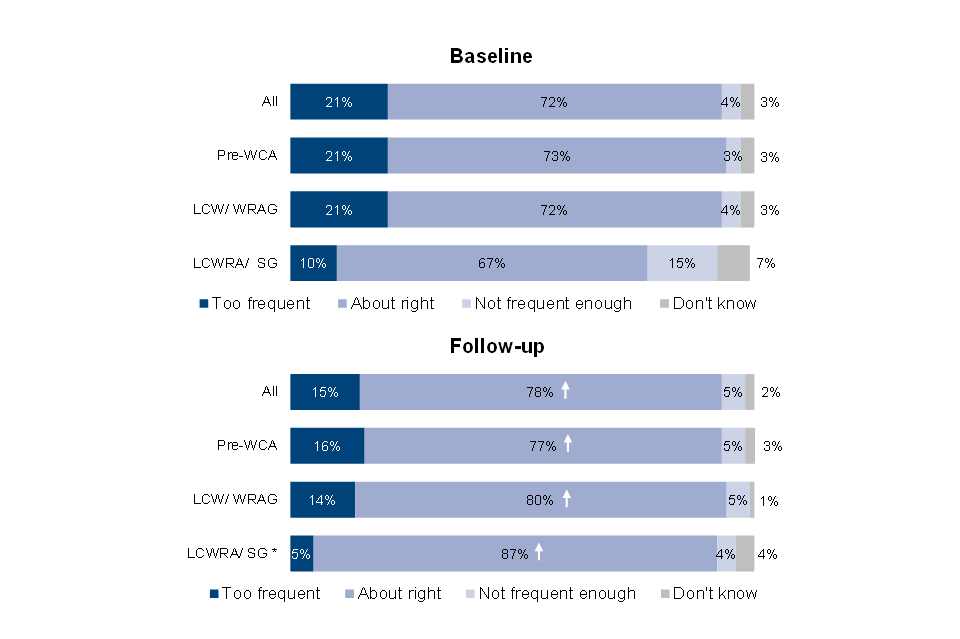
Baseline (accessible table)
| Too frequent | About right | Not frequent enough | Don’t know | |
|---|---|---|---|---|
| All | 21% | 72% | 4% | 3% |
| Pre-WCA | 21% | 73% | 3% | 3% |
| LCW/WRAG | 21% | 72% | 4% | 3% |
| LCWRA/SG | 10% | 67% | 15% | 7% |
Follow-up (accessible table)
| Too frequent | About right | Not frequent enough | Don’t know | |
|---|---|---|---|---|
| All | 15% | 78% ↑ | 5% | 2% |
| Pre-WCA | 16% | 77% ↑ | 5% | 3% |
| LCW/WRAG | 14% | 80% ↑ | 5% | 1% |
| LCWRA/SG | 5% | 87% ↑ | 4% | 4% |
Baseline: F3. Do you think how often you meet with your work coach(es) is…? Base: All who recall how often they meet with a work coach: All AWCS customers (n=6,069); Pre-WCA (n=3,801); LCW/WRAG (n=2,127); LCWRA/SG (n=141).
Follow-up: F3. Do you think how often you meet with your work coach(es) is..? Base: If have a work coach: All AWCS customers (n=1,417); Pre-WCA (n=796); LCW/WRAG (n=581); LCWRA/SG (n=40). * Low base size: Treat with caution
In the qualitative research, a minority of customers, particularly those more motivated to move towards work, reported dissatisfaction where appointments were perceived as too infrequent, too irregular, or reduced without explanation. These customers tended to want more proactive, work‑focused engagement and viewed limited contact as holding back progress.
There were no notable differences by conditionality group in terms of how AWCS customers felt about the frequency of their appointments at follow-up. However, there were significant differences by other characteristics:
- Health condition: Customers with at least one mental health condition were more likely than those without to say the frequency of their appointments with their work coach was ‘about right’ at follow-up (86% and 73% respectively), as were customers with only one long-term health condition (82% compared with 78% of all AWCS customers).
- Age: There were also differences according to customer age group. At follow-up, 20% of customers aged 36-45 felt appointments were “too frequent”, whilst 10% of customers aged 56-65 thought so (compared with 15% of all AWCS customers).
Satisfaction with length of appointments
Overall, the majority (88%) of AWCS customers who recalled work coach support generally felt the length of their appointments was about right when asked at baseline, approximately 4-6 weeks into receiving AWCS. LCW/WRAG customers were more likely to say this (92%), as were customers not in employment prior to AWCS and last worked a job 5 years or more prior to receiving support (96% compared with 88% of all AWCS customers who have a work coach). A small minority felt appointments were not long enough at follow-up (7%), a perception more common among customers who did not usually see the same work coach at each appointment (10% compared with 6% among those with consistent contact).
Qualitative findings help to explain these patterns and highlight the importance of perceived relevance rather than strict adherence to appointment duration or frequency. Customers described wide variation in how appointments were delivered in practice. Some lasted the full 30 minutes, while others were considerably shorter, sometimes around 10 minutes, and framed as informal check‑ins. Shorter appointments were generally viewed as acceptable, and sometimes preferable, by customers who felt far from work and primarily wanted wellbeing‑focused support.
Because I am ESA support group it could be at a slower pace that suits me and my health conditions. I felt supported straight away especially because of my health conditions.
(LCWRA/SG customer)
In contrast, customers closer to work were sometimes critical of very short or rushed appointments, which they felt limited progress towards work‑related goals.
Customer perceptions of mode of work coach appointments
AWCS was delivered using a blended and adaptable approach, designed to be tailored to customers’ health, age, and personal circumstances. An element of this flexibility was giving customers the choice of mode of work coach appointments. Both survey and qualitative evidence suggested that this flexibility played an important role in supporting engagement, particularly for customers facing anxiety, mobility issues, or fluctuating health conditions.
AWCS customers who recalled work coach support were most likely to report meeting their work coach over the phone. As show in Figure 3.3, at baseline, telephone appointments were the most common mode of contact, with nearly three-quarters (74%) of AWCS customers reporting meeting their work coach by phone. Face-to-face meetings at the Jobcentre were also widely used, with 60% of customers reporting this mode of contact, while video calls were less frequent (19%).
Figure 3.3: Mode of work coach appointments at baseline
| Mode | Baseline |
|---|---|
| Over the phone | 74% |
| Face-to-face at Jobcentre | 60% |
| Over a video call | 19% |
Quantitative findings illustrated differences in appointment modes across customer groups, while qualitative interviews highlighted how flexibility in the delivery supported customers with differing needs:
- Health condition: The severity of health conditions influenced mode of contact as customers whose health had a high day-to-day impact were less likely to attend face-to-face appointments than the overall proportion of all AWCS customers who have a work coach (57% compared with 60%). Similarly, customers with any physical health condition were more likely than the overall proportion to have appointments over the phone (76% compared with 74% of all AWCS customers who have a work coach). In the qualitative interviews, customers with physical health conditions felt that travelling to the Jobcentre for appointments would have been more challenging due to mobility issues, fatigue, or pain, indicating that remote appointment options removed practical barriers to engagement that could have reduced or delayed support for those with poorer health. In qualitative interviews, remote appointments were particularly welcomed by customers with anxiety or other mental health conditions and described as less stressful and more conducive to open conversations, reducing feelings of scrutiny and pressure. In contrast, face-to-face appointments remained particularly important for other groups. Customers with only learning difficulties or neurodivergence as their main conditions were more likely to meet their work coach face to face at the Jobcentre (73%), as were those without access to the internet (68%) compared with 60% of all AWCS customers who have a work coach. In qualitative interviews, face-to-face appointments benefits cited included building rapport, reducing isolation, and providing valuable human interaction for these customers.
If my knee permits, I go [to a face-to-face appointment], because I like to get out. But I can’t always get out because it’s too painful. We have both, they adapt [the mode of appointments], they’re fantastic that way.
(LCWRA/SG customer)
- Claim length: Those with a claim length of more than 3 years and those who had been out of work for 5 years or more were also more likely to have appointments over the phone (76% and 78% respectively) compared with 74% of all AWCS customers who have a work coach. Similarly, customers who felt their situation ruled out work as an option now and in the future (81%), and those who were felt currently unable to work but might be able to in the future if their situation improved (76%), were more likely to meet over the phone than the overall proportion of AWCS customers who have a work coach. In qualitative interviews, these groups felt that remote appointments were more proportionate to their employment situation and allowed for engagement without the perceived burden of repeated in‑person visits at the Jobcentre.
- Age: Age differences often shaped video call appointment use as younger customers were more likely to meet with their work coach via video call, with around a quarter of those aged 16-25 (24%) and 26-35 (25%) using this mode compared with 19% of all AWCS customers who have a work coach. This may reflect greater familiarity and comfort with digital tools among younger customers.
4. Impact of AWCS on employment outcomes and job search activity
This chapter reports the impacts of AWCS on pre-WCA and LCW/WRAG customers’ self-reported employment and benefits status at follow-up, 8 to 9 months after they started receiving the intervention. It also reports the impacts of AWCS on customers’ self-reported job-related activity, including their job search self-efficacy and their engagement in training or volunteering.
Summary of impact on employment outcomes and job search activity
- Overall, there was no significant evidence, either overall or within particular customer subgroups, that AWCS had an impact on whether customers were in paid work within the timeframe of the evaluation, or on the benefits they claimed.
- Overall, there was some significant evidence that AWCS brought LCW/WRAG customers closer to the labour market in that they were more likely than non-AWCS LCW/WRAG customers to report being economically active.
- There was also significant evidence among the LCW/WRAG group AWCS increased customers’ job search activity as defined by the Finnish Institute of Occupational Health (FIOH) job search activity scale. This was influenced by length of time on benefits, age, and health needs.
- Furthermore, there was some significant evidence that AWCS was associated with more pre-WCA customers participating in training and more LCW/WRAG customers participating in volunteering.
- However, there was no significant evidence that AWCS had an impact on customers’ levels of job search self-efficacy as defined by the Job-Search Self-Efficacy (JSSE) scale.
Interpreting impact tables
The tables in chapters 4 to 8 show the broader impact analysis findings and use the same format. The tables present the results for each follow-up survey outcome for those receiving AWCS and non-AWCS customers. The initial columns show the results for the pre-WCA and LCW/WRAG conditionality groups combined (referred to as “AWCS customers”), with the subsequent columns showing the results for pre-WCA and LCW/WRAG conditionality groups separately. Each outcome is presented in either percentages or mean scores, with the percentage point or mean score difference provided. Across all the tables, any discrepancies between the percentage point (pp) differences presented and the percentages for the outcomes are due to rounding to the nearest whole pp.
The tables show for each outcome the p-value significance level of the difference between AWCS and matched non-AWCS customers. The p-value indicates whether the differences are likely or unlikely to be due to chance. If below 0.05, we assume the differences are unlikely to be due to chance and AWCS has likely had an impact on that outcome. The lower they are, the more likely it is that AWCS had an impact.
Two types of variables have been analysed: Binary (between two variables) and categorical (multiple options within one variable). For binary variables, the p-value shows significant differences between the two variables. For categorical variables, the p-values shows significant differences in the distribution of responses within one variable.
The p-values were calculated in the complex samples module of SPSS and take into account the survey non-response weights that are applied to the AWCS group and the propensity score weights that are attached to the matched comparison group. Where the differences between the two groups are significant (that is, the p-value is less than 0.05), these are highlighted in blue bold and with an asterisk. The term ‘significant’ is often abbreviated in the text to ‘significant’.
The unweighted sample sizes are cited at the end of each table.
Impact on employment status
Table 4.1 shows the percentage of customers who reported at follow up:
- having done any paid work since baseline
- being in paid work (of any hours)
- being in paid work (broken down by full or part-time hours)
- being economically active (in paid work or unemployed but looking for work)
- being in paid work, unemployed but looking for work, or not economically active
Table 4.1: Impacts of AWCS on self-reported employment status
All Pre-WCA/LCW/WRAG customers
| Treat’t % | Comp’n % | Pp/mean diff | p-value | |
|---|---|---|---|---|
| % done any paid work since starting AWCS | 24 | 23 | 1 | 0.623 |
| % currently in paid work | 18 | 18 | 0 | 0.979 |
| % currently economically active[footnote 4] | 38 | 34 | 4 | 0.019* |
| Current working hours | [No data] | [No data] | [No data] | 0.501 |
| Working fewer than 16 hours | 5 | 5 | 0 | [No data] |
| Working 16 to 30 hours | 8 | 7 | 1 | [No data] |
| Working 31 hours or more | 5 | 5 | -1 | [No data] |
| Working hours not given | 1 | 1 | 0 | [No data] |
| Not working | 82 | 82 | 0 | [No data] |
| Broad current employment status | 0.012* | |||
| In work | 18 | 18 | 0 | [No data] |
| Unemployed and looking for work | 20 | 16 | 4 | [No data] |
| Economically inactive or not given[footnote 5] | 62 | 66 | -4 | [No data] |
| Unweighted bases: all | 1923 | 1932 | [No data] | [No data] |
Pre-WCA customers
| Treat’t % | Comp’n % | Pp/mean diff | p-value | |
|---|---|---|---|---|
| % done any paid work since starting AWCS | 25 | 24 | 2 | 0.398 |
| % currently in paid work | 20 | 19 | 1 | 0.561 |
| % currently economically active[footnote 4] | 39 | 35 | 3 | 0.143 |
| Current working hours | [No data] | [No data] | [No data] | 0.283 |
| Working fewer than 16 hours | 5 | 5 | 0 | [No data] |
| Working 16 to 30 hours | 9 | 7 | 2 | [No data] |
| Working 31 hours or more | 5 | 6 | -1 | [No data] |
| Working hours not given | 1 | 1 | 0 | [No data] |
| Not working | 80 | 81 | -1 | [No data] |
| Broad current employment status | [No data] | [No data] | [No data] | 0.313 |
| In work | 20 | 19 | 1 | [No data] |
| Unemployed and looking for work | 19 | 17 | 2 | |
| Economically inactive or not given[footnote 5] | 61 | 65 | -3 | [No data] |
| Unweighted bases: all | 1231 | 1205 | [No data] | [No data] |
LCW/WRAG
| Treat’ %t | Comp’n % | Pp/mean diff | p-value | |
|---|---|---|---|---|
| % done any paid work since starting AWCS | 18 | 20 | -2 | 0.416 |
| % currently in paid work | 13 | 16 | -3 | 0.118 |
| % currently economically active[footnote 4] | 36 | 29 | 8 | 0.009* |
| Current working hours | [No data] | [No data] | [No data] | 0.535 |
| Working fewer than 16 hours | 5 | 6 | -1 | [No data] |
| Working 16 to 30 hours | 4 | 6 | -2 | [No data] |
| Working 31 hours or more | 3 | 3 | -1 | [No data] |
| Working hours not given | 1 | 1 | 0 | [No data] |
| Not working | 87 | 84 | 3 | [No data] |
| Broad current employment status | [No data] | [No data] | [No data] | <0.001* |
| In work | 13 | 16 | -3 | [No data] |
| Unemployed and looking for work | 24 | 13 | 11 | [No data] |
| Economically inactive or not given[footnote 5] | 64 | 71 | -8 | [No data] |
| Unweighted bases: all | 692 | 727 | [No data] | [No data] |
There was no significant evidence that AWCS had an impact on employment outcomes for pre-WCA and LCW/WRAG customers across a number of different dimensions.
There was no significant evidence that AWCS had an impact on the proportion of customers who had done any paid work since starting AWCS. Around a quarter (24%) of those receiving AWCS had done any paid work since starting AWCS compared with 23% of non-AWCS customers (1 percentage point difference (pp diff), p-value 0.623).
Similarly, there was no significant evidence that AWCS had an impact on the proportion of AWCS customers who were in paid work at the time of the follow up survey, and the proportion remained at a fairly low level. Overall, the same proportion (18%) of AWCS customers and non-AWCS customers were in work at follow-up (0pp diff, p-value 0.979).
Furthermore, there was no significant evidence that AWCS had an impact on whether different types of AWCS customers were in paid work at follow-up within (Test 1) or between (Test 2) sub-groups (Sections 1 to 8 in Appendix B). This mirrors the findings of earlier qualitative research conducted, which indicated that feeling meaningfully closer to work was only an outcome for a minority of customers.
Furthermore, there was no significant evidence that AWCS had an impact on the number of hours worked for those in work at follow-up. Of AWCS customers, only 5% were working full-time (i.e., more than 30 hours a week), 8% were working part-time (i.e., 16-30 hours) and 5% were working fewer than 16 hours a week. There were no significantly different patterns between those receiving AWCS and non-AWCS customers (p-value 0.501).
There was, however, some indication that AWCS had a positive impact on the proportion of LCW/WRAG intervention customers who reported being economically active[footnote 6] rather than economically inactive[footnote 7]. Two in five (38%) of those receiving AWCS were either in paid work or looking for work compared with 34% of their non-AWCS customer counterparts (4pp diff, p-value 0.019). This impact was mainly driven by differences among LCW/WRAG customers, rather than among pre-WCA customers, with 36% of LCW/WRAG customers receiving AWCS reporting being economically active compared with 29% of their non-AWCS customer counterparts (8pp diff, p-value 0.009).
Furthermore, AWCS had a positive impact on LCW/WRAG customers’ self-reported employment status. There were significantly different patterns between LCW/WRAG AWCS and non-AWCS customers in their self-reported employment status: being in paid work, unemployed and looking for work, and economically inactive (p-value <0.001). This suggests that while there was no change in employment status over the timeframe of the evaluation, there were shifts in how LCW/WRAG customers thought of themselves and work which may move customers closer to work in the future.
Contextual findings:
The proportion of AWCS customers who reported that physical and mental health barriers made it difficult for them to gain or maintain employment significantly reduced over time (Figure 4.1). At baseline, 87% of AWCS customers reported physical or mental health barriers (compared with 82% at follow-up). This was particularly the case for LCW/WRAG and LCWRA/SG customers. This might indicate AWCS encouraged customers (particularly LCW/WRAG and LCWRA/SG customers) to rethink their skills and experience.
However, the proportion of customers who reported physical and mental health barriers remained high at follow-up (82%). This mirrors findings in earlier qualitative research conducted, which found that health conditions were the biggest barriers for customers in returning to work now and in the future. This may help explain why there was no significant evidence that AWCS had a positive impact on employment outcomes.
Figure 4.1: Top 5 barriers making it difficult to gain or maintain employment at follow-up, by conditionality group
All
| Barrier | Percentage |
|---|---|
| Physical or mental health issues | 82% |
| Lack of skills or recent experience | 10% |
| Family or caring commitments | 9% |
| Problems with transport or the cost of transport to get to a job | 7% |
| Lack of jobs available | 7% |
Pre-WCA
| Barrier | Percentage |
|---|---|
| Physical or mental health issues | 82% |
| Lack of skills or recent experience | 10% |
| Family or caring commitments | 9% |
| Problems with transport or the cost of transport to get to a job | 8% |
| Lack of jobs available | 7% |
LCW/WRAG
| Barrier | Percentage |
|---|---|
| Physical or mental health issues | 84% |
| Lack of skills or recent experience | 12% |
| Family or caring commitments | 10% |
| Problems with transport or the cost of transport to get to a job | 7% |
| Lack of jobs available | 6% |
LCWRA/SG
| Barrier | Percentage |
|---|---|
| Physical or mental health issues | 81% |
| Lack of skills or recent experience | 13% |
| Lack of jobs available | 9% |
| Not applicable / no issues getting a job | 7% |
| Problems with transport or the cost of transport to get to a job | 6% |
Impact on benefit receipt
Table 4.2 shows the percentage of customers at follow up in receipt of:
- any benefit
- any employment-related or means tested benefit[footnote 8]
- any non-means tested disability benefit[footnote 9]
It also shows the percentage of customers at follow up in receipt of the following individual benefits:
- Universal Credit (UC)
- Personal Independence Payment (PIP)
As with other tables in this chapter, it compares the experiences of AWCS customers and non-AWCS customers within conditionality groups, looking at pre-WCA and LCW/WRAG as combined (referred to as “AWCS customers”) and separate groups.
Table 4.2: Impacts of AWCS on self-reported benefit receipt
All Pre-WCA/LCW/WRAG customers
| Treat’t % | Comp’n % | Pp/mean diff | p-value | |
|---|---|---|---|---|
| % on any benefit | 97 | 96 | 1 | 0.260 |
| % on employment related or means tested benefit | 95 | 94 | 1 | 0.453 |
| % on non-means tested disability benefit | 38 | 39 | -1 | 0.630 |
| % receiving UC | 92 | 92 | 1 | 0.442 |
| % receiving PIP | 33 | 33 | 0 | 0.966 |
| Unweighted bases: all | 1923 | 1932 | [No data] | [No data] |
Pre-WCA customers
| Treat’t % | Comp’n % | Pp/mean diff | p-value | |
|---|---|---|---|---|
| % on any benefit | 96 | 95 | 1 | 0.156 |
| % on employment related or means tested benefit | 94 | 93 | 1 | 0.348 |
| % on non-means tested disability benefit | 36 | 38 | -2 | 0.370 |
| % receiving UC | 92 | 91 | 1 | 0.405 |
| % receiving PIP | 32 | 32 | 0 | 0.812 |
| Unweighted bases: all | 1231 | 1205 | [No data] | [No data] |
LCW/WRAG
| Treat’t % | Comp’n % | Pp/mean diff | p-value | |
|---|---|---|---|---|
| % on any benefit | 97 | 98 | -1 | 0.521 |
| % on employment related or means tested benefit | 96 | 97 | -1 | 0.664 |
| % on non-means tested disability benefit | 42 | 40 | 3 | 0.385 |
| % receiving UC | 95 | 95 | 0 | 0.960 |
| % receiving PIP | 36 | 34 | 2 | 0.509 |
| Unweighted bases: all | 692 | 727 | [No data] | [No data] |
There was no significant evidence to suggest that AWCS had an impact on customers’ employment-related or health-related benefit status within the timeframe of the evaluation.
At follow-up, over 9 in 10 AWCS customers (95%) were in receipt of employment-related or means tested benefits. As to be expected with the lack of impact on employment outcomes, the analysis did not find any impact on the proportion of AWCS customers receiving these benefits compared with non-AWCS customers, with a similar proportion of the latter (94%) receiving these benefits (1 percentage point difference (pp diff), p-value 0.453).
This was also the case for non-means tested disability benefits at follow-up. Over a third (38%) of AWCS customers were in receipt of non-means tested disability benefits, compared with 39% of non-AWCS customers (-1pp diff, p-value 0.630).
Furthermore, there was no significant evidence that AWCS had an impact on whether different types of AWCS customers were claiming either employment-related or disability benefits at follow-up within (Test 1) or between (Test 2) sub-groups (Sections 1 to 8 in Appendix B).
Impact on job-related activity
Table 4.3 includes the following outcomes:
- Percentage of customers who had done any training or volunteering since baseline;
- Customers’ (not working full-time i.e., 30 or fewer hours a week) mean score on the Finnish Institute of Occupational Health (FIOH) scale. This is a 7-item measure of the frequency with which individuals undertake a range of job search tasks. Responses are coded from 1 (not at all) to 4 (every day). Using the mean from the responses from the 7 items, a continuous job search activity scale was created from 1 to 4, with a higher score denoting a higher level of job search behaviour;
- Customers’ mean score on the Job-Search Self-Efficacy (JSSE) scale. This is a 9-item measure of an individual’s confidence in their ability to undertake a range of job search tasks. Responses are coded from 1 (not at all) to 5 (a great deal). Using the mean from the responses from the 9 items, a continuous job search self-efficacy scale was created from 1 to 5, with a higher score denoting a higher level of job search self-efficacy; and
- Customers’ (not working full time i.e., 30 or fewer hours a week) job search activity, including:
- Percentage of customers making one or more job application in the 2 weeks prior to follow-up;
- Percentage of customers submitting one or more CVs via the internet in the 2 weeks prior to follow-up;
- Hours of job search in the week before follow-up.
Again, the table compares the experiences of AWCS customers and non-AWCS customers within health journey groups, looking at pre-WCA and LCW/WRAG as combined (referred to as “AWCS customers”) and separate groups.
Table 4.3: Impacts of AWCS on job search, training and volunteering
All Pre-WCA/LCW/WRAG customers
| Treat’t | Comp’n | Pp/mean diff | p-value | |
|---|---|---|---|---|
| % done any training since starting AWCS | 21 | 18 | 4 | 0.015* |
| % done any volunteering since starting AWCS | 11 | 8 | 3 | 0.007* |
| Mean score (SD), job search self-efficacy (JSSE), score 1 to 5, higher score better | 2.87(1.22) | 2.82(1.27) | 0.04 | 0.387 |
| Unweighted bases: all | 1923 | 1932 | [No data] | [No data] |
| Mean score (SD), Job-Search behaviour (FIOH), score 1 to 4, higher score better | 1.39(0.59) | 1.37(0.59) | 0.03 | 0.294 |
| % making one or more job applications in the two weeks before follow-up | 23 | 20 | 4 | 0.025* |
| % submitting one or more CVs via the internet in the two weeks before follow-up | 19 | 17 | 2 | 0.215 |
| % job search hours in the week before follow-up | [No data] | [No data] | [No data] | 0.833 |
| Less than an hour | 71 | 72 | -1 | [No data] |
| 1 to 2 hours | 18 | 17 | 1 | [No data] |
| 3 to 4 hours | 6 | 6 | 0 | [No data] |
| 5 to 6 hours | 2 | 1 | 0 | [No data] |
| 7+ hours | 2 | 2 | 0 | [No data] |
| Prefer not to say | 1 | 2 | 0 | [No data] |
| Base: all not working 30+ hours a week | 1841 | 1837 | [No data] | [No data] |
Pre-WCA customers
| Treat’t | Comp’n | Pp/mean diff | p-value | |
|---|---|---|---|---|
| % done any training since starting AWCS | 22 | 18 | 4 | 0.046* |
| % done any volunteering since starting AWCS | 10 | 8 | 3 | 0.057 |
| Mean score (SD), job search self-efficacy (JSSE), score 1 to 5, higher score better | 2.91(1.24) | 2.88(1.30) | 0.03 | 0.616 |
| Unweighted bases: all | 1231 | 1205 | [No data] | [No data] |
| Mean score (SD), Job-Search behaviour (FIOH), score 1 to 4, higher score better | 1.39(0.61) | 1.39(0.62) | 0.01 | 0.776 |
| % making one or more job applications in the two weeks before follow-up | 23 | 21 | 3 | 0.184 |
| % submitting one or more CVs via the internet in the two weeks before follow-up | 19 | 19 | 1 | 0.777 |
| % job search hours in the week before follow-up | 0.920 | |||
| Less than an hour | 72 | 72 | 0 | [No data] |
| 1 to 2 hours | 17 | 16 | 1 | [No data] |
| 3 to 4 hours | 6 | 6 | 0 | [No data] |
| 5 to 6 hours | 2 | 2 | 0 | [No data] |
| 7+ hours | 2 | 2 | 0 | [No data] |
| Prefer not to say | 1 | 2 | -1 | [No data] |
| Base: all not working 30+ hours a week | 1168 | 1133 | [No data] | [No data] |
LCW/WRAG
| Treat’t | Comp’n | Pp/mean diff | p-value | |
|---|---|---|---|---|
| % done any training since starting AWCS | 20 | 16 | 4 | 0.112 |
| % done any volunteering since starting AWCS | 14 | 9 | 5 | 0.021* |
| Mean score (SD), job search self-efficacy (JSSE), score 1 to 5, higher score better | 2.72(1.13) | 2.64(1.17) | 0.08 | 0.277 |
| Unweighted bases: all | 692 | 727 | [No data] | [No data] |
| Mean score (SD), Job-Search behaviour (FIOH), score 1 to 4, higher score better | 1.38(0.53) | 1.31(0.50) | 0.08 | 0.016* |
| % making one or more job applications in the two weeks before follow-up | 24 | 17 | 7 | 0.007* |
| % submitting one or more CVs via the internet in the two weeks before follow-up | 19 | 12 | 6 | 0.006* |
| % job search hours in the week before follow-up | [No data] | [No data] | [No data] | 0.429 |
| Less than an hour | 68 | 73 | -5 | [No data] |
| 1 to 2 hours | 22 | 19 | 3 | [No data] |
| 3 to 4 hours | 6 | 5 | 1 | [No data] |
| 5 to 6 hours | 1 | 1 | 1 | [No data] |
| 7+ hours | 1 | 1 | 0 | [No data] |
| Prefer not to say | 2 | 2 | 0 | [No data] |
| Base: all not working 30+ hours a week | 673 | 704 | [No data] | [No data] |
Impact on volunteering and training
There was some evidence AWCS had a positive impact on pre-WCA and LCW/WRAG customers undertaking training or volunteering:
- Pre-WCA AWCS customers were significantly more likely than comparable non-AWCS customers to have undertaken training since AWCS start (22% compared with 18% of pre-WCA non-AWCS customers, 4 percentage points difference (pp diff), p-value 0.046).
- LCW/WRAG customers were significantly more likely than comparable non-AWCS customers to have undertaken volunteering since AWCS start (14% compared with 9% of LCW/WRAG non-AWCS customers, 5pp diff, p-value 0.021). As volunteering could be considered an active step towards work, this might suggest LCW/WRAG intervention customers were taking positive steps towards work in the future.
Despite these improvements, the overall proportions of AWCS customers reporting undertaking training at follow-up remained low. This reflects earlier qualitative research conducted, which found that customers had low awareness of the options available to them and how to navigate the process of retraining, despite some customers recognising the need to retrain to find work.
Impact on job search behaviour
There was evidence that AWCS had a positive impact on levels of job search activity among LCW/WRAG customers, although it remained low overall. LCW/WRAG AWCS customers not working full-time (i.e. not more than 30 hours a week) scored significantly higher (1.38 out of 4) on the Finnish Institute of Occupational Health (FIOH) job search activity scale, compared with LCW/WRAG non-AWCS customers (1.31 out of 4) (0.08 mean difference (diff), p-value 0.016). There were no significant differences between pre-WCA AWCS customers and comparable non-AWCS customers, with both groups scoring 1.39 out of 4 (0.01 mean diff, p-value 0.776).
There was also evidence that AWCS had a positive impact on customers’ job search activity, as measured by FIOH, for some subgroups specifically (Test 1). The following subgroups had significantly higher scores than comparable non-AWCS customers:
Within LCW/WRAG
- Customers who had been on benefits for 12 months or more scored 1.38 out of 4, compared with 1.27 among their counterpart non-AWCS customers (0.11 mean diff, p-value 0.001) (Table 2.3 in Appendix B).
- Customers aged 56-65 scored 1.35 out of 4, compared with 1.20 among their counterpart non-AWCS customers (0.15 mean diff, p-value 0.033) (Table 4.3 in Appendix B).
- Customers without a physical health condition scored 1.37 out of 4, compared with 1.25 among their counterpart non-AWCS customers (0.12 mean diff, p-value 0.008) (Table 5.3 in Appendix B).
- Customers with one or two health conditions had significantly higher mean scores than their counterpart non-AWCS customers.
- Customers with one health condition scored 1.41 out of 4, compared with 1.27 among their non-AWCS counterparts (0.14 mean diff, p-value 0.018). LCW/WRAG AWCS customers with two health conditions scored 1.34 out of 4, compared with 1.24 among their non-AWCS counterparts (0.11 mean diff, p-value 0.023) (Table 8.3 in Appendix B).
Within Pre-WCA
- Customers who were in work at baseline, or had been out of work for less than a year at baseline, scored 1.45 out of 4 compared with 1.36 among their counterpart non-AWCS customers (0.10 mean diff, p-value 0.025) (Table 1.2 in Appendix B).
However, limited significant evidence of differential impacts between those receiving AWCS and their non-AWCS customer counterparts within the demographics (using Test 2) means these findings should be treated with caution. As such, this suggests the positive impacts of AWCS for LCW/WRAG customers were present across all sub-groups tested.
There was evidence that AWCS had a positive impact on the number of job applications made by LCW/WRAG customers. Among LCW/WRAG AWCS customers not working full-time, around a quarter (24%) had made one or more job applications in the 2 weeks before follow-up (compared with 17% of non-AWCS customers, 7pp diff, p-value 0.007) and around 2 in 10 (19%) had submitted one or more CVs to internet search sites in the 2 weeks before follow-up (compared with 12% of non-AWCS customers, 6pp diff, p-value 0.006).
However, there was little significant evidence that the intervention had an impact on pre-WCA AWCS customers’ job search activity. Similar proportions of pre-WCA AWCS customers not working full-time had made one or more job applications in the 2 weeks before follow-up compared with their non-AWCS counterparts (23% compared with 21%, 3pp diff, p-value 0.184). Furthermore, similar proportions of pre-WCA AWCS customers and non-AWCS customers not working full-time had submitted one or more CVs to internet search sites in the 2 weeks before follow-up (19%, 1pp diff, p-value 0.777).
There was no significant evidence AWCS had an impact on the Job Search Self-Efficacy (JSSE) of either pre-WCA or LCW/WRAG AWCS customers, compared with non-AWCS customers. Pre-WCA customers scored 2.91 out of 5 (compared with 2.88 among their counterpart non-AWCS customers, 0.03 mean diff, p-value 0.616) and LCW/WRAG customers scored 2.72 out of 5 (compared with 2.64 among their counterpart non-AWCS customers, 0.08 mean diff, p-value 0.277). Overall, AWCS customers’ job search self-efficacy levels were quite low as defined by the JSSE, suggesting that more could be done to support them to build confidence in their job search.
5. Impact of AWCS on perceived distance from work
This chapter reports the impacts of AWCS on customers’ attitudes towards work in general, their perceived distance from work, and their views on how working might affect their health condition.
Summary of impact on perceived distance from work
- Overall, there was some evidence that AWCS had a positive impact on the proportion of customers who felt they could return to work with the right job or support.
- However, there was no significant evidence that AWCS had an impact on the proportion of customers who felt ‘ready for work’, as defined by either being in work or feeling like they could return to work now if the right job was available or if they had the right support.
- Similarly, there was no significant evidence that AWCS had an impact on customers’ perceptions of the benefits of working or how work could affect their health.
- There was some evidence that AWCS had a negative impact on customers’ concerns that their condition fluctuates too much to work. A higher proportion of those who received AWCS were concerned about their health fluctuating than non-AWCS customers.
- However, there was no significant evidence that AWCS had an impact on customers’ perceptions of other ways in which work and health may interact, such as concerns about not getting employed because of their condition or work making their health condition worse.
- Finally, there was no significant evidence that AWCS had an impact on the proportion of customers who felt confident looking for work in the future.
Impact on perceived distance from work
Table 5.1 shows the percentage of customers who, at follow up:
- reported whether they were in work or felt they could currently work given the right job or support
- reported whether their situation ruled out work, whether they were currently unable to work but might be able to in the future, whether they felt they could currently work given the right job or support, or whether they were already in work
- agreed with a series of statements about the impact of work on their wellbeing and their health condition
- reported feeling confident about looking for work in the future
As with each table in this chapter, the first two columns show the findings for pre-WCA and LCW/WRAG customers combined (referred to as “AWCS customers”), comparing those in receipt of AWCS and their matched comparison group, with subsequent columns looking firstly at pre-WCA customers and then LCW/WRAG customers, each time split by AWCS and matched comparators.
Table 5.1: Impacts of AWCS on perceived distance from work
All Pre-WCA/LCW/WRAG customers
| Treat’t % | Comp’n % | pp diff | p-value | |
|---|---|---|---|---|
| % in work or could return to work now if right job/support[footnote 10] | 34 | 31 | 2 | 0.168 |
| Proximity to work | [No data] | [No data] | [No data] | 0.032* |
| Situation rules out work | 14 | 16 | -2 | [No data] |
| Currently unable to work but might in future | 51 | 51 | -1 | [No data] |
| Don’t know if could work | 2 | 1 | 1 | [No data] |
| Could return now if right job/support | 15 | 13 | 2 | [No data] |
| Currently in work | 18 | 18 | 0 | [No data] |
| % strongly agree/ agree that: am/would be happier and more fulfilled if working | 54 | 51 | 3 | 0.086 |
| % strongly agree/ agree that: my work can/could accommodate my needs | 30 | 28 | 1 | 0.513 |
| % strongly agree/ agree that: aving a job is/would be beneficial for my health | 41 | 39 | 2 | 0.273 |
| % strongly agree/ agree that: now how to present myself/condition in CV/interviews | 37 | 35 | 2 | 0.284 |
| Unweighted bases: all | 1923 | 1932 | [No data] | [No data] |
| % strongly agree/ agree that: won’t get employed because of condition | 67 | 65 | 2 | 0.338 |
| % strongly agree/ agree that: worried might make condition worse | 66 | 65 | 1 | 0.694 |
| % strongly agree/ agree that: worried condition fluctuates too much to work | 70 | 66 | 4 | 0.036* |
| Unweighted bases: all not in work[footnote 11] | 1596 | 1565 | [No data] | [No data] |
| % very/fairly confident looking for work in future | 57 | 53 | 4 | 0.223[footnote 12] |
| Unweighted bases: all those recalling seeing a work coach | 1377 | 935 | [No data] | [No data] |
Pre-WCA customers
| Treat’t % | Comp’n % | pp diff | p-value | |
|---|---|---|---|---|
| % in work or could return to work now if right job/support[footnote 10] | 35 | 32 | 3 | 0.168 |
| Proximity to work | [No data] | [No data] | [No data] | 0.128 |
| Situation rules out work | 14 | 16 | -3 | [No data] |
| Currently unable to work but might in future | 49 | 51 | -1 | [No data] |
| Don’t know if could work | 2 | 1 | 1 | [No data] |
| Could return now if right job/support | 15 | 13 | 2 | [No data] |
| Currently in work | 20 | 19 | 1 | [No data] |
| % strongly agree/ agree that: am/would be happier and more fulfilled if working | 56 | 53 | 3 | 0.227 |
| % strongly agree/ agree that: my work can/could accommodate my needs | 30 | 29 | 1 | 0.673 |
| % strongly agree/ agree that: having a job is/would be beneficial for my health | 41 | 40 | 1 | 0.679 |
| % strongly agree/ agree that: know how to present myself/condition in CV/interviews | 38 | 37 | 1 | 0.635 |
| Unweighted bases: all | 1231 | 1205 | [No data] | [No data] |
| % strongly agree/ agree that: won’t get employed because of condition | 67 | 65 | 2 | 0.521 |
| % strongly agree/ agree that: worried might make condition worse | 68 | 65 | 3 | 0.236 |
| % strongly agree/ agree that: worried condition fluctuates too much to work | 72 | 65 | 7 | 0.005* |
| Unweighted bases: all not in work[footnote 11] | 992 | 962 | [No data] | [No data] |
| % very/fairly confident looking for work in future | 58 | 54 | 4 | 0.330 |
| Unweighted bases: all those recalling seeing a work coach | 796 | 510 | [No data] | [No data] |
LCW/WRAG
| Treat’t % | Comp’n % | pp diff | p-value | |
|---|---|---|---|---|
| % in work or could return to work now if right job/support[footnote 10] | 34 | 31 | 2 | 0.168 |
| Proximity to work | [No data] | [No data] | [No data] | 0.032* |
| Situation rules out work | 14 | 16 | -2 | [No data] |
| Currently unable to work but might in future | 51 | 51 | -1 | [No data] |
| Don’t know if could work | 2 | 1 | 1 | [No data] |
| Could return now if right job/support | 15 | 13 | 2 | [No data] |
| Currently in work | 18 | 18 | 0 | [No data] |
| % strongly agree/ agree that: am/would be happier and more fulfilled if working | 54 | 51 | 3 | 0.086 |
| % strongly agree/ agree that: my work can/could accommodate my needs | 30 | 28 | 1 | 0.513 |
| % strongly agree/ agree that: having a job is/would be beneficial for my health | 41 | 39 | 2 | 0.273 |
| % strongly agree/ agree that: know how to present myself/condition in CV/interviews | 37 | 35 | 2 | 0.284 |
| Unweighted bases: all | 1923 | 1932 | [No data] | [No data] |
| % strongly agree/ agree that: won’t get employed because of condition | 67 | 65 | 2 | 0.338 |
| % strongly agree/ agree that: worried might make condition worse | 66 | 65 | 1 | 0.694 |
| % strongly agree/ agree that: worried condition fluctuates too much to work | 70 | 66 | 4 | 0.036* |
| Unweighted bases: all not in work[footnote 11] | 1596 | 1565 | [No data] | [No data] |
| % very/fairly confident looking for work in future | 57 | 53 | 4 | 0.223[footnote 12] |
| Unweighted bases: all those recalling seeing a work coach | 1377 | 935 | [No data] | [No data] |
There was some evidence AWCS had a positive impact on the proportion of customers who said they could return to work with the right job or support. Around 1 in 7 (15%) of AWCS customers said they could return to work with the right job or support, compared with 13% of non-AWCS customers (2 percentage point difference (pp diff), p-value 0.032), whilst 14% of those receiving AWCS said their situation ruled out work, compared with 16% of non-AWCS customers (2pp diff, p-value 0.032). However, this should be treated with caution as the p-value was not strong and there was no evidence for the same impact when looking at pre-WCA or LCW/WRAG customers separately.There was no evidence that AWCS had an impact on the proportion of customers who felt ‘ready for work’, as defined by either being in work or feeling like they could return to work now if the right job was available or if they had the right support. Around a third (34%) of those receiving AWCS were in work or felt they could return to work now if the right job was available or with the right support, compared with 31% of non-AWCS customers (2pp diff, p-value 0.168).
There was no evidence AWCS had a significant impact on customers’ perceptions of the benefits of working and how work could affect their health. Over half (54%) of those receiving AWCS felt they are/would be happier and more fulfilled if working, compared with 51% of non-AWCS customers (3pp diff, p-value 0.086). Exactly 3 in 10 (30%) of those receiving AWCS felt their work can/could accommodate their needs, compared with 28% of non-AWCS customers (1pp diff, p-value 0.513). Just over 4 in 10 (41%) of those receiving AWCS felt having a job is/would be beneficial for their health, compared with 39% of non-AWCS customers (pp diff, p-value 0.273). Nearly 4 in 10 (37%) of those receiving AWCS felt they know how to present themselves/their condition in CV/interviews, compared with 35% of non-AWCS customers (2pp diff, p-value 0.284).
These findings support evidence from the qualitative strand of research, which found that most customers did not feel meaningfully closer to work as health remained the overriding barrier. Though some customers felt more optimistic about returning to work with the right support, for most, the journey is likely to be a long one and these initial steps were quite small (such as just leaving the house on a regular basis).
There was evidence that AWCS had a negative impact on customers’ concerns that their condition fluctuates too much to work. 7 in 10 (70%) of those receiving AWCS were worried that their condition fluctuates too much to work, compared with two thirds (66%) of non-AWCS customers (4pp diff, p-value 0.036). This appears to be driven by pre-WCA customers, as there was evidence that AWCS had a negative impact on their perceptions about the impact of work on their condition (72% were worried that their condition fluctuates too much to work, compared with 65% of their non-AWCS customer counterparts (7pp diff, p-value 0.005). In the qualitative strand, customers expressed concerns about fluctuating health as a barrier to work, particularly pre-WCA customers. There were also fears that employers would not understand the nature of their health conditions which reduced motivation to find work. Both these concerns persisted even after AWCS.
On the other hand, there was no significant evidence that AWCS impacted customers’ perceptions of other ways in which work and health may interact, such as concerns about not getting employed because of their condition or work making their health condition worse. Around two-thirds (67%) of those receiving AWCS felt they wouldn’t be employed because of their condition, compared with 65% of non-AWCS customers (2pp diff, p-value 0.338). A similar proportion (66%) of those receiving AWCS where worried work might make their condition worse, compared with 65% of non-AWCS customers (1pp diff, p-value 0.694).
Furthermore, there was no significant evidence that AWCS had an impact on customers’ confidence in looking for work in the future. More than half (57%) of those receiving AWCS felt they were very or fairly confident about looking for work in the future, compared with 53% of non-AWCS customers (4pp diff, p-value 0.223).
6. Impact of AWCS on work coach relationship and support received
This chapter reports the impact of AWCS on customers’ perceptions about their relationship with their work coach, such as whether they feel able to talk to them about the challenges in their life, and whether they think their work coach listens to them and provides advice that is relevant to their situation. It also reports on the perceived support provided by work coaches, including referrals to other services.
Summary of impact on work coach relationship and support received
- Overall, there was strong evidence that AWCS had a positive impact on customers’ perceptions of their relationship with their work coach, particularly around having a good relationship with their work coach and work coach contact.
- There was also strong evidence that AWCS had a positive impact on customers’ perceptions that their work coach offered support which was tailored to their needs and circumstances.
- There was significant evidence that AWCS had a positive impact on pre-WCA customers’ satisfaction with the support they received from a work coach. Furthermore, for pre-WCA customers, there was evidence that AWCS had a positive impact on whether work coaches referred customers to other support programmes and whether customers took up those referrals.
- On the other hand, there was no significant evidence that AWCS had an impact on referrals to support programmes for LCW/WRAG customers. However, there is evidence that AWCS did have a positive impact on whether work coaches made recommendations to LCW/WRAG customers regarding organisations that could provide additional support.
Impact of AWCS on work coach relationship
Table 6.1 shows the percentage of customers who, at follow up:
- reported being satisfied with the support received from their work coach
- reported that work coach support was tailored to their needs and circumstances
- agreed with a set of statements about their relationship with their work coach
As with each table in this chapter, the first two columns show the findings for pre-WCA and LCW/WRAG customers combined (referred to as “AWCS customers”), comparing those in receipt of AWCS and their matched comparison group, with subsequent columns looking firstly at pre-WCA customers and then LCW/WRAG customers, each time split by AWCS and matched comparators.
Table 6.1: Impacts of AWCS on customers’ perceptions of the work coach relationship
All Pre-WCA/LCW/WRAG customers
| % strongly agree/ agree that: | Treat’t % | Comp’n % | pp diff | p-value |
|---|---|---|---|---|
| Have good relationship with work coach | 82 | 75 | 7 | 0.001* |
| Can tell work coach about my challenges | 81 | 75 | 6 | 0.002* |
| Work coach listens to my needs | 84 | 78 | 6 | 0.003* |
| Work coach provides advice relevant to my situation | 81 | 77 | 4 | 0.080 |
| Work coach is good at keeping in touch | 82 | 76 | 5 | 0.007* |
| % very/fairly satisfied with support | 73 | 68 | 5 | 0.050 |
| % saying work coach support was tailored to a great or some extent | 80 | 72 | 7 | 0.001* |
| Unweighted bases: all those recalling seeing a work coach | 1377 | 935 | [No data] | [No data] |
Pre-WCA customers
| % strongly agree/ agree that: | Treat’t % | Comp’n % | pp diff | p-value |
|---|---|---|---|---|
| Have good relationship with work coach | 82 | 76 | 6 | 0.018* |
| Can tell work coach about my challenges | 80 | 74 | 7 | 0.012* |
| Work coach listens to my needs | 83 | 77 | 6 | 0.012* |
| Work coach provides advice relevant to my situation | 80 | 76 | 4 | 0.112 |
| Work coach is good at keeping in touch | 81 | 76 | 5 | 0.045* |
| % very/fairly satisfied with support | 72 | 66 | 6 | 0.029* |
| % saying work coach support was tailored to a great or some extent | 79 | 71 | 7 | 0.006* |
| Unweighted bases: all those recalling seeing a work coach | 796 | 510 | [No data] | [No data] |
LCW/WRAG
| % strongly agree/ agree that: | Treat’t % | Comp’n % | pp diff | p-value |
|---|---|---|---|---|
| Have good relationship with work coach | 82 | 73 | 8 | 0.006* |
| Can tell work coach about my challenges | 82 | 77 | 5 | 0.070 |
| Work coach listens to my needs | 86 | 82 | 4 | 0.090 |
| Work coach provides advice relevant to my situation | 83 | 81 | 2 | 0.460 |
| Work coach is good at keeping in touch | 83 | 76 | 6 | 0.039* |
| % very/fairly satisfied with support | 74 | 74 | 0 | 0.955 |
| % saying work coach support was tailored to a great or some extent | 81 | 75 | 6 | 0.031* |
| Unweighted bases: all those recalling seeing a work coach | 581 | 425 | [No data] | [No data] |
Although customers were sampled for the evaluation on the basis of having had at least one work coach appointment, the following questions were only asked of customers who recalled seeing a work coach since the start of receiving AWCS. A quarter (26%) of AWCS customers did not recall having seen a work coach, with a further 5% saying they did not know, compared with 42% and 6% respectively for non-AWCS customers. The impact estimates below are therefore based on customers who reported currently or having previously seen a work coach since baseline.
Customer perceptions on work coach relationship
AWCS had a significant positive impact on AWCS customers’ perceptions of their relationship with their work coach. However, across a few measures, LCW/WRAG customers were less positive than pre-WCA customers about the impact of AWCS.
Around 8 in 10 (82%) of AWCS customers agreed that they have a good relationship with their work coach, compared with three quarters (75%) of non-AWCS customers (7 percentage point differences (pp diff), p-value 0.001). When looking at both pre-WCA and LCW/WRAG customers’ separately, the significant positive impact is observable for both.
When looking at customer subgroups, there were some customers where there was particular evidence for a positive impact:
Length of claim:
- AWCS had a positive impact on work coach relationship for AWCS customers who had been receiving benefits for 12 months or more, when combining pre-WCA and LCW/WRAG customers.
Age:
-
AWCS was more likely to have a positive impact on customers aged 26-45 in terms of their work coach relationship. Combining pre-WCA and LCW/WRAG customers, among those aged 26 to 35 and those aged 36 to 45, customers receiving AWCS were more likely than non-AWCS customers in the same age group to agree that they had a good relationship with their work coach.
- Among those aged 26 to 35, 83% of those receiving AWCS agreed they had a good relationship with their work coach compared with 73% of non-AWCS customers in the same age group (10pp diff, p-value 0.024). For LCW/WRAG customers of the same age group (26-35) there was also evidence of positive impact of AWCS.
- For 36-45-year-olds, the figures were 83% for AWCS customers compared with 73% of non-AWCS customers in the same age group (10pp diff, p-value 0.023). Among pre-WCA customers of the same age group (36-45), there was evidence of positive impact of AWCS.
Health conditions:
- There was evidence that AWCS had a positive impact on work coach relationship for pre-WCA customers with a physical health condition. Over 8 in 10 (84%) pre-WCA AWCS customers agreed they had a good relationship with their work coach, compared with 73% of their counterpart non-AWCS customers (11pp diff, p-value 0.002).
- There was also evidence that AWCS had a positive impact on work coach relationship for LCW/WRAG customers with a mental health condition. Over 8 in 10 (83%) of LCW/WRAG customers with a mental health condition agreed they had a good relationship with their work coach, compared with 72% of their counterpart non-AWCS customers (11pp diff, p-value 0.001).
- When looking at customers with two health conditions, there is evidence that AWCS had a positive impact on work coach relationship for pre-WCA customers. Over 8 in 10 (82%) of pre-WCA AWCS customers with two health conditions agreed they had a good relationship with their work coach, compared with 69% of their counterpart non-AWCS customers (14pp diff, p-value 0.040).
- On the other hand, there is evidence that AWCS had a positive impact on work coach relationship for pre-WCA and LCW/WRAG customers without a neurodivergent condition. Over 8 in 10 (83%) of pre-WCA AWCS customers without a neurodivergent condition agreed they had a good relationship with their work coach, compared with 76% of their non-AWCS customer counterparts (7pp diff, p-value 0.037). Similarly, over 8 in 10 (84%) LCW/WRAG AWCS customers without a neurodivergent condition agreed they had a good relationship with their work coach, compared with 75% of their non-AWCS customer counterparts (10pp diff, p-value 0.004),
AWCS also had a significant positive impact on customers’ perceptions of the level of contact they had with their work coach. Around 8 in 10 (82%) of those receiving AWCS felt their work coach is good at keeping in touch, compared with 76% of non-AWCS customers (5pp diff, p-value 0.007). When looking at both pre-WCA and LCW/WRAG customers’ separately, the significant positive impact was observable for both.
There was evidence that AWCS had a significant positive impact on customers’ willingness to tell their work coach about the challenges they face. Around 8 in 10 (81%) of those receiving AWCS agreed they can tell their work coach about their challenges, compared with three quarters (75%) of non-AWCS customers (6pp diff, p-value 0.002). When looking at pre-WCA customers alone, AWCS also had a positive impact on customers’ willingness to tell their work coach about the challenges they face, with 80% saying this compared with 74% of their non-AWCS counterparts (7pp diff, p-value 0.012). However, the same was not seen for LCW/WRAG intervention customers.
Furthermore, AWCS had a significant positive impact on customers’ perception that their work coach listens to their needs. Over 8 in 10 (84%) of those receiving AWCS felt their work coach listens to their needs, compared with under 8 in 10 (78%) of non-AWCS customers (6pp diff, p-value 0.003). When looking at pre-WCA AWCS customers alone, the same positive impact was seen, with 83% of saying their work coach listens to their needs compared with 77% of their non-AWCS counterparts (6pp diff, p-value 0.012). Yet, when looking at LCW/WRAG intervention customers, there was no evidence of an impact.
Finally, there was no evidence that AWCS had a significant impact on customers’ perceptions that their work coach provides advice relevant to their situation. Around 8 in 10 (81%) of those receiving AWCS felt their work coach provides advice relevant to their situation, compared with 77% of non-AWCS customers (4pp diff, p-value 0.080).
Satisfaction with support received from work coaches
There was evidence that AWCS had a positive impact on satisfaction with the support received among pre-WCA AWCS customers. Nearly three-quarters of (72%) of these customers did so, compared with two thirds of their non-AWCS counterparts (66%) (6pp diff, p-value 0.029). However, when looking at LCW/WRAG customers, there was no evidence that AWCS had a positive impact on the proportion of customers who felt satisfied with the support they received: for both those receiving AWCS and non-AWCS customers, almost three quarters felt satisfied (74%) (0pp diff, p-value 0.955).
There was strong evidence that AWCS had a positive impact on perceptions the support provided by their work coach was tailored to their needs and circumstances. Exactly 8 in 10 (80%) of those receiving AWCS felt that they received tailored support from their work coach, compared with around 7 in 10 (72%) of non-AWCS customers (7pp diff, p-value 0.001). Similarly, there was evidence that AWCS had a positive impact on the proportion of both pre-WCA and LCW/WRAG customers who felt their work coach provided tailored support, compared with their non-AWCS counterparts.
This evidence is corroborated by the qualitative research, which found that customers valued the tailored approach taken by work coaches who were seen as adapting their advice and support to the needs of customers receiving AWCS. As a result, customers expressed high levels of satisfaction with the support received from AWCS and reported that their relationships with their work coach improved as a result.
Impact of AWCS on support received
Table 6.1 shows:
- support and advice provided by a work coach
- work coach recommendations for support from local organisations
- work coach referrals to support programmes and take up
- participation in other support
Table 6.1: Impacts of AWCS on the support received
All Pre-WCA/LCW/WRAG customers
| Treat’t % | Comp’n % | pp diff | p-value | |
|---|---|---|---|---|
| % work coach gave any support/advice | 89 | 82 | 7 | <0.001* |
| % work coach recommended any support from local organisations | 59 | 55 | 4 | 0.087 |
| % work coach made any referrals to support programmes | 33 | 25 | 8 | <0.001* |
| % taking up referral to support programme made by work coach[footnote 13] | 21 | 16 | 5 | 0.014* |
| Unweighted bases: all those recalling seeing a work coach | 1377 | 935 | [No data] | [No data] |
| % receiving any external support (G9) | 49 | 51 | -2 | 0.236 |
| Unweighted bases: all | 1923 | 1932 | [No data] | [No data] |
Pre-WCA customers
| Treat’t % | Comp’n % | pp diff | p-value | |
|---|---|---|---|---|
| % work coach gave any support/advice | 89 | 81 | 7 | 0.001* |
| % work coach recommended any support from local organisations | 57 | 55 | 2 | 0.546 |
| % work coach made any referrals to support programmes | 34 | 25 | 9 | 0.002* |
| % taking up referral to support programme made by work coach[footnote 13] | 23 | 18 | 5 | 0.039* |
| Unweighted bases: all those recalling seeing a work coach | 796 | 510 | [No data] | [No data] |
| % receiving any external support (G9) | 49 | 52 | -3 | 0.131 |
| Unweighted bases: all | 1231 | 1205 | [No data] | [No data] |
LCW/WRAG
| Treat’t % | Comp’n % | pp diff | p-value | |
|---|---|---|---|---|
| % work coach gave any support/advice | 91 | 83 | 7 | 0.002* |
| % work coach recommended any support from local organisations | 65 | 55 | 10 | 0.006* |
| % work coach made any referrals to support programmes | 28 | 23 | 6 | 0.084 |
| % taking up referral to support programme made by work coach[footnote 13] | 16 | 13 | 4 | 0.160 |
| Unweighted bases: all those recalling seeing a work coach | 581 | 425 | [No data] | [No data] |
| % receiving any external support (G9) | 51 | 49 | 2 | 0.582 |
| Unweighted bases: all | 692 | 727 | [No data] | [No data] |
Contextual findings
The most common type of support or advice that AWCS customers reported their work coach had provided was practical advice to find a job (40% pre-WCA customers; 52% LCW/WRAG customers).
For pre-WCA customers, this was closely followed by finding appropriate training courses and understanding the impact of work on benefits (both 38%). For LCW/WRAG customers, this was closely followed by support to identify jobs suitable for their circumstances (51%).
There was significant evidence that work coaches provided more support to AWCS customers in the pre-WCA and LCW/WRAG conditionality groups, compared to non-AWCS customers. Around 9 in 10 (89%) pre-WCA AWCS customers recalled receiving support or advice from their work coach, compared with 81% of their non-AWCS customer counterparts (7pp diff, p-value 0.001). Similarly, around 9 in 10 (91%) of LCW/WRAG AWCS customers recalled receiving support or advice from their work coach, compared with 83% of their non-AWCS customer counterparts (7pp diff, p-value 0.002).
Figure 6.1: Top 4 types of support and advice work coaches had provided at follow-up, pre-WCA
| Support Need | Percentage |
|---|---|
| Practical advice to find a job | 40% |
| Finding appropriate training courses | 38% |
| Understanding work impact on benefits | 38% |
| Identifying jobs suitable to circumstances | 37% |
Figure 6.2: Top 4 types of support and advice work coaches had provided at follow-up, LCW/WRAG
| Support Need | Percentage |
|---|---|
| Practical advice to find a job | 52% |
| Identifying jobs suitable to circumstances | 51% |
| Finding appropriate training courses | 48% |
| Identifying support to manage health once working | 45% |
For LCW/WRAG customers, there was significant evidence that AWCS had a positive impact on whether work coaches made recommendations to local support programmes. Around two thirds (65%) of LCW/WRAG AWCS customers reported their work coach recommended support from local organisations, compared with 55% of their non-AWCS customer counterparts (10pp diff, p-value 0.006).
Contextual findings
At follow-up, AWCS customers were most likely to have reported their work coach had recommended additional support from mental health community groups or charities (22% pre-WCA customers; 36% LCW/WRAG customers).
For pre-WCA customers, this was closely followed by recommendations to organisations offering financial or debt support, such as the Citizens’ Advice Bureau (15%). For LCW/WRAG customers, this was closely followed by organisations offering support with essentials, such as food banks (20%).
Figure 6.3: Top 5 local organisations work coaches had recommended to customers at follow-up, pre-WCA
| Organisation | Percentage |
|---|---|
| Mental health community groups or charities | 22% |
| Organisations offering financial or debt support | 15% |
| Organisations offering support with essentials | 13% |
| Local hobby groups or classes | 12% |
| Physical health support services | 12% |
Figure 6.4: Top 5 local organisations work coaches had recommended to customers at follow-up, LCW/WRAG
| Organisation | Percentage |
|---|---|
| Mental health community groups or charities | 36% |
| Organisations offering support with essentials | 20% |
| Local hobby groups or classes | 20% |
| Organisations offering financial or debt support | 19% |
| Physical health support services | 18% |
For pre-WCA customers, there was significant evidence that AWCS had a positive impact on whether customers were referred to health and work support programmes, and whether they took them up. Around a third (34%) of pre-WCA AWCS customers reported being referred to support programmes by their work coach, compared with 25% of their non-AWCS customer counterparts (9pp diff, p-value 0.002). Furthermore, around a quarter (23%) of pre-WCA AWCS customers reported taking up programmes they had been referred to by their work coach, compared with 18% of their non-AWCS customer counterparts (5pp diff, p-value 0.039). However, there was no evidence that AWCS had an impact on referrals for LCW/WRAG customers.
Contextual findings
The proportion of pre-WCA and LCW/WRAG customers at follow-up who reported their work coach had referred them to other support programmes was quite low overall.
For pre-WCA customers, the most common programme customers reported their work coach had referred them to at follow-up was Restart (12%), closely followed by a Work and Health Programme (7%).
On the other hand, for LCW/WRAG customers, the most common programme customers reported their work coach had referred them to at follow-up was a Work and Health Programme (10%), closely followed by Restart (7%).
Take up of support programmes was low among AWCS customers. Around 1 in 7 (15%) of pre-WCA customers took up a programme, while a similar proportion (14%) of LCW/WRAG customers took up a programme. This was substantiated by earlier qualitative findings, which found that most customers were not receiving any formal employment outside of Jobcentre Plus, with many relying on informal support from friends and family.
Figure 6.5: Top 5 programmes work coaches had referred customers to at follow-up, pre-WCA
| Programme | Percentage |
|---|---|
| Restart | 12% |
| Work and Health Programme | 7% |
| Local Supported Employment (LSE) or Intensive Personalised Employment Support (IPES) – if available | 5% |
| Individual Placement and Support | 4% |
| Sector-based Work Academy Programme (SWAPs) | 2% |
Figure 6.6: Top 5 programmes work coaches had referred customers to at follow-up, LCW/WRAG
| Programme | Percentage |
|---|---|
| Work and Health Programme | 10% |
| Restart | 7% |
| Local Supported Employment (LSE) or Intensive Personalised Employment Support (IPES) – if available | 6% |
| Individual Placement and Support | 4% |
| Sector-based Work Academy Programme (SWAPs) | 3% |
Contextual findings
AWCS customers reported that health was a barrier to taking up referrals to programmes their work coach had referred them to.
Of pre-WCA AWCS customers that did not take up programmes once referred by their work coach, the most common reason for this was physical health barriers (24%), closely followed by mental health barriers (17%).
Of LCW/WRAG AWCS customers that did not take up programmes once referred by their work coach, the most common reason for this was that it did not suit their circumstances or it was not of interest (23%), closely followed by physical health barriers (18%).
Earlier qualitative findings found that customers often felt that referrals by work coaches were generic and unhelpful, which may explain the low take up further.
Figure 6.7: Top 5 barriers to taking up programmes referred to by a work coach at follow-up, pre-WCA
| Reason for not taking up programme | Percentage |
|---|---|
| Physical health barriers | 24% |
| Mental health barriers | 17% |
| It did not suit my circumstances / I was not interested | 10% |
| I was unable to attend due to location / dates / caring responsibilities / lack of skills | 10% |
| It was not offered to me / No follow up after initial offer | 9% |
Figure 6.8: Top 5 barriers to taking up programmes referred to by a work coach at follow-up, LCW/WRAG
| Reason for not taking up programme | Percentage |
|---|---|
| It did not suit my circumstances / I was not interested | 23% |
| Physical health barriers | 18% |
| It was not offered to me / No follow up after initial offer | 17% |
| Mental health barriers | 16% |
| I was unable to attend due to location / dates / caring responsibilities / lack of skills | 11% |
Follow-up: G5b. Please can you explain why have you decided not to take part in the programme that your work coach referred you to? (OPEN TEXT RESPONSE). Base: All who were referred to a programme by their work coach but did not take part: LCW/ WRAG (n=86).
7. Impact of AWCS on customer wellbeing
This chapter reports the impacts of AWCS on customers’ levels of wellbeing at follow up as well as looking at specific measures like life satisfaction, life worthwhile, happiness, and anxiety.
Summary of impact on customer wellbeing
- Overall, there was very little significant evidence that AWCS had an impact on customers’ level of wellbeing.
- There was no evidence that AWCS had a significant impact on customers’ life satisfaction score, their life worthwhile score, their happiness score or their anxiety score.
- However, there was some evidence that AWCS had a positive impact on AWCS customers’ wellbeing as defined by the Short Warwick Edinburgh Mental Wellbeing Scale (SWEMWBS). This was also influenced by length of time on benefits and health needs.
Impact on wellbeing measures
Table 7.1 shows two standardised measures to look at the impact of AWCS on customers’ wellbeing:
- ONS has four standard wellbeing measures, covering life satisfaction, the extent to which someone feels their life is worthwhile, happiness and anxiety. For each measure, individuals score themselves on an 11-point scale from 0 (not at all) to 10 (completely). For all except the anxiety measure, a higher score is better, with the reverse true for anxiety. Both the mean scores and the ONS standard categorisation of the measures into low, medium, high and very high (for anxiety very low, low, medium and high) are included in Table 7.1
- The Short Warwick Edinburgh Mental Wellbeing Scale (SWEMWBS): this is a 7-item scale focusing on mental and emotional wellbeing and psychological functioning. With each item scored on a 5-point scale from ‘all of the time’ to ‘none of the time’, the overall scale runs from 7 to 35, with a higher score representing higher wellbeing.
As with each table in this chapter, the first two columns show the findings for pre-WCA and LCW/WRAG customers combined (referred to as “AWCS customers”), comparing those in receipt of AWCS and their matched comparison group, with subsequent columns looking firstly at pre-WCA customers and then LCW/WRAG customers, each time split by AWCS and matched comparators.
Table 7.1: Impacts of AWCS on wellbeing
All Pre-WCA/LCW/WRAG customers: ONS satisfaction
| Treat’t % | Comp’n % | Pp/mean diff | p-value | |
|---|---|---|---|---|
| Mean score (SD), 0 to 10, higher score better | 4.82(2.61) | 4.66(2.65) | 0.16 | 0.120 |
| Categories | % | % | [No data] | 0.372 |
| Low (0 to 4) | 42 | 45 | -2 | [No data] |
| Medium (5 or 6) | 31 | 31 | 0 | [No data] |
| High (7 or 8) | 18 | 16 | 2 | [No data] |
| Very high (9 or 10) | 9 | 8 | 1 | [No data] |
All Pre-WCA/LCW/WRAG customers: ONS life worthwhile
| Treat’t % | Comp’n % | Pp/mean diff | p-value | |
|---|---|---|---|---|
| Mean score (SD), 0 to 10, higher score better | 5.06(2.72) | 5.02(2.76) | 0.04 | 0.700 |
| Categories | % | % | [No data] | 0.928 |
| Low (0 to 4) | 40 | 40 | 0 | [No data] |
| Medium (5 or 6) | 30 | 29 | 1 | [No data] |
| High (7 or 8) | 19 | 20 | -1 | [No data] |
| Very high (9 or 10) | 11 | 11 | 0 | [No data] |
All Pre-WCA/LCW/WRAG customers: ONS happiness
| Treat’t % | Comp’n % | Pp/mean diff | p-value | |
|---|---|---|---|---|
| Mean score (SD), 0 to 10, higher score better | 4.75(2.85) | 4.72(2.91) | 0.03 | 0.757 |
| Categories | % | % | [No data] | 0.965 |
| Low (0 to 4) | 46 | 46 | 1 | [No data] |
| Medium (5 or 6) | 25 | 25 | 0 | [No data] |
| High (7 or 8) | 18 | 19 | -1 | [No data] |
| Very high (9 or 10) | 11 | 11 | 0 | [No data] |
All Pre-WCA/LCW/WRAG customers: ONS anxiety level
| Treat’t % | Comp’n % | Pp/mean diff | p-value | |
|---|---|---|---|---|
| Mean score (SD), 0 to 10, lower score better | 5.24(3.04) | 5.14(3.11) | 0.10 | 0.409 |
| Categories | % | % | [No data] | 0.300 |
| Very low (0 or 1) | 15 | 17 | -2 | [No data] |
| Low (2 or 3) | 13 | 13 | 0 | [No data] |
| Medium (4 or 5) | 25 | 22 | 2 | [No data] |
| High (6 to 10) | 47 | 48 | 0 | [No data] |
All Pre-WCA/LCW/WRAG customers: SWEMWBS metric score
| Treat’t % | Comp’n % | Pp/mean diff | p-value | |
|---|---|---|---|---|
| Mean score (SD), 7 to 35, higher score better | 19.17(4.30) | 18.84(4.15) | 0.33 | 0.044* |
| Categories | % | % | [No data] | 0.670 |
| Low wellbeing | 69 | 70 | -2 | [No data] |
| Moderate wellbeing | 26 | 25 | 1 | [No data] |
| High wellbeing | 6 | 5 | 1 | [No data] |
All Pre-WCA/LCW/WRAG customers: unweighted bases
| Treat’t % | Comp’n % | Pp/mean diff | p-value | |
|---|---|---|---|---|
| Unweighted bases: all[footnote 14] | 1923 | 1932 | [No data] | [No data] |
Pre-WCA customers: ONS satisfaction
| Treat’t % | Comp’n % | Pp/mean diff | p-value | |
|---|---|---|---|---|
| Mean score (SD), 0 to 10, higher score better | 4.90(2.67) | 4.73(2.71) | 0.16 | 0.200 |
| Categories | % | % | [No data] | 0.292 |
| Low (0 to 4) | 41 | 44 | -4 | [No data] |
| Medium (5 or 6) | 30 | 30 | 0 | [No data] |
| High (7 or 8) | 19 | 16 | 3 | [No data] |
| Very high (9 or 10) | 10 | 9 | 0 | [No data] |
Pre-WCA customers: ONS life worthwhile
| Treat’t % | Comp’n % | Pp/mean diff | p-value | |
|---|---|---|---|---|
| Mean score (SD), 0 to 10, higher score better | 5.10 (2.77) | 5.09 (2.82) | 0.01 | 0.956 |
| Categories | % | % | [No data] | 0.920 |
| Low (0 to 4) | 39 | 39 | 0 | [No data] |
| Medium (5 or 6) | 29 | 28 | 1 | [No data] |
| High (7 or 8) | 20 | 21 | -1 | [No data] |
| Very high (9 or 10) | 12 | 12 | 0 | [No data] |
Pre-WCA customers: ONS happiness
| Treat’t % | Comp’n % | Pp/mean diff | p-value | |
|---|---|---|---|---|
| Mean score (SD), 0 to 10, higher score better | 4.76 (2.94) | 4.74(2.97) | 0.02 | 0.887 |
| Categories | % | % | [No data] | 0.976 |
| Low (0 to 4) | 46 | 46 | 0 | [No data] |
| Medium (5 or 6) | 23 | 23 | 1 | [No data] |
| High (7 or 8) | 18 | 19 | -1 | [No data] |
| Very high (9 or 10) | 12 | 12 | 0 | [No data] |
Pre-WCA customers: ONS anxiety level
| Treat’t % | Comp’n % | Pp/mean diff | p-value | |
|---|---|---|---|---|
| Mean score (SD), 0 to 10, lower score better | 5.16 (3.10) | 5.05(3.18) | 0.11 | 0.454 |
| Categories | % | % | [No data] | 0.165 |
| Very low (0 or 1) | 17 | 19 | -3 | [No data] |
| Low (2 or 3) | 13 | 13 | 0 | [No data] |
| Medium (4 or 5) | 24 | 20 | 4 | [No data] |
| High (6 to 10) | 46 | 47 | -1 | [No data] |
Pre-WCA customers: SWEMWBS metric score
| Treat’t % | Comp’n % | Pp/mean diff | p-value | |
|---|---|---|---|---|
| Mean score (SD), 7 to 35, higher score better | 19.34(4.46) | 18.96(4.31) | 0.37 | 0.068 |
| Categories | % | % | [No data] | 0.491 |
| Low wellbeing | 67 | 69 | -3 | [No data] |
| Moderate wellbeing | 27 | 25 | 2 | [No data] |
| High wellbeing | 6 | 6 | 0 | [No data] |
Pre-WCA customers: unweighted bases
| Treat’t % | Comp’n % | Pp/mean diff | p-value | |
|---|---|---|---|---|
| Unweighted bases: all[footnote 14] | 1231 | 1205 | [No data] | [No data] |
LCW/WRAG: ONS satisfaction
| Treat’t % | Comp’n % | Pp/mean diff | p-value | |
|---|---|---|---|---|
| Mean score (SD), 0 to 10, higher score better | 4.58 (2.41) | 4.44 (2.43) | 0.14 | 0.319 |
| Categories | % | % | [No data] | 0.521 |
| Low (0 to 4) | 47 | 46 | 2 | [No data] |
| Medium (5 or 6) | 31 | 34 | -3 | [No data] |
| High (7 or 8) | 16 | 16 | 0 | [No data] |
| Very high (9 or 10) | 6 | 4 | 2 | [No data] |
LCW/WRAG: ONS life worthwhile
| Treat’t % | Comp’n % | Pp/mean diff | p-value | |
|---|---|---|---|---|
| Mean score (SD), 0 to 10, higher score better | 4.95 (2.58) | 4.80 (2.57) | 0.14 | 0.342 |
| Categories | % | % | [No data] | 0.770 |
| Low (0 to 4) | 42 | 42 | 0 | [No data] |
| Medium (5 or 6) | 31 | 32 | -1 | [No data] |
| High (7 or 8) | 18 | 18 | -1 | [No data] |
| Very high (9 or 10) | 9 | 7 | 2 | [No data] |
LCW/WRAG: ONS happiness
| Treat’t % | Comp’n % | Pp/mean diff | p-value | |
|---|---|---|---|---|
| Mean score (SD), 0 to 10, higher score better | 4.72 (2.57) | 4.64 (2.72) | 0.08 | 0.612 |
| Categories | % | % | [No data] | 0.909 |
| Low (0 to 4) | 46 | 44 | 2 | [No data] |
| Medium (5 or 6) | 29 | 30 | -1 | [No data] |
| High (7 or 8) | 16 | 18 | -1 | [No data] |
| Very high (9 or 10) | 8 | 8 | 0 | [No data] |
LCW/WRAG: ONS anxiety level
| Treat’t % | Comp’n % | Pp/mean diff | p-value | |
|---|---|---|---|---|
| Mean score (SD), 0 to 10, lower score better | 5.49 (2.86) | 5.43(2.84) | 0.06 | 0.709 |
| Categories | % | % | [No data] | 0.759 |
| Very low (0 or 1) | 10 | 10 | 0 | [No data] |
| Low (2 or 3) | 15 | 13 | 2 | [No data] |
| Medium (4 or 5) | 26 | 28 | -2 | [No data] |
| High (6 to 10) | 49 | 49 | 1 | [No data] |
LCW/WRAG: SWEMWBS metric score
| Treat’t % | Comp’n % | Pp/mean diff | p-value | |
|---|---|---|---|---|
| Mean score (SD), 7 to 35, higher score better | 18.64(3.69) | 18.46(3.60) | 0.19 | 0.375 |
| Categories | % | % | [No data] | 0.251 |
| Low wellbeing | 76 | 74 | 2 | [No data] |
| Moderate wellbeing | 21 | 25 | -3 | [No data] |
| High wellbeing | 3 | 2 | 1 | [No data] |
LCW/WRAG: unweighted bases
| Treat’t % | Comp’n % | Pp/mean diff | p-value | |
|---|---|---|---|---|
| Unweighted bases: all[footnote 14] | 692 | 727 | [No data] | [No data] |
ONS wellbeing measures
Customers receiving AWCS scored 4.82 for life satisfaction, compared with 4.66 for non-AWCS customers (0.16 mean difference (diff), p-value 0.120); whilst for life being worthwhile, those receiving AWCS scored 5.06, compared with 5.02 for non-AWCS customers (0.04 mean diff, p-value 0.700). For happiness, those receiving AWCS scored 4.75, compared with 4.72 for non-AWCS customers (0.03 mean diff, p-value 0.757); whilst for anxiety those receiving AWCS scored 5.24, compared with 5.14 for non-AWCS customers (0.10 mean diff, p-value 0.409).
SWEMWBS
The only evidence of positive impact was found in the mean of SWEMWBS score. Customers receiving AWCS scored 19.17, compared with 18.84 for non-AWCS customers (0.33 mean diff, p-value 0.044). However, there were no significant differences when looking separately at the pre-WCA and LCW/WRAG customers.
When looking at subgroups, there was evidence for positive impact on SWEMWBS score for some customers:
- Those in receipt of benefits for up to 12 months at AWCS: Combining pre-WCA and LCW/WRAG, customers in this group receiving AWCS had a mean score of 19.32 on the SWEMWBS compared with 18.66 among non-AWCS customers in the same group (0.66 mean diff, p-value 0.042). This was the same among pre-WCA customers of the same subgroup (19.36 AWCS compared with 18.60 non-AWCS, 0.75 mean diff, p-value 0.030).
- Those with a physical health condition: Combining pre-WCA and LCW/WRAG, customers receiving AWCS with a physical health condition had a mean score of 19.09, compared with 18.59 among non-AWCS customers in the same group (0.50 mean diff, p-value 0.022). Similar figures were seen among pre-WCA customers with a physical health condition (19.26 AWCS, compared with 18.68 non-AWCS, 0.58 mean diff, p-value 0.031).
- Those with a neurodivergent condition: Customers with a neurodivergent condition receiving AWCS had a mean score of 18.63 compared with 17.60 among non-AWCS customers in the same group (1.03 mean diff, p-value 0.001). Similar figures were seen among pre-WCA customers with a neurodivergent condition (18.82 AWCS compared to 17.46 non-AWCS, 1.36 mean diff, p-value 0.001).
This suggests there was some positive impact of AWCS on the emotional wellbeing and psychological function of some customers. In the qualitative research, many customers reported improvements to their mental health and wellbeing because of the consistent, empathetic support they received from their work coach. Customers felt that simply speaking to a work coach on a regular basis helped to improve their wellbeing, whilst work coaches signposting customers to other mental health support also helped. In the quantitative survey, however, there was very little significant evidence that AWCS had an impact on customers’ levels of wellbeing, with no significant differences across the ONS wellbeing measures and limited significant differences across the SWEMWBS categories.
8. Conclusions
Additional Work Coach Support (AWCS) delivered additional support to Universal Credit (UC) and Employment and Support Allowance (ESA) health journey customers. Such customers typically struggle with work and health in some capacity due to the nature of their claim.
AWCS was not designed to provide intensive work and/or health support to customers. Furthermore, the evaluation took place during the phase of rolling out AWCS nationally and measured self-reported outcomes roughly 7 to 9 months after customers started receiving support, and so may not capture longer term impacts of the policy. It was also not possible to robustly measure the impact of AWCS on customers in LCWRA/SG health journey groups.
The impact findings and conclusions should be considered with this context in mind.
AWCS was generally delivered as intended, with AWCS customers being broadly satisfied with that delivery. Customers particularly valued the ways in which AWCS was flexible and able to be personalised to them. Most customers saw their work coach at the designed frequency determined for their conditionality group. Not all customers met at the intended frequency, however, with this being most likely for LCW/WRAG customers. The qualitative findings highlighted that customers appreciated being able to find the right rhythm for them with their work coach, suggesting that a varied frequency across customers according to their own needs would be the most beneficial anyway. This is supported by the survey findings, which showed the majority of customers felt the frequency of appointments was ‘about right’.
Customers also valued flexibility in other areas of AWCS, including the mode of appointments, length of appointments and especially in the guidance provided to them by their work coach. The impact analysis identified there had been a positive impact on customers’ feelings that the support from their work coach was tailored to them, indicating work coaches largely succeeded in managing appointments flexibly according to participants’ needs.
Despite these positives there was little evidence to suggest that AWCS had an impact on customers’ employment outcomes, and correspondingly benefits claimed or improvements to overall wellbeing. However, there were some indications that some customers have moved closer to work. There were no significant differences in the proportions of AWCS customers reporting being in-work or claiming benefits at follow-up, compared with non-AWCS customers. This suggests that in the timeframe of the evaluation, AWCS had no additional impact on employment outcomes than traditional methods. With the lack of employment outcomes, it is perhaps not surprising that there was mixed impact on overall wellbeing. That being said, 7 to 9 months is a relatively short timeframe to make changes of this nature, especially for customers facing complex health challenges. There was some measurable impact for some customers, more so in the LCW/WRAG conditionality group, of increased job search activity and participation in volunteering. However, despite these improvements, activity levels remained lower than might be expected for individuals likely to (re)enter employment. So a focus for the future of AWCS could be on how to increase this level of activity further to capitalise on the improvements.
Impacts being only modest may be underpinned by AWCS customers continuing to perceive their health to be a barrier to work, or at least that they would be unlikely to find work where their health would not be a barrier. While there was a positive impact of AWCS on the proportion of customers that felt they could work if they found the right job with the right support, there was little evidence that they felt more ‘ready for work’[footnote 15]. Additionally, although generally there was a positive impact on relationships with work coaches, a notable area where there was no impact was on perceptions that work coaches provided advice relevant to their situation and needs, and where referrals had been made these were relatively rarely taken up by customers. There was no impact on the proportion that felt that work would be beneficial to their health and wellbeing. This builds a picture that suggests that customers have not yet identified the type of employment that would provide the support they would need to allow them to stay in work in a sustainable way, and perhaps find it hard to believe it exists. Again, this could be an area of focus for the future of AWCS.
However, there was evidence that AWCS had a positive impact on how customers perceive their relationship and communication with their work coach, which may be what customers need at this stage in their journey. The impact analysis identified a positive impact on AWCS customers’ relationships with their coach across a range of measures, including feeling able to discuss their challenges in life, that their work coach listens to their needs, and work coach contact. This suggest that AWCS succeeded in producing stronger, deeper and more trusting relationships between customers and work coaches. The qualitative research highlighted that at least some customers recognise that their journey into employment is likely to be a long one, and what they need from their work coach is personalised support which is better identified through building a deep relationship.
Impacts on LCWRA/SG customers have not been possible to identify, so if they are to be an area of focus for this policy, more may need to be done to identify how well AWCS is working for them. Although the evidence collected broadly points to this group having a similar experience to other groups in terms of how the policy was delivered, low base sizes meant the full impact analysis was not possible. So, it would be of interest to further explore the impact of AWCS on these customers, particularly because the support is voluntary for them.
Appendix A: Further information on impact analysis
Table A.1 below shows the outcomes chosen for impact analysis.
Table A.1: Outcomes analysed for sub-group analysis
| Category | Outcome | Analysed for sub-group analysis |
|---|---|---|
| Employment and job search outcomes | Having done any work since baseline | No |
| Employment and job search outcomes | In paid work at follow-up (of any hours) | Yes |
| Employment and job search outcomes | Being in paid work (broken down by full or part-time hours) | No |
| Employment and job search outcomes | Being economically active | No |
| Employment and job search outcomes | Being in paid work, unemployed but looking for work, or not economically active | No |
| Employment and job search outcomes | Any benefit | No |
| Employment and job search outcomes | Any employment-related or means tested benefit | No |
| Employment and job search outcomes | Any non-means tested disability benefit | No |
| Employment and job search outcomes | In receipt of Universal Credit (UC) | No |
| Employment and job search outcomes | In receipt of Personal Independence Payment (PIP) | No |
| Employment and job search outcomes | Customers’ mean score on the JSSE | No |
| Employment and job search outcomes | Percentage of customers who had done any training since baseline | No |
| Employment and job search outcomes | Percentage of customers who had done any volunteering since baseline | No |
| Employment and job search outcomes | Customers’ mean score on the FIOH | Yes |
| Employment and job search outcomes | Percentage of customers applying for one or more job vacancies in the two weeks before follow-up | No |
| Employment and job search outcomes | Percentage of customers submitting one or more CVs in the two weeks before follow-up | No |
| Employment and job search outcomes | Hours of job search in the week before follow-up | No |
| Perceived distance from work | Customers’ attitudes towards work | Yes |
| Perceived distance from work | Customers’ perceived barriers to work | No |
| Perceived distance from work | Customers’ confidence looking for work in the future | No |
| Work coach relationship and the support received | Customers’ satisfaction with support received | No |
| Work coach relationship and the support received | Customers’ views on their relationship with their work coach | Yes |
| Work coach relationship and the support received | Support work coach has recommended | No |
| Work coach relationship and the support received | Support work coach has referred to | No |
| Work coach relationship and the support received | Support from other individuals, organisations or groups | No |
| Wellbeing | Short Warwick Edinburgh Mental Wellbeing Scale (SWEMWBS) | Yes |
| Wellbeing | ||
| Wellbeing | ONS wellbeing scale | No |
Sub-group analysis
The sub-group analysis used two tests:
- Test 1: Whether, within a demographic subgroup, there is a significant difference between customers receiving AWCS against those in the matched comparison group of non-AWCS customers.
- Test 2: Whether there are differential impacts across the demographic subgroups which suggest that AWCS works significantly better or worse for customers in different demographic subgroups. This has been tested using regression models which include each sub-group in turn as a predictor, as well as group status and an interaction term between the sub-group and group status. If the interaction term is significantly different to zero this would be evidence of differential impacts across the subgroups.
Both tests add to the evidence base, with advantages and shortcomings to each. While Test 1 provides evidence of whether, within a particular subgroup, there is a significant impact of AWCS, the results are affected by the sample size of each subgroup, with significant impacts being much more easily detectable within the larger subgroups. That is, the fact that there is a significant impact for one subgroup and not another may often be down to their relative sample sizes.
Moreover, Test 1 simply provides impact estimates for each subgroup and does not provide a test of whether, within a demographic, the impact for one subgroup is significantly different to the impact for another subgroup. This test of differences in impacts is provided by Test 2. However, given the relatively small sample sizes per sub-group, the differences in impact would have to be very large to reach statistical significance. As a result, the subgroup findings require careful interpretation, and it is important to look at both sets of tests in combination.
Impact analysis considerations
Within a QED design, the non-AWCS customer group needs to have the same set of pre-intervention characteristics as AWCS customers for an unbiased estimation of impact. If this is the case, any difference between outcomes for AWCS customers and the non-AWCS customer group can reasonably be attributed to the intervention. If this is not the case, any differences might be in part due to the intervention, but might also be in part due to the underlying differences between the two groups.
Within the AWCS evaluation, there were two challenges to achieving unbiased estimates of impact. Firstly, there was an expectation that AWCS customers would be different in their pre-AWCS profile to non-AWCS customers. There were two key reasons for this: work coaches had some degree of autonomy about the customers given AWCS based on their characteristics and situations; and work coaches were advised to exclude certain customers from receiving AWCS (for example, those expected to find work in the near future).
Secondly, while the impact analysis requires measures of customers’ situations just prior to the start of AWCS (and equivalent start point for non-AWCS customers), the design of the evaluation meant that the baseline survey was conducted 2 to 3 months later than this. This meant the survey collected some information retrospectively, which may have affected respondent recall.
Steps were taken at the design stage to mitigate both of these challenges. The baseline survey was designed to include a rich set of pre-AWCS variables on which to match non-AWCS customers to AWCS customers. These included not only variables which might be expected to be correlated with their outcomes, but also designed to mirror the characteristics or situations that work coaches might use to decide whether or not a customer should receive AWCS.
These steps provide reasonable confidence that the group of non-AWCS customers provides a good measure of the counterfactual for AWCS customers. As such, it can be assumed that the group of non-AWCS customers provides a good measure of what would have happened to AWCS customers in the absence of AWCS. Appendix C describes the tests carried out which support this conclusion.
However, it is possible that some unobservable differences remain that might have affected outcomes. In particular, the need to ask retrospective pre-AWCS questions in the baseline survey meant that the questions were restricted to more objective questions which could be answered 2 to 3 months later. This meant that, rather than asking questions around wellbeing or job search self-efficacy, the questions focused on mental health conditions and job search activity at baseline.
Full details on the matching variables and the generation of the matched comparison samples can be found in Appendix C.
Appendix B: Impact tables for sub-group analysis
1. Length of time out of work
Table 1.1: Length of time out of work, all pre-WCA/LCW/WRAG customers
In work or out of work for less than a year
| Treat’t | Comp’n | Pp/mean diff | p-value | |
|---|---|---|---|---|
| % currently in paid work | 35 | 34 | 1 | 0.692 |
| Bases: all | 781 | 738 | ||
| Mean score (SD), Job-Search behaviour (FIOH), score 1 to 4, higher score better | 1.46 (0.63) | 1.36 (0.56) | 0.10 | 0.008* |
| Bases: all not working 30+ hours a week | 701 | 643 | [No data] | [No data] |
| % in work or could return to work now if right job/support | 50 | 43 | 7 | 0.033* |
| Bases: all | 781 | 738 | [No data] | [No data] |
| % agree that: Have good relationship with work coach | 83 | 78 | 4 | 0.180 |
| Bases: all those recalling seeing a work coach | 532 | 355 | [No data] | [No data] |
| SWEMWBS metric mean score (SD), 7 to 35, higher score better | 19.45 (4.33) | 19.10 (4.01) | 0.36 | 0.173 |
| Bases: all | 777 | 735 | [No data] | [No data] |
Out of work for at least a year
| Treat’t | Comp’n | Pp/mean diff | p-value | |
|---|---|---|---|---|
| % currently in paid work | 5 | 4 | 0 | 0.781 |
| Bases: all | 1110 | 1151 | [No data] | [No data] |
| Mean score (SD), Job-Search behaviour (FIOH), score 1 to 4, higher score better | 1.35 (0.55) | 1.33 (0.57) | 0.02 | 0.617 |
| Bases: all not working 30+ hours a week | 1074 | 1115 | [No data] | [No data] |
| % in work or could return to work now if right job/support | 21 | 20 | 1 | 0.591 |
| Bases: all | 1110 | 1151 | [No data] | [No data] |
| % agree that: Have good relationship with work coach | 81 | 76 | 6 | 0.037* |
| Bases: all those recalling seeing a work coach | 822 | 559 | [No data] | [No data] |
| SWEMWBS metric mean score (SD), 7 to 35, higher score better | 18.98 (4.27) | 18.65 (4.10) | 0.34 | 0.144 |
| Bases: all | 1104 | 1142 | [No data] | [No data] |
P-value for interaction
| P-value for interaction | |
|---|---|
| % currently in paid work | 0.956 |
| Bases: all | [No data] |
| Mean score (SD), Job-Search behaviour (FIOH), score 1 to 4, higher score better | 0.084 |
| Bases: all not working 30+ hours a week | [No data] |
| % in work or could return to work now if right job/support | 0.295 |
| Bases: all | [No data] |
| % agree that: Have good relationship with work coach | 0.818 |
| Bases: all those recalling seeing a work coach | [No data] |
| SWEMWBS metric mean score (SD), 7 to 35, higher score better | 0.954 |
| Bases: all | [No data] |
Table 1.2: Length of time out of work, pre-WCA customers
In work or out of work for less than a year
| Treat’t | Comp’n | Pp/mean diff | p-value | |
|---|---|---|---|---|
| % currently in paid work | 35 | 31 | 4 | 0.262 |
| Bases: all | 623 | 585 | [No data] | [No data] |
| Mean score (SD), Job-Search behaviour (FIOH), score 1 to 4, higher score better | 1.45(0.63) | 1.36(0.57) | 0.10 | 0.025* |
| Bases: all not working 30+ hours a week | 557 | 516 | [No data] | [No data] |
| % in work or could return to work now if right job/support | 49 | 40 | 8 | 0.015* |
| Bases: all | 623 | 585 | [No data] | [No data] |
| % agree that: Have good relationship with work coach | 83 | 79 | 4 | 0.300 |
| Bases: all those recalling seeing a work coach | 407 | 271 | [No data] | [No data] |
| SWEMWBS metric mean score (SD), 7 to 35, higher score better | 19.50(4.39) | 19.13(4.11) | 0.36 | 0.212 |
| Bases: all | 621 | 584 | [No data] | [No data] |
Out of work for at least a year
| Treat’t | Comp’n | Pp/mean diff | p-value | |
|---|---|---|---|---|
| % currently in paid work | 5 | 4 | 0 | 0.759 |
| Bases: all | 584 | 595 | [No data] | [No data] |
| Mean score (SD), Job-Search behaviour (FIOH), score 1 to 4, higher score better | 1.35(0.58) | 1.35(0.60) | -0.01 | 0.891 |
| Bases: all not working 30+ hours a week | 567 | 572 | [No data] | [No data] |
| % in work or could return to work now if right job/support | 21 | 20 | 0 | 0.902 |
| Bases: all | 584 | 595 | [No data] | [No data] |
| % agree that: Have good relationship with work coach | 81 | 75 | 6 | 0.099 |
| Bases: all those recalling seeing a work coach | 373 | 229 | [No data] | [No data] |
| SWEMWBS metric mean score (SD), 7 to 35, higher score better | 19.22(4.55) | 18.81(4.34) | 0.41 | 0.208 |
| Bases: all | 583 | 588 | [No data] | [No data] |
P-value for interaction
| P-value for interaction | |
|---|---|
| % currently in paid work | 0.856 |
| Bases: all | [No data] |
| Mean score (SD), Job-Search behaviour (FIOH), score 1 to 4, higher score better | 0.101 |
| Bases: all not working 30+ hours a week | [No data] |
| % in work or could return to work now if right job/support | 0.180 |
| Bases: all | [No data] |
| % agree that: Have good relationship with work coach | 0.661 |
| Bases: all those recalling seeing a work coach | [No data] |
| SWEMWBS metric mean score (SD), 7 to 35, higher score better | 0.913 |
| Bases: all | [No data] |
Table 1.3: Length of time out of work, LCW/WRAG customers
In work or out of work for less than a year
| Treat’t | Comp’n | Pp/mean diff | p-value | |
|---|---|---|---|---|
| % currently in paid work | 40 | 55 | -15 | 0.068 |
| Bases: all | 158 | 153 | [No data] | [No data] |
| Mean score (SD), Job-Search behaviour (FIOH), score 1 to 4, higher score better | 1.54(0.63) | 1.39(0.51) | 0.15 | 0.083 |
| Bases: all not working 30+ hours a week | 144 | 127 | [No data] | [No data] |
| % in work or could return to work now if right job/support | 58 | 62 | -4 | 0.644 |
| Bases: all | 158 | 153 | [No data] | [No data] |
| % agree that: Have good relationship with work coach | 81 | 72 | 9 | 0.198 |
| Bases: all those recalling seeing a work coach | 125 | 84 | [No data] | [No data] |
| SWEMWBS metric mean score (SD), 7 to 35, higher score better | 19.17(3.89) | 18.84(3.28) | 0.33 | 0.546 |
| Bases: all | 156 | 151 | [No data] | [No data] |
Out of work for at least a year
| Treat’t | Comp’n | Pp/mean diff | p-value | |
|---|---|---|---|---|
| % currently in paid work | 5 | 5 | 0 | 0.987 |
| Bases: all | 526 | 556 | [No data] | [No data] |
| Mean score (SD), Job-Search behaviour (FIOH), score 1 to 4, higher score better | 1.34(0.49) | 1.28(0.48) | 0.06 | 0.088 |
| Bases: all not working 30+ hours a week | 507 | 543 | [No data] | [No data] |
| % in work or could return to work now if right job/support | 22 | 19 | 3 | 0.315 |
| Bases: all | 526 | 556 | [No data] | [No data] |
| % agree that: Have good relationship with work coach | 82 | 78 | 4 | 0.181 |
| Bases: all those recalling seeing a work coach | 449 | 330 | [No data] | [No data] |
| SWEMWBS metric mean score (SD), 7 to 35, higher score better | 18.52(3.63) | 18.33(3.56) | 0.19 | 0.415 |
| Bases: all | 521 | 545 | [No data] | [No data] |
P-value for interaction
| P-value for interaction | |
|---|---|
| % currently in paid work | 0.201 |
| Bases: all | [No data] |
| Mean score (SD), Job-Search behaviour (FIOH), score 1 to 4, higher score better | 0.327 |
| Bases: all not working 30+ hours a week | [No data] |
| % in work or could return to work now if right job/support | 0.385 |
| Bases: all | [No data] |
| % agree that: Have good relationship with work coach | 0.561 |
| Bases: all those recalling seeing a work coach | [No data] |
| SWEMWBS metric mean score (SD), 7 to 35, higher score better | 0.819 |
| Bases: all | [No data] |
2. Length of time on benefits
Table 2.1: Length of time on benefits, all pre-WCA/LCW/WRAG customers
Up to 12 months
| Treat’t | Comp’n | Pp/mean diff | p-value | |
|---|---|---|---|---|
| % currently in paid work | 19 | 18 | 1 | 0.711 |
| Bases: all | 846 | 831 | [No data] | [No data] |
| Mean score (SD), Job-Search behaviour (FIOH), score 1 to 4, higher score better | 1.39 (0.58) | 1.35 (0.58) | 0.04 | 0.432 |
| Bases: all not working 30+ hours a week | 780 | 768 | [No data] | [No data] |
| % in work or could return to work now if right job/support | 34 | 29 | 5 | 0.064 |
| Bases: all | 846 | 831 | [No data] | [No data] |
| % agree that: Have good relationship with work coach | 82 | 78 | 4 | 0.243 |
| Bases: all those recalling seeing a work coach | 552 | 322 | [No data] | [No data] |
| SWEMWBS metric mean score (SD), 7 to 35, higher score better | 19.32 (4.41) | 18.66(4.37) | 0.66 | 0.042* |
| Bases: all | 841 | 825 | [No data] | [No data] |
12 months or more
| Treat’t | Comp’n | Pp/mean diff | p-value | |
|---|---|---|---|---|
| % currently in paid work | 17 | 19 | -1 | 0.522 |
| Bases: all | 1077 | 1101 | [No data] | [No data] |
| Mean score (SD), Job-Search behaviour (FIOH), score 1 to 4, higher score better | 1.39 (0.60) | 1.35 (0.58) | 0.05 | 0.134 |
| Bases: all not working 30+ hours a week | 1023 | 1033 | [No data] | [No data] |
| % in work or could return to work now if right job/support | 33 | 32 | 1 | 0.686 |
| Bases: all | 1077 | 1101 | [No data] | [No data] |
| % agree that: Have good relationship with work coach | 82 | 73 | 9 | 0.004* |
| Bases: all those recalling seeing a work coach | 825 | 613 | [No data] | [No data] |
| SWEMWBS metric mean score (SD), 7 to 35, higher score better | 19.05 (4.20) | 18.85 (4.05) | 0.20 | 0.370 |
| Bases: all | 1072 | 1095 | [No data] | [No data] |
P-value for interaction
| P-value for interaction | |
|---|---|
| % currently in paid work | 0.480 |
| Bases: all | [No data] |
| Mean score (SD), Job-Search behaviour (FIOH), score 1 to 4, higher score better | 0.843 |
| Bases: all not working 30+ hours a week | [No data] |
| % in work or could return to work now if right job/support | 0.252 |
| Bases: all | [No data] |
| % agree that: Have good relationship with work coach | 0.467 |
| Bases: all those recalling seeing a work coach | [No data] |
| SWEMWBS metric mean score (SD), 7 to 35, higher score better | 0.242 |
| Bases: all | [No data] |
Table 2.2: Length of time on benefits, pre-WCA customers
Up to 12 months
| Treat’t | Comp’n | Pp/mean diff | p-value | |
|---|---|---|---|---|
| % currently in paid work | 20 | 18 | 2 | 0.463 |
| Bases: all | 730 | 759 | [No data] | [No data] |
| Mean score (SD), Job-Search behaviour (FIOH), score 1 to 4, higher score better | 1.39(0.58) | 1.35(0.58) | 0.04 | 0.392 |
| Bases: all not working 30+ hours a week | 670 | 703 | [No data] | [No data] |
| % in work or could return to work now if right job/support | 34 | 28 | 6 | 0.041* |
| Bases: all | 730 | 759 | [No data] | [No data] |
| % agree that: Have good relationship with work coach | 82 | 78 | 4 | 0.277 |
| Bases: all those recalling seeing a work coach | 456 | 278 | [No data] | [No data] |
| SWEMWBS metric mean score (SD), 7 to # 35, higher score better | 19.36(4.42) | 18.60(4.40) | 0.75 | 0.030* |
| Bases: all | 729 | 753 | [No data] | [No data] |
12 months or more
| Treat’t | Comp’n | Pp/mean diff | p-value | |
|---|---|---|---|---|
| % currently in paid work | 20 | 19 | 1 | 0.739 |
| Bases: all | 501 | 446 | [No data] | [No data] |
| Mean score (SD), Job-Search behaviour (FIOH), score 1 to 4, higher score better | 1.40(0.64) | 1.39(0.63) | 0.01 | 0.845 |
| Bases: all not working 30+ hours a week | 475 | 410 | [No data] | [No data] |
| % in work or could return to work now if right job/support | 35 | 34 | 2 | 0.625 |
| Bases: all | 501 | 446 | [No data] | [No data] |
| % agree that: Have good relationship with work coach | 82 | 74 | 8 | 0.067 |
| Bases: all those recalling seeing a work coach | 340 | 232 | [No data] | [No data] |
| SWEMWBS metric mean score (SD), 7 to # 35, higher score better | 19.32(4.51) | 19.21(4.30) | 0.11 | 0.743 |
| Bases: all | 499 | 444 | [No data] | [No data] |
P-value for interaction
| P-value for interaction | |
|---|---|
| % currently in paid work | 0.812 |
| Bases: all | [No data] |
| Mean score (SD), Job-Search behaviour (FIOH), score 1 to 4, higher score better | 0.628 |
| Bases: all not working 30+ hours a week | [No data] |
| % in work or could return to work now if right job/support | 0.308 |
| Bases: all | [No data] |
| % agree that: Have good relationship with work coach | 0.574 |
| Bases: all those recalling seeing a work coach | [No data] |
| SWEMWBS metric mean score (SD), 7 to # 35, higher score better | 0.172 |
| Bases: all | [No data] |
Table 2.3: Length of time on benefits, LCW/WRAG customers
Up to 12 months
| Treat’t | Comp’n | Pp/mean diff | p-value | |
|---|---|---|---|---|
| % currently in paid work | 13 | 24 | -11 | 0.121 |
| Bases: all | 116 | 72 | [No data] | [No data] |
| Mean score (SD), Job-Search behaviour (FIOH), score 1 to 4, higher score better | 1.41(0.59) | 1.45(0.55) | -0.04 | 0.706 |
| Bases: all not working 30+ hours a week | 110 | 65 | [No data] | [No data] |
| % in work or could return to work now if right job/support | 33 | 37 | -4 | 0.567 |
| Bases: all | 116 | 72 | [No data] | [No data] |
| % agree that: Have good relationship with work coach | 86 | 84 | 3 | 0.786 |
| Bases: all those recalling seeing a work coach | 96 | 44 | [No data] | [No data] |
| SWEMWBS metric mean score (SD), 7 to 35, higher score better | 18.83(4.32) | 19.28(4.01) | -0.45 | 0.495 |
| Bases: all | 112 | 72 | [No data] | [No data] |
12 months or more
| Treat’t | Comp’n | Pp/mean diff | p-value | |
|---|---|---|---|---|
| % currently in paid work | 13 | 18 | -5 | 0.064 |
| Bases: all | 576 | 655 | [No data] | [No data] |
| Mean score (SD), Job-Search behaviour (FIOH), score 1 to 4, higher score better | 1.38(0.52) | 1.27(0.46) | 0.11 | 0.001* |
| Bases: all not working 30+ hours a week | 548 | 623 | [No data] | [No data] |
| % in work or could return to work now if right job/support | 30 | 30 | 0 | 0.968 |
| Bases: all | 576 | 655 | [No data] | [No data] |
| % agree that: Have good relationship with work coach | 81 | 72 | 9 | 0.013* |
| Bases: all those recalling seeing a work coach | 485 | 381 | [No data] | [No data] |
| SWEMWBS metric mean score (SD), 7 to 35, higher score better | 18.61(3.58) | 18.26(3.52) | 0.35 | 0.146 |
| Bases: all | 573 | 651 | [No data] | [No data] |
P-value for interaction
| P-value for interaction | |
|---|---|
| % currently in paid work | 0.554 |
| Bases: all | [No data] |
| Mean score (SD), Job-Search behaviour (FIOH), score 1 to 4, higher score better | 0.161 |
| Bases: all not working 30+ hours a week | [No data] |
| % in work or could return to work now if right job/support | 0.609 |
| Bases: all | [No data] |
| % agree that: Have good relationship with work coach | 0.552 |
| Bases: all those recalling seeing a work coach | [No data] |
| SWEMWBS metric mean score (SD), 7 to 35, higher score better | 0.250 |
| Bases: all | [No data] |
3. Proximity to work at baseline
Table 3.1: Proximity to work at baseline, all pre-WCA/LCW/WRAG customers
Worked ruled out
| Treat’t | Comp’n | Pp/mean diff | p-value | |
|---|---|---|---|---|
| % currently in paid work | 2 | 3 | -1 | 0.471 |
| Bases: all | 250 | 423 | [No data] | [No data] |
| Mean score (SD), Job-Search behaviour (FIOH), score 1 to 4, higher score better | 1.11 (0.27) | 1.07(0.24) | 0.03 | 0.159 |
| Bases: all not working 30+ hours a week | 246 | 414 | [No data] | [No data] |
| % in work or could return to work now if right job/support | 3 | 5 | -2 | 0.269 |
| Bases: all | 250 | 423 | [No data] | [No data] |
| % agree that: Have good relationship with work coach | 80 | 72 | 8 | 0.120 |
| Bases: all recalling seeing a work coach | 160 | 167 | [No data] | [No data] |
| SWEMWBS metric mean score (SD), 7 to 35, higher score better | 18.31 (4.00) | 17.54(3.98) | 0.77 | 0.059 |
| Bases: all | 247 | 418 | [No data] | [No data] |
Work might be possible in future
| Treat’t | Comp’n | Pp/mean diff | p-value | |
|---|---|---|---|---|
| % currently in paid work | 10 | 9 | 2 | 0.370 |
| Bases: all | 932 | 798 | [No data] | [No data] |
| Mean score (SD), Job-Search behaviour (FIOH), score 1 to 4, higher score better | 1.33 (0.53) | 1.28 (0.47) | 0.05 | 0.106 |
| Bases: all not working 30+ hours a week | 902 | 760 | [No data] | [No data] |
| % in work or could return to work now if right job/support | 21 | 18 | 3 | 0.228 |
| Bases: all | 932 | 798 | [No data] | [No data] |
| % agree that: Have good relationship with work coach | 82 | 73 | 9 | 0.019* |
| Bases: all recalling seeing a work coach | 677 | 406 | [No data] | [No data] |
| SWEMWBS metric mean score (SD), 7 to 35, higher score better | 18.58 (3.99) | 18.04 (3.79) | 0.54 | 0.028* |
| Bases: all | 928 | 796 | [No data] | [No data] |
Could work now with right job/support
| Treat’t | Comp’n | Pp/mean diff | p-value | |
|---|---|---|---|---|
| % currently in paid work | 20 | 25 | -5 | 0.345 |
| Bases: all | 248 | 142 | [No data] | [No data] |
| Mean score (SD), Job-Search behaviour (FIOH), score 1 to 4, higher score better | 1.74 (0.63) | 1.69(0.69) | 0.05 | 0.566 |
| Bases: all not working 30+ hours a week | 222 | 126 | [No data] | [No data] |
| % in work or could return to work now if right job/support | 66 | 56 | 9 | 0.097 |
| Bases: all | 248 | 142 | [No data] | [No data] |
| % agree that: Have good relationship with work coach | 82 | 76 | 6 | 0.307 |
| Bases: all recalling seeing a work coach | 204 | 92 | [No data] | [No data] |
| SWEMWBS metric mean score (SD), 7 to 35, higher score better | 19.91 (3.94) | 20.14(4.16) | -0.23 | 0.656 |
| Bases: all | 248 | 140 | [No data] | [No data] |
P-value for interactions
| P-value for interactions | |
|---|---|
| % currently in paid work | 0.322 |
| Bases: all | [No data] |
| Mean score (SD), Job-Search behaviour (FIOH), score 1 to 4, higher score better | 0.919 |
| Bases: all not working 30+ hours a week | [No data] |
| % in work or could return to work now if right job/support | 0.225 |
| Bases: all | [No data] |
| % agree that: Have good relationship with work coach | 0.902 |
| Bases: all recalling seeing a work coach | [No data] |
| SWEMWBS metric mean score (SD), 7 to 35, higher score better | 0.291 |
| Bases: all | [No data] |
Table 3.2: Proximity to work at baseline, pre-WCA customers[footnote 16]
Worked ruled out
| Treat’t | Comp’n | Pp/mean diff | p-value | |
|---|---|---|---|---|
| % currently in paid work | 3 | 3 | 0 | 0.969 |
| Bases: all | 156 | 249 | [No data] | [No data] |
| Mean score (SD), Job-Search behaviour (FIOH), score 1 to 4, higher score better | 1.10(0.26) | 1.06(0.23) | 0.04 | 0.146 |
| Bases: all not working 30+ hours a week | 155 | 243 | [No data] | [No data] |
| % in work or could return to work now if right job/support | 3 | 5 | -2 | 0.494 |
| Bases: all | 156 | 249 | [No data] | [No data] |
| % agree that: Have good relationship with work coach | 83 | 73 | 10 | 0.167 |
| Bases: all recalling seeing a work coach | 89 | 71 | [No data] | [No data] |
| SWEMWBS metric mean score (SD), 7 to 35, higher score better | 18.47(3.98) | 17.35(3.87) | 1.12 | 0.029* |
| Bases: all | 155 | 245 | [No data] | [No data] |
Work might be possible in future
| Treat’t | Comp’n | Pp/mean diff | p-value | |
|---|---|---|---|---|
| % currently in paid work | 12 | 9 | 3 | 0.151 |
| Bases: all | 566 | 468 | [No data] | [No data] |
| Mean score (SD), Job-Search behaviour (FIOH), score 1 to 4, higher score better | 1.34(0.56) | 1.28(0.49) | 0.06 | 0.144 |
| Bases: all not working 30+ hours a week | 544 | 438 | [No data] | [No data] |
| % in work or could return to work now if right job/support | 23 | 18 | 5 | 0.088 |
| Bases: all | 566 | 468 | [No data] | [No data] |
| % agree that: Have good relationship with work coach | 82 | 71 | 11 | 0.039* |
| Bases: all recalling seeing a work coach | 365 | 208 | [No data] | [No data] |
| SWEMWBS metric mean score (SD), 7 to 35, higher score better | 18.70(4.19) | 17.94(3.98) | 0.77 | 0.016* |
| Bases: all | 565 | 466 | [No data] | [No data] |
Could work now with right job/support
| Treat’t | Comp’n | Pp/mean diff | p-value | |
|---|---|---|---|---|
| % currently in paid work | 20 | 23 | -3 | 0.645 |
| Bases: all | 136 | 78 | [No data] | [No data] |
| Mean score (SD), Job-Search behaviour (FIOH), score 1 to 4, higher score better | 1.75(0.65) | 1.72(0.71) | 0.02 | 0.840 |
| Bases: all not working 30+ hours a week | 121 | 69 | [No data] | [No data] |
| % in work or could return to work now if right job/support | 65 | 54 | 11 | 0.131 |
| Bases: all | 136 | 78 | [No data] | [No data] |
| % agree that: Have good relationship with work coach | 84 | 78 | 6 | 0.398 |
| Bases: all recalling seeing a work coach | 103 | 47 | [No data] | [No data] |
| SWEMWBS metric mean score (SD), 7 to 35, higher score better | 20.05(4.12) | 20.61(4.58) | -0.56 | 0.424 |
| Bases: all | 136 | 77 | [No data] | [No data] |
P-value for interaction
| P-value for interaction | |
|---|---|
| % currently in paid work | 0.492 |
| Bases: all | [No data] |
| Mean score (SD), Job-Search behaviour (FIOH), score 1 to 4, higher score better | 0.933 |
| Bases: all not working 30+ hours a week | [No data] |
| % in work or could return to work now if right job/support | 0.418 |
| Bases: all | [No data] |
| % agree that: Have good relationship with work coach | 0.932 |
| Bases: all recalling seeing a work coach | [No data] |
| SWEMWBS metric mean score (SD), 7 to 35, higher score better | 0.139 |
| Bases: all | [No data] |
Table 3.3: Proximity to work at baseline, LCW/WRAG customers[footnote 17]
Worked ruled out
| Treat’t | Comp’n | Pp/mean diff | p-value | |
|---|---|---|---|---|
| % currently in paid work | 0 | 3 | -3 | 0.145 |
| Bases: all | 94 | 174 | [No data] | [No data] |
| Mean score (SD), Job-Search behaviour (FIOH), score 1 to 4, higher score better | 1.12(0.30) | 1.10(0.28) | 0.02 | 0.706 |
| Bases: all not working 30+ hours a week | 91 | 171 | [No data] | [No data] |
| % in work or could return to work now if right job/support | 2 | 5 | -3 | 0.186 |
| Bases: all | 94 | 174 | [No data] | [No data] |
| % agree that: Have good relationship with work coach | 76 | 69 | 7 | 0.386 |
| Bases: all recalling seeing a work coach | 71 | 96 | [No data] | [No data] |
| SWEMWBS metric mean score (SD), 7 to 35, higher score better | 17.82(4.05) | 18.02(4.24) | -0.20 | 0.713 |
| Bases: all | 92 | 173 | [No data] | [No data] |
Work might be possible in future
| Treat’t | Comp’n | Pp/mean diff | p-value | |
|---|---|---|---|---|
| % currently in paid work | 6 | 9 | -3 | 0.294 |
| Bases: all | 366 | 330 | [No data] | [No data] |
| Mean score (SD), Job-Search behaviour (FIOH), score 1 to 4, higher score better | 1.30(0.45) | 1.27(0.43) | 0.03 | 0.465 |
| Bases: all not working 30+ hours a week | 358 | 322 | [No data] | [No data] |
| % in work or could return to work now if right job/support | 17 | 20 | -3 | 0.355 |
| Bases: all | 366 | 330 | [No data] | [No data] |
| % agree that: Have good relationship with work coach | 83 | 78 | 6 | 0.206 |
| Bases: all recalling seeing a work coach | 312 | 198 | [No data] | [No data] |
| SWEMWBS metric mean score (SD), 7 to 35, higher score better | 18.24(3.38) | 18.33(3.17) | -0.09 | 0.731 |
| Bases: all | 363 | 330 | [No data] | [No data] |
Could work now with right job/support
| Treat’t | Comp’n | Pp/mean diff | p-value | |
|---|---|---|---|---|
| % currently in paid work | 21 | 29 | -8 | 0.258 |
| Bases: all | 112 | 64 | [No data] | [No data] |
| Mean score (SD), Job-Search behaviour (FIOH), score 1 to 4, higher score better | 1.73(0.60) | 1.63(0.64) | 0.11 | 0.326 |
| Bases: all not working 30+ hours a week | 101 | 57 | [No data] | [No data] |
| % in work or could return to work now if right job/support | 67 | 62 | 5 | 0.492 |
| Bases: all | 112 | 64 | [No data] | [No data] |
| % agree that: Have good relationship with work coach | 78 | 74 | 4 | 0.574 |
| Bases: all recalling seeing a work coach | 101 | 45 | [No data] | [No data] |
| SWEMWBS metric mean score (SD), 7 to 35, higher score better | 19.63(3.54) | 19.15(2.89) | 0.48 | 0.355 |
| Bases: all | 112 | 63 | [No data] | [No data] |
P-value for interaction
| P-value for interaction | |
|---|---|
| % currently in paid work | 0.627 |
| Bases: all | [No data] |
| Mean score (SD), Job-Search behaviour (FIOH), score 1 to 4, higher score better | 0.738 |
| Bases: all not working 30+ hours a week | [No data] |
| % in work or could return to work now if right job/support | 0.287 |
| Bases: all | [No data] |
| % agree that: Have good relationship with work coach | 0.989 |
| Bases: all recalling seeing a work coach | [No data] |
| SWEMWBS metric mean score (SD), 7 to 35, higher score better | 0.572 |
| Bases: all | [No data] |
4. Age at baseline
Table 4.1: Age at baseline, all pre-WCA/LCW/WRAG customers
16 to 25
| Treat’t | Comp’n | Pp/mean diff | p-value | |
|---|---|---|---|---|
| % currently in paid work | 15 | 17 | -2 | 0.647 |
| Bases: all | 361 | 338 | [No data] | [No data] |
| Mean score (SD), Job-Search behaviour (FIOH), score 1 to 4, higher score better | 1.42 (0.57) | 1.34 (0.55) | 0.07 | 0.185 |
| Bases: all not working 30+ hours a week | 334 | 314 | [No data] | [No data] |
| % in work or could return to work now if right job/support | 34 | 30 | 4 | 0.388 |
| Bases: all | 361 | 338 | [No data] | [No data] |
| % agree that: Have good relationship with work coach | 80 | 76 | 3 | 0.483 |
| Bases: all recalling seeing a work coach | 267 | 154 | [No data] | [No data] |
| SWEMWBS metric mean score (SD), 7 to 35, higher score better | 19.27 (3.48) | 18.79 (3.74) | 0.48 | 0.228 |
| Bases: all | 361 | 334 | [No data] | [No data] |
26 to 35
| Treat’t | Comp’n | Pp/mean diff | p-value | |
|---|---|---|---|---|
| % currently in paid work | 20 | 17 | 3 | 0.442 |
| Bases: all | 377 | 363 | [No data] | [No data] |
| Mean score (SD), Job-Search behaviour (FIOH), score 1 to 4, higher score better | 1.40 (0.58) | 1.36 (0.60) | 0.03 | 0.630 |
| Bases: all not working 30+ hours a week | 351 | 330 | [No data] | [No data] |
| % in work or could return to work now if right job/support | 36 | 31 | 4 | 0.390 |
| Bases: all | 377 | 363 | [No data] | [No data] |
| % agree that: Have good relationship with work coach | 83 | 73 | 10 | 0.024* |
| Bases: all recalling seeing a work coach | 293 | 196 | [No data] | [No data] |
| SWEMWBS metric mean score (SD), 7 to 35, higher score better | 19.20 (4.38) | 18.15 (3.94) | 1.04 | 0.054 |
| Bases: all | 374 | 360 | [No data] | [No data] |
36 to 45
| Treat’t | Comp’n | Pp/mean diff | p-value | |
|---|---|---|---|---|
| % currently in paid work | 15 | 17 | -2 | 0.647 |
| Bases: all | 361 | 338 | [No data] | [No data] |
| Mean score (SD), Job-Search behaviour (FIOH), score 1 to 4, higher score better | 1.42 (0.57) | 1.34 (0.55) | 0.07 | 0.185 |
| Bases: all not working 30+ hours a week | 334 | 314 | [No data] | [No data] |
| % in work or could return to work now if right job/support | 34 | 30 | 4 | 0.388 |
| Bases: all | 361 | 338 | [No data] | [No data] |
| % agree that: Have good relationship with work coach | 80 | 76 | 3 | 0.483 |
| Bases: all recalling seeing a work coach | 267 | 154 | [No data] | [No data] |
| SWEMWBS metric mean score (SD), 7 to 35, higher score better | 19.27 (3.48) | 18.79 (3.74) | 0.48 | 0.228 |
| Bases: all | 361 | 334 | [No data] | [No data] |
46 to 55
| Treat’t | Comp’n | Pp/mean diff | p-value | |
|---|---|---|---|---|
| % currently in paid work | 19 | 18 | 1 | 0.777 |
| Bases: all | 415 | 412 | [No data] | [No data] |
| Mean score (SD), Job-Search behaviour (FIOH), score 1 to 4, higher score better | 1.39 (0.58) | 1.34 (0.61) | 0.05 | 0.393 |
| Bases: all not working 30+ hours a week | 394 | 391 | [No data] | [No data] |
| % in work or could return to work now if right job/support | 34 | 28 | 6 | 0.174 |
| Bases: all | 415 | 412 | [No data] | [No data] |
| % agree that: Have good relationship with work coach | 82 | 76 | 6 | 0.179 |
| Bases: all those recalling seeing a work coach | 290 | 197 | [No data] | [No data] |
| SWEMWBS metric mean score (SD), 7 to 35, higher score better | 19.10 (4.28) | 18.85 (4.67) | 0.24 | 0.556 |
| Bases: all | 410 | 411 | [No data] | [No data] |
56 to 65
| Treat’t | Comp’n | Pp/mean diff | p-value | |
|---|---|---|---|---|
| % currently in paid work | 15 | 15 | 0 | 0.994 |
| Bases: all | 375 | 392 | [No data] | [No data] |
| Mean score (SD), Job-Search behaviour (FIOH), score 1 to 4, higher score better | 1.28 (0.54) | 1.22 (0.51) | 0.07 | 0.189 |
| Bases: all not working 30+ hours a week | 359 | 370 | [No data] | [No data] |
| % in work or could return to work now if right job/support | 27 | 24 | 3 | 0.506 |
| Bases: all | 375 | 392 | [No data] | [No data] |
| % agree that: Have good relationship with work coach | 82 | 81 | 1 | 0.879 |
| Bases: all those recalling seeing a work coach | 240 | 172 | [No data] | [No data] |
| SWEMWBS metric mean score (SD), 7 to 35, higher score better | 19.68 (4.41) | 19.42 (4.43) | 0.26 | 0.539 |
| Bases: all | 374 | 389 | [No data] | [No data] |
P-value for interaction
| P-value for interaction | |
|---|---|
| % currently in paid work | 0.942 |
| Bases: all | [No data] |
| Mean score (SD), Job-Search behaviour (FIOH), score 1 to 4, higher score better | 0.991 |
| Bases: all not working 30+ hours a week | [No data] |
| % in work or could return to work now if right job/support | 0.997 |
| Bases: all | [No data] |
| % agree that: Have good relationship with work coach | 0.641 |
| Bases: all those recalling seeing a work coach | [No data] |
| SWEMWBS metric mean score (SD), 7 to 35, higher score better | 0.765 |
| Bases: all | [No data] |
Table 4.2: Age at baseline, pre-WCA customers
16 to 25
| Treat’t | Comp’n | Pp/mean diff | p-value | |
|---|---|---|---|---|
| % currently in paid work | 14 | 18 | -3 | 0.504 |
| Bases: all | 250 | 214 | [No data] | [No data] |
| Mean score (SD), Job-Search behaviour (FIOH), score 1 to 4, higher score better | 1.40(0.56) | 1.33(0.54) | 0.07 | 0.280 |
| Bases: all not working 30+ hours a week | 232 | 201 | [No data] | [No data] |
| % in work or could return to work now if right job/support | 31 | 28 | 2 | 0.687 |
| Bases: all | 250 | 214 | [No data] | v |
| % agree that: Have good relationship with work coach | 81 | 78 | 3 | 0.592 |
| Bases: all recalling seeing a work coach | 170 | 79 | [No data] | v |
| SWEMWBS metric mean score (SD), 7 to 35, higher score better | 19.17(3.44) | 18.72(3.80) | 0.45 | 0.345 |
| Bases: all | 250 | 210 | [No data] | [No data] |
26 to 35
| Treat’t | Comp’n | Pp/mean diff | p-value | |
|---|---|---|---|---|
| % currently in paid work | 24 | 17 | 7 | 0.241 |
| Bases: all | 202 | 205 | [No data] | [No data] |
| Mean score (SD), Job-Search behaviour (FIOH), score 1 to 4, higher score better | 1.41(0.62) | 1.39(0.64) | 0.02 | 0.827 |
| Bases: all not working 30+ hours a week | 185 | 181 | [No data] | [No data] |
| % in work or could return to work now if right job/support | 40 | 33 | 8 | 0.292 |
| Bases: all | 202 | 205 | [No data] | [No data] |
| % agree that: Have good relationship with work coach | 82 | 76 | 6 | 0.292 |
| Bases: all recalling seeing a work coach | 144 | 99 | [No data] | [No data] |
| SWEMWBS metric mean score (SD), 7 to 35, higher score better | 19.36(4.82) | 17.99(4.15) | 1.37 | 0.071 |
| Bases: all | 201 | 203 | [No data] | [No data] |
36 to 45
| Treat’t | Comp’n | Pp/mean diff | p-value | |
|---|---|---|---|---|
| % currently in paid work | 20 | 17 | 3 | 0.537 |
| Bases: all | 251 | 251 | [No data] | [No data] |
| Mean score (SD), Job-Search behaviour (FIOH), score 1 to 4, higher score better | 1.44(0.66) | 1.40(0.61) | 0.05 | 0.679 |
| Bases: all not working 30+ hours a week | 228 | 230 | [No data] | [No data] |
| % in work or could return to work now if right job/support | 35 | 30 | 5 | 0.464 |
| Bases: all | 251 | 251 | [No data] | [No data] |
| % agree that: Have good relationship with work coach | 84 | 72 | 11 | 0.039* |
| Bases: all recalling seeing a work coach | 164 | 119 | [No data] | [No data] |
| SWEMWBS metric mean score (SD), 7 to 35, higher score better | 19.11(4.83) | 18.82(4.11) | 0.29 | 0.658 |
| Bases: all | 251 | 251 | [No data] | [No data] |
46 to 55
| Treat’t | Comp’n | Pp/mean diff | p-value | |
|---|---|---|---|---|
| % currently in paid work | 22 | 22 | 0 | 0.993 |
| Bases: all | 266 | 273 | [No data] | [No data] |
| Mean score (SD), Job-Search behaviour (FIOH), score 1 to 4, higher score better | 1.40(0.61) | 1.36(0.65) | 0.04 | 0.521 |
| Bases: all not working 30+ hours a week | 253 | 255 | [No data] | [No data] |
| % in work or could return to work now if right job/support | 35 | 29 | 6 | 0.216 |
| Bases: all | 266 | 273 | [No data] | [No data] |
| % agree that: Have good relationship with work coach | 82 | 76 | 5 | 0.264 |
| Bases: all those recalling seeing a work coach | 169 | 115 | [No data] | [No data] |
| SWEMWBS metric mean score (SD), 7 to 35, higher score better | 19.35(4.36) | 18.97(4.90) | 0.38 | 0.457 |
| Bases: all | 264 | 273 | [No data] | [No data] |
56 to 65
| Treat’t | Comp’n | Pp/mean diff | p-value | |
|---|---|---|---|---|
| % currently in paid work | 17 | 17 | 0 | 0.993 |
| Bases: all | 262 | 262 | [No data] | [No data] |
| Mean score (SD), Job-Search behaviour (FIOH), score 1 to 4, higher score better | 1.27(0.53) | 1.22(0.53) | 0.04 | 0.486 |
| Bases: all not working 30+ hours a week | 247 | 246 | [No data] | [No data] |
| % in work or could return to work now if right job/support | 29 | 25 | 3 | 0.550 |
| Bases: all | 262 | 262 | [No data] | [No data] |
| % agree that: Have good relationship with work coach | 80 | 80 | 0 | 0.969 |
| Bases: all those recalling seeing a work coach | 149 | 98 | [No data] | [No data] |
| SWEMWBS metric mean score (SD), 7 to 35, higher score better | 19.91(4.32) | 19.49(4.59) | 0.43 | 0.401 |
| Bases: all | 262 | 260 | [No data] | [No data] |
P-value for interaction
| P-value for interaction | |
|---|---|
| % currently in paid work | 0.744 |
| Bases: all | [No data] |
| Mean score (SD), Job-Search behaviour (FIOH), score 1 to 4, higher score better | 0.995 |
| Bases: all not working 30+ hours a week | [No data] |
| % in work or could return to work now if right job/support | 0.983 |
| Bases: all | [No data] |
| % agree that: Have good relationship with work coach | 0.767 |
| Bases: all those recalling seeing a work coach | [No data] |
| SWEMWBS metric mean score (SD), 7 to 35, higher score better | 0.823 |
| Bases: all | [No data] |
Table 4.3: Age at baseline, LCW/WRAG customers
16 to 25
| Treat’t | Comp’n | Pp/mean diff | p-value | |
|---|---|---|---|---|
| % currently in paid work | 20 | 16 | 5 | 0.506 |
| Bases: all | 111 | 124 | [No data] | [No data] |
| Mean score (SD), Job-Search behaviour (FIOH), score 1 to 4, higher score better | 1.49(0.57) | 1.40(0.58) | 0.09 | 0.314 |
| Bases: all not working 30+ hours a week | 102 | 113 | [No data] | [No data] |
| % in work or could return to work now if right job/support | 49 | 37 | 12 | 0.085 |
| Bases: all | 111 | 124 | [No data] | [No data] |
| % agree that: Have good relationship with work coach | 75 | 70 | 5 | 0.586 |
| Bases: all recalling seeing a work coach | 97 | 75 | [No data] | [No data] |
| SWEMWBS metric mean score (SD), 7 to 35, higher score better | 19.72(3.64) | 19.11(3.47) | 0.61 | 0.220 |
| Bases: all | 111 | 124 | [No data] | [No data] |
26 to 35
| Treat’t | Comp’n | Pp/mean diff | p-value | |
|---|---|---|---|---|
| % currently in paid work | 12 | 17 | -5 | 0.277 |
| Bases: all | 175 | 158 | [No data] | [No data] |
| Mean score (SD), Job-Search behaviour (FIOH), score 1 to 4, higher score better | 1.37(0.51) | 1.32(0.50) | 0.06 | 0.400 |
| Bases: all not working 30+ hours a week | 166 | 149 | [No data] | [No data] |
| % in work or could return to work now if right job/support | 26 | 29 | -2 | 0.673 |
| Bases: all | 175 | 158 | [No data] | [No data] |
| % agree that: Have good relationship with work coach | 84 | 67 | 17 | 0.008* |
| Bases: all recalling seeing a work coach | 149 | 97 | [No data] | [No data] |
| SWEMWBS metric mean score (SD), 7 to 35, higher score better | 18.84(3.20) | 18.50(3.45) | 0.34 | 0.415 |
| Bases: all | 173 | 157 | [No data] | [No data] |
36 to 45
| Treat’t | Comp’n | Pp/mean diff | p-value | |
|---|---|---|---|---|
| % currently in paid work | 13 | 21 | -8 | 0.185 |
| Bases: all | 144 | 176 | [No data] | [No data] |
| Mean score (SD), Job-Search behaviour (FIOH), score 1 to 4, higher score better | 1.40(0.54) | 1.27(0.41) | 0.12 | 0.087 |
| Bases: all not working 30+ hours a week | 137 | 166 | [No data] | [No data] |
| % in work or could return to work now if right job/support | 32 | 31 | 1 | 0.913 |
| Bases: all | 251 | 251 | [No data] | [No data] |
| % agree that: Have good relationship with work coach | 82 | 75 | 6 | 0.352 |
| Bases: all recalling seeing a work coach | 123 | 97 | [No data] | [No data] |
| SWEMWBS metric mean score (SD), 7 to 35, higher score better | 18.08(3.56) | 18.10(3.39) | -0.02 | 0.967 |
| Bases: all | 143 | 175 | [No data] | [No data] |
46 to 55
| Treat’t | Comp’n | Pp/mean diff | p-value | |
|---|---|---|---|---|
| % currently in paid work | 12 | 7 | 5 | 0.272 |
| Bases: all | 149 | 139 | [No data] | [No data] |
| Mean score (SD), Job-Search behaviour (FIOH), score 1 to 4, higher score better | 1.34(0.47) | 1.29(0.47) | 0.06 | 0.409 |
| Bases: all not working 30+ hours a week | 141 | 136 | [No data] | [No data] |
| % in work or could return to work now if right job/support | 29 | 24 | 4 | 0.570 |
| Bases: all | 149 | 139 | [No data] | [No data] |
| % agree that: Have good relationship with work coach | 81 | 75 | 6 | 0.443 |
| Bases: all those recalling seeing a work coach | 121 | 82 | [No data] | [No data] |
| SWEMWBS metric mean score (SD), 7 to 35, higher score better | 18.20(3.90) | 18.44(3.76) | -0.24 | 0.648 |
| Bases: all | 146 | 138 | [No data] | [No data] |
56 to 65
| Treat’t | Comp’n | Pp/mean diff | p-value | |
|---|---|---|---|---|
| % currently in paid work | 10 | 8 | 2 | 0.982 |
| Bases: all | 113 | 130 | [No data] | [No data] |
| Mean score (SD), Job-Search behaviour (FIOH), score 1 to 4, higher score better | 1.35(0.57) | 1.20(0.45) | 0.15 | 0.033* |
| Bases: all not working 30+ hours a week | 112 | 124 | [No data] | [No data] |
| % in work or could return to work now if right job/support | 22 | 20 | 2 | 0.719 |
| Bases: all | 113 | 130 | [No data] | [No data] |
| % agree that: Have good relationship with work coach | 88 | 85 | 3 | 0.808 |
| Bases: all those recalling seeing a work coach | 91 | 74 | [No data] | [No data] |
| SWEMWBS metric mean score (SD), 7 to 35, higher score better | 18.84(4.67) | 19.20(3.79) | -0.36 | 0.530 |
| Bases: all | 112 | 129 | [No data] | [No data] |
P-value for interaction
| P-value for interaction | |
|---|---|
| % currently in paid work | 0.356 |
| Bases: all | [No data] |
| Mean score (SD), Job-Search behaviour (FIOH), score 1 to 4, higher score better | 0.839 |
| Bases: all not working 30+ hours a week | [No data] |
| % in work or could return to work now if right job/support | 0.641 |
| Bases: all | [No data] |
| % agree that: Have good relationship with work coach | 0.593 |
| Bases: all those recalling seeing a work coach | [No data] |
| SWEMWBS metric mean score (SD), 7 to 35, higher score better | 0.643 |
| Bases: all | [No data] |
5. Physical health condition
Table 5.1: Whether or not has a physical condition, all pre-WCA/LCW/WRAG customers
Has condition
| Treat’t | Comp’n | Pp/mean diff | p-value | |
|---|---|---|---|---|
| % currently in paid work | 16 | 18 | -2 | 0.438 |
| Bases: all | 1194 | 1252 | [No data] | [No data] |
| Mean score (SD), Job-Search behaviour (FIOH), score 1 to 4, higher score better | 1.34 (0.55) | 1.34 (0.57) | 0.00 | 0.884 |
| Bases: all not working 30+ hours a week | 1127 | 1179 | [No data] | [No data] |
| % in work or could return to work now if right job/support | 29 | 27 | 1 | 0.629 |
| Bases: all | 1194 | 1252 | [No data] | [No data] |
| % agree that: Have good relationship with work coach | 83 | 73 | 9 | 0.001* |
| Bases: all those recalling seeing a work coach | 823 | 603 | [No data] | [No data] |
| SWEMWBS metric mean score (SD), 7 to 35, higher score better | 19.09 (4.11) | 18.59 (4.09) | 0.50 | 0.022* |
| Bases: all | 1188 | 1246 | [No data] | [No data] |
Does not have condition
| Treat’t | Comp’n | Pp/mean diff | p-value | |
|---|---|---|---|---|
| % currently in paid work | 18 | 21 | -3 | 0.424 |
| Bases: all | 535 | 485 | [No data] | [No data] |
| Mean score (SD), Job-Search behaviour (FIOH), score 1 to 4, higher score better | 1.40 (0.55) | 1.29 (0.49) | 0.11 | 0.015* |
| Bases: all not working 30+ hours a week | 509 | 454 | [No data] | [No data] |
| % in work or could return to work now if right job/support | 36 | 34 | 2 | 0.694 |
| Bases: all | 535 | 485 | [No data] | [No data] |
| % agree that: Have good relationship with work coach | 82 | 79 | 3 | 0.510 |
| Bases: all those recalling seeing a work coach | 416 | 233 | [No data] | [No data] |
| SWEMWBS metric mean score (SD), 7 to 35, higher score better | 18.38 (3.83) | 18.32 (4.36) | 0.06 | 0.879 |
| Bases: all | 533 | 480 | [No data] | [No data] |
P-value for interaction
| P-value for interaction | |
|---|---|
| % currently in paid work | 0.770 |
| Bases: all | [No data] |
| Mean score (SD), Job-Search behaviour (FIOH), score 1 to 4, higher score better | 0.036* |
| Bases: all not working 30+ hours a week | [No data] |
| % in work or could return to work now if right job/support | 0.945 |
| Bases: all | [No data] |
| % agree that: Have good relationship with work coach | 0.209 |
| Bases: all those recalling seeing a work coach | [No data] |
| SWEMWBS metric mean score (SD), 7 to 35, higher score better | 0.309 |
| Bases: all | [No data] |
Table 5.2: Whether or not has a physical condition, pre-WCA customers
Has condition
| Treat’t | Comp’n | Pp/mean diff | p-value | |
|---|---|---|---|---|
| % currently in paid work | 17 | 18 | 0 | 0.980 |
| Bases: all | 799 | 804 | [No data] | [No data] |
| Mean score (SD), Job-Search behaviour (FIOH), score 1 to 4, higher score better | 1.33(0.55) | 1.35(0.58) | -0.02 | 0.567 |
| Bases: all not working 30+ hours a week | 752 | 749 | [No data] | [No data] |
| % in work or could return to work now if right job/support | 29 | 28 | 2 | 0.499 |
| Bases: all | 799 | 804 | [No data] | [No data] |
| % agree that: Have good relationship with work coach | 84 | 73 | 11 | 0.002* |
| Bases: all those recalling seeing a work coach | 490 | 336 | [No data] | [No data] |
| SWEMWBS metric mean score (SD), 7 to 35, higher score better | 19.26(4.26) | 18.68(4.25) | 0.58 | 0.031* |
| Bases: all | 797 | 800 | [No data] | [No data] |
Does not have condition
| Treat’t | Comp’n | Pp/mean diff | p-value | |
|---|---|---|---|---|
| % currently in paid work | 19 | 22 | -3 | 0.608 |
| Bases: all | 286 | 252 | [No data] | [No data] |
| Mean score (SD), Job-Search behaviour (FIOH), score 1 to 4, higher score better | 1.41(0.57) | 1.32(0.54) | 0.10 | 0.112 |
| Bases: all not working 30+ hours a week | 272 | 235 | [No data] | [No data] |
| % in work or could return to work now if right job/support | 37 | 37 | 1 | 0.916 |
| Bases: all | 286 | 252 | [No data] | [No data] |
| % agree that: Have good relationship with work coach | 81 | 85 | -3 | 0.451 |
| Bases: all those recalling seeing a work coach | 205 | 97 | [No data] | [No data] |
| SWEMWBS metric mean score (SD), 7 to 35, higher score better | 18.35(3.86) | 18.45(4.77) | -0.11 | 0.839 |
| Bases: all | 286 | 249 | [No data] | [No data] |
P-value for interaction
| P-value for interaction | |
|---|---|
| % currently in paid work | 0.652 |
| Bases: all | [No data] |
| Mean score (SD), Job-Search behaviour (FIOH), score 1 to 4, higher score better | 0.097 |
| Bases: all not working 30+ hours a week | [No data] |
| % in work or could return to work now if right job/support | 0.814 |
| Bases: all | [No data] |
| % agree that: Have good relationship with work coach | 0.027* |
| Bases: all those recalling seeing a work coach | [No data] |
| SWEMWBS metric mean score (SD), 7 to 35, higher score better | 0.252 |
| Bases: all | [No data] |
Table 5.3: Whether or not has a physical condition, LCW/WRAG customers
Has condition
| Treat’t | Comp’n | Pp/mean diff | p-value | |
|---|---|---|---|---|
| % currently in paid work | 11 | 18 | -7 | 0.085 |
| Bases: all | 395 | 448 | [No data] | [No data] |
| Mean score (SD), Job-Search behaviour (FIOH), score 1 to 4, higher score better | 1.36(0.52) | 1.31(0.52) | 0.05 | 0.247 |
| Bases: all not working 30+ hours a week | 375 | 430 | [No data] | [No data] |
| % in work or could return to work now if right job/support | 25 | 27 | -1 | 0.765 |
| Bases: all | 395 | 448 | [No data] | [No data] |
| % agree that: Have good relationship with work coach | 80 | 74 | 6 | 0.223 |
| Bases: all those recalling seeing a work coach | 333 | 267 | [No data] | [No data] |
| SWEMWBS metric mean score (SD), 7 to 35, higher score better | 18.49(3.46) | 18.25(3.47) | 0.24 | 0.408 |
| Bases: all | 391 | 446 | [No data] | [No data] |
Does not have condition
| Treat’t | Comp’n | Pp/mean diff | p-value | |
|---|---|---|---|---|
| % currently in paid work | 15 | 19 | -3 | 0.389 |
| Bases: all | 249 | 233 | [No data] | [No data] |
| Mean score (SD), Job-Search behaviour (FIOH), score 1 to 4, higher score better | 1.37(0.50) | 1.25(0.38) | 0.12 | 0.008* |
| Bases: all not working 30+ hours a week | 237 | 219 | [No data] | [No data] |
| % in work or could return to work now if right job/support | 33 | 30 | 3 | 0.460 |
| Bases: all | 249 | 233 | [No data] | [No data] |
| % agree that: Have good relationship with work coach | 83 | 69 | 14 | 0.024* |
| Bases: all those recalling seeing a work coach | 211 | 136 | [No data] | [No data] |
| SWEMWBS metric mean score (SD), 7 to 35, higher score better | 18.45(3.77) | 18.06(3.41) | 0.39 | 0.295 |
| Bases: all | 247 | 231 | [No data] | [No data] |
P-value for interaction
| P-value for interaction | |
|---|---|
| % currently in paid work | 0.494 |
| Bases: all | [No data] |
| Mean score (SD), Job-Search behaviour (FIOH), score 1 to 4, higher score better | 0.291 |
| Bases: all not working 30+ hours a week | [No data] |
| % in work or could return to work now if right job/support | 0.466 |
| Bases: all | [No data] |
| % agree that: Have good relationship with work coach | 0.297 |
| Bases: all those recalling seeing a work coach | [No data] |
| SWEMWBS metric mean score (SD), 7 to 35, higher score better | 0.743 |
| Bases: all | [No data] |
6. Mental health condition
Table 6.1: Whether or not has a mental health condition, all pre-WCA/LCW/WRAG customers
Has condition
| Treat’t | Comp’n | Pp/mean diff | p-value | |
|---|---|---|---|---|
| % currently in paid work | 17 | 18 | 0 | 0.812 |
| Bases: all | 1199 | 1146 | [No data] | [No data] |
| Mean score (SD), Job-Search behaviour (FIOH), score 1 to 4, higher score better | 1.34 (0.52) | 1.30 (0.49) | 0.04 | 0.102 |
| Bases: all not working 30+ hours a week | 1147 | 1085 | [No data] | [No data] |
| % in work or could return to work now if right job/support | 30 | 28 | 2 | 0.513 |
| Bases: all | 1199 | 1146 | [No data] | [No data] |
| % agree that: Have good relationship with work coach | 83 | 74 | 9 | 0.006* |
| Bases: all those recalling seeing a work coach | 896 | 538 | [No data] | [No data] |
| SWEMWBS metric mean score (SD), 7 to 35, higher score better | 18.21 (3.74) | 18.06 (4.06) | 0.16 | 0.535 |
| Bases: all | 1195 | 1141 | [No data] | [No data] |
Does not have condition
| Treat’t | Comp’n | Pp/mean diff | p-value | |
|---|---|---|---|---|
| % currently in paid work | 15 | 16 | -1 | 0.775 |
| Bases: all | 530 | 591 | [No data] | [No data] |
| Mean score (SD), Job-Search behaviour (FIOH), score 1 to 4, higher score better | 1.40 (0.62) | 1.35 (0.60) | 0.05 | 0.323 |
| Bases: all not working 30+ hours a week | 489 | 548 | [No data] | [No data] |
| % in work or could return to work now if right job/support | 33 | 26 | 7 | 0.055 |
| Bases: all | 530 | 591 | [No data] | [No data] |
| % agree that: Have good relationship with work coach | 81 | 80 | 0 | 0.978 |
| Bases: all those recalling seeing a work coach | 343 | 298 | [No data] | [No data] |
| SWEMWBS metric mean score (SD), 7 to 35, higher score better | 20.35 (4.29) | 19.81 (4.15) | 0.55 | 0.135 |
| Bases: all | 526 | 585 | [No data] | [No data] |
P-value for interaction
| P-value for interaction | |
|---|---|
| % currently in paid work | 0.913 |
| Bases: all | [No data] |
| Mean score (SD), Job-Search behaviour (FIOH), score 1 to 4, higher score better | 0.898 |
| Bases: all not working 30+ hours a week | [No data] |
| % in work or could return to work now if right job/support | 0.218 |
| Bases: all | [No data] |
| % agree that: Have good relationship with work coach | 0.107 |
| Bases: all those recalling seeing a work coach | [No data] |
| SWEMWBS metric mean score (SD), 7 to 35, higher score better | 0.375 |
| Bases: all | [No data] |
Table 6.2: Whether or not has a mental health condition, pre-WCA customers
Has condition
| Treat’t | Comp’n | Pp/mean diff | p-value | |
|---|---|---|---|---|
| % currently in paid work | 19 | 18 | 1 | 0.708 |
| Bases: all | 682 | 633 | [No data] | [No data] |
| Mean score (SD), # Job-Search behaviour (FIOH), score 1 to 4, higher score better | 1.33(0.52) | 1.30(0.50) | 0.03 | 0.375 |
| Bases: all not working 30+ hours a week | 651 | 591 | [No data] | [No data] |
| % in work or could return to work now if right job/support | 31 | 29 | 2 | 0.472 |
| Bases: all | 682 | 633 | [No data] | [No data] |
| % agree that: Have good relationship with work coach | 83 | 76 | 7 | 0.100 |
| Bases: all those recalling seeing a work coach | 454 | 236 | [No data] | [No data] |
| SWEMWBS metric mean score (SD), 7 to 35, higher score better | 18.19(3.85) | 17.99(4.25) | 0.20 | 0.562 |
| Bases: all | 682 | 631 | [No data] | [No data] |
Does not have condition
| Treat’t | Comp’n | Pp/mean diff | p-value | |
|---|---|---|---|---|
| % currently in paid work | 15 | 16 | -1 | 0.707 |
| Bases: all | 403 | 423 | [No data] | [No data] |
| Mean score (SD), # Job-Search behaviour (FIOH), score 1 to 4, higher score better | 1.40(0.63) | 1.36(0.62) | 0.03 | 0.540 |
| Bases: all not working 30+ hours a week | 373 | 393 | [No data] | [No data] |
| % in work or could return to work now if right job/support | 32 | 26 | 6 | 0.114 |
| Bases: all | 403 | 423 | [No data] | [No data] |
| % agree that: Have good relationship with work coach | 83 | 81 | 2 | 0.669 |
| Bases: all those recalling seeing a work coach | 241 | 197 | [No data] | [No data] |
| SWEMWBS metric mean score (SD), 7 to 35, higher score better | 20.52(4.34) | 20.07(4.15) | 0.45 | 0.250 |
| Bases: all | 401 | 418 | [No data] | [No data] |
P-value for interaction
| P-value for interaction | |
|---|---|
| % currently in paid work | 0.599 |
| Bases: all | [No data] |
| Mean score (SD), # Job-Search behaviour (FIOH), score 1 to 4, higher score better | 0.957 |
| Bases: all not working 30+ hours a week | [No data] |
| % in work or could return to work now if right job/support | 0.421 |
| Bases: all | [No data] |
| % agree that: Have good relationship with work coach | 0.434 |
| Bases: all those recalling seeing a work coach | [No data] |
| SWEMWBS metric mean score (SD), 7 to 35, higher score better | 0.630 |
| Bases: all | [No data] |
Table 6.3: Whether or not has a mental health condition, LCW/WRAG customers
Has condition
| Treat’t | Comp’n | Pp/mean diff | p-value | |
|---|---|---|---|---|
| % currently in paid work | 12 | 16 | -4 | 0.115 |
| Bases: all | 517 | 513 | [No data] | [No data] |
| Mean score (SD), Job-Search behaviour (FIOH), score 1 to 4, higher score better | 1.35(0.50) | 1.28(0.46) | 0.07 | 0.038* |
| Bases: all not working 30+ hours a week | 496 | 494 | [No data] | [No data] |
| % in work or could return to work now if right job/support | 27 | 27 | 0 | 0.980 |
| Bases: all | 517 | 513 | [No data] | [No data] |
| % agree that: Have good relationship with work coach | 83 | 72 | 11 | 0.001* |
| Bases: all those recalling seeing a work coach | 442 | 302 | [No data] | [No data] |
| SWEMWBS metric mean score (SD), 7 to 35, higher score better | 18.26(3.49) | 18.20(3.57) | 0.06 | 0.825 |
| Bases: all | 513 | 510 | [No data] | [No data] |
Does not have condition
| Treat’t | Comp’n | Pp/mean diff | p-value | |
|---|---|---|---|---|
| % currently in paid work | 14 | 13 | 1 | 0.817 |
| Bases: all | 127 | 168 | [No data] | [No data] |
| Mean score (SD), Job-Search behaviour (FIOH), score 1 to 4, higher score better | 1.43(0.56) | 1.29(0.54) | 0.14 | 0.215 |
| Bases: all not working 30+ hours a week | 116 | 155 | [No data] | [No data] |
| % in work or could return to work now if right job/support | 36 | 25 | 11 | 0.209 |
| Bases: all | 403 | 423 | [No data] | [No data] |
| % agree that: Have good relationship with work coach | 71 | 78 | -7 | 0.427 |
| Bases: all those recalling seeing a work coach | 102 | 101 | [No data] | [No data] |
| SWEMWBS metric mean score (SD), 7 to 35, higher score better | 19.44(3.88) | 18.29(3.90) | 1.15 | 0.154 |
| Bases: all | 125 | 167 | [No data] | [No data] |
P-value for interaction
| P-value for interaction | |
|---|---|
| % currently in paid work | 0.402 |
| Bases: all | [No data] |
| Mean score (SD), Job-Search behaviour (FIOH), score 1 to 4, higher score better | 0.559 |
| Bases: all not working 30+ hours a week | [No data] |
| % in work or could return to work now if right job/support | 0.240 |
| Bases: all | [No data] |
| % agree that: Have good relationship with work coach | 0.043* |
| Bases: all those recalling seeing a work coach | [No data] |
| SWEMWBS metric mean score (SD), 7 to 35, higher score better | 0.195 |
| Bases: all | [No data] |
7. Neurodivergent condition
Table 7.1: Whether or not has a neurodivergent condition, all pre-WCA/LCW/WRAG customers
Has condition
| Treat’t | Comp’n | Pp/mean diff | p-value | |
|---|---|---|---|---|
| % currently in paid work | 16 | 18 | -2 | 0.596 |
| Bases: all | 318 | 330 | [No data] | [No data] |
| Mean score (SD), Job-Search behaviour (FIOH), score 1 to 4, higher score better | 1.37 (0.50) | 1.36 (0.53) | 0.02 | 0.763 |
| Bases: all not working 30+ hours a week | 301 | 311 | [No data] | [No data] |
| % in work or could return to work now if right job/support | 33 | 30 | 4 | 0.455 |
| Bases: all | 318 | 330 | [No data] | [No data] |
| % agree that: Have good relationship with work coach | 79 | 74 | 4 | 0.413 |
| Bases: all those recalling seeing a work coach | 230 | 140 | [No data] | [No data] |
| SWEMWBS metric mean score (SD), 7 to 35, higher score better | 18.63 (3.61) | 17.60 (3.21) | 1.03 | 0.001* |
| Bases: all | 316 | 327 | [No data] | [No data] |
Does not have condition
| Treat’t | Comp’n | Pp/mean diff | p-value | |
|---|---|---|---|---|
| % currently in paid work | 17 | 17 | 0 | 0.951 |
| Bases: all | 1411 | 1407 | [No data] | [No data] |
| Mean score (SD), Job-Search behaviour (FIOH), score 1 to 4, higher score better | 1.35 (0.56) | 1.33 (0.55) | 0.03 | 0.365 |
| Bases: all not working 30+ hours a week | 1335 | 1322 | [No data] | [No data] |
| % in work or could return to work now if right job/support | 30 | 28 | 2 | 0.351 |
| Bases: all | 1411 | 1407 | [No data] | [No data] |
| % agree that: Have good relationship with work coach | 83 | 76 | 8 | 0.002* |
| Bases: all those recalling seeing a work coach | 1009 | 696 | [No data] | [No data] |
| SWEMWBS metric mean score (SD), 7 to 35, higher score better | 18.92 (4.13) | 18.57 (4.23) | 0.35 | 0.092 |
| Bases: all | 1405 | 1399 | [No data] | [No data] |
P-value for interaction
| P-value for interaction | |
|---|---|
| % currently in paid work | 0.647 |
| Bases: all | [No data] |
| Mean score (SD), Job-Search behaviour (FIOH), score 1 to 4, higher score better | 0.910 |
| Bases: all not working 30+ hours a week | [No data] |
| % in work or could return to work now if right job/support | 0.768 |
| Bases: all | [No data] |
| % agree that: Have good relationship with work coach | 0.478 |
| Bases: all those recalling seeing a work coach | [No data] |
| SWEMWBS metric mean score (SD), 7 to 35, higher score better | 0.076 |
| Bases: all | [No data] |
Table 7.2: Whether or not has a neurodivergent condition, pre-WCA customers
Has condition
| Treat’t | Comp’n | Pp/mean diff | p-value | |
|---|---|---|---|---|
| % currently in paid work | 15 | 19 | -4 | 0.430 |
| Bases: all | 182 | 189 | [No data] | [No data] |
| Mean score (SD), Job-Search behaviour (FIOH), score 1 to 4, higher score better | 1.36(0.51) | 1.36(0.57) | 0.00 | 1.000 |
| Bases: all not working 30+ hours a week | 173 | 178 | [No data] | [No data] |
| % in work or could return to work now if right job/support | 32 | 32 | 0 | 0.941 |
| Bases: all | 182 | 189 | [No data] | [No data] |
| % agree that: Have good relationship with work coach | 84 | 80 | 4 | 0.525 |
| Bases: all those recalling seeing a work coach | 117 | 61 | [No data] | [No data] |
| SWEMWBS metric mean score (SD), 7 to 35, higher score better | 18.82(3.80) | 17.46(3.33) | 1.36 | 0.001* |
| Bases: all | 182 | 186 | [No data] | [No data] |
Does not have condition
| Treat’t | Comp’n | Pp/mean diff | p-value | |
|---|---|---|---|---|
| % currently in paid work | 18 | 17 | 1 | 0.564 |
| Bases: all | 903 | 867 | [No data] | [No data] |
| Mean score (SD), Job-Search behaviour (FIOH), score 1 to 4, higher score better | 1.35(0.57) | 1.34(0.57) | 0.02 | 0.571 |
| Bases: all not working 30+ hours a week | 851 | 806 | [No data] | [No data] |
| % in work or could return to work now if right job/support | 32 | 28 | 3 | 0.205 |
| Bases: all | 903 | 867 | [No data] | [No data] |
| % agree that: Have good relationship with work coach | 83 | 76 | 7 | 0.037* |
| Bases: all those recalling seeing a work coach | 578 | 372 | [No data] | [No data] |
| SWEMWBS metric mean score (SD), 7 to 35, higher score better | 19.04(4.25) | 18.63(4.45) | 0.41 | 0.115 |
| Bases: all | 901 | 863 | [No data] | [No data] |
P-value for interaction
| P-value for interaction | |
|---|---|
| % currently in paid work | 0.342 |
| Bases: all | [No data] |
| Mean score (SD), Job-Search behaviour (FIOH), score 1 to 4, higher score better | 0.821 |
| Bases: all not working 30+ hours a week | [No data] |
| % in work or could return to work now if right job/support | 0.561 |
| Bases: all | [No data] |
| % agree that: Have good relationship with work coach | 0.784 |
| Bases: all those recalling seeing a work coach | [No data] |
| SWEMWBS metric mean score (SD), 7 to 35, higher score better | 0.052 |
| Bases: all | [No data] |
Table 7.3: Whether or not has a neurodivergent condition, LCW/WRAG customers
Has condition
| Treat’t | Comp’n | Pp/mean diff | p-value | |
|---|---|---|---|---|
| % currently in paid work | 16 | 14 | 2 | 0.706 |
| Bases: all | 136 | 141 | [No data] | [No data] |
| Mean score (SD), Job-Search behaviour (FIOH), score 1 to 4, higher score better | 1.40(0.50) | 1.31(0.44) | 0.06 | 0.445 |
| Bases: all not working 30+ hours a week | 128 | 133 | [No data] | [No data] |
| % in work or could return to work now if right job/support | 37 | 23 | 13 | 0.088 |
| Bases: all | 136 | 141 | [No data] | [No data] |
| % agree that: Have good relationship with work coach | 70 | 65 | 4 | 0.605 |
| Bases: all those recalling seeing a work coach | 113 | 79 | [No data] | [No data] |
| SWEMWBS metric mean score (SD), 7 to 35, higher score better | 18.18(3.11) | 17.91(2.91) | 0.27 | 0.584 |
| Bases: all | 134 | 141 | [No data] | [No data] |
Does not have condition
| Treat’t | Comp’n | Pp/mean diff | p-value | |
|---|---|---|---|---|
| % currently in paid work | 12 | 16 | -4 | 0.130 |
| Bases: all | 508 | 540 | [No data] | [No data] |
| Mean score (SD), Job-Search behaviour (FIOH), score 1 to 4, higher score better | 1.35(0.52) | 1.31(0.49) | 0.04 | 0.302 |
| Bases: all not working 30+ hours a week | 484 | 516 | [No data] | [No data] |
| % in work or could return to work now if right job/support | 26 | 28 | -2 | 0.552 |
| Bases: all | 508 | 540 | [No data] | [No data] |
| % agree that: Have good relationship with work coach | 84 | 75 | 10 | 0.004* |
| Bases: all those recalling seeing a work coach | 431 | 324 | [No data] | [No data] |
| SWEMWBS metric mean score (SD), 7 to 35, higher score better | 18.56(3.71) | 18.41(3.44) | 0.14 | 0.547 |
| Bases: all | 504 | 536 | [No data] | [No data] |
P-value for interaction
| P-value for interaction | |
|---|---|
| % currently in paid work | 0.292 |
| Bases: all | [No data] |
| Mean score (SD), Job-Search behaviour (FIOH), score 1 to 4, higher score better | 0.860 |
| Bases: all not working 30+ hours a week | [No data] |
| % in work or could return to work now if right job/support | 0.073 |
| Bases: all | [No data] |
| % agree that: Have good relationship with work coach | 0.328 |
| Bases: all those recalling seeing a work coach | [No data] |
| SWEMWBS metric mean score (SD), 7 to 35, higher score better | 0.820 |
| Bases: all | [No data] |
8. Number of health conditions at baseline
Table 8.1: Number of health conditions at baseline, all pre-WCA/LCW/WRAG customers[footnote 18]
One condition
| Treat’t | Comp’n | Pp/mean diff | p-value | |
|---|---|---|---|---|
| % currently in paid work | 18 | 17 | 1 | 0.695 |
| Bases: all | 590 | 534 | [No data] | [No data] |
| Mean score (SD), Job-Search behaviour (FIOH), score 1 to 4, higher score better | 1.43 (0.61) | 1.39 (0.61) | 0.04 | 0.502 |
| Bases: all not working 30+ hours a week | 550 | 490 | [No data] | [No data] |
| % in work or could return to work now if right job/support | 36 | 33 | 3 | 0.382 |
| Bases: all | 590 | 534 | [No data] | [No data] |
| % agree that: Have good relationship with work coach | 83 | 85 | -2 | 0.508 |
| Bases: all recalling seeing a work coach | 418 | 279 | [No data] | [No data] |
| SWEMWBS metric mean score (SD), 7 to 35, higher score better | 19.59 (4.48) | 19.16 (4.31) | 0.44 | 0.205 |
| Bases: all | 588 | 529 | [No data] | [No data] |
Two conditions
| Treat’t | Comp’n | Pp/mean diff | p-value | |
|---|---|---|---|---|
| % currently in paid work | 16 | 19 | -3 | 0.314 |
| Bases: all | 625 | 627 | [No data] | [No data] |
| Mean score (SD), Job-Search behaviour (FIOH), score 1 to 4, higher score better | 1.34 (0.54) | 1.31 (0.55) | 0.03 | 0.534 |
| Bases: all not working 30+ hours a week | 599 | 591 | [No data] | [No data] |
| % in work or could return to work now if right job/support | 30 | 29 | 1 | 0.791 |
| Bases: all | 625 | 627 | [No data] | [No data] |
| % agree that: Have good relationship with work coach | 82 | 71 | 11 | 0.027* |
| Bases: all recalling seeing a work coach | 455 | 305 | [No data] | [No data] |
| SWEMWBS metric mean score (SD), 7 to 35, higher score better | 18.61 (3.85) | 18.29 (3.68) | 0.32 | 0.282 |
| Bases: all | 623 | 624 | [No data] | [No data] |
Three or more conditions
| Treat’t | Comp’n | Pp/mean diff | p-value | |
|---|---|---|---|---|
| % currently in paid work | 16 | 13 | 2 | 0.453 |
| Bases: all | 505 | 563 | [No data] | [No data] |
| Mean score (SD), Job-Search behaviour (FIOH), score 1 to 4, higher score better | 1.29 (0.46) | 1.27 (0.47) | 0.02 | 0.651 |
| Bases: all not working 30+ hours a week | 479 | 539 | [No data] | [No data] |
| % in work or could return to work now if right job/support | 25 | 21 | 4 | 0.266 |
| Bases: all | 505 | 563 | [No data] | [No data] |
| % agree that: Have good relationship with work coach | 81 | 79 | 2 | 0.683 |
| Bases: all recalling seeing a work coach | 358 | 245 | [No data] | [No data] |
| SWEMWBS metric mean score (SD), 7 to 35, higher score better | 18.31 (3.61) | 18.05 (4.19) | 0.27 | 0.500 |
| Bases: all | 502 | 560 | [No data] | [No data] |
P-value for interactions
| P-value for interactions | |
|---|---|
| % currently in paid work | 0.422 |
| Bases: all | [No data] |
| Mean score (SD), Job-Search behaviour (FIOH), score 1 to 4, higher score better | 0.947 |
| Bases: all not working 30+ hours a week | [No data] |
| % in work or could return to work now if right job/support | 0.801 |
| Bases: all | [No data] |
| % agree that: Have good relationship with work coach | 0.110 |
| Bases: all recalling seeing a work coach | [No data] |
| SWEMWBS metric mean score (SD), 7 to 35, higher score better | 0.943 |
| Bases: all | [No data] |
Table 8.2: Number of health conditions at baseline, pre-WCA customers[footnote 19]
One condition
| Treat’t | Comp’n | Pp/mean diff | p-value | |
|---|---|---|---|---|
| % currently in paid work | 19 | 17 | 2 | 0.572 |
| Bases: all | 386 | 326 | [No data] | [No data] |
| Mean score (SD), Job-Search behaviour (FIOH), score 1 to 4, higher score better | 1.43(0.63) | 1.43(0.65) | 0.01 | 0.929 |
| Bases: all not working 30+ hours a week | 354 | 297 | [No data] | [No data] |
| % in work or could return to work now if right job/support | 37 | 32 | 5 | 0.279 |
| Bases: all | 386 | 326 | [No data] | [No data] |
| % agree that: Have good relationship with work coach | 84 | 88 | -5 | 0.194 |
| Bases: all recalling seeing a work coach | 243 | 158 | [No data] | [No data] |
| SWEMWBS metric mean score (SD), 7 to 35, higher score better | 19.87(4.60) | 19.34(4.53) | 0.53 | 0.202 |
| Bases: all | 385 | 323 | [No data] | [No data] |
Two conditions
| Treat’t | Comp’n | Pp/mean diff | p-value | |
|---|---|---|---|---|
| % currently in paid work | 17 | 20 | -3 | 0.455 |
| Bases: all | 376 | 373 | [No data] | [No data] |
| Mean score (SD), Job-Search behaviour (FIOH), score 1 to 4, higher score better | 1.34(0.56) | 1.33(0.59) | 0.00 | 0.976 |
| Bases: all not working 30+ hours a week | 364 | 347 | [No data] | [No data] |
| % in work or could return to work now if right job/support | 31 | 31 | 0 | 0.973 |
| Bases: all | 376 | 373 | [No data] | [No data] |
| % agree that: Have good relationship with work coach | 82 | 69 | 14 | 0.040* |
| Bases: all recalling seeing a work coach | 250 | 149 | [No data] | [No data] |
| SWEMWBS metric mean score (SD), 7 to 35, higher score better | 18.58(3.96) | 18.41(3.78) | 0.17 | 0.649 |
| Bases: all | 375 | 371 | [No data] | [No data] |
Three or more conditions
| Treat’t | Comp’n | Pp/mean diff | p-value | |
|---|---|---|---|---|
| % currently in paid work | 17 | 13 | 4 | 0.265 |
| Bases: all | 316 | 348 | [No data] | [No data] |
| Mean score (SD), Job-Search behaviour (FIOH), score 1 to 4, higher score better | 1.27(0.44) | 1.26(0.47) | 0.02 | 0.716 |
| Bases: all not working 30+ hours a week | 299 | 331 | [No data] | [No data] |
| % in work or could return to work now if right job/support | 25 | 20 | 6 | 0.226 |
| Bases: all | 316 | 348 | [No data] | [No data] |
| % agree that: Have good relationship with work coach | 82 | 80 | 2 | 0.723 |
| Bases: all recalling seeing a work coach | 195 | 123 | [No data] | [No data] |
| SWEMWBS metric mean score (SD), 7 to 35, higher score better | 18.44(3.74) | 18.03(4.33) | 0.27 | 0.431 |
| Bases: all | 316 | 346 | [No data] | [No data] |
P-value for interactions
| P-value for interactions | |
|---|---|
| % currently in paid work | 0.382 |
| Bases: all | [No data] |
| Mean score (SD), Job-Search behaviour (FIOH), score 1 to 4, higher score better | 0.981 |
| Bases: all not working 30+ hours a week | [No data] |
| % in work or could return to work now if right job/support | 0.604 |
| Bases: all | [No data] |
| % agree that: Have good relationship with work coach | 0.058 |
| Bases: all recalling seeing a work coach | [No data] |
| SWEMWBS metric mean score (SD), 7 to 35, higher score better | 0.813 |
| Bases: all | [No data] |
Table 8.3: Number of health conditions at baseline, LCW/WRAG customers[footnote 20]
One condition
| Treat’t | Comp’n | Pp/mean diff | p-value | |
|---|---|---|---|---|
| % currently in paid work | 13 | 15 | -2 | 0.689 |
| Bases: all | 204 | 208 | [No data] | [No data] |
| Mean score (SD), Job-Search behaviour (FIOH), score 1 to 4, higher score better | 1.41(0.55) | 1.27(0.43) | 0.14 | 0.018* |
| Bases: all not working 30+ hours a week | 196 | 193 | [No data] | [No data] |
| % in work or could return to work now if right job/support | 33 | 35 | -2 | 0.736 |
| Bases: all | 204 | 208 | [No data] | [No data] |
| % agree that: Have good relationship with work coach | 82 | 78 | 4 | 0.374 |
| Bases: all recalling seeing a work coach | 175 | 121 | [No data] | [No data] |
| SWEMWBS metric mean score (SD), 7 to 35, higher score better | 18.69(3.95) | 18.56(3.46) | 0.12 | 0.812 |
| Bases: all | 203 | 206 | [No data] | [No data] |
Two conditions
| Treat’t | Comp’n | Pp/mean diff | p-value | |
|---|---|---|---|---|
| % currently in paid work | 12 | 15 | -3 | 0.368 |
| Bases: all | 249 | 254 | [No data] | [No data] |
| Mean score (SD), Job-Search behaviour (FIOH), score 1 to 4, higher score better | 1.34(0.49) | 1.24(0.45) | 0.11 | 0.023* |
| Bases: all not working 30+ hours a week | 235 | 244 | [No data] | [No data] |
| % in work or could return to work now if right job/support | 27 | 23 | 5 | 0.361 |
| Bases: all | 249 | 254 | [No data] | [No data] |
| % agree that: Have good relationship with work coach | 82 | 78 | 4 | 0.418 |
| Bases: all recalling seeing a work coach | 205 | 156 | [No data] | [No data] |
| SWEMWBS metric mean score (SD), 7 to 35, higher score better | 18.67(3.53) | 17.99(3.38) | 0.69 | 0.062 |
| Bases: all | 248 | 253 | [No data] | [No data] |
Three or more conditions
| Treat’t | Comp’n | Pp/mean diff | p-value | |
|---|---|---|---|---|
| % currently in paid work | 12 | 16 | -4 | 0.401 |
| Bases: all | 189 | 215 | [No data] | [No data] |
| Mean score (SD), Job-Search behaviour (FIOH), score 1 to 4, higher score better | 1.34(0.51) | 1.33(0.50) | 0.02 | 0.759 |
| Bases: all not working 30+ hours a week | 180 | 208 | [No data] | [No data] |
| % in work or could return to work now if right job/support | 26 | 26 | 0 | 0.940 |
| Bases: all | 189 | 215 | [No data] | [No data] |
| % agree that: Have good relationship with work coach | 79 | 77 | 1 | 0.803 |
| Bases: all recalling seeing a work coach | 163 | 122 | [No data] | [No data] |
| SWEMWBS metric mean score (SD), 7 to 35, higher score better | 17.95(3.20) | 18.09(3.74) | -0.15 | 0.696 |
| Bases: all | 186 | 214 | [No data] | [No data] |
P-value for interaction
| P-value for interaction | |
|---|---|
| % currently in paid work | 0.950 |
| Bases: all | [No data] |
| Mean score (SD), Job-Search behaviour (FIOH), score 1 to 4, higher score better | 0.335 |
| Bases: all not working 30+ hours a week | [No data] |
| % in work or could return to work now if right job/support | 0.664 |
| Bases: all | [No data] |
| % agree that: Have good relationship with work coach | 0.889 |
| Bases: all recalling seeing a work coach | [No data] |
| SWEMWBS metric mean score (SD), 7 to 35, higher score better | 0.272 |
| Bases: all | [No data] |
Appendix C. Technical appendix for the propensity score matching
This appendix sets out the details of how the propensity score matching to generate a matched comparison group was conducted. This is followed by a description of an analysis used to test for residual self-selection biases.
Generating the matched comparison group (propensity score matching)
This report compares outcomes of customers in the AWCS treatment group with those of a matched comparison group generated from the comparison group customers. The matched comparison group is essentially a weighted version of the comparison group, with the purpose being to generate a weighted sample that has a very similar profile to the treatment group. This was achieved using propensity score matching (PSM).
There were two stages to the PSM. The first stage was carried out at the sample selection stage by the team at DWP. This is described in Section A.1. The second stage was carried out at the analysis stage, and restricted to those customers who completed both waves of the survey. This is described in Section A.2.
Selection of the survey sample using PSM
The sample for the survey was selected in four separate ‘cohort’ groups, with, for each cohort, a sample of AWCS customers being selected together with a matched comparison sample of non-AWCS customers.
For each cohort the stages were as follows:
Stage 1: The identification of the AWCS group
AWCS customers were identified as the group of eligible UC customers who had attended their first AWCS appointment within the last 28 days or ESA customers who had attended their first appointment the month prior. AWCS customers from the six ‘learning environment’ jobcentres were excluded on the basis that AWCS in those areas would not be comparable with AWCS elsewhere.
Stage 2: Identification of the group of customers from which the comparison sample would be selected
A pool of potential comparison customers were identified from the remaining UC and ESA customers after excluding those who at the time of drawing the sample:
- had ever attended an AWCS appointment
- lived in Northern Ireland (AWCS is Great Britain only)
- were based in the six ‘learning environment’ jobcentres.
Stage 3: Attaching the PSM variables
For all the AWCS and potential comparison customers a series of matching variables were created, these being:
- Group (pre-WCA, LCW/WRAG, LCWRA/SG) - categorical and exact match in PSM step
- Sex - categorical and exact match in PSM step
- Age band - categorical
- Family type - categorical
- Region - categorical
- Labour market history - continuous (number of months with positive earnings in the last 12 months (i.e. 0-12) for UC. Number of weeks with positive earnings in the last 52 weeks for ESA (i.e. 0-52)
- Average earnings per month in the last 12 months- continuous
- Other benefits PIP - continuous (number of months on the PIP caseload over the last 12 months (i.e. 0-12)
- Claim length - continuous (number of days from claim start to sample date) Due to a coding error this variable was not used in the PSM for cohort 1.
Any customers where one of more of the matching variables were missing were excluded at this stage. Mandatory population exclusions were also applied at this stage.
Stage 4: Running the PSM and selecting the comparison sample
A random number was assigned to all cases. The cases were then sorted on the random number to ensure that, all else being equal, the PSM would select cases at random.
The SAS (Enterprise Guide 8.3) “proc psmatch’ process was used, using the greedy match method without replacement and a caliper of 0.02, and with all of the matching variables included in the propensity score regression model. For Cohorts 1 and 2 one comparison group match was selected per AWCS customer; for cohorts 3 and 4 this was increased to two comparison customers per AWCS customer.
The process gave the following sample numbers per cohort (Table C.1).
Table C.1: Sample numbers selected
| Pre-WCA: AWCS customers | Pre-WCA: Non-AWCS customers | LCW/WRAG: AWCS customers | LCW/WRAG: Non-AWCS customers | LCWRA/SG: AWCS customers | LCWRA/SG: Non-AWCS customers | |
|---|---|---|---|---|---|---|
| Cohort 1 | 2,387 | 2,387 | 1,447 | 1,447 | 173 | 173 |
| Cohort 2 | 2,670 | 2,670 | 1,558 | 1,558 | 180 | 180 |
| Cohort 3 | 3,053 | 6,106 | 1,775 | 3,550 | 172 | 344 |
| Cohort 4 | 3,182 | 6,364 | 1,135 | 2,270 | 137 | 274 |
| Total | 11,292 | 17,527 | 5,915 | 8,825 | 662 | 971 |
Propensity score matching at the analysis stage
Although the use of PSM at the sampling stage generated AWCS and comparison group samples that were very well matched on the set of variables that were available to DWP, the Wave 1 survey collected a broad range of additional variables which were used at the analysis stage to create a matched comparison group that mirrored the AWCS group across all of the variables.
The matched comparison group at the analysis stage was again generated using propensity score matching. The PSM was run separately for the two main condition groups: pre-WCA and LCW/WRAG. The LCWRA/SG group was excluded because the sample sizes in both the AWCS and comparison groups were too small for impact estimation.
The main steps at the analysis stage per condition group were:
- The probability (or propensity) of an individual being in the AWCS group was estimated from a logistic regression model of the data. The binary outcome variable in the model was the group (1=AWCS survey respondent; 0=comparison group survey respondent), and the predictors are all the characteristics collected as ‘baseline’ either via the DWP sample file or via retrospective questions added to the Wave 1 survey. The estimated probability per person is termed the ‘propensity score’.
- The comparison group was then weighted so that the distribution of propensity scores in the comparison group was the same as in the AWCS group.
The technical details of the matching are as follows:
- The logistic regression model was fitted within SPSS. Given the very large number of matching variables, several of which are correlated with each other (giving a risk of collinearity), all variables were entered forward stepwise, with p(inclusion) set at 0.1 and p(exclusion) set at 0.2[footnote 21]. Prior to fitting the logistic regression model the AWCS group was weighted by the survey non-response weights. The comparison group data was treated as a pool from which a matched comparison group would be constructed, so non-response weights were not applied to the comparison group.
- The weights for the comparison group were calculated as inverse propensity weights (i.e. p/1-p). Comparison group customers who are very similar to treatment group customers, and hence have a high propensity score, would be given a large weight; comparison group members who are dissimilar to treatment group customers, and hence have a low propensity score would be given a small weight.
- Extremely large weights (above the 98th percentiles) were trimmed. That is any weights above the 98th percentile were recorded as the value at the 98th percentile. Trimming in the weights in this way reduces the influence of any large outlier weights.
- Given the very high correlation between working status at baseline and working status at follow-up, a check was made that the two groups (AWCS and matched comparison) were very well matched on a binary baseline working status variable. Small differences were identified at this stage, so the matched comparison group weights were adjusted[footnote 22] to ensure a perfect match on this variable. This adjustment did not affect the quality of the match on other variables.
Table C.2 shows the matching variables included in the propensity score model. Tables C.3 and C.4 give the full detail of the categories for each variable.
Table C.2: Matching variables used in the propensity score matching
| Category of variable | Variable |
|---|---|
| Employment status at baseline and employment history | Length of time unemployed at baseline Employment status at baseline Employment hours at baseline Summary of work history Whether was in training in month before baseline Whether volunteered in month before baseline Whether looking for work in month before baseline Number of vacancies applied for in month before baseline Number of hours of Job-Search in month before baseline |
| Attitudes and barriers to work at baseline | Perception about ability to work at baseline I am/would be happier and more fulfilled when/if working My work can/could accommodate my health/disability needs Having a job is/would be beneficial for my health I know how to present myself and my condition in my CV/at interviews Worried would not be employed because of condition Worried work would make condition worse Worried condition fluctuates too much to work Barriers: Lack of skills or recent experience Barriers: Lack of jobs available Barriers: Physical or mental health issues Barriers: Family or caring commitments Barriers: Problems around transport Barriers: Language barriers Barriers: Housing situation Barriers: Age Barriers: Lack of access to internet or technology |
| Benefit receipt at baseline | Whether on employment or means-tested benefits (JSA, WTC, IS, CA, HB) Whether on non-means tested disability benefits (PIP, DLA) |
| Long-term illness or disability at baseline | Whether has a physical health condition Whether has mental health condition Whether has a learning difficulty or is neurodiverse Whether has a condition that reduces ability to do things |
| Mental health at baseline | Whether any mental health issues in three months prior Whether mental health issues have impact on life |
| Use of health services at baseline | How often visited GP in three months prior to baseline How often visited mental health services in three months prior How often visited A&E in three months prior How often visited outpatients in three months prior |
| Support from others prior to baseline | Whether received help or support from others in 3 months prior to baseline |
| Demographics at baseline | Age band Gender Ethnic group Highest qualification Whether living as couple Whether has dependent children Marital status Whether anyone in household is in employment Family type (DWP data) Whether had access to internet at baseline |
| Other sample file variables | Cohort of sample Region Claim length (grouped) Labour market history (grouped) Average earnings (grouped) |
The PSM was repeated for the sub-group of customers who recalled having seen a work-coach. In addition, separate matching exercises were undertaken for each of the sub-groups that are reported on, using the same general approach. However, for sub-groups where the sample size was small, at less than 100 in one or both of the AWCS or comparison groups, the PSM models were often found to be unstable and the estimates of impact very sensitive to small changes in the model specifications. To deal with this, for these small sub-groups, the all-sample PSM weights were applied to generate the estimate of impact for these groups, rather than using their sub-group specific PSM weights.
A reasonable test of whether the propensity score matching has generated a good matched control group is simply to compare the profiles of the two groups: treatment and matched control. The matching can be judged to have been successful if the differences between these two groups are small and if there are no significant differences between the two groups on any of the matching variables – which is the case.
Tables C.3 and C.4 shows the profile of the treatment and matched control groups for the pre-WCA and LCW/WRAG groups respectively. For each table:
- The first data column (column A) shows the treatment AWCS profile;
- Column B shows the comparison group prior to the PSM;
- Column C shows the pre-existing differences between the two groups prior to the PSM;
- Column D shows the p-value for the difference between the AWCS and comparison groups just with the non-response weights, based on chi-squared tests;
- Column E shows the comparison group after the PSM weights have been applied;
- Column F shows the difference between the AWCS and PSM weighted comparison groups. Most of these differences are very small;
- Column G shows the p-value for the difference between the AWCS and PSM weighted comparison groups. All of the p-values are high, and well above the 0.05 threshold for significance which suggests a very good match between the group.
Table C.3: Baseline differences between the AWCS and comparison groups before and after the propensity score matching – pre-WCA group
| A: AWCS group non-response weighted % | B: Comparison group unweighted % | C: pp diff before PSM | D: p-value before PSM | E: Comparison group psm weighted % | F: PP diff after PSM | G: p-value after PSM | |
|---|---|---|---|---|---|---|---|
| Length of time unemployed | [No data] | [No data] | [No data] | <0.001 | [No data] | [No data] | 0.941 |
| Currently working inc zero hours | 14 | 20 | -6 | [No data] | 14 | 0 | [No data] |
| Less than six months ago | 17 | 10 | 7 | [No data] | 16 | 1 | [No data] |
| Between six months less than a year | 18 | 18 | 0 | [No data] | 18 | 0 | [No data] |
| Between a year less than three years | 15 | 16 | -1 | [No data] | 17 | -2 | [No data] |
| Between three years less than five years | 6 | 6 | 0 | [No data] | 6 | 0 | [No data] |
| Between five years less than 10 years | 6 | 4 | 2 | [No data] | 5 | 1 | [No data] |
| 10 years or more | 9 | 9 | -1 | [No data] | 8 | 0 | [No data] |
| Never worked/not stated | 14 | 16 | -2 | [No data] | 15 | -1 | [No data] |
| A: AWCS group non-response weighted % | B: Comparison group unweighted % | C: pp diff before PSM | D: p-value before PSM | E: Comparison group psm weighted % | F: PP diff after PSM | G: p-value after PSM | |
|---|---|---|---|---|---|---|---|
| Employment status at baseline | [No data] | [No data] | [No data] | <0.001 | [No data] | [No data] | 0.998 |
| Never worked and not working at baseline | 13 | 14 | -1 | [No data] | 13 | 0 | [No data] |
| Employed | 15 | 18 | -3 | [No data] | 15 | 0 | [No data] |
| Self employed | 4 | 6 | -2 | [No data] | 4 | 0 | [No data] |
| Unemployed | 67 | 59 | 8 | [No data] | 67 | 0 | [No data] |
| Other/not stated | 2 | 3 | -1 | [No data] | 2 | 0 | [No data] |
| A: AWCS group non-response weighted % | B: Comparison group unweighted % | C: pp diff before PSM | D: p-value before PSM | E: Comparison group psm weighted % | F: PP diff after PSM | G: p-value after PSM | |
|---|---|---|---|---|---|---|---|
| Employment hours at baseline | [No data] | [No data] | 0.017 | [No data] | [No data] | 0.753 | |
| Working fewer 16 hours | 6 | 7 | -2 | [No data] | 6 | 0 | [No data] |
| Working 16 to 30 hours | 6 | 8 | -2 | [No data] | 6 | -1 | [No data] |
| Working 31 hours or more | 5 | 6 | -2 | [No data] | 4 | 0 | [No data] |
| Working hours not given | 3 | 2 | 0 | [No data] | 2 | 1 | [No data] |
| Not working/not stated | 82 | 76 | 5 | [No data] | 82 | 0 | [No data] |
| A: AWCS group non-response weighted % | B: Comparison group unweighted % | C: pp diff before PSM | D: p-value before PSM | E: Comparison group psm weighted % | F: PP diff after PSM | G: p-value after PSM | |
|---|---|---|---|---|---|---|---|
| Summary of work history | [No data] | [No data] | [No data] | 0.091 | [No data] | [No data] | 0.938 |
| I have never been in paid employment | 13 | 14 | -1 | [No data] | 13 | 0 | [No data] |
| I have mostly been out of paid employment | 20 | 17 | 4 | [No data] | 19 | 1 | [No data] |
| I have spent about as much time in employment as out of paid employment | 14 | 13 | 1 | [No data] | 15 | -1 | [No data] |
| I have mostly been in paid employment during my working life | 50 | 54 | -4 | [No data] | 51 | -1 | [No data] |
| Don’t know/prefer not to say | 3 | 2 | 1 | [No data] | 3 | 0 | [No data] |
| A: AWCS group non-response weighted % | B: Comparison group unweighted % | C: pp diff before PSM | D: p-value before PSM | E: Comparison group psm weighted % | F: PP diff after PSM | G: p-value after PSM | |
|---|---|---|---|---|---|---|---|
| Training in month before baseline | [No data] | [No data] | [No data] | 0.026 | [No data] | [No data] | 0.622 |
| No/not stated | 89 | 92 | -3 | [No data] | 90 | -1 | [No data] |
| Yes | 11 | 8 | 3 | [No data] | 10 | 1 | [No data] |
| Volunteering in month before baseline | [No data] | [No data] | [No data] | 0.678 | [No data] | [No data] | 0.611 |
| No/not stated | 94 | 95 | 0 | [No data] | 94 | 1 | [No data] |
| Yes | 6 | 5 | 0 | [No data] | 6 | -1 | [No data] |
| A: AWCS group non-response weighted % | B: Comparison group unweighted % | C: pp diff before PSM | D: p-value before PSM | E: Comparison group psm weighted % | F: PP diff after PSM | G: p-value after PSM | |
|---|---|---|---|---|---|---|---|
| Whether looking for work in month before baseline | [No data] | [No data] | [No data] | <0.001 | [No data] | [No data] | 0.910 |
| Yes | 29 | 18 | 11 | [No data] | 29 | 1 | [No data] |
| No/not stated | 66 | 76 | -9 | [No data] | 67 | -1 | [No data] |
| Already working 30 hours or more | 5 | 6 | -2 | [No data] | 4 | 0 | [No data] |
| Number of vacancies applied for | [No data] | [No data] | [No data] | <0.001 | [No data] | [No data] | 0.644 |
| Not doing Job-Search | 66 | 76 | -9 | [No data] | 67 | -1 | [No data] |
| Up to 5 vacancies | 11 | 6 | 5 | [No data] | 9 | 2 | [No data] |
| 6 to 10 vacancies | 4 | 3 | 1 | [No data] | 5 | -1 | [No data] |
| 11 or more vacancies | 7 | 5 | 2 | [No data] | 8 | -1 | [No data] |
| Do not know/prefer not to say | 8 | 4 | 3 | [No data] | 7 | 1 | [No data] |
| Already working 30 hours or more | 5 | 6 | -2 | [No data] | 4 | 0 | [No data] |
| A: AWCS group non-response weighted % | B: Comparison group unweighted % | C: pp diff before PSM | D: p-value before PSM | E: Comparison group psm weighted % | F: PP diff after PSM | G: p-value after PSM | |
|---|---|---|---|---|---|---|---|
| Number of hours of Job-Search | [No data] | [No data] | [No data] | <0.001 | [No data] | [No data] | 0.992 |
| Not doing Job-Search | 66 | 76 | -9 | [No data] | 67 | -1 | [No data] |
| 5 or fewer | 7 | 4 | 3 | [No data] | 7 | 0 | [No data] |
| 6 to 20 | 10 | 6 | 3 | [No data] | 10 | 0 | [No data] |
| 21 or more | 5 | 3 | 2 | [No data] | 5 | 0 | [No data] |
| Do not know/prefer not to say | 7 | 4 | 2 | [No data] | 6 | 1 | [No data] |
| Already working 30 hours or more | 5 | 6 | -2 | [No data] | 4 | 0 | [No data] |
| A: AWCS group non-response weighted % | B: Comparison group unweighted % | C: pp diff before PSM | D: p-value before PSM | E: Comparison group psm weighted % | F: PP diff after PSM | G: p-value after PSM | |
|---|---|---|---|---|---|---|---|
| Perception about ability to work at baseline | [No data] | [No data] | [No data] | <0.001 | [No data] | [No data] | 0.999 |
| Ruled out now and in future | 12 | 21 | -9 | [No data] | 12 | 0 | [No data] |
| Unable but might be able to in future | 47 | 39 | 8 | [No data] | 48 | 0 | [No data] |
| Could return with right job or support | 11 | 6 | 5 | [No data] | 11 | 1 | [No data] |
| Do not know/prefer not to say | 3 | 2 | 1 | [No data] | 3 | 0 | [No data] |
| Working with illness or disability | 15 | 20 | -4 | [No data] | 15 | 0 | [No data] |
| Working with no illness or disability | 3 | 3 | -1 | [No data] | 3 | 0 | [No data] |
| Not working and no illness or disability or not stated | 10 | 9 | 1 | [No data] | 9 | 0 | [No data] |
| A: AWCS group non-response weighted % | B: Comparison group unweighted % | C: pp diff before PSM | D: p-value before PSM | E: Comparison group psm weighted % | F: PP diff after PSM | G: p-value after PSM | |
|---|---|---|---|---|---|---|---|
| I am/would be happier and more fulfilled when/if working | [No data] | [No data] | [No data] | 0.045 | [No data] | [No data] | 0.985 |
| Strongly disagree | 12 | 15 | -3 | [No data] | 12 | 0 | [No data] |
| Disagree | 14 | 17 | -3 | [No data] | 15 | -1 | [No data] |
| Neither agree nor disagree | 18 | 16 | 2 | [No data] | 17 | 1 | [No data] |
| Agree | 25 | 23 | 2 | [No data] | 25 | 0 | [No data] |
| Strongly agree | 26 | 25 | 1 | [No data] | 26 | 0 | [No data] |
| Do not know/prefer not to say | 4 | 4 | 0 | [No data] | 4 | 0 | [No data] |
| A: AWCS group non-response weighted % | B: Comparison group unweighted % | C: pp diff before PSM | D: p-value before PSM | E: Comparison group psm weighted % | F: PP diff after PSM | G: p-value after PSM | |
|---|---|---|---|---|---|---|---|
| My work can/could accommodate my health / disability needs | [No data] | [No data] | [No data] | <0.001 | [No data] | [No data] | 0.964 |
| Strongly disagree | 21 | 30 | -9 | [No data] | 23 | -1 | [No data] |
| Disagree | 25 | 26 | -1 | [No data] | 24 | 1 | [No data] |
| Neither agree nor disagree | 18 | 14 | 4 | [No data] | 18 | 0 | [No data] |
| Agree | 17 | 13 | 3 | [No data] | 17 | 0 | [No data] |
| Strongly agree | 11 | 10 | 1 | [No data] | 11 | 0 | [No data] |
| Do not know/prefer not to say | 9 | 7 | 2 | [No data] | 8 | 1 | [No data] |
| A: AWCS group non-response weighted % | B: Comparison group unweighted % | C: pp diff before PSM | D: p-value before PSM | E: Comparison group psm weighted % | F: PP diff after PSM | G: p-value after PSM | |
|---|---|---|---|---|---|---|---|
| Having a job is/would be beneficial for my health | [No data] | [No data] | [No data] | 0.001 | [No data] | [No data] | 0.623 |
| Strongly disagree | 21 | 26 | -5 | [No data] | 21 | 0 | [No data] |
| Disagree | 18 | 21 | -3 | [No data] | 20 | -2 | [No data] |
| Neither agree nor disagree | 17 | 13 | 4 | [No data] | 14 | 2 | [No data] |
| Agree | 22 | 17 | 5 | [No data] | 21 | 1 | [No data] |
| Strongly agree | 18 | 18 | 0 | [No data] | 18 | 0 | [No data] |
| Do not know/prefer not to say | 5 | 5 | 0 | [No data] | 6 | -1 | [No data] |
| A: AWCS group non-response weighted % | B: Comparison group unweighted % | C: pp diff before PSM | D: p-value before PSM | E: Comparison group psm weighted % | F: PP diff after PSM | G: p-value after PSM | |
|---|---|---|---|---|---|---|---|
| I know how to present myself and my health condition or disability in my CV or at interviews | [No data] | [No data] | [No data] | 0.121 | [No data] | [No data] | 0.965 |
| Strongly disagree | 15 | 18 | -3 | [No data] | 16 | 0 | [No data] |
| Disagree | 18 | 18 | 0 | [No data] | 19 | 0 | [No data] |
| Neither agree nor disagree | 16 | 14 | 2 | [No data] | 15 | 1 | [No data] |
| Agree | 26 | 23 | 3 | [No data] | 25 | 1 | [No data] |
| Strongly agree | 17 | 18 | -1 | [No data] | 18 | -1 | [No data] |
| Do not know/prefer not to say | 7 | 9 | -2 | [No data] | 8 | -1 | [No data] |
| A: AWCS group non-response weighted % | B: Comparison group unweighted % | C: pp diff before PSM | D: p-value before PSM | E: Comparison group psm weighted % | F: PP diff after PSM | G: p-value after PSM | |
|---|---|---|---|---|---|---|---|
| Worried would not employ because of condition | [No data] | [No data] | [No data] | 0.029 | [No data] | [No data] | 0.818 |
| Strongly disagree | 5 | 5 | 0 | [No data] | 5 | 0 | [No data] |
| Disagree | 10 | 8 | 2 | [No data] | 8 | 2 | [No data] |
| Neither agree nor disagree | 10 | 7 | 3 | [No data] | 8 | 2 | [No data] |
| Agree | 20 | 20 | 0 | [No data] | 22 | -2 | [No data] |
| Strongly agree | 24 | 24 | 0 | [No data] | 26 | -1 | [No data] |
| Do not know/prefer not to say | 3 | 4 | -1 | [No data] | 4 | 0 | [No data] |
| Currently working with illness or disability | 15 | 20 | -4 | [No data] | 15 | 0 | [No data] |
| Currently working with no illness or disability | 3 | 3 | -1 | [No data] | 3 | 0 | [No data] |
| Currently not working and no illness or disability | 10 | 9 | 1 | [No data] | 9 | 0 | [No data] |
| A: AWCS group non-response weighted % | B: Comparison group unweighted % | C: pp diff before PSM | D: p-value before PSM | E: Comparison group psm weighted % | F: PP diff after PSM | G: p-value after PSM | |
|---|---|---|---|---|---|---|---|
| Worried work would make my condition worse | [No data] | [No data] | 0.032 | [No data] | [No data] | 0.912 | |
| Strongly disagree | 4 | 4 | 1 | [No data] | 4 | 0 | [No data] |
| Disagree | 4 | 5 | -1 | [No data] | 6 | -1 | [No data] |
| Neither agree nor disagree | 8 | 5 | 2 | [No data] | 6 | 2 | [No data] |
| Agree | 22 | 19 | 3 | [No data] | 22 | 0 | [No data] |
| Strongly agree | 32 | 33 | -1 | [No data] | 32 | 0 | [No data] |
| Do not know/prefer not to say | 2 | 2 | 0 | [No data] | 2 | 0 | [No data] |
| Currently working with illness or disability | 15 | 20 | -4 | [No data] | 15 | 0 | [No data] |
| Currently working with no illness or disability | 3 | 3 | -1 | [No data] | 3 | 0 | [No data] |
| Currently not working and no illness or disability | 10 | 9 | 1 | [No data] | 9 | 0 | [No data] |
| A: AWCS group non-response weighted % | B: Comparison group unweighted % | C: pp diff before PSM | D: p-value before PSM | E: Comparison group psm weighted % | F: PP diff after PSM | G: p-value after PSM | |
|---|---|---|---|---|---|---|---|
| Worried work would make my condition worse | [No data] | [No data] | [No data] | 0.023 | [No data] | [No data] | 0.953 |
| Strongly disagree | 3 | 3 | -1 | [No data] | 3 | 0 | [No data] |
| Disagree | 5 | 5 | 0 | [No data] | 5 | 0 | [No data] |
| Neither agree nor disagree | 8 | 5 | 3 | [No data] | 6 | 2 | [No data] |
| Agree | 22 | 20 | 2 | [No data] | 23 | 0 | [No data] |
| Strongly agree | 32 | 33 | -1 | [No data] | 34 | -1 | [No data] |
| Do not know/prefer not to say | 2 | 2 | 0 | [No data] | 2 | 0 | [No data] |
| Currently working with illness or disability | 15 | 20 | -4 | [No data] | 15 | 0 | [No data] |
| Currently working with no illness or disability | 3 | 3 | -1 | [No data] | 3 | 0 | [No data] |
| Currently not working and no illness or disability | 10 | 9 | 1 | [No data] | 9 | 0 | [No data] |
| Barriers that made it difficult for you to gain or maintain employment in month before baseline | A: AWCS group non-response weighted % | B: Comparison group unweighted % | C: pp diff before PSM | D: p-value before PSM | E: Comparison group psm weighted % | F: PP diff after PSM | G: p-value after PSM |
|---|---|---|---|---|---|---|---|
| Lack of skills or recent experience | 8 | 5 | 3 | 0.004 | 7 | 2 | 0.175 |
| Lack of jobs available | 6 | 6 | 0 | 0.697 | 7 | -2 | 0.177 |
| Physical or mental health issues | 88 | 88 | 0 | 0.769 | 87 | 1 | 0.508 |
| Family or caring commitments | 10 | 9 | 1 | 0.297 | 10 | 0 | 0.926 |
| Problems with transport or the cost of transport to get to a job | 7 | 5 | 2 | 0.102 | 6 | 1 | 0.593 |
| Language barriers/English is my second language | 3 | 3 | 1 | 0.471 | 3 | 0 | 0.991 |
| Housing situation (e.g., experiencing homelessness or sofa surfing / staying temporarily with family or friends) | 4 | 3 | 1 | 0.057 | 4 | 0 | 0.588 |
| Your age | 3 | 4 | 0 | 0.556 | 4 | -1 | 0.314 |
| Lack of access to internet or technology | 2 | 1 | 0 | 0.389 | 2 | 0 | 0.717 |
| A: AWCS group non-response weighted % | B: Comparison group unweighted % | C: pp diff before PSM | D: p-value before PSM | E: Comparison group psm weighted % | F: PP diff after PSM | G: p-value after PSM | |
|---|---|---|---|---|---|---|---|
| Type of benefit claimed | [No data] | [No data] | [No data] | <0.001 | [No data] | [No data] | 0.504 |
| UC | 97 | 93 | 4 | [No data] | 97 | 0 | [No data] |
| ESA | 3 | 7 | -4 | [No data] | 3 | 0 | [No data] |
| A: AWCS group non-response weighted % | B: Comparison group unweighted % | C: pp diff before PSM | D: p-value before PSM | E: Comparison group psm weighted % | F: PP diff after PSM | G: p-value after PSM | |
|---|---|---|---|---|---|---|---|
| Whether on employment or other means tested benefit JSA WTC IS CA HB CT support at baseline | [No data] | [No data] | [No data] | 0.718 | [No data] | [No data] | 0.095 |
| On employment or means tested benefit | 37 | 38 | -1 | 41 | -4 | ||
| Whether on non means tested disability benefit PIP DLA ADP IIB at baseline | [No data] | [No data] | [No data] | 0.001 | [No data] | [No data] | 0.543 |
| On non means tested disability benefit | 23 | 29 | -6 | [No data] | 24 | -1 | [No data] |
| A: AWCS group non-response weighted % | B: Comparison group unweighted % | C: pp diff before PSM | D: p-value before PSM | E: Comparison group psm weighted % | F: PP diff after PSM | G: p-value after PSM | |
|---|---|---|---|---|---|---|---|
| Whether on any benefit except UC or ESA at baseline | [No data] | [No data] | 0.605 | [No data] | [No data] | 0.672 | |
| On a benefit other than UC or ESA | 59 | 60 | -1 | [No data] | 60 | -1 | [No data] |
| A: AWCS group non-response weighted % | B: Comparison group unweighted % | C: pp diff before PSM | D: p-value before PSM | E: Comparison group psm weighted % | F: PP diff after PSM | G: p-value after PSM | |
|---|---|---|---|---|---|---|---|
| Whether has a physical health condition at baseline | [No data] | [No data] | [No data] | 0.103 | [No data] | [No data] | 0.904 |
| Yes | 63 | 67 | -3 | [No data] | 63 | 0 | [No data] |
| A: AWCS group non-response weighted % | B: Comparison group unweighted % | C: pp diff before PSM | D: p-value before PSM | E: Comparison group psm weighted % | F: PP diff after PSM | G: p-value after PSM | |
|---|---|---|---|---|---|---|---|
| Whether has a mental health condition at baseline | [No data] | [No data] | [No data] | 0.03 | [No data] | [No data] | 0.223 |
| Yes | 57 | 53 | 4 | [No data] | 54 | 3 | [No data] |
| A: AWCS group non-response weighted % | B: Comparison group unweighted % | C: pp diff before PSM | D: p-value before PSM | E: Comparison group psm weighted % | F: PP diff after PSM | G: p-value after PSM | |
|---|---|---|---|---|---|---|---|
| Whether has a learning difficulty or neurodiverse at baseline | [No data] | [No data] | [No data] | 0.697 | [No data] | [No data] | 0.516 |
| Yes | 15 | 16 | -1 | [No data] | 16 | -1 | [No data] |
| A: AWCS group non-response weighted % | B: Comparison group unweighted % | C: pp diff before PSM | D: p-value before PSM | E: Comparison group psm weighted % | F: PP diff after PSM | G: p-value after PSM | |
|---|---|---|---|---|---|---|---|
| Whether has a condition which reduces ability to do things at baseline | [No data] | [No data] | 0.684 | [No data] | [No data] | 0.9 | |
| No health condition or disability | 12 | 12 | 0 | [No data] | 12 | 0 | [No data] |
| Condition reduces ability a lot | 70 | 71 | -2 | [No data] | 68 | 2 | [No data] |
| Condition reduces ability a little | 15 | 13 | 2 | [No data] | 16 | -1 | [No data] |
| Condition does not reduce ability | 3 | 3 | 0 | [No data] | 3 | 0 | [No data] |
| Prefer not to say how much | 0 | 0 | 0 | [No data] | 1 | 0 | [No data] |
| A: AWCS group non-response weighted % | B: Comparison group unweighted % | C: pp diff before PSM | D: p-value before PSM | E: Comparison group psm weighted % | F: PP diff after PSM | G: p-value after PSM | |
|---|---|---|---|---|---|---|---|
| Whether any mental health issues in three months prior to baseline | [No data] | [No data] | [No data] | 0.542 | [No data] | [No data] | 0.635 |
| Yes/prefer not to say | 88 | 88 | 1 | [No data] | 88 | 1 | [No data] |
| Issues experienced in the three months before baseline | A: AWCS group non-response weighted % | B: Comparison group unweighted % | C: pp diff before PSM | D: p-value before PSM | E: Comparison group psm weighted % | F: PP diff after PSM | G: p-value after PSM |
|---|---|---|---|---|---|---|---|
| Anxiety and/or panic attacks | 72 | 72 | 0 | 0.982 | 72 | 0 | 0.826 |
| Depression | 70 | 69 | 1 | 0.684 | 69 | 0 | 0.934 |
| Stress | 79 | 77 | 2 | 0.304 | 78 | 1 | 0.572 |
| A: AWCS group non-response weighted % | B: Comparison group unweighted % | C: pp diff before PSM | D: p-value before PSM | E: Comparison group psm weighted % | F: PP diff after PSM | G: p-value after PSM | |
|---|---|---|---|---|---|---|---|
| Whether mental health issues have impact on life at baseline | [No data] | [No data] | [No data] | 0.788 | [No data] | [No data] | 0.863 |
| No mental health issues or not said | 12 | 13 | -1 | [No data] | 13 | 0 | [No data] |
| Issues which impact a great deal | 55 | 56 | -1 | [No data] | 54 | 2 | [No data] |
| Issues which impact to some extent | 23 | 21 | 2 | [No data] | 23 | 0 | [No data] |
| Issues which do not impact at all/not stated | 10 | 10 | 0 | [No data] | 11 | -1 | [No data] |
| A: AWCS group non-response weighted % | B: Comparison group unweighted % | C: pp diff before PSM | D: p-value before PSM | E: Comparison group psm weighted % | F: PP diff after PSM | G: p-value after PSM | |
|---|---|---|---|---|---|---|---|
| Contact with GP surgery in three months prior to baseline | [No data] | [No data] | [No data] | 0.369 | [No data] | [No data] | 0.81 |
| Yes | 89 | 90 | -1 | [No data] | 89 | 0 | [No data] |
| A: AWCS group non-response weighted % | B: Comparison group unweighted % | C: pp diff before PSM | D: p-value before PSM | E: Comparison group psm weighted % | F: PP diff after PSM | G: p-value after PSM | |
|---|---|---|---|---|---|---|---|
| Contact with a mental health service in three months prior to baseline | [No data] | [No data] | [No data] | 0.262 | [No data] | [No data] | 0.872 |
| Yes | 30 | 33 | -2 | [No data] | 30 | 0 | [No data] |
| A: AWCS group non-response weighted % | B: Comparison group unweighted % | C: pp diff before PSM | D: p-value before PSM | E: Comparison group psm weighted % | F: PP diff after PSM | G: p-value after PSM | |
|---|---|---|---|---|---|---|---|
| Contact with A&E in three months prior to baseline | [No data] | [No data] | [No data] | 0.103 | [No data] | [No data] | 0.781 |
| Yes | 22 | 25 | -3 | [No data] | 23 | 0 | [No data] |
| A: AWCS group non-response weighted % | B: Comparison group unweighted % | C: pp diff before PSM | D: p-value before PSM | E: Comparison group psm weighted % | F: PP diff after PSM | G: p-value after PSM | |
|---|---|---|---|---|---|---|---|
| Contact with a hospital outpatients service in three months prior to baseline | [No data] | [No data] | [No data] | <0.001 | [No data] | [No data] | 0.714 |
| Yes | 41 | 50 | -9 | [No data] | 42 | -1 | [No data] |
| A: AWCS group non-response weighted % | B: Comparison group unweighted % | C: pp diff before PSM | D: p-value before PSM | E: Comparison group psm weighted % | F: PP diff after PSM | G: p-value after PSM | |
|---|---|---|---|---|---|---|---|
| In receipt of help or support from elsewhere in three months prior to baseline | [No data] | [No data] | [No data] | 0.018 | [No data] | [No data] | 0.358 |
| Yes | 52 | 57 | -5 | [No data] | 55 | -2 | [No data] |
| A: AWCS group non-response weighted % | B: Comparison group unweighted % | C: pp diff before PSM | D: p-value before PSM | E: Comparison group psm weighted % | F: PP diff after PSM | G: p-value after PSM | |
|---|---|---|---|---|---|---|---|
| Age group | [No data] | [No data] | [No data] | <0.001 | [No data] | [No data] | 0.997 |
| 16 to 25 | 17 | 18 | -1 | [No data] | 17 | 0 | [No data] |
| 26 to 35 | 23 | 17 | 6 | [No data] | 23 | 0 | [No data] |
| 36 to 45 | 27 | 21 | 6 | [No data] | 26 | 0 | [No data] |
| 46 to 55 | 19 | 23 | -3 | [No data] | 19 | 0 | [No data] |
| 56 to 65 | 14 | 22 | -7 | [No data] | 15 | -1 | [No data] |
| A: AWCS group non-response weighted % | B: Comparison group unweighted % | C: pp diff before PSM | D: p-value before PSM | E: Comparison group psm weighted % | F: PP diff after PSM | G: p-value after PSM | |
|---|---|---|---|---|---|---|---|
| Gender | [No data] | [No data] | [No data] | 0.086 | [No data] | [No data] | 0.275 |
| Male | 46 | 50 | -4 | [No data] | 49 | -2 | [No data] |
| Female | 54 | 50 | 4 | [No data] | 51 | 2 | [No data] |
| A: AWCS group non-response weighted % | B: Comparison group unweighted % | C: pp diff before PSM | D: p-value before PSM | E: Comparison group psm weighted % | F: PP diff after PSM | G: p-value after PSM | |
|---|---|---|---|---|---|---|---|
| Ethnic group | [No data] | [No data] | [No data] | 0.025 | [No data] | [No data] | 0.649 |
| White | 70 | 76 | -6 | [No data] | 72 | -1 | [No data] |
| Mixed or multiple ethnic groups | 4 | 4 | 0 | [No data] | 5 | -1 | [No data] |
| Asian or Asian British | 11 | 9 | 2 | [No data] | 10 | 1 | [No data] |
| Black or Black British | 7 | 6 | 1 | [No data] | 7 | 0 | [No data] |
| Another ethnic group | 5 | 3 | 2 | [No data] | 4 | 1 | [No data] |
| Do not know/prefer not to say | 2 | 2 | 0 | [No data] | 3 | 0 | [No data] |
| A: AWCS group non-response weighted % | B: Comparison group unweighted % | C: pp diff before PSM | D: p-value before PSM | E: Comparison group psm weighted % | F: PP diff after PSM | G: p-value after PSM | |
|---|---|---|---|---|---|---|---|
| Highest qualification | [No data] | [No data] | [No data] | 0.316 | [No data] | [No data] | 0.562 |
| Entry level qualification | 3 | 2 | 0 | [No data] | 3 | 0 | [No data] |
| LEVEL 1 qualifications | 9 | 9 | -1 | [No data] | 10 | -1 | [No data] |
| LEVEL 2 | 25 | 21 | 4 | [No data] | 21 | 4 | [No data] |
| LEVEL 3 | 16 | 18 | -2 | [No data] | 17 | -1 | [No data] |
| LEVEL 4 | 4 | 3 | 0 | [No data] | 4 | 0 | [No data] |
| LEVEL 5 or above | 15 | 14 | 1 | [No data] | 14 | 1 | [No data] |
| Don’t know / Prefer not to say | 10 | 10 | 0 | [No data] | 11 | 0 | [No data] |
| No formal qualifications | 18 | 21 | -3 | [No data] | 20 | -2 |
| A: AWCS group non-response weighted % | B: Comparison group unweighted % | C: pp diff before PSM | D: p-value before PSM | E: Comparison group psm weighted % | F: PP diff after PSM | G: p-value after PSM | |
|---|---|---|---|---|---|---|---|
| Living as a couple | [No data] | [No data] | [No data] | 0.740 | [No data] | [No data] | 0.917 |
| Yes | 19 | 18 | 1 | [No data] [No data] | 19 | 0 | [No data] |
| No | 81 | 82 | -1 | 81 | 0 | [No data] |
| A: AWCS group non-response weighted % | B: Comparison group unweighted % | C: pp diff before PSM | D: p-value before PSM | E: Comparison group psm weighted % | F: PP diff after PSM | G: p-value after PSM | |
|---|---|---|---|---|---|---|---|
| Has dependent children | [No data] | [No data] | [No data] | 0.003 | [No data] | [No data] | 0.364 |
| Yes | 31 | 26 | 6 | [No data] | 29 | 2 | [No data] |
| No | 69 | 74 | -6 | [No data] | 71 | -2 | [No data] |
| A: AWCS group non-response weighted % | B: Comparison group unweighted % | C: pp diff before PSM | D: p-value before PSM | E: Comparison group psm weighted % | F: PP diff after PSM | G: p-value after PSM | |
|---|---|---|---|---|---|---|---|
| Marital status | [No data] | [No data] | [No data] | 0.082 | [No data] | [No data] | 0.847 |
| Never married and never registered a civil partnership (includes living with a partner) | 63 | 58 | 5 | [No data] | 62 | 1 | [No data] |
| Married/in a registered civil partnership | 18 | 20 | -2 | [No data] | 18 | 0 | [No data] |
| Separated | 6 | 6 | 0 | [No data] | 6 | 1 | [No data] |
| Divorced | 10 | 13 | -3 | [No data] | 11 | -1 | [No data] |
| Widowed | 2 | 3 | -1 | [No data] | 2 | 0 | [No data] |
| Prefer not to say | 1 | 1 | 0 | [No data] | 1 | 0 | [No data] |
| A: AWCS group non-response weighted % | B: Comparison group unweighted % | C: pp diff before PSM | D: p-value before PSM | E: Comparison group psm weighted % | F: PP diff after PSM | G: p-value after PSM | |
|---|---|---|---|---|---|---|---|
| Anyone in household in employment | [No data] | [No data] | [No data] | 0.298 | [No data] | [No data] | 0.267 |
| Yes, someone in full-time paid employment | 20 | 20 | 0 | [No data] | 19 | 1 | [No data] |
| Yes, someone in part-time paid employment | 9 | 9 | -1 | [No data] | 9 | 0 | [No data] |
| No, no one in paid employment | 41 | 44 | -3 | [No data] | 46 | -5 | [No data] |
| No one living in household | 27 | 24 | 3 | [No data] | 24 | 4 | [No data] |
| Don’t know / Prefer not to say | 3 | 2 | 1 | [No data] | 3 | 0 | [No data] |
| A: AWCS group non-response weighted % | B: Comparison group unweighted % | C: pp diff before PSM | D: p-value before PSM | E: Comparison group psm weighted % | F: PP diff after PSM | G: p-value after PSM | |
|---|---|---|---|---|---|---|---|
| Family type | [No data] | [No data] | [No data] | 0.018 | [No data] | [No data] | 0.669 |
| Single, no children | 62 | 67 | -5 | [No data] | 65 | -2 | [No data] |
| Single, with children | 19 | 14 | 4 | [No data] | 17 | 2 | [No data] |
| Couple, no children | 6 | 7 | -1 | [No data] | 6 | 0 | [No data] |
| Couple, with children | 13 | 11 | 1 | [No data] | 13 | 0 | [No data] |
| A: AWCS group non-response weighted % | B: Comparison group unweighted % | C: pp diff before PSM | D: p-value before PSM | E: Comparison group psm weighted % | F: PP diff after PSM | G: p-value after PSM | |
|---|---|---|---|---|---|---|---|
| Access to the internet | [No data] | [No data] | [No data] | 0.048 | [No data] | [No data] | 0.340 |
| No | 2 | 3 | -1 | [No data] | 3 | -1 | [No data] |
| Yes/not stated | 98 | 97 | 1 | [No data] | 97 | 1 | [No data] |
| A: AWCS group non-response weighted % | B: Comparison group unweighted % | C: pp diff before PSM | D: p-value before PSM | E: Comparison group psm weighted % | F: PP diff after PSM | G: p-value after PSM | |
|---|---|---|---|---|---|---|---|
| Region | [No data] | [No data] | [No data] | 0.354 | [No data] | [No data] | 0.606 |
| East Midlands | 6 | 7 | -1 | [No data] | 8 | -2 | [No data] |
| East of England | 9 | 10 | -1 | [No data] | 11 | -1 | [No data] |
| London | 14 | 13 | 1 | [No data] | 14 | -1 | [No data] |
| North East | 7 | 6 | 1 | [No data] | 6 | 1 | [No data] |
| North West | 12 | 14 | -2 | [No data] | 12 | 0 | [No data] |
| South East | 10 | 11 | -1 | [No data] | 10 | 0 | [No data] |
| South West | 8 | 7 | 1 | [No data] | 6 | 2 | [No data] |
| West Midlands | 12 | 11 | 1 | [No data] | 11 | 1 | [No data] |
| Yorkshire and The Humber | 8 | 9 | -2 | [No data] | 9 | -1 | [No data] |
| Scotland | 7 | 6 | 1 | [No data] | 7 | 0 | [No data] |
| Wales |
| A: AWCS group non-response weighted % | B: Comparison group unweighted % | C: pp diff before PSM | D: p-value before PSM | E: Comparison group psm weighted % | F: PP diff after PSM | G: p-value after PSM | |
|---|---|---|---|---|---|---|---|
| Sample cohort | [No data] | [No data] | [No data] | <0.001 | [No data] | [No data] | 0.993 |
| Cohort 1 | 24 | 20 | 5 | [No data] | 24 | 0 | [No data] |
| Cohort 2 | 29 | 25 | 4 | [No data] | 30 | 0 | [No data] |
| Cohort 3 | 25 | 30 | -5 | [No data] | 25 | 1 | [No data] |
| Cohort 4 | 21 | 25 | -4 | [No data] | 22 | 0 | [No data] |
| A: AWCS group non-response weighted % | B: Comparison group unweighted % | C: pp diff before PSM | D: p-value before PSM | E: Comparison group psm weighted % | F: PP diff after PSM | G: p-value after PSM | |
|---|---|---|---|---|---|---|---|
| Claim length banded | [No data] | [No data] | [No data] | <0.001 | [No data] | [No data] | 0.991 |
| Up to 3 months | 18 | 12 | 6 | [No data] | 17 | 1 | [No data] |
| 3 to 6 months | 23 | 32 | -9 | [No data] | 23 | 0 | [No data] |
| 6 to 12 months | 14 | 19 | -5 | [No data] | 14 | 0 | [No data] |
| 12 to 24 months | 11 | 13 | -1 | [No data] | 11 | 0 | [No data] |
| 2 to 3 years | 8 | 6 | 2 | [No data] | 8 | 0 | [No data] |
| More than 3 years | 26 | 18 | 8 | [No data] | 27 | -1 | [No data] |
| A: AWCS group non-response weighted % | B: Comparison group unweighted % | C: pp diff before PSM | D: p-value before PSM | E: Comparison group psm weighted % | F: PP diff after PSM | G: p-value after PSM | |
|---|---|---|---|---|---|---|---|
| Number of months in previous year when customer worked (DWP data) | [No data] | [No data] | [No data] | <0.001 | [No data] | [No data] | 0.686 |
| 0 | 55 | 61 | -7 | [No data] | 56 | -1 | [No data] |
| 1 to 5 | 13 | 11 | 2 | [No data] | 13 | 0 | [No data] |
| 6 to 10 | 18 | 12 | 6 | [No data] | 16 | 2 | [No data] |
| 11 or 12 | 15 | 16 | -1 | [No data] | 15 | 0 | [No data] |
| A: AWCS group non-response weighted % | B: Comparison group unweighted % | C: pp diff before PSM | D: p-value before PSM | E: Comparison group psm weighted % | F: PP diff after PSM | G: p-value after PSM | |
|---|---|---|---|---|---|---|---|
| Average earnings per month in last year (DWP data) | [No data] | [No data] | [No data] | 0.011 | [No data] | [No data] | 0.618 |
| £0 | 55 | 61 | -7 | [No data] | 56 | -2 | [No data] |
| Above zero, up to £317 | 12 | 10 | 2 | [No data] | 12 | 0 | [No data] |
| £317 to £843 | 15 | 14 | 1 | [No data] | 16 | -1 | [No data] |
| £843 or more | 18 | 15 | 3 | [No data] | 16 | 2 | [No data] |
| A: AWCS group non-response weighted % | B: Comparison group unweighted % | C: pp diff before PSM | D: p-value before PSM | E: Comparison group psm weighted % | F: PP diff after PSM | G: p-value after PSM | |
|---|---|---|---|---|---|---|---|
| Whether claimed PIP in last year (DWP data) | [No data] | [No data] | [No data] | 0.402 | [No data] | [No data] | 0.155 |
| No | 80 | 78 | 1 | [No data] | 82 | -2 | [No data] |
| Yes | 20 | 22 | -1 | [No data] | 18 | 2 | [No data] |
| A: AWCS group non-response weighted % | B: Comparison group unweighted % | C: pp diff before PSM | D: p-value before PSM | E: Comparison group psm weighted % | F: PP diff after PSM | G: p-value after PSM | |
|---|---|---|---|---|---|---|---|
| Base (unweighted) | 1,231 | 1,205 | [No data] | [No data] | 1,205 | [No data] | [No data] |
Table C.4: Baseline differences between the AWCS and comparison groups before and after the propensity score matching – LCW/WRAG group
| A: AWCS group non-response weighted % | B: Comparison group unweighted % | C: pp diff before PSM | D: p-value before PSM | E: Comparison group psm weighted % | F: PP diff after PSM | : p-value after PSM | |
|---|---|---|---|---|---|---|---|
| Length of time unemployed | [No data] | [No data] | [No data] | <0.001 | [No data] | [No data] | 0.859 |
| Currently working inc zero hours | 11 | 16 | -5 | [No data] | 11 | 0 | [No data] |
| Less than six months ago | 5 | 2 | 3 | [No data] | 3 | 2 | [No data] |
| Between six months less than a year | 7 | 3 | 4 | [No data] | 6 | 1 | [No data] |
| Between a year less than three years | 20 | 19 | 1 | [No data] | 21 | -1 | [No data] |
| Between three years less than five years | 13 | 12 | 0 | [No data] | 13 | 0 | [No data] |
| Between five years less than 10 years | 17 | 13 | 4 | [No data] | 18 | 0 | [No data] |
| 10 years or more | 12 | 14 | -3 | [No data] | 12 | 0 | [No data] |
| Never worked/not stated | 15 | 20 | -5 | [No data] | 16 | -1 | [No data] |
| A: AWCS group non-response weighted % | B: Comparison group unweighted % | C: pp diff before PSM | D: p-value before PSM | E: Comparison group psm weighted % | F: PP diff after PSM | : p-value after PSM | |
|---|---|---|---|---|---|---|---|
| Employment status at baseline | [No data] | [No data] | [No data] | 0.001 | [No data] | [No data] | 0.855 |
| Never worked and not working at baseline | 15 | 18 | -3 | [No data] | 15 | 0 | [No data] |
| Employed | 7 | 11 | -4 | [No data] | 6 | 1 | [No data] |
| Self employed | 2 | 4 | -3 | [No data] | 2 | -1 | [No data] |
| Unemployed | 75 | 66 | 9 | [No data] | 75 | 0 | [No data] |
| Other/not stated | 1 | 1 | 0 | [No data] | 1 | 0 | [No data] |
| A: AWCS group non-response weighted % | B: Comparison group unweighted % | C: pp diff before PSM | D: p-value before PSM | E: Comparison group psm weighted % | F: PP diff after PSM | : p-value after PSM | |
|---|---|---|---|---|---|---|---|
| Employment hours at baseline | [No data] | [No data] | [No data] | 0.002 | [No data] | [No data] | 0.473 |
| Working fewer 16 hours | 5 | 6 | -1 | [No data] | 4 | 1 | [No data] |
| Working 16 to 30 hours | 2 | 5 | -3 | [No data] | 2 | 0 | [No data] |
| Working 31 hours or more | 2 | 3 | -1 | [No data] | 1 | 0 | [No data] |
| Working hours not given | 0 | 1 | -1 | [No data] | 1 | -1 | [No data] |
| Not working/not stated | 91 | 85 | 6 | [No data] | 91 | 0 | [No data] |
| A: AWCS group non-response weighted % | B: Comparison group unweighted % | C: pp diff before PSM | D: p-value before PSM | E: Comparison group psm weighted % | F: PP diff after PSM | : p-value after PSM | |
|---|---|---|---|---|---|---|---|
| Summary of work history | [No data] | [No data] | [No data] | 0.165 | [No data] | [No data] | 0.482 |
| I have never been in paid employment | 15 | 18 | -3 | [No data] | 15 | 0 | [No data] |
| I have mostly been out of paid employment | 29 | 28 | 0 | [No data] | 30 | -2 | [No data] |
| I have spent about as much time in employment as out of paid employment | 18 | 17 | 1 | [No data] | 18 | 0 | [No data] |
| I have mostly been in paid employment during my working life | 35 | 35 | 0 | [No data] | 35 | 0 | [No data] |
| Don’t know/prefer not to say | 3 | 2 | 2 | [No data] | 2 | 2 | [No data] |
| A: AWCS group non-response weighted % | B: Comparison group unweighted % | C: pp diff before PSM | D: p-value before PSM | E: Comparison group psm weighted % | F: PP diff after PSM | : p-value after PSM | |
|---|---|---|---|---|---|---|---|
| Training in month before baseline | [No data] | [No data] | [No data] | 0.195 | [No data] | [No data] | 0.627 |
| No/not stated | 90 | 92 | -2 | [No data] | 91 | -1 | [No data] |
| Yes | 10 | 8 | 2 | [No data] | 9 | 1 | [No data] |
| A: AWCS group non-response weighted % | B: Comparison group unweighted % | C: pp diff before PSM | D: p-value before PSM | E: Comparison group psm weighted % | F: PP diff after PSM | : p-value after PSM | |
|---|---|---|---|---|---|---|---|
| Volunteering in month before baseline | [No data] | [No data] | [No data] | 0.409 | [No data] | [No data] | 0.941 |
| No/not stated | 91 | 92 | -1 | [No data] | 91 | 0 | [No data] |
| Yes | 9 | 8 | 1 | [No data] | 9 | 0 | [No data] |
| A: AWCS group non-response weighted % | B: Comparison group unweighted % | C: pp diff before PSM | D: p-value before PSM | E: Comparison group psm weighted % | F: PP diff after PSM | : p-value after PSM | |
|---|---|---|---|---|---|---|---|
| Whether looking for work in month before baseline | [No data] | [No data] | [No data] | <0.001 | [No data] | [No data] | 0.314 |
| Yes | 26 | 18 | 8 | [No data] | 22 | 3 | [No data] |
| No/not stated | 73 | 79 | -6 | [No data] | 76 | -4 | [No data] |
| Already working 30 hours or more | 2 | 3 | -1 | [No data] | 1 | 0 | [No data] |
| A: AWCS group non-response weighted % | B: Comparison group unweighted % | C: pp diff before PSM | D: p-value before PSM | E: Comparison group psm weighted % | F: PP diff after PSM | : p-value after PSM | |
|---|---|---|---|---|---|---|---|
| Number of vacancies applied for | [No data] | [No data] | [No data] | 0.001 | [No data] | [No data] | 0.182 |
| Not doing Job-Search | 73 | 79 | -6 | [No data] | 76 | -4 | [No data] |
| Up to 5 vacancies | 7 | 6 | 1 | [No data] | 8 | -1 | [No data] |
| 6 to 10 vacancies | 3 | 2 | 1 | [No data] | 3 | 0 | [No data] |
| 11 or more vacancies | 8 | 4 | 4 | [No data] | 4 | 4 | [No data] |
| Do not know/prefer not to say | 8 | 6 | 2 | [No data] | 7 | 0 | [No data] |
| Already working 30 hours or more | 2 | 3 | -1 | [No data] | 1 | 0 | [No data] |
| A: AWCS group non-response weighted % | B: Comparison group unweighted % | C: pp diff before PSM | D: p-value before PSM | E: Comparison group psm weighted % | F: PP diff after PSM | : p-value after PSM | |
|---|---|---|---|---|---|---|---|
| Number of hours of Job-Search | [No data] | [No data] | 0.006 | [No data] | [No data] | 0.641 | |
| Not doing Job-Search | 73 | 79 | -6 | [No data] | 76 | -3 | [No data] |
| 5 or fewer | 9 | 6 | 2 | [No data] | 8 | 1 | [No data] |
| 6 to 20 | 8 | 5 | 3 | [No data] | 6 | 2 | [No data] |
| 21 or more | 3 | 2 | 1 | [No data] | 2 | 1 | [No data] |
| Do not know/prefer not to say | 5 | 5 | 1 | [No data] | 6 | -1 | [No data] |
| Already working 30 hours or more | 2 | 3 | -1 | [No data] | 1 | 0 | [No data] |
| A: AWCS group non-response weighted % | B: Comparison group unweighted % | C: pp diff before PSM | D: p-value before PSM | E: Comparison group psm weighted % | F: PP diff after PSM | : p-value after PSM | |
|---|---|---|---|---|---|---|---|
| Perception about ability to work at baseline | [No data] | [No data] | [No data] | <0.001 | [No data] | [No data] | 0.987 |
| Ruled out now and in future | 13 | 24 | -11 | [No data] | 13 | -1 | [No data] |
| Unable but might be able to in future | 55 | 45 | 9 | [No data] | 55 | 0 | [No data] |
| Could return with right job or support | 16 | 9 | 7 | [No data] | 15 | 1 | [No data] |
| Do not know/prefer not to say | 2 | 3 | -1 | [No data] | 2 | 0 | [No data] |
| Working with illness or disability | 8 | 13 | -4 | [No data] | 7 | 1 | [No data] |
| Working with no illness or disability | 0 | 2 | -1 | [No data] | 0 | 0 | [No data] |
| Not working and no illness or disability or not stated | 6 | 5 | 2 | [No data] | 7 | 0 | [No data] |
| A: AWCS group non-response weighted % | B: Comparison group unweighted % | C: pp diff before PSM | D: p-value before PSM | E: Comparison group psm weighted % | F: PP diff after PSM | : p-value after PSM | |
|---|---|---|---|---|---|---|---|
| I am/would be happier and more fulfilled when/if working | [No data] | [No data] | [No data] | <0.001 | [No data] | [No data] | 0.946 |
| Strongly disagree | 9 | 15 | -6 | [No data] | 11 | -1 | [No data] |
| Disagree | 14 | 20 | -6 | [No data] | 15 | -1 | [No data] |
| Neither agree nor disagree | 21 | 21 | -1 | [No data] | 21 | -1 | [No data] |
| Agree | 28 | 20 | 8 | [No data] | 27 | 1 | [No data] |
| Strongly agree | 22 | 20 | 3 | [No data] | 21 | 1 | [No data] |
| Do not know/prefer not to say | 5 | 4 | 1 | [No data] | 5 | 0 | [No data] |
| A: AWCS group non-response weighted % | B: Comparison group unweighted % | C: pp diff before PSM | D: p-value before PSM | E: Comparison group psm weighted % | F: PP diff after PSM | : p-value after PSM | |
|---|---|---|---|---|---|---|---|
| My work can/could accommodate my health/disability needs | [No data] | [No data] | [No data] | 0.023 | [No data] | [No data] | 0.325 |
| Strongly disagree | 19 | 25 | -6 | [No data] | 22 | -3 | [No data] |
| Disagree | 22 | 26 | -3 | [No data] | 24 | -2 | [No data] |
| Neither agree nor disagree | 23 | 21 | 2 | [No data] | 25 | -2 | [No data] |
| Agree | 18 | 14 | 4 | [No data] | 14 | 4 | [No data] |
| Strongly agree | 9 | 8 | 1 | [No data] | 8 | 2 | [No data] |
| Do not know/prefer not to say | 8 | 6 | 1 | [No data] | 7 | 1 | [No data] |
| A: AWCS group non-response weighted % | B: Comparison group unweighted % | C: pp diff before PSM | D: p-value before PSM | E: Comparison group psm weighted % | F: PP diff after PSM | : p-value after PSM | |
|---|---|---|---|---|---|---|---|
| Having a job is/would be beneficial for my health | [No data] | [No data] | [No data] | <0.001 | [No data] | [No data] | 0.162 |
| Strongly disagree | 16 | 24 | -9 | [No data] | 20 | -4 | [No data] |
| Disagree | 17 | 22 | -5 | [No data] | 19 | -2 | [No data] |
| Neither agree nor disagree | 24 | 19 | 4 | [No data] | 22 | 1 | [No data] |
| Agree | 21 | 17 | 5 | [No data] | 21 | 1 | [No data] |
| Strongly agree | 17 | 12 | 5 | [No data] | 13 | 5 | [No data] |
| Do not know/prefer not to say | 5 | 5 | 0 | [No data] | 5 | -1 | [No data] |
| A: AWCS group non-response weighted % | B: Comparison group unweighted % | C: pp diff before PSM | D: p-value before PSM | E: Comparison group psm weighted % | F: PP diff after PSM | : p-value after PSM | |
|---|---|---|---|---|---|---|---|
| I know how to present myself and my health condition or disability in my CV or at interviews | [No data] | [No data] | [No data] | 0.180 | [No data] | [No data] | 0.316 |
| Strongly disagree | 18 | 19 | -1 | [No data] | 19 | 0 | [No data] |
| Disagree | 18 | 23 | -5 | [No data] | 22 | -3 | [No data] |
| Neither agree nor disagree | 17 | 16 | 1 | [No data] | 18 | -1 | [No data] |
| Agree | 22 | 21 | 1 | [No data] | 23 | -1 | [No data] |
| Strongly agree | 17 | 14 | 3 | [No data] | 13 | 3 | [No data] |
| Do not know/prefer not to say | 8 | 6 | 2 | [No data] | 6 | 2 | [No data] |
| A: AWCS group non-response weighted % | B: Comparison group unweighted % | C: pp diff before PSM | D: p-value before PSM | E: Comparison group psm weighted % | F: PP diff after PSM | : p-value after PSM | |
|---|---|---|---|---|---|---|---|
| Worried would not employ because of condition | [No data] | [No data] | [No data] | 0.002 | [No data] | [No data] | 0.261 |
| Strongly disagree | 5 | 8 | -3 | [No data] | 8 | -3 | [No data] |
| Disagree | 11 | 9 | 2 | [No data] | 10 | 2 | [No data] |
| Neither agree nor disagree | 13 | 12 | 2 | [No data] | 13 | 1 | [No data] |
| Agree | 27 | 22 | 4 | [No data] | 24 | 2 | [No data] |
| Strongly agree | 26 | 25 | 1 | [No data] | 26 | 0 | [No data] |
| Do not know/prefer not to say | 2 | 4 | -2 | [No data] | 4 | -2 | [No data] |
| Currently working with illness or disability | 8 | 13 | -4 | [No data] | 7 | 1 | [No data] |
| Currently working with no illness or disability | 0 | 2 | -1 | [No data] | 0 | 0 | [No data] |
| Currently not working and no illness or disability | 6 | 5 | 2 | [No data] | 7 | 0 | [No data] |
| A: AWCS group non-response weighted % | B: Comparison group unweighted % | C: pp diff before PSM | D: p-value before PSM | E: Comparison group psm weighted % | F: PP diff after PSM | : p-value after PSM | |
|---|---|---|---|---|---|---|---|
| Worried work would make my condition worse | [No data] | [No data] | [No data] | 0.009 | [No data] | [No data] | 0.807 |
| Strongly disagree | 5 | 6 | -1 | [No data] | 5 | 0 | [No data] |
| Disagree | 7 | 6 | 0 | [No data] | 7 | -1 | [No data] |
| Neither agree nor disagree | 11 | 8 | 4 | [No data] | 9 | 2 | [No data] |
| Agree | 28 | 25 | 2 | [No data] | 28 | 0 | [No data] |
| Strongly agree | 32 | 33 | -1 | [No data] | 33 | -1 | [No data] |
| Do not know/prefer not to say | 1 | 2 | -1 | [No data] | 2 | -1 | [No data] |
| Currently working with illness or disability | 8 | 13 | -4 | [No data] | 7 | 1 | [No data] |
| Currently working with no illness or disability | 0 | 2 | -1 | [No data] | 0 | 0 | [No data] |
| Currently not working and no illness or disability | 6 | 5 | 2 | [No data] | 7 | 0 | [No data] |
| A: AWCS group non-response weighted % | B: Comparison group unweighted % | C: pp diff before PSM | D: p-value before PSM | E: Comparison group psm weighted % | F: PP diff after PSM | : p-value after PSM | |
|---|---|---|---|---|---|---|---|
| Worried work would make my condition worse | [No data] | [No data] | [No data] | 0.004 | [No data] | [No data] | 0.728 |
| Strongly disagree | 3 | 5 | -2 | [No data] | 5 | -1 | [No data] |
| Disagree | 7 | 7 | 0 | [No data] | 8 | -1 | [No data] |
| Neither agree nor disagree | 12 | 8 | 5 | [No data] | 9 | 3 | [No data] |
| Agree | 25 | 24 | 1 | [No data] | 27 | -1 | [No data] |
| Strongly agree | 35 | 35 | 0 | [No data] | 34 | 1 | [No data] |
| Do not know/prefer not to say | 2 | 2 | 0 | [No data] | 2 | 0 | [No data] |
| Currently working with illness or disability | 8 | 13 | -4 | [No data] | 7 | 1 | [No data] |
| Currently working with no illness or disability | 0 | 2 | -1 | [No data] | 0 | 0 | [No data] |
| Currently not working and no illness or disability | 6 | 5 | 2 | [No data] | 7 | 0 | [No data] |
| Barriers that made it difficult for you to gain or maintain employment in month before baseline | A: AWCS group non-response weighted % | B: Comparison group unweighted % | C: pp diff before PSM | D: p-value before PSM | E: Comparison group psm weighted % | F: PP diff after PSM | : p-value after PSM |
|---|---|---|---|---|---|---|---|
| =# Lack of skills or recent experience | 9 | 8 | 1 | 0.362 | 8 | 1 | 0.654 |
| Lack of jobs available | 7 | 4 | 3 | 0.037 | 5 | 2 | 0.144 |
| Physical or mental health issues | 88 | 88 | 0 | 0.913 | 89 | -1 | 0.480 |
| Family or caring commitments | 11 | 14 | -3 | 0.182 | 12 | -1 | 0.713 |
| Problems with transport or the cost of transport to get to a job | 8 | 5 | 3 | 0.038 | 5 | 3 | 0.051 |
| Language barriers/English is my second language | 1 | 1 | 0 | 0.405 | 2 | -1 | 0.157 |
| Housing situation (e.g., experiencing homelessness or sofa surfing / staying temporarily with family or friends) | 4 | 2 | 1 | 0.216 | 3 | 1 | 0.658 |
| Your age | 4 | 3 | 1 | 0.511 | 2 | 1 | 0.190 |
| Lack of access to internet or technology | 1 | 1 | 1 | 0.258 | 1 | 1 | 0.142 |
| A: AWCS group non-response weighted % | B: Comparison group unweighted % | C: pp diff before PSM | D: p-value before PSM | E: Comparison group psm weighted % | F: PP diff after PSM | : p-value after PSM | |
|---|---|---|---|---|---|---|---|
| Type of benefit claimed | [No data] | [No data] | [No data] | 0.537 | [No data] | [No data] | 0.477 |
| UC | 99 | 98 | 0 | [No data] | 98 | 1 | [No data] |
| ESA | 1 | 2 | 0 | [No data] | 2 | -1 | [No data] |
| A: AWCS group non-response weighted % | B: Comparison group unweighted % | C: pp diff before PSM | D: p-value before PSM | E: Comparison group psm weighted % | F: PP diff after PSM | : p-value after PSM | |
|---|---|---|---|---|---|---|---|
| Whether on employment or other means tested benefit JSA WTC IS CA HB CT support at baseline | [No data] | [No data] | [No data] | 0.287 | [No data] | [No data] | 0.507 |
| On employment or means tested benefit | 44 | 47 | -3 | [No data] | 46 | -2 | [No data] |
| A: AWCS group non-response weighted % | B: Comparison group unweighted % | C: pp diff before PSM | D: p-value before PSM | E: Comparison group psm weighted % | F: PP diff after PSM | : p-value after PSM | |
|---|---|---|---|---|---|---|---|
| Whether on non means tested disability benefit PIP DLA ADP IIB at baseline | [No data] | [No data] | [No data] | 0.615 | [No data] | [No data] | 0.829 |
| On non means tested disability benefit | 35 | 36 | -1 | [No data] | 35 | 1 | [No data] |
| A: AWCS group non-response weighted % | B: Comparison group unweighted % | C: pp diff before PSM | D: p-value before PSM | E: Comparison group psm weighted % | F: PP diff after PSM | : p-value after PSM | |
|---|---|---|---|---|---|---|---|
| Whether on any benefit except UC or ESA at baseline | [No data] | [No data] | [No data] | 0.794 | [No data] | [No data] | 0.288 |
| On a benefit other than UC or ESA | 70 | 69 | 1 | [No data] | 67 | 3 | [No data] |
| A: AWCS group non-response weighted % | B: Comparison group unweighted % | C: pp diff before PSM | D: p-value before PSM | E: Comparison group psm weighted % | F: PP diff after PSM | : p-value after PSM | |
|---|---|---|---|---|---|---|---|
| Whether has a physical health condition at baseline | [No data] | [No data] | [No data] | 0.022 | [No data] | [No data] | 0.492 |
| Yes | 55 | 62 | -6 | [No data] | 58 | -2 | [No data] |
| A: AWCS group non-response weighted % | B: Comparison group unweighted % | C: pp diff before PSM | D: p-value before PSM | E: Comparison group psm weighted % | F: PP diff after PSM | : p-value after PSM | |
|---|---|---|---|---|---|---|---|
| Whether has a mental health condition at baseline | [No data] | [No data] | [No data] | 0.016 | [No data] | [No data] | 0.999 |
| Yes | 76 | 71 | 6 | [No data] | 76 | 0 | [No data] |
| A: AWCS group non-response weighted % | B: Comparison group unweighted % | C: pp diff before PSM | D: p-value before PSM | E: Comparison group psm weighted % | F: PP diff after PSM | : p-value after PSM | |
|---|---|---|---|---|---|---|---|
| Whether has a learning difficulty or neurodiverse at baseline | [No data] | [No data] | [No data] | 0.537 | [No data] | [No data] | 0.636 |
| Yes | 21 | 19 | 1 | [No data] | 22 | -1 | [No data] |
| A: AWCS group non-response weighted % | B: Comparison group unweighted % | C: pp diff before PSM | D: p-value before PSM | E: Comparison group psm weighted % | F: PP diff after PSM | : p-value after PSM | |
|---|---|---|---|---|---|---|---|
| Whether has a condition which reduces ability to do things at baseline | [No data] | [No data] | [No data] | 0.066 | [No data] | [No data] | 0.731 |
| No health condition or disability | 7 | 6 | 0 | [No data] | 7 | 0 | [No data] |
| Condition reduces ability a lot | 68 | 71 | -3 | [No data] | 69 | -1 | [No data] |
| Condition reduces ability a little | 22 | 20 | 2 | [No data] | 21 | 1 | [No data] |
| Condition does not reduce ability | 2 | 3 | -1 | [No data] | 2 | 0 | [No data] |
| Prefer not to say how much | 1 | 0 | 1 | [No data] | 0 | 1 | [No data] |
| A: AWCS group non-response weighted % | B: Comparison group unweighted % | C: pp diff before PSM | D: p-value before PSM | E: Comparison group psm weighted % | F: PP diff after PSM | : p-value after PSM | |
|---|---|---|---|---|---|---|---|
| Whether any mental health issues in three months prior to baseline | [No data] | [No data] | [No data] | 0.008 | [No data] | [No data] | 0.286 |
| Yes/prefer not to say | 96 | 93 | 3 | [No data] | 95 | 1 | [No data] |
| Issues experienced in the three months before baseline | A: AWCS group non-response weighted % | B: Comparison group unweighted % | C: pp diff before PSM | D: p-value before PSM | E: Comparison group psm weighted % | F: PP diff after PSM | : p-value after PSM |
|---|---|---|---|---|---|---|---|
| Anxiety and/or panic attacks | 87 | 82 | 5 | 0.008 | 85 | 2 | 0.351 |
| Depression | 84 | 79 | 5 | 0.025 | 81 | 3 | 0.246 |
| Stress | 83 | 79 | 5 | 0.030 | 82 | 2 | 0.466 |
| A: AWCS group non-response weighted % | B: Comparison group unweighted % | C: pp diff before PSM | D: p-value before PSM | E: Comparison group psm weighted % | F: PP diff after PSM | : p-value after PSM | |
|---|---|---|---|---|---|---|---|
| Whether mental health issues have impact on life at baseline | [No data] | [No data] | [No data] | 0.053 | [No data] | [No data] | 0.847 |
| No mental health issues or not said | 4 | 8 | -3 | [No data] | 5 | -1 | [No data] |
| Issues which impact a great deal | 55 | 55 | 0 | [No data] | 55 | 0 | [No data] |
| Issues which impact to some extent | 31 | 28 | 2 | [No data] | 30 | 0 | [No data] |
| Issues which do not impact at all/not stated | 9 | 9 | 1 | [No data] | 9 | 0 | [No data] |
| A: AWCS group non-response weighted % | B: Comparison group unweighted % | C: pp diff before PSM | D: p-value before PSM | E: Comparison group psm weighted % | F: PP diff after PSM | : p-value after PSM | |
|---|---|---|---|---|---|---|---|
| Contact with GP surgery in three months prior to baseline | [No data] | [No data] | [No data] | 0.725 | [No data] | [No data] | 0.825 |
| Yes | 74 | 73 | 1 | [No data] | 75 | -1 | [No data] |
| A: AWCS group non-response weighted % | B: Comparison group unweighted % | C: pp diff before PSM | D: p-value before PSM | E: Comparison group psm weighted % | F: PP diff after PSM | : p-value after PSM | |
|---|---|---|---|---|---|---|---|
| Contact with a mental health service in three months prior to baseline | [No data] | [No data] | [No data] | 0.032 | [No data] | [No data] | 0.364 |
| Yes | 35 | 30 | 5 | [No data] | 33 | 3 | [No data] |
| A: AWCS group non-response weighted % | B: Comparison group unweighted % | C: pp diff before PSM | D: p-value before PSM | E: Comparison group psm weighted % | F: PP diff after PSM | : p-value after PSM | |
|---|---|---|---|---|---|---|---|
| Contact with A&E in three months prior to baseline | [No data] | [No data] | [No data] | 0.009 | [No data] | [No data] | 0.063 |
| Yes | 13 | 18 | -5 | [No data] | 16 | -4 | [No data] |
| A: AWCS group non-response weighted % | B: Comparison group unweighted % | C: pp diff before PSM | D: p-value before PSM | E: Comparison group psm weighted % | F: PP diff after PSM | : p-value after PSM | |
|---|---|---|---|---|---|---|---|
| Contact with a hospital outpatients service in three months prior to baseline | [No data] | [No data] | [No data] | 0.684 | [No data] | [No data] | 0.813 |
| Yes | 32 | 33 | -1 | [No data] | 32 | 1 | [No data] |
| A: AWCS group non-response weighted % | B: Comparison group unweighted % | C: pp diff before PSM | D: p-value before PSM | E: Comparison group psm weighted % | F: PP diff after PSM | : p-value after PSM | |
|---|---|---|---|---|---|---|---|
| In receipt of help or support from elsewhere in three months prior to baseline | [No data] | [No data] | [No data] | 0.776 | [No data] | [No data] | 0.908 |
| Yes | 56 | 55 | 1 | [No data] | 56 | 0 | [No data] |
| A: AWCS group non-response weighted % | B: Comparison group unweighted % | C: pp diff before PSM | D: p-value before PSM | E: Comparison group psm weighted % | F: PP diff after PSM | : p-value after PSM | |
|---|---|---|---|---|---|---|---|
| Age group | [No data] | [No data] | [No data] | <0.001 | [No data] | [No data] | 0.973 |
| 16 to 25 | 12 | 17 | -5 | [No data] | 13 | -1 | [No data] |
| 26 to 35 | 33 | 22 | 11 | [No data] | 32 | 1 | [No data] |
| 36 to 45 | 25 | 24 | 1 | [No data] | 25 | 0 | [No data] |
| 46 to 55 | 17 | 19 | -2 | [No data] | 17 | 0 | [No data] |
| 56 to 65 | 12 | 18 | -6 | [No data] | 13 | 0 | [No data] |
| A: AWCS group non-response weighted % | B: Comparison group unweighted % | C: pp diff before PSM | D: p-value before PSM | E: Comparison group psm weighted % | F: PP diff after PSM | : p-value after PSM | |
|---|---|---|---|---|---|---|---|
| Gender | [No data] | [No data] | [No data] | 0.346 | [No data] | [No data] | 0.358 |
| Male | 52 | 54 | -3 | [No data] | 55 | -3 | [No data] |
| Female | 48 | 46 | 3 | [No data] | 45 | 3 | [No data] |
| A: AWCS group non-response weighted % | B: Comparison group unweighted % | C: pp diff before PSM | D: p-value before PSM | E: Comparison group psm weighted % | F: PP diff after PSM | : p-value after PSM | |
|---|---|---|---|---|---|---|---|
| Ethnic group | [No data] | [No data] | [No data] | 0.526 | [No data] | [No data] | 0.551 |
| White | 84 | 85 | -1 | [No data] | 84 | 0 | [No data] |
| Mixed or multiple ethnic groups | 4 | 3 | 1 | [No data] | 2 | 2 | [No data] |
| Asian or Asian British | 5 | 5 | 1 | [No data] | 5 | 0 | [No data] |
| Black or Black British | 4 | 4 | 0 | [No data] | 4 | 0 | [No data] |
| Another ethnic group | 1 | 1 | 0 | [No data] | 2 | -1 | [No data] |
| Do not know/prefer not to say | 1 | 2 | -1 | [No data] | 2 | -1 | [No data] |
| A: AWCS group non-response weighted % | B: Comparison group unweighted % | C: pp diff before PSM | D: p-value before PSM | E: Comparison group psm weighted % | F: PP diff after PSM | : p-value after PSM | |
|---|---|---|---|---|---|---|---|
| Highest qualification | [No data] | [No data] | [No data] | 0.193 | [No data] | [No data] | 0.580 |
| Entry level qualification | 2 | 2 | 0 | [No data] | 1 | 1 | [No data] |
| LEVEL 1 qualifications | 9 | 10 | -1 | [No data] | 11 | -2 | [No data] |
| LEVEL 2 | 27 | 22 | 4 | [No data] | 23 | 4 | [No data] |
| LEVEL 3 | 17 | 17 | 0 | [No data] | 19 | -2 | [No data] |
| LEVEL 4 | 4 | 3 | 1 | [No data] | 5 | 0 | [No data] |
| LEVEL 5 or above | 11 | 10 | 2 | [No data] | 11 | 0 | [No data] |
| Don’t know / Prefer not to say | 10 | 10 | 0 | [No data] | 9 | 1 | [No data] |
| No formal qualifications | 19 | 25 | -6 | [No data] | 21 | -2 | [No data] |
| A: AWCS group non-response weighted % | B: Comparison group unweighted % | C: pp diff before PSM | D: p-value before PSM | E: Comparison group psm weighted % | F: PP diff after PSM | : p-value after PSM | |
|---|---|---|---|---|---|---|---|
| Living as a couple | [No data] | [No data] | [No data] | 0.697 | [No data] | [No data] | 0.739 |
| Yes | 11 | 12 | -1 | [No data] | 12 | -1 | [No data] |
| No | 89 | 88 | 1 | [No data] | 88 | 1 | [No data] |
| A: AWCS group non-response weighted % | B: Comparison group unweighted % | C: pp diff before PSM | D: p-value before PSM | E: Comparison group psm weighted % | F: PP diff after PSM | : p-value after PSM | |
|---|---|---|---|---|---|---|---|
| Has dependent children | [No data] | [No data] | [No data] | 0.592 | [No data] | [No data] | 0.864 |
| Yes | 30 | 29 | 1 | [No data] | 31 | 0 | [No data] |
| No | 70 | 71 | -1 | [No data] | 69 | 0 | [No data] |
| A: AWCS group non-response weighted % | B: Comparison group unweighted % | C: pp diff before PSM | D: p-value before PSM | E: Comparison group psm weighted % | F: PP diff after PSM | : p-value after PSM | |
|---|---|---|---|---|---|---|---|
| Marital status | [No data] | [No data] | [No data] | 0.128 | [No data] | [No data] | 0.385 |
| Never married and never registered a civil partnership (includes living with a partner) | 72 | 68 | 4 | [No data] | 70 | 1 | [No data] |
| Married/in a registered civil partnership | 9 | 9 | 0 | [No data] | 10 | 0 | [No data] |
| Separated | 5 | 6 | -1 | [No data] | 5 | 1 | [No data] |
| Divorced | 10 | 13 | -3 | [No data] | 12 | -2 | [No data] |
| Widowed | 2 | 2 | -1 | [No data] | 3 | -1 | [No data] |
| Prefer not to say | 2 | 1 | 1 | [No data] | 1 | 1 | [No data] |
| A: AWCS group non-response weighted % | B: Comparison group unweighted % | C: pp diff before PSM | D: p-value before PSM | E: Comparison group psm weighted % | F: PP diff after PSM | : p-value after PSM | |
|---|---|---|---|---|---|---|---|
| Anyone in household in employment | [No data] | [No data] | [No data] | 0.354 | [No data] | [No data] | 0.588 |
| Yes, someone in full-time paid employment | 15 | 13 | 2 | [No data] | 13 | 3 | [No data] |
| Yes, someone in part-time paid employment | 7 | 6 | 1 | [No data] | 7 | 1 | [No data] |
| No, no one in paid employment | 45 | 46 | -1 | [No data] | 47 | -1 | [No data] |
| No one living in household | 29 | 32 | -3 | [No data] | 32 | -3 | [No data] |
| Don’t know / Prefer not to say | 3 | 2 | 1 | [No data] | 2 | 0 | [No data] |
| A: AWCS group non-response weighted % | B: Comparison group unweighted % | C: pp diff before PSM | D: p-value before PSM | E: Comparison group psm weighted % | F: PP diff after PSM | : p-value after PSM | |
|---|---|---|---|---|---|---|---|
| Family type | [No data] | [No data] | [No data] | 0.521 | [No data] | [No data] | 0.571 |
| Single, no children | 66 | 68 | -2 | [No data] | 67 | -1 | [No data] |
| Single, with children | 23 | 20 | 3 | [No data] | 22 | 1 | [No data] |
| Couple, no children | 4 | 3 | 1 | [No data] | 3 | 1 | [No data] |
| Couple, with children | 7 | 9 | -1 | [No data] | 9 | -2 | [No data] |
| A: AWCS group non-response weighted % | B: Comparison group unweighted % | C: pp diff before PSM | D: p-value before PSM | E: Comparison group psm weighted % | F: PP diff after PSM | : p-value after PSM | |
|---|---|---|---|---|---|---|---|
| Access to the internet | [No data] | [No data] | [No data] | 0.015 | [No data] | [No data] | 0.487 |
| No | 2 | 5 | -2 | [No data] | 3 | -1 | [No data] |
| Yes/not stated | 98 | 95 | 2 | [No data] | 97 | 1 | [No data] |
| A: AWCS group non-response weighted % | B: Comparison group unweighted % | C: pp diff before PSM | D: p-value before PSM | E: Comparison group psm weighted % | F: PP diff after PSM | : p-value after PSM | |
|---|---|---|---|---|---|---|---|
| Region | [No data] | [No data] | [No data] | 0.114 | [No data] | [No data] | 0.163 |
| East Midlands | 8 | 7 | 0 | [No data] | 7 | 1 | [No data] |
| East of England | 6 | 8 | -2 | [No data] | 7 | -1 | [No data] |
| London | 8 | 11 | -2 | [No data] | 12 | -3 | [No data] |
| North East | 4 | 6 | -2 | [No data] | 5 | -1 | [No data] |
| North West | 11 | 11 | 0 | [No data] | 10 | 1 | [No data] |
| South East | 15 | 12 | 3 | [No data] | 12 | 3 | [No data] |
| South West | 10 | 9 | 1 | 9 | 1 | ||
| West Midlands | 9 | 10 | -2 | 11 | -2 | ||
| Yorkshire and The Humber | 12 | 8 | 4 | 8 | 4 | ||
| Scotland | 12 | 11 | 1 | 11 | 1 | ||
| Wales |
| A: AWCS group non-response weighted % | B: Comparison group unweighted % | C: pp diff before PSM | D: p-value before PSM | E: Comparison group psm weighted % | F: PP diff after PSM | : p-value after PSM | |
|---|---|---|---|---|---|---|---|
| Sample cohort | [No data] | [No data] | [No data] | 0.067 | [No data] | [No data] | 0.123 |
| Cohort 1 | 24 | 20 | 4 | [No data] | 20 | 5 | [No data] |
| Cohort 2 | 27 | 24 | 3 | [No data] | 25 | 2 | [No data] |
| Cohort 3 | 27 | 32 | -5 | [No data] | 32 | -5 | [No data] |
| Cohort 4 | 21 | 23 | -2 | [No data] | 23 | -2 | [No data] |
| A: AWCS group non-response weighted % | B: Comparison group unweighted % | C: pp diff before PSM | D: p-value before PSM | E: Comparison group psm weighted % | F: PP diff after PSM | : p-value after PSM | |
|---|---|---|---|---|---|---|---|
| Claim length banded | [No data] | [No data] | [No data] | 0.086 | [No data] | [No data] | 0.123 |
| Up to 3 months | 2 | 1 | 1 | [No data] | 1 | 1 | [No data] |
| 3 to 6 months | 3 | 2 | 1 | [No data] | 2 | 1 | [No data] |
| 6 to 12 months | 9 | 7 | 2 | [No data] | 7 | 2 | [No data] |
| 12 to 24 months | 16 | 16 | 0 | [No data] | 16 | 0 | [No data] |
| 2 to 3 years | 12 | 14 | -1 | [No data] | 14 | -2 | [No data] |
| More than 3 years | 57 | 60 | -3 | [No data] | 59 | -2 | [No data] |
| A: AWCS group non-response weighted % | B: Comparison group unweighted % | C: pp diff before PSM | D: p-value before PSM | E: Comparison group psm weighted % | F: PP diff after PSM | : p-value after PSM | |
|---|---|---|---|---|---|---|---|
| Number of months in previous year when customer worked (DWP data) | [No data] | [No data] | [No data] | <0.001 | [No data] | [No data] | 0.446 |
| 0 | 80 | 83 | -3 | [No data] | 81 | -1 | [No data] |
| 1 to 5 | 12 | 6 | 6 | [No data] | 10 | 2 | [No data] |
| 6 to 10 | 5 | 5 | 0 | [No data] | 6 | -1 | [No data] |
| 11 or 12 | 3 | 6 | -2 | [No data] | 3 | 0 | [No data] |
| A: AWCS group non-response weighted % | B: Comparison group unweighted % | C: pp diff before PSM | D: p-value before PSM | E: Comparison group psm weighted % | F: PP diff after PSM | : p-value after PSM | |
|---|---|---|---|---|---|---|---|
| Average earnings per month in last year (DWP data) | [No data] | [No data] | [No data] | 0.002 | [No data] | [No data] | 0.920 |
| £0 | 80 | 83 | -3 | [No data] | 81 | -1 | [No data] |
| Above zero, up to £317 | 12 | 7 | 5 | [No data] | 11 | 1 | [No data] |
| £317 to £843 | 6 | 6 | 0 | [No data] | 6 | 0 | [No data] |
| £843 or more | 2 | 4 | -2 | [No data] | 2 | 0 | [No data] |
| A: AWCS group non-response weighted % | B: Comparison group unweighted % | C: pp diff before PSM | D: p-value before PSM | E: Comparison group psm weighted % | F: PP diff after PSM | : p-value after PSM | |
|---|---|---|---|---|---|---|---|
| Whether claimed PIP in last year (DWP data) | [No data] | [No data] | [No data] | 0.574 | [No data] | [No data] | 0.098 |
| No | 66 | 67 | -1 | [No data] | 70 | -5 | [No data] |
| Yes | 34 | 33 | 1 | [No data] | 30 | 5 | [No data] |
| A: AWCS group non-response weighted % | B: Comparison group unweighted % | C: pp diff before PSM | D: p-value before PSM | E: Comparison group psm weighted % | F: PP diff after PSM | : p-value after PSM | |
|---|---|---|---|---|---|---|---|
| Base (unweighted) | 692 | 727 | [No data] | [No data] | 727 | [No data] | [No data] |
Checks for selection bias in the estimation of impact for the pre-WCA and LCW/WRAG groups
The impact study described in this report uses a quasi-experimental design, where a group of AWCS customers are compared with a matched group of non-AWCS customers. Although great care was taken to collect and match the groups on as wide a range of variables as possible, there is a still scope for selection bias. This is because the sample selected for the comparison group inevitably includes customers who had been actively excluded from AWCS by work coaches if they were considered likely to enter or return to work very quickly. The propensity score matching does attempt to minimise any such bias, but some could potentially remain.
However, one feature of the survey design that can be used to test for selection bias is that the Wave 1 survey interview took place around 2-3 months after the baseline start date per customer, with the baseline matching variables being asked retrospectively to deal with this time lag.
If, as expected, there was selection into AWCS by work coaches based on their expectations about a rapid entry, or re-entry, to work, then in the survey data prior to the propensity score matching more of the comparison group would be in work at Wave 1 than in the AWCS group. This is exactly what is seen in the data (Table C.5).
Table C.5: Percentages in work at the time of the Wave 1 survey, prior to matching
| AWCS group : % in work at Wave 1 | Comparison group: % in work at Wave 1 | |
|---|---|---|
| Pre-WCA | 14.2 | 20.3 |
| LCW/WRAG | 10.5 | 16.0 |
However, once the PSM weights have been applied, if the selection bias has been successfully dealt with, the comparison group percentages for being in work should reduce to either the same or lower than the AWCS group:
- They would be the same if there is no early (Wave 1) impact on AWCS on employment. This would be in keeping with the qualitative findings;
- The percentage in the comparison group would be lower if there was an early positive impact of AWCS impact on employment.
What is found is that, after applying the PSM weights, there is no difference in the employment rates at Wave 1 (Table C.6).
Table C.6: Percentages in work at Wave 1 in the survey data after PSM
| AWCS group: % in work at Wave 1 | Matched comparison group: % in work at Wave 1 | |
|---|---|---|
| Pre_WCA | 14.2 | 14.4 |
| LCW/WRAG | 10.5 | 10.7 |
These results strongly suggest that the PSM has successfully dealt with selection bias, under an assumption that there is no early impact of AWCS. If correct, then the impact estimates at Wave 2 that are included in this report should be unbiased. The assumption of no early impact of AWCS seems a reasonable one, in line with the qualitative findings, but is otherwise largely untestable.
-
Get Britain Working White Paper: Chapter 3: Tackling economic inactivity caused by ill health ↩
-
The experience of Additional Work Coach Support: Findings from qualitative interviews with customers ↩
-
Includes employed full-time or part-time; employed but not currently working e.g., on sick leave or maternity leave; self-employed; and unemployed but looking for a job. ↩ ↩2 ↩3
-
Includes unemployed and not looking for a job; long-term sick or disabled; full-time parent; full-time carer; retired; and student/ pupil. ↩ ↩2 ↩3
-
Includes employed full-time or part-time; employed but not currently working e.g., on sick leave or maternity leave; self-employed; and unemployed but looking for a job. ↩
-
Includes unemployed and not looking for a job; long-term sick or disabled; full-time parent; full-time carer; retired; and student/ pupil. ↩
-
Universal Credit, Employment Support Allowance, Jobseeker’s Allowance, Working Tax Credit, Income Support, Carer’s Allowance, Housing Benefit, or Council Tax Support. ↩
-
Personal Independence Payment, Disability Living Allowance, Adult Disability Payment, or Industrial Injuries Benefits. ↩
-
Binary outcome identifying those ‘ready for work’ – either currently working or could return to work now in the right job or with the right support. ↩ ↩2 ↩3
-
Although these results are filtered on an outcome (that is, they are based on those not in work at follow up), they have been presented without ‘in work’ in the base in order to avoid any significant differences observed between the two groups being due to differences in employment status rather than in perceptions among those not in work. ↩ ↩2 ↩3
-
Significance test for three category variable: ‘very or fairly confident’; ‘neither confident nor not confident, not very or not at all confident, or don’t know’; ‘not applicable as will not be looking for work in future’. ↩ ↩2
-
Among those whose WC made a referral, there were no significant differences between AWCS customers and their matched comparison group in the percentages of customers who took up the place. Combining pre-WCA and LCW/WRAG customers who had been referred, 65% of AWCS and 66% of their matched comparison group took part in a programme (p-value 0.799), with the respective percentages for pre-WCA customers being 68% and 70% (p-value 0.612) and 58% and 55% for LCW/WRAG customers (p-value 0.726). ↩ ↩2 ↩3
-
Bases of individual outcomes are slightly lower, as they exclude those who did not provide a score of 0 to 10. ↩ ↩2 ↩3
-
‘Ready for work’ is defined by participants either being in work or feeling like they could return to work now if the right job was available or if they had the right support. ↩
-
Those in work at baseline are not included. ↩
-
Those in work at baseline are not included. ↩
-
Those with no conditions are not included. ↩
-
Those with no conditions are not included. ↩
-
Those with no conditions are not included. ↩
-
That is, if a variable that is not in the model has a p-value of less than 0.1, it is then included in the model (the variable meeting this criterion with the lowest p-value being entered first). If the inclusion of that variable pushes the p-values for any variables in the model to 0.2 or over, those variables are now excluded. This is repeated until no variables meet the inclusion or exclusion criteria. ↩
-
Akin to post-stratification ↩