Demographic data for coronavirus (COVID-19) testing (England): 28 May to 26 August
Updated 4 September 2020
Applies to England

© Crown copyright 2020
This publication is licensed under the terms of the Open Government Licence v3.0 except where otherwise stated. To view this licence, visit nationalarchives.gov.uk/doc/open-government-licence/version/3 or write to the Information Policy Team, The National Archives, Kew, London TW9 4DU, or email: psi@nationalarchives.gov.uk.
Where we have identified any third party copyright information you will need to obtain permission from the copyright holders concerned.
This publication is available at https://www.gov.uk/government/publications/demographic-data-for-coronavirus-testing-england-28-may-to-26-august/demographic-data-for-coronavirus-covid-19-testing-england-28-may-to-26-august
This statistical note aims to provide further information on testing for COVID-19 by different demographic groups under NHS Test and Trace. The note contains information on people newly tested and people newly testing positive for COVID-19 by age, gender and ethnicity since the beginning of the Test and Trace programme (28 May 2020).
This statistical note does not aim to look at disparities in risk or outcome for different demographic groups. For more information on this see disparities in the risk and outcomes of COVID-19.
Terminology
This note contains figures relating to people who were tested under pillar 1 or pillar 2 of the government testing strategy:
-
pillar 1: swab testing in Public Health England (PHE) labs and NHS hospitals for those with a clinical need, and health and care workers
-
pillar 2: swab testing for the wider population, through commercial partnerships
‘People tested’ refers to people who have newly been tested for COVID-19 and does not re-count people who have been tested more than once in either pillar 1 or pillar 2. ‘People testing positive’ refers only to people who have newly tested positive for COVID-19 and does not include people who have had more than one positive test. More details can be found in the methodology document.
Demographic data is collected for age, gender and ethnicity. For pillar 1, data is collected by the hospital, and is then enriched using patient records. For pillar 2, this data is collected when people register for a test and is voluntary, which means that people have the option not to provide their information.
For ethnicity, data has been grouped into 5 broad categories:
- white
- mixed/multiple ethnic groups
- Asian/Asian British
- black/black British
- other ethnic groups
The subgroups that make up each of these broad categories can be found at the ethnicity harmonised principle.
Gender
People tested
Since the start of Test and Trace (28 May) more people who identify as female have been newly tested than people who identify as male, making up 54.8% of the total people newly tested. This is similar for people tested in both pillar 1 (52.8% identify as female) and pillar 2 (55.8% identify as female).
Figure 1: number of people newly tested for COVID-19 by gender, pillar 1 and pillar 2, 28 May to 26 August, England
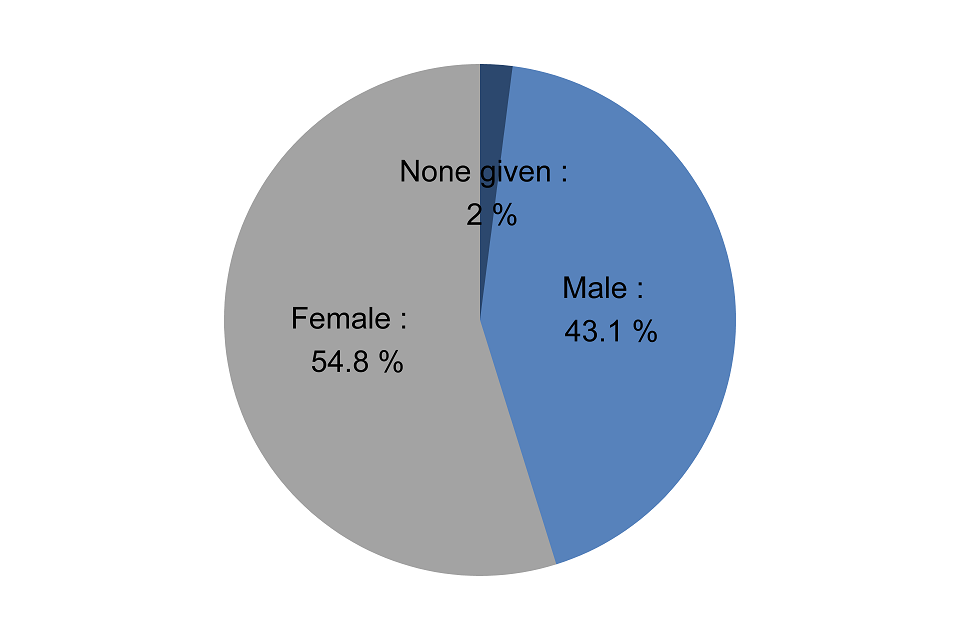
The pie chart shows that of the people newly tested for COVID-19 by gender in pillar 1 and pillar 2, from 28 May to 26 August in England, 54.8% identify as female, 43.1% identify as male and 2% gave no gender.
This has been consistent every week since Test and Trace started. However, the gap between the 2 genders was largest in week 1. The number of people being newly tested has been steadily increasing for both those who identify as being male and those who identify as being female since the middle of June.
Figure 2: number of people newly tested for COVID-19 each week by gender, pillar 1 and pillar 2, 28 May to 26 August, England
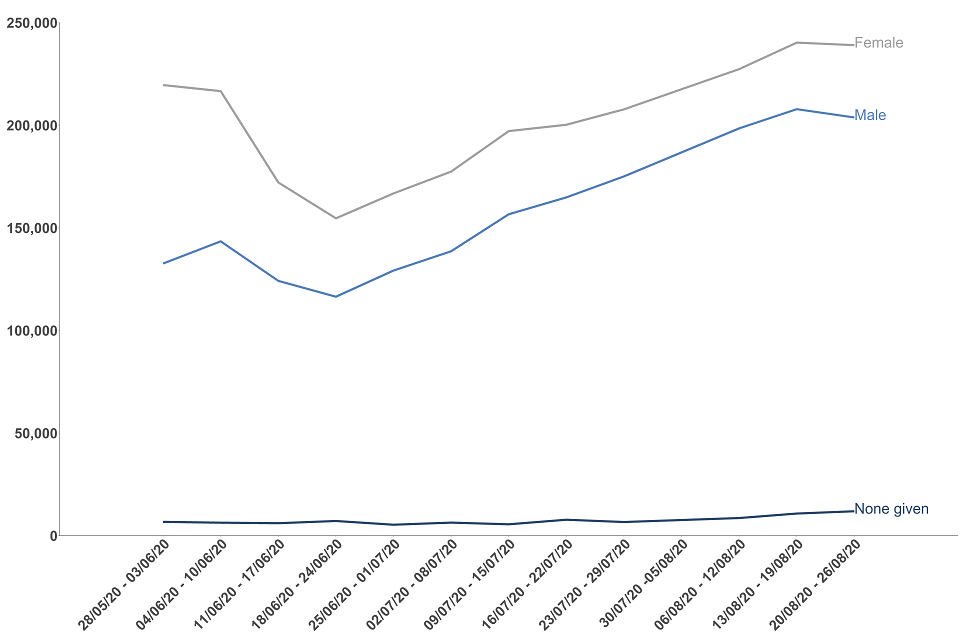
The data used in this chart can be found in the annex, table 1.
People testing positive
Since the start of Test and Trace, 54.1% of people newly testing positive identified as female. However, because people who identify as female were also more likely to get tested, this may not accurately reflect the overall population with COVID-19. This is similar for people testing positive in both pillar 1 (53.3% identify as female) and pillar 2 (54.4% identify as female).
Figure 3: number of people newly testing positive by gender, pillar 1 and pillar 2, 28 May to 26 August, England
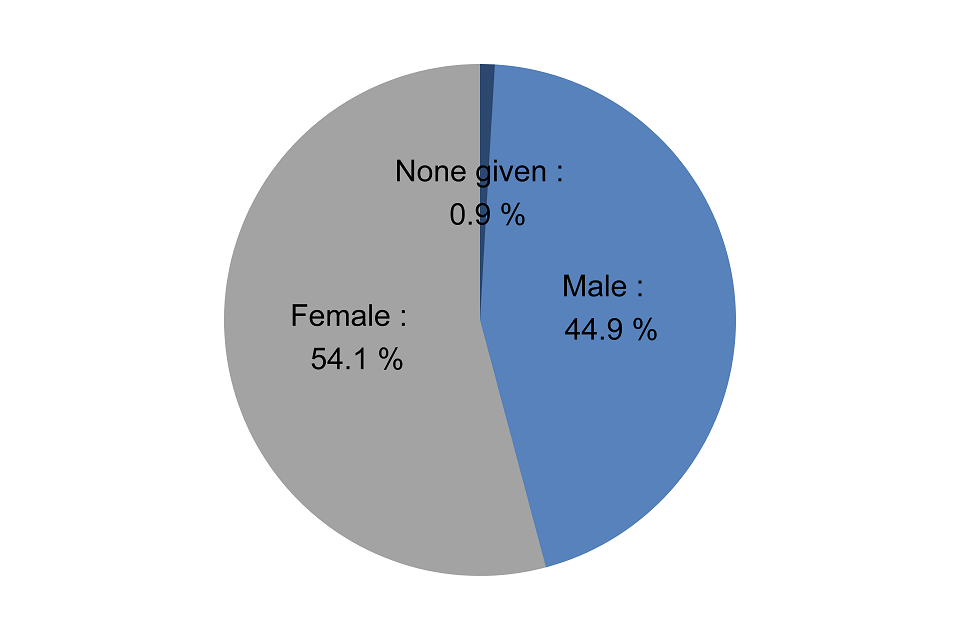
The pie chart shows that of the people newly testing positive by gender in pillar 1 and pillar 2, from 28 May to 26 August in England, 54.1% identify as female, 44.9% identify as male and 0.9% gave no gender.
Since Test and Trace began, consistently more people who identify as female have newly tested positive than people who identify as male. This gap between the 2 genders was largest in week 1 and was narrowing until the beginning of July.
Figure 4: number of people newly testing positive each week by gender, pillar 1 and pillar 2, 28 May to 26 August, England
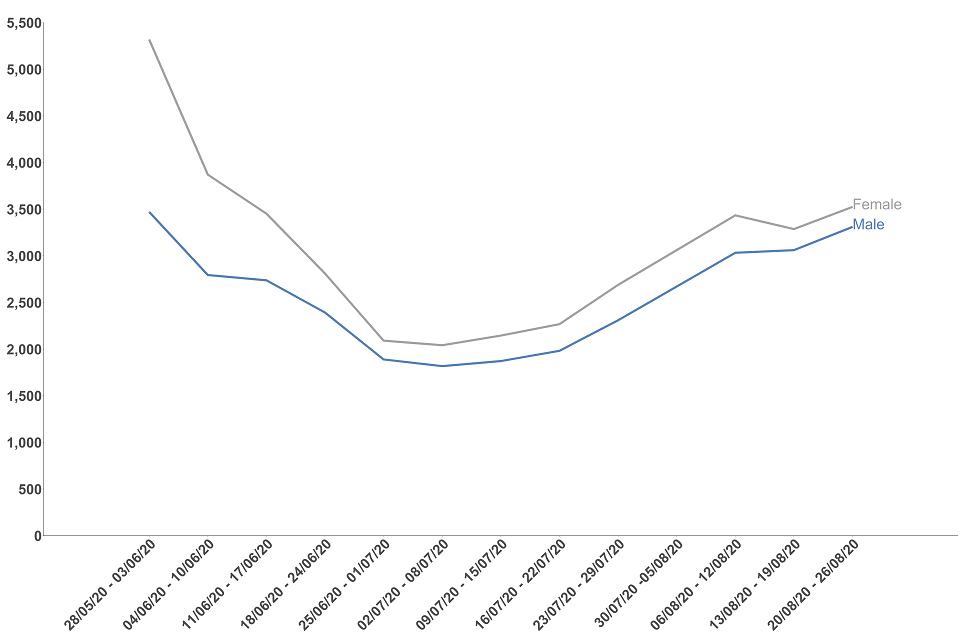
The data used in this chart can be found in the annex, table 2.
Age and gender
People tested
Since the start of Test and Trace, more people who identify as female have been tested than people who identify as male for almost all age groups, except for ages 0 to 9 and 70 to 79 years. The biggest differences are seen for age groups 20 to 29 and 30 to 39 where around 40% more people who identify as female were tested than people who identify as male.
Figure 5: number of people newly tested by age group and gender, pillar 1 and pillar 2, 28 May to 26 August, England
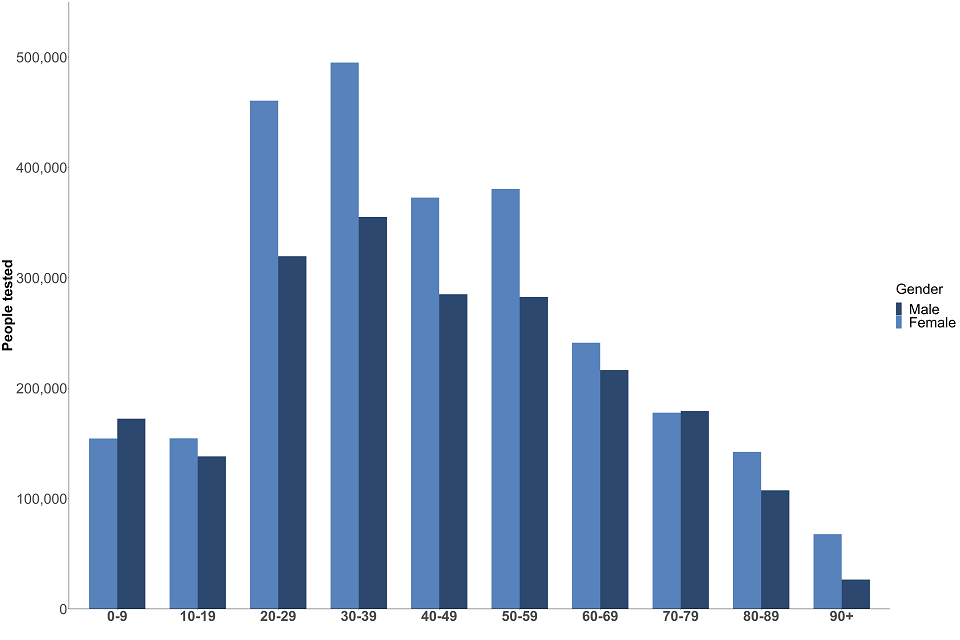
The data used in this chart can be found in the annex, table 3.
Since Test and Trace began, the age group with the largest number of people newly tested was between the ages of 30 to 39 years, for both people who identify as male and female. For people aged 40+, the number of people newly tested who identify as male plateaus between the ages of 40 and 59 and then steadily declines. This decline is also seen for people who identify as female, however there is a slight increase between the ages of 50 and 59, before dropping steadily for those aged 60 and over.
As shown in figure 6, up until ages 60 to 69, people are more likely to be tested under pillar 2. Between the ages of 70 and 89, people are more likely to be tested under pillar 1.
Figure 6: number of people newly tested by age group and pillar, 28 May to 28 August, England

The data used in this chart can be found in the annex, table 4.
People testing positive
Since the start of Test and Trace, for all age groups people identifying as female had more positive results than people who identify as male, except 0 to 9 years and 70 to 79 years. However, because people who identify as female were also more likely to get tested, this may not accurately reflect the overall population with COVID-19.
Figure 7: number of people newly testing positive by age group and gender, pillar 1 and pillar 2, 28 May to 26 August, England
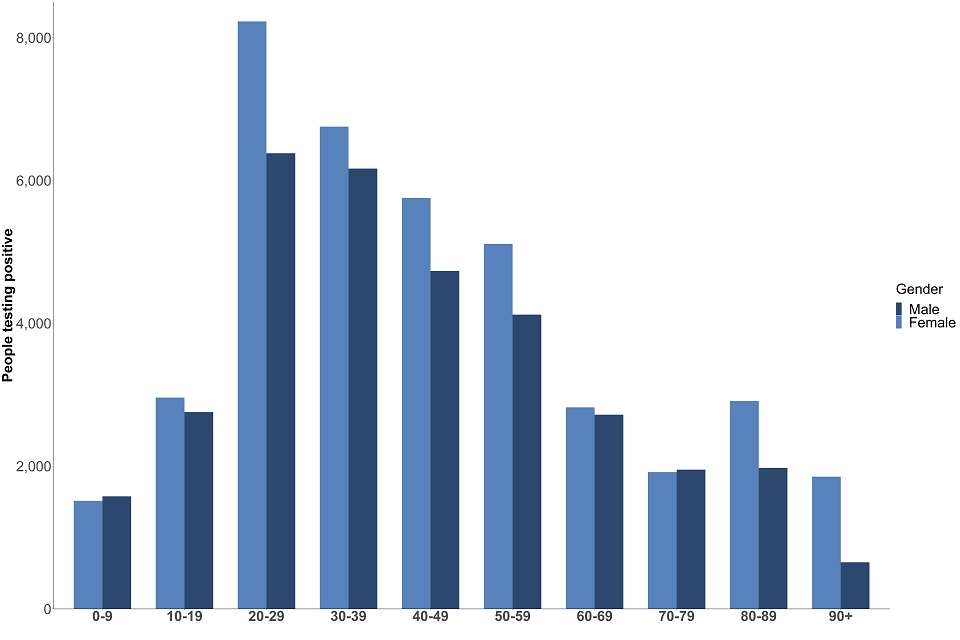
The data used in this chart can be found in the annex, table 5.
For both genders, the number of people newly testing positive increases up to 20 to 29 years. The number of people testing positive then decreases by age for both genders, until between the ages of 80 to 89 years where there is an increase in the number of people newly testing positive who identify as female.
As with people being tested, between the ages of 70 and 89, people are more likely to test positive under pillar 1.
Figure 8: number of people newly testing positive by age group and pillar, 28 May to 26 August, England
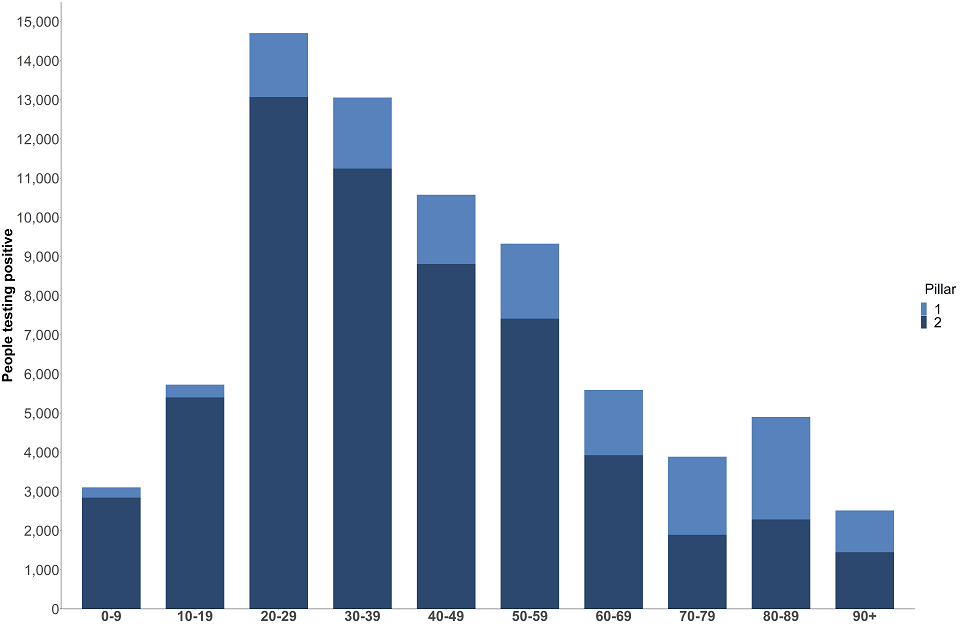
The data used in this chart can be found in the annex, table 6.
Median age
The median age for both people newly tested and people newly testing positive has been steadily declining since NHS Test and Trace began. The fall has been more significant in those people newly testing positive, falling from age 52 at the beginning of the programme to 31 in the current week.
Figure 9: median age for people newly tested and people newly testing positive, pillar 1 and pillar 2, 28 May to 26 August, England
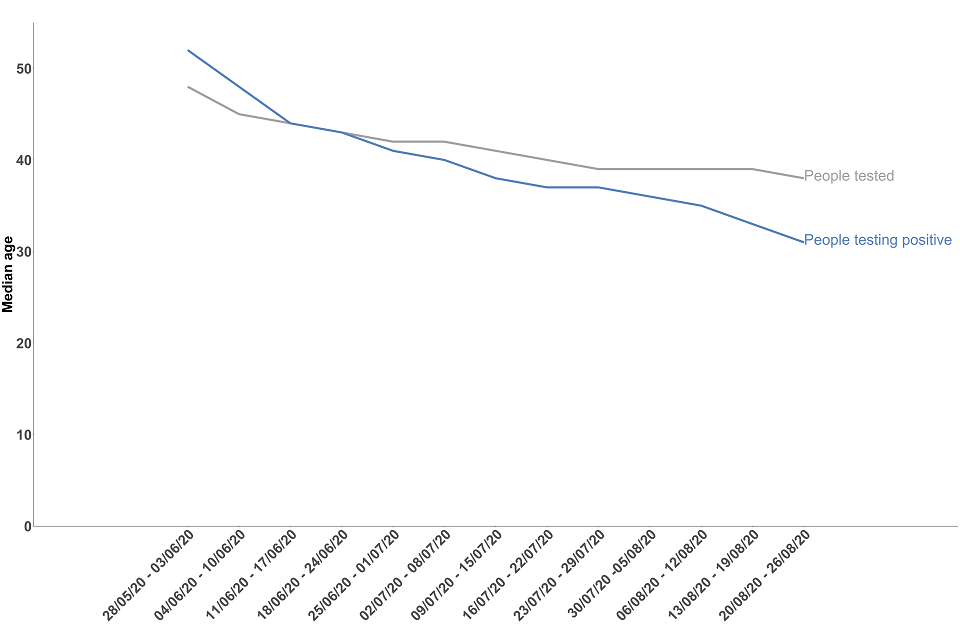
The data used in this chart can be found in the annex, table 7.
Ethnicity
Data has been grouped into 5 broad categories:
- white
- mixed/multiple ethnic groups
- Asian/Asian British
- black/black British
- other ethnic groups
The subgroups that make up each of these broad categories can be found at the ethnicity harmonised principle.
For pillar 2, the collection of ethnicity data became a mandatory field when booking a test in July. Before this, people who were booking a test did not have to give their ethnicity, so this field was sometimes left blank. From July onwards, those who do not want to disclose their ethnicity can select the Prefer not to say option.
People tested
Since Test and Trace began, for pillar 1 tests the majority of people tested (63.4%) are those who have identified as being of white ethnicity. Similarly, those who identify as being of white ethnicity make up the largest proportion (71.6%) of pillar 2 tests conducted.
Table 1: proportion of people newly tested by pillar and ethnicity, 28 May to 26 August, England
| Ethnicity | Pillar 1 | Pillar 2 | Total |
|---|---|---|---|
| Asian/Asian British | 4.9% | 9.3% | 7.9% |
| Black/black British | 2.4% | 3.0% | 2.8% |
| Mixed/multiple ethnic groups | 1.0% | 2.2% | 1.8% |
| Not given | 26.2% | 7.5% | 13.6% |
| Other | 2.1% | 1.2% | 1.5% |
| Prefer not to say | - | 5.3% | 3.5% |
| White | 63.4% | 71.6% | 68.9% |
There has been some change in the ethnicity of people getting tested since Test and Trace started. The number of people tested across both pillars has been slowly increasing for most ethnicities since week 1, with the largest increases seen for people who identify as mixed/multiple ethnic groups (104% increase) and Asian/Asian British (83% increase). The number of people newly tested where the ethnicity was not given has decreased by 50% since week 1. In July, ethnicity became a mandatory field when booking a test for pillar 2, which may explain this decrease.
Table 2: change in the number of people newly tested since week 1 of Test and Trace, by ethnicity, 28 May to 26 August, England
| Ethnicity | Number tested in week 1 (28 May to 3 June) | Number tested in week 13 (20 August to 26 August) | % change |
|---|---|---|---|
| Asian/Asian British | 20,995 | 38,491 | 83% |
| Black/black British | 9,880 | 12,694 | 28% |
| Mixed/multiple ethnic groups | 4,382 | 8,937 | 104% |
| Not given | 83,272 | 41,579 | -50% |
| Other | 4,063 | 7,280 | 79% |
| Prefer not to say | 11,060 | 22,216 | 101% |
| White | 225,306 | 323,511 | 44% |
| All ethnic groups | 358,958 | 454,708 | 27% |
The data for all weeks can also be found in annex, table 8.
Figure 10a: number of people newly tested by ethnicity (Asian/Asian British), pillar 1 and pillar 2, 28 May to 26 August, England

Figure 10b: number of people newly tested by ethnicity (black/black British), pillar 1 and pillar 2, 28 May to 26 August, England
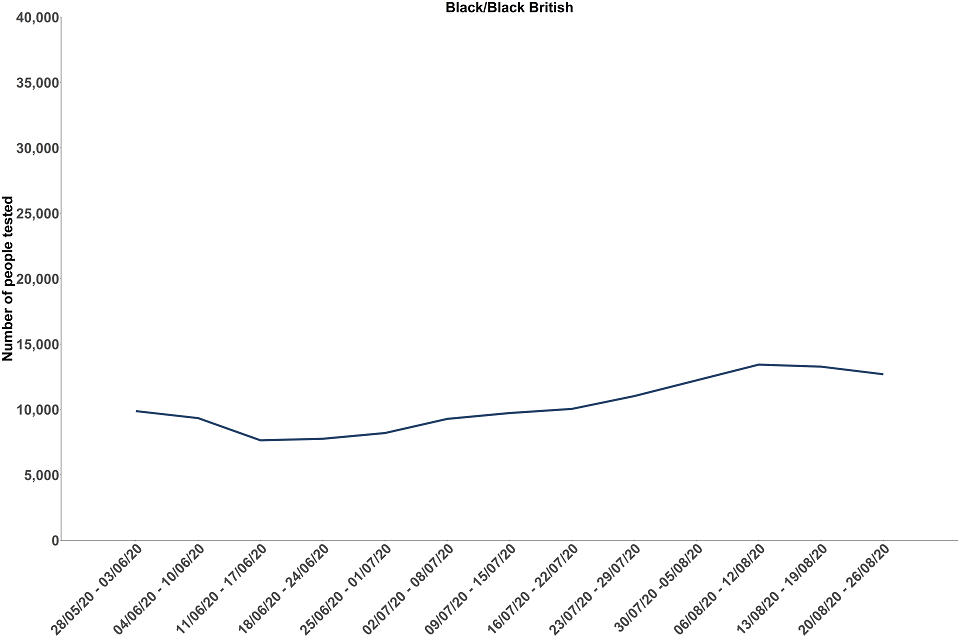
Figure 10c: number of people newly tested by ethnicity (mixed/multiple ethnic groups), pillar 1 and pillar 2, 28 May to 26 August, England
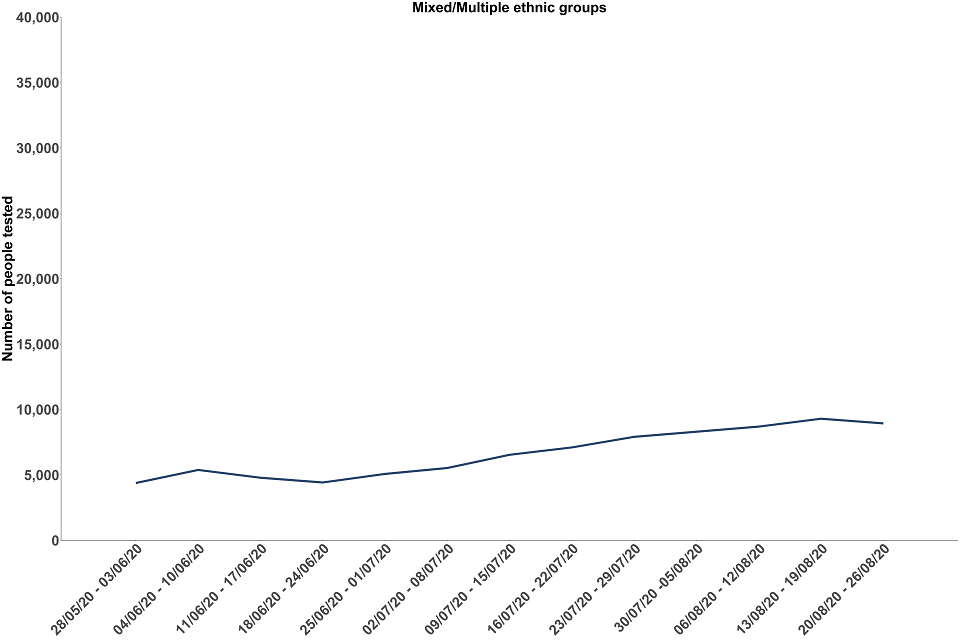
Figure 10d: number of people newly tested by ethnicity (other), pillar 1 and pillar 2, 28 May to 26 August, England
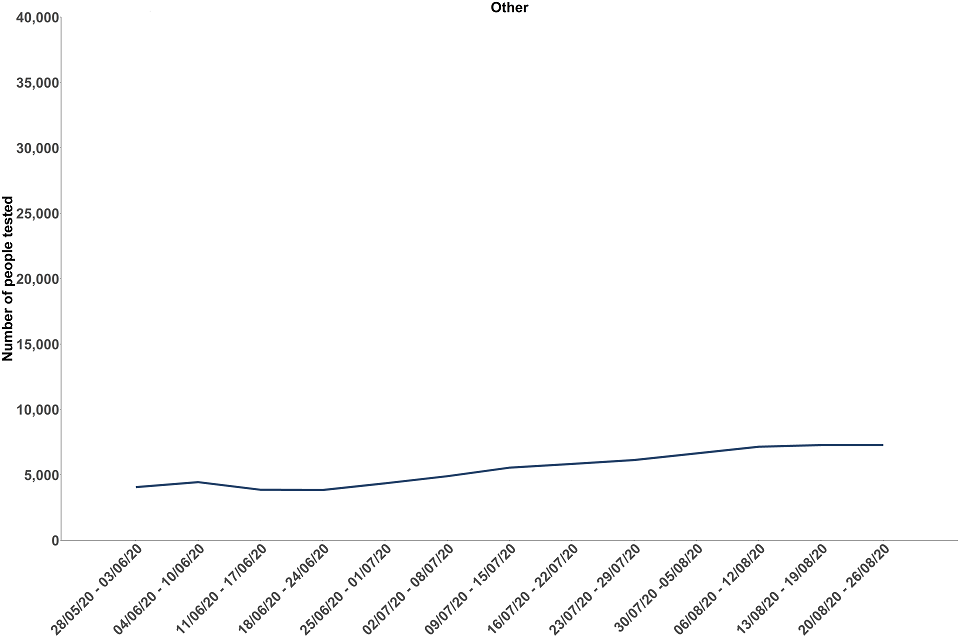
Figure 10e: number of people newly tested by ethnicity (white), pillar 1 and pillar 2, 28 May to 26 August, England

The data used in these charts can be found in the annex, table 8.
People testing positive
Since Test and Trace began, the majority of people testing positive are those who identified as being of white ethnicity, followed by those who identified as being of Asian/Asian British ethnicity. However, because people who identify as white ethnicity were also more likely to get tested, this may not accurately reflect the overall population with COVID-19.
Figure 11: number of people testing positive by ethnicity, pillar 1 and pillar 2, 28 May to 26 August, England
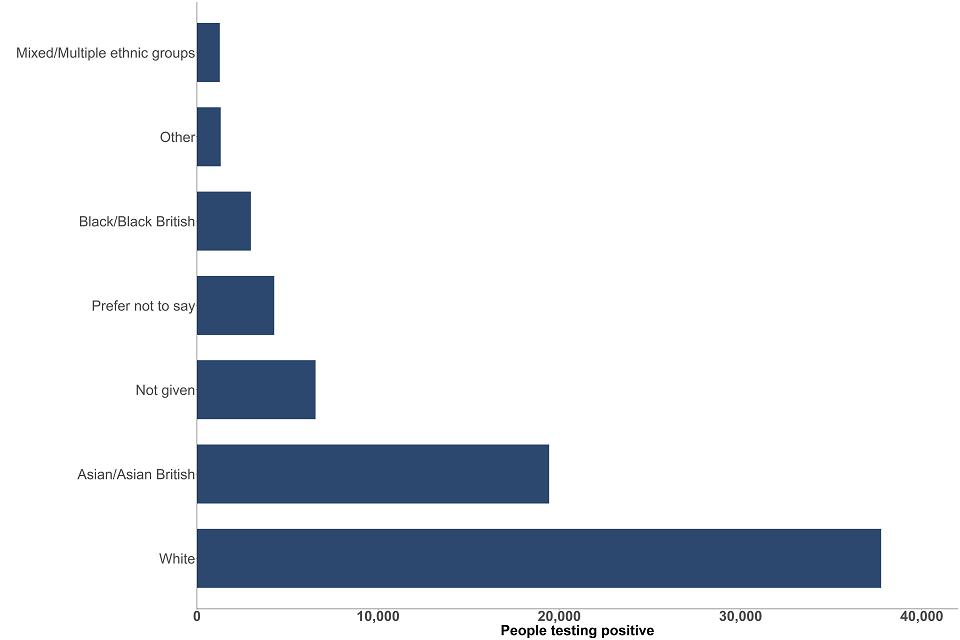
The data used in these charts can be found in the annex, table 9.
As with the number of people tested, there has been some change in the ethnicity of people testing positive since Test and Trace started.
Table 3: change in people newly testing positive since week 1 of Test and Trace, by ethnicity, 28 May to 26 August, England
| Ethnicity | Number testing positive in week 1 (28 May to 3 June) | Number testing positive in week 13 (20 August to 26 August) | % change |
|---|---|---|---|
| Asian/Asian British | 1,294 | 1,467 | 13% |
| Black/black British | 237 | 359 | 51% |
| Mixed/multiple ethnic groups | 95 | 171 | 80% |
| Not given | 1,680 | 298 | -82% |
| Other | 97 | 178 | 84% |
| Prefer not to say | 257 | 485 | 89% |
| White | 5,183 | 3,905 | -25% |
| All ethnic groups | 8,843 | 6,863 | -22% |
The data for all weeks can also be found in the annex, table 9.
Other sources
Some data is already available in terms of confirmed cases by age, gender and ethnicity. Coronavirus in the UK has a similar graph to show the confirmed cases by age and gender. The numbers will not align as this report only shows the data from the start of Test and Trace (28 May) whereas the coronavirus in the UK dashboard contains records from the start of the pandemic.
Demographic data is also available in the national COVID-19 surveillance reports which includes weekly reports of confirmed cases and deaths by age, gender and ethnicity. The time frames used in this report do not match those used in the Test and Trace publication.
This statistical note does not look at disparities in risk or outcome. However, this has been explored by PHE in the disparities in the risk and outcomes of COVID-19 publication and also by the Office of National Statistics in the coronavirus (COVID-19) related deaths by ethnic group publication.
Annex A: tables
Data for this statistical note was taken at a different time to the data for the main bulletin. As such, the totals will not match the totals given in the weekly time series.
Annex table 1: number of people newly tested for COVID-19 under pillars 1 and 2, by gender, England[footnote 1]
| Week | Female | Male | Total |
|---|---|---|---|
| 28/05/20 to 03/06/20 | 219,580 | 132,614 | 358,958 |
| 04/06/20 to 10/06/20 | 216,618 | 143,423 | 366,366 |
| 11/06/20 to 17/06/20 | 172,095 | 124,154 | 302,327 |
| 18/06/20 to 24/06/20 | 154,638 | 116,458 | 278,266 |
| 25/06/20 to 01/07/20 | 166,784 | 129,181 | 301,291 |
| 02/07/20 to 08/07/20 | 177,429 | 138,611 | 322,420 |
| 09/07/20 to 15/07/20 | 197,129 | 156,621 | 359,297 |
| 16/07/20 to 22/07/20 | 200,261 | 164,837 | 372,868 |
| 23/07/20 to 29/07/20 | 207,749 | 175,084 | 389,510 |
| 30/07/20 to 05/08/20 | 232,342 | 195,512 | 437,107 |
| 06/08/20 to 12/08/20 | 227,370 | 198,462 | 434,422 |
| 13/08/20 to 19/08/20 | 240,271 | 207,852 | 458,921 |
| 20/08/20 to 26/08/20 | 239,019 | 203,772 | 454,708 |
| Total since Test and Trace launched | 2,651,285 | 2,086,581 | 4,836,461 |
Annex table 2: number of people newly testing positive for COVID-19 under pillars 1 and 2, by gender, England[footnote 1]
| Week | Female | Male | Total |
|---|---|---|---|
| 28/05/20 to 03/06/20 | 5,320 | 3,471 | 8,843 |
| 04/06/20 to 10/06/20 | 3,871 | 2,794 | 6,703 |
| 11/06/20 to 17/06/20 | 3,452 | 2,738 | 6,230 |
| 18/06/20 to 24/06/20 | 2,811 | 2,392 | 5,238 |
| 25/06/20 to 01/07/20 | 2,091 | 1,889 | 4,064 |
| 02/07/20 to 08/07/20 | 2,042 | 1,818 | 3,936 |
| 09/07/20 to 15/07/20 | 2,145 | 1,872 | 4,054 |
| 16/07/20 to 22/07/20 | 2,268 | 1,982 | 4,270 |
| 23/07/20 to 29/07/20 | 2,689 | 2,310 | 5,018 |
| 30/07/20 to 05/08/20 | 2,892 | 2,376 | 5,281 |
| 06/08/20 to 12/08/20 | 3,434 | 3,033 | 6,676 |
| 13/08/20 to 19/08/20 | 3,287 | 3,061 | 6,377 |
| 20/08/20 to 26/08/20 | 3,525 | 3,311 | 6,863 |
| Total since Test and Trace launched | 39,827 | 33,047 | 73,553 |
Annex table 3: number of people newly tested for COVID-19 under pillars 1 and 2, by age and gender, 28 May to 26 August, England[footnote 2]
| Age | Female | Male | Total |
|---|---|---|---|
| 0 to 9 | 154,413 | 172,337 | 330,612 |
| 10 to 19 | 154,529 | 138,250 | 295,894 |
| 20 to 29 | 460,488 | 319,569 | 788,131 |
| 30 to 39 | 495,045 | 355,107 | 860,744 |
| 40 to 49 | 372,658 | 285,113 | 666,196 |
| 50 to 59 | 380,448 | 282,702 | 672,000 |
| 60 to 69 | 241,190 | 216,387 | 464,950 |
| 70 to 79 | 177,796 | 179,270 | 364,020 |
| 80 to 89 | 142,308 | 107,455 | 254,354 |
| 90+ | 67,699 | 26,585 | 95,407 |
| Total since Test and Trace launched | 2,651,285 | 2,086,581 | 4,836,461 |
Annex table 4: number of people newly tested for COVID-19 under pillars 1 and 2, by age and pillar, 28 May to 26 August, England[footnote 3]
| Age | Pillar 1 | Pillar 2 | Total |
|---|---|---|---|
| 0 to 9 | 71,286 | 259,326 | 330,612 |
| 10 to 19 | 62,178 | 233,716 | 295,894 |
| 20 to 29 | 171,802 | 616,329 | 788,131 |
| 30 to 39 | 222,024 | 638,720 | 860,744 |
| 40 to 49 | 175,395 | 490,801 | 666,196 |
| 50 to 59 | 208,932 | 463,068 | 672,000 |
| 60 to 69 | 197,678 | 267,272 | 464,950 |
| 70 to 79 | 226,320 | 137,700 | 364,020 |
| 80 to 89 | 164,558 | 89,796 | 254,354 |
| 90+ | 42,897 | 52,510 | 95,407 |
| Total since Test and Trace launched | 1,586,248 | 3,250,213 | 4,836,461 |
Annex table 5: people newly testing positive for COVID-19 under pillars 1 and 2, by age and gender, 28 May to 26 August, England[footnote 2]
| Age | Female | Male | Total |
|---|---|---|---|
| 0 to 9 | 1,514 | 1,577 | 3,104 |
| 10 to 19 | 2,959 | 2,756 | 5,727 |
| 20 to 29 | 8,226 | 6,380 | 14,702 |
| 30 to 39 | 6,753 | 6,166 | 13,058 |
| 40 to 49 | 5,753 | 4,731 | 10,576 |
| 50 to 59 | 5,111 | 4,121 | 9,327 |
| 60 to 69 | 2,822 | 2,720 | 5,590 |
| 70 to 79 | 1,916 | 1,950 | 3,886 |
| 80 to 89 | 2,910 | 1,974 | 4,900 |
| 90+ | 1,852 | 653 | 2,513 |
| Total since Test and Trace launched | 39,816 | 33,028 | 73,553 |
Annex table 6: people newly testing positive for COVID-19 under pillars 1 and 2, by age and pillar, 28 May to 26 August, England[footnote 3]
| Age | Pillar 1 | Pillar 2 | Total |
|---|---|---|---|
| 0 to 9 | 263 | 2,841 | 3,104 |
| 10 to 19 | 328 | 5,399 | 5,727 |
| 20 to 29 | 1,632 | 13,070 | 14,702 |
| 30 to 39 | 1,814 | 11,244 | 13,058 |
| 40 to 49 | 1,769 | 8,807 | 10,576 |
| 50 to 59 | 1,917 | 7,410 | 9,327 |
| 60 to 69 | 1,664 | 3,926 | 5,590 |
| 70 to 79 | 1,994 | 1,892 | 3,886 |
| 80 to 89 | 2,616 | 2,284 | 4,900 |
| 90+ | 1,066 | 1,447 | 2,513 |
| Total since Test and Trace launched | 15,227 | 58,326 | 73,553 |
Annex table 7: median age of people newly tested and newly testing positive for COVID-19 under pillars 1 and 2, England
| Week | People tested | People testing positive |
|---|---|---|
| 28/05/20 to 03/06/20 | 48 | 52 |
| 04/06/20 to 10/06/20 | 45 | 48 |
| 11/06/20 to 17/06/20 | 44 | 44 |
| 18/06/20 to 24/06/20 | 43 | 43 |
| 25/06/20 to 01/07/20 | 42 | 41 |
| 02/07/20 to 08/07/20 | 42 | 40 |
| 09/07/20 to 15/07/20 | 41 | 38 |
| 16/07/20 to 22/07/20 | 40 | 37 |
| 23/07/20 to 29/07/20 | 39 | 37 |
| 30/07/20 to 05/08/20 | 39 | 37 |
| 06/08/20 to 12/08/20 | 39 | 35 |
| 13/08/20 to 19/08/20 | 39 | 33 |
| 20/08/20 to 26/08/20 | 38 | 31 |
Annex table 8: number of people newly tested for COVID-19 under pillars 1 and 2, by ethnicity, 28 May to 26 August, England
| Week | Asian/Asian British | Black/black British | Mixed/multiple ethnic groups | Other | White | Prefer not to say | Not given |
|---|---|---|---|---|---|---|---|
| 28/05/20 to 03/06/20 | 20,995 | 9,880 | 4,382 | 4,063 | 225,306 | 11,060 | 83,272 |
| 04/06/20 to 10/06/20 | 22,872 | 9,342 | 5,378 | 4,448 | 240,841 | 10,245 | 73,240 |
| 11/06/20 to 17/06/20 | 20,177 | 7,647 | 4,780 | 3,861 | 199,580 | 6,726 | 59,556 |
| 18/06/20 to 24/06/20 | 20,070 | 7,763 | 4,419 | 3,842 | 178,291 | 6,149 | 57,732 |
| 25/06/20 to 01/07/20 | 22,689 | 8,199 | 5,072 | 4,355 | 203,533 | 8,159 | 49,284 |
| 02/07/20 to 08/07/20 | 25,896 | 9,284 | 5,529 | 4,898 | 224,730 | 9,441 | 42,642 |
| 09/07/20 to 15/07/20 | 30,806 | 9,726 | 6,534 | 5,554 | 251,697 | 11,608 | 43,372 |
| 16/07/20 to 22/07/20 | 33,559 | 10,046 | 7,100 | 5,837 | 261,328 | 11,902 | 43,096 |
| 23/07/20 to 29/07/20 | 32,545 | 11,023 | 7,908 | 6,134 | 278,412 | 13,355 | 40,133 |
| 30/07/20 to 05/08/20 | 35,164 | 13,355 | 8,833 | 6,897 | 312,426 | 16,485 | 43,947 |
| 06/08/20 to 12/08/20 | 38,346 | 13,432 | 8,692 | 7,154 | 305,002 | 21,016 | 40,780 |
| 13/08/20 to 19/08/20 | 38,483 | 13,273 | 9,296 | 7,281 | 327,128 | 22,764 | 40,696 |
| 20/08/20 to 26/08/20 | 38,491 | 12,694 | 8,937 | 7,280 | 323,511 | 22,216 | 41,579 |
| Total since Test and Trace launched | 380,093 | 135,664 | 86,860 | 71,604 | 3,331,785 | 171,126 | 659,329 |
Annex table 9: people newly testing positive for COVID-19 under pillars 1 and 2, by ethnicity, 28 May to 26 August, England
| Week | Asian/Asian British | Black/black British | Mixed/multiple ethnic groups | Other | White | Prefer not to say | Not given |
|---|---|---|---|---|---|---|---|
| 28/05/20 to 03/06/20 | 1,294 | 237 | 95 | 97 | 5,183 | 257 | 1,680 |
| 04/06/20 to 10/06/20 | 1,337 | 209 | 79 | 98 | 3,709 | 235 | 1,036 |
| 11/06/20 to 17/06/20 | 1,516 | 191 | 93 | 92 | 3,402 | 188 | 748 |
| 18/06/20 to 24/06/20 | 1,548 | 156 | 73 | 74 | 2,592 | 166 | 629 |
| 25/06/20 to 01/07/20 | 1,244 | 111 | 57 | 83 | 2,029 | 188 | 352 |
| 02/07/20 to 08/07/20 | 1,284 | 132 | 35 | 57 | 1,929 | 248 | 251 |
| 09/07/20 to 15/07/20 | 1,298 | 143 | 49 | 60 | 1,865 | 281 | 358 |
| 16/07/20 to 22/07/20 | 1,415 | 151 | 92 | 73 | 2,048 | 289 | 202 |
| 23/07/20 to 29/07/20 | 1,588 | 269 | 95 | 105 | 2,395 | 367 | 199 |
| 30/07/20 to 05/08/20 | 1,663 | 255 | 116 | 125 | 2,534 | 421 | 167 |
| 06/08/20 to 12/08/20 | 2,132 | 359 | 151 | 136 | 2,899 | 605 | 394 |
| 13/08/20 to 19/08/20 | 1,652 | 405 | 155 | 132 | 3,267 | 533 | 233 |
| 20/08/20 to 26/08/20 | 1,467 | 359 | 171 | 178 | 3,905 | 485 | 298 |
| Total since Test and Trace launched | 19,438 | 2,977 | 1,261 | 1,310 | 37,757 | 4,263 | 6,547 |
-
The total given includes those who did not provide information about their gender and so does not match the sum of people newly tested who identify as male and female. ↩ ↩2
-
The total given includes those who did not provide information about their gender and so does not match the sum of people newly tested who identify as male and female. Additionally, the total includes people who did not give their age so the total since Test and Trace launched will not match the sum of all age groups. ↩ ↩2
-
The total includes people who did not give their age so the total since Test and Trace launched will not match the sum of all age groups. ↩ ↩2