DCMS Sectors Economic Estimates 2019: Employment
Updated 22 November 2024

© Crown copyright 2024
This publication is licensed under the terms of the Open Government Licence v3.0 except where otherwise stated. To view this licence, visit nationalarchives.gov.uk/doc/open-government-licence/version/3 or write to the Information Policy Team, The National Archives, Kew, London TW9 4DU, or email: psi@nationalarchives.gov.uk.
Where we have identified any third party copyright information you will need to obtain permission from the copyright holders concerned.
This publication is available at https://www.gov.uk/government/statistics/dcms-sectors-economic-estimates-2019-employment/dcms-sectors-economic-estimates-2019-employment
This release provides estimates of employment (the number of jobs) in the DCMS sectors. It is part of a series of publications of economic statistics, also encompassing GVA, trade, and business demographics. These are available in separate publications. These releases enable stakeholders to evaluate the economic contribution of DCMS sectors, which are not traditional National Account sectors, and to understand how current and future policy interventions can be most effective.
The DCMS sectors covered in this report are:
- Civil Society
- Creative Industries
- Cultural Sector
- Digital Sector
- Gambling
- Sport
- Telecoms
- Tourism
This release is shorter than earlier releases in the DCMS Economic Estimates series, and contains less detailed analysis. All of the data released in previous years, including more detailed demographic and industry breakdowns, is still available in the accompanying data tables.
In 2019 there were 5.3 million jobs in DCMS sectors, accounting for 15.7% of all UK jobs.
The number of filled jobs grew in all DCMS sectors between 2011 and 2019, except for the Gambling sector, which declined by 14.7%.
Across DCMS sectors, the Creative Industries has the most jobs and has seen the largest increase in the number of jobs since 2011. (Note: there is some overlap between DCMS sectors, see Figure 3).
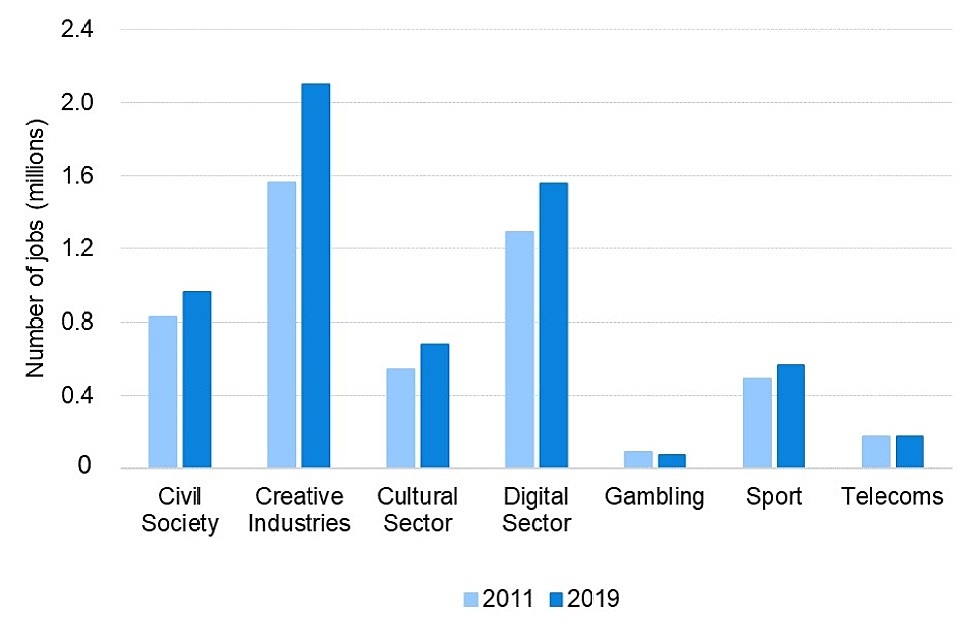
Figure 1: Chart showing the number of jobs in DCMS sectors (excluding Tourism) in 2011 and 2019.
Growth in the number of filled jobs over this period ranged from 2.5% in the Telecoms sector to 34.5% in the Creative Industries.
In addition to the Creative Industries, four other DCMS sectors experienced faster job growth than the UK-wide average (11.4%): the Cultural sector (24.0%), the Digital sector (20.6%), Civil Society (16.6%) and the Sport sector (14.5%).
Of all jobs in DCMS sectors 9 in 10 were held by UK nationals, 5.9% were held by EU nationals and 4.9% were held by non-EU nationals.
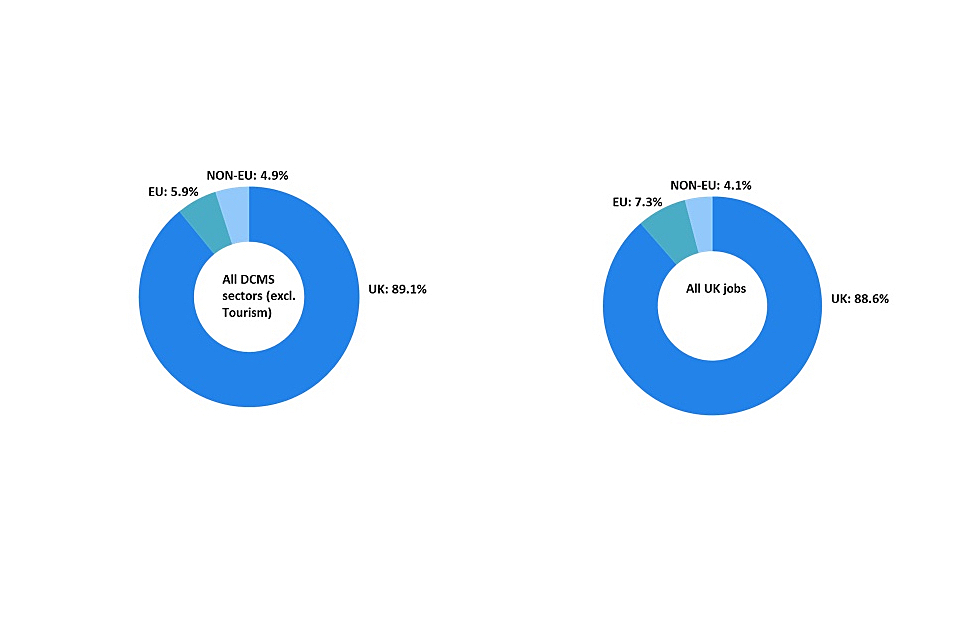
Figure 2: Proportion of jobs in DCMS sectors (excluding Tourism) and in the UK by nationality, 2019
Chapter 1: Introduction
Code of Practice for Statistics
In June 2019, the DCMS Sector Economic Estimates: Employment were designated as National Statistics. This affirms that the statistics have met the requirements of the Code of Practice for Statistics.
Background
Released: 30 April 2020
Geographic Coverage: United Kingdom
This release provides estimates for the number of filled jobs, including second jobs, in DCMS sectors together with selected demographic breakdowns for all sectors excluding Tourism[footnote 1]. Further breakdowns can be found in the accompanying data tables covering:
- regions and devolved national administrations (Scotland, Wales and Northern Ireland)
- demographics: gender, ethnicity, age, socio-economic classification and disability
- nationality of job-holder (UK national, EU national, or other (non-EU) national)
Estimates of employment are calculated from the ONS Annual Population Survey. As with other statistics in the Economic Estimates series, categorisation of DCMS sectors is based on the Standard Industrial Classification (SIC) codes.
Data are available for each DCMS sector, and also for sub-sectors within the Creative Industries, Digital sector, and the Cultural sector. There is significant overlap between DCMS sectors so users should be aware that the estimate for “DCMS sectors Total” is lower than the sum of the individual sectors.
In summary, the data presented in this report on employment:
- are based on official statistics data sources
-
are based on internationally-harmonised codes, meaning the estimates are:
- comparable at both a national and international level
- comparable over time, allowing trends to be measured and monitored
- subject to limitations of the underlying classifications around reflecting the current balance and make-up of the UK economy (for example, the SIC codes were developed in 2007 and have not been revised since; emerging sectors, such as Artificial Intelligence, are therefore hard to capture and may be excluded or mis-coded)
-
are based on survey data (Annual Population Survey) and, as with all data from surveys, there will be an associated error margin surrounding these estimates[footnote 2]
- this means, for example, we cannot say an estimate of 20% is totally accurate for the whole population; our best estimates, from the survey sample, suggest that the figure is 20%, but due to the degree of error the true population figure could perhaps be 18% or 23%
- this is not an issue with the quality of the data or analysis; rather it is an inherent principle when using survey data to inform estimates
Chapter 2: Employment in DCMS sectors
All DCMS sectors
In 2019, there were an estimated 5.3 million jobs in DCMS sectors, accounting for 15.7% of all jobs across the UK. For all DCMS sectors (excluding Tourism) this was 2.6% higher than 2018. In comparison, the total number of UK jobs increased by 1.2% over the last year.
Of all DCMS sectors, the Creative Industries employed the most people (2.1 million), followed by the Digital sector (1.6 million) and the Tourism sector (1.4 million). However, it should be taken into account that there is significant overlap between DCMS sectors (as illustrated in Figure 3), so it is difficult to make comparisons between them.
Data tables accompanying this release are available here.
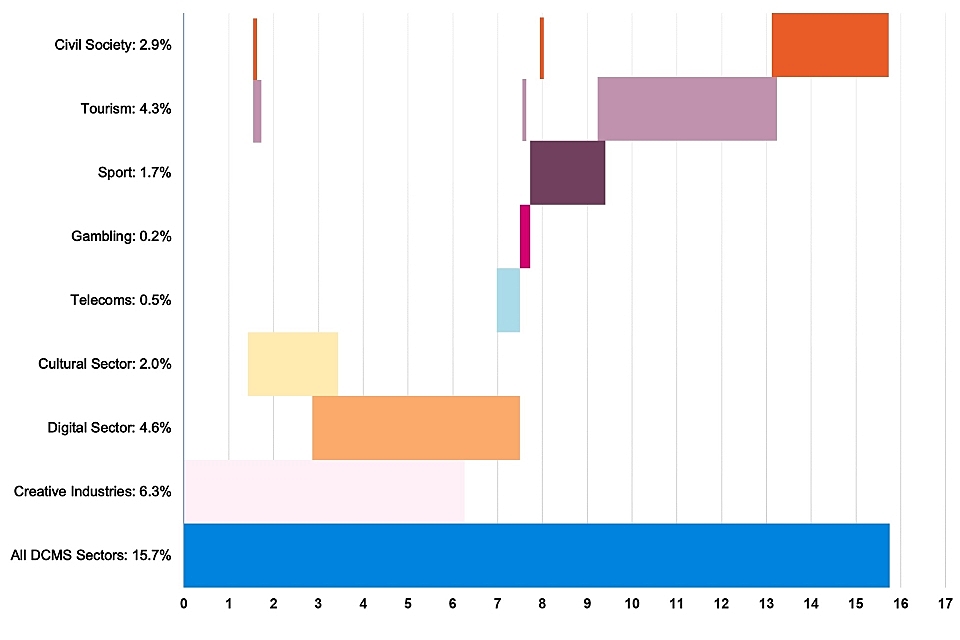
Figure 3: Employment of DCMS sectors as a percentage of total UK employment (%): 2019 (Note: There is a very small (less than 0.1%) overlap between Civil Society and each of the Digital Sector, Telecoms and Gambling which cannot visually be identified in Figure 3).
Chapter 3: Employment in individual DCMS sectors
Civil Society
In 2019, there were around 962,000 jobs in the Civil Society sector, an increase of 6.4% from 2018 and 16.6% from 2011.
Creative Industries
In 2019, the number of jobs in the Creative Industries sector stood at just over 2.1 million, an increase of 3.0% from 2018. The number of jobs in the Creative Industries increased by 34.5% from 2011: more than three times the growth rate of employment in the UK overall (11.4%).
Cultural Sector
In 2019, the Cultural sector had 676,000 jobs, an increase of 2.6% from 659,000 in 2018. Since 2011, the number of jobs in the Cultural sector has grown by 24.0%.
Digital Sector
In 2019, the Digital sector comprised of 1.56 million jobs, slightly more than the 1.5 million in 2017 and 2018, but an increase of 20.6% from 2011.
Gambling
In 2019, there were approximately 76,000 jobs in the Gambling sector, a decrease of 12.6% from 2018 and 14.7% lower than in 2011. This is the lowest number of jobs recorded in this sector since 2011. The Gambling sector has the smallest number of jobs of all the DCMS sectors, and it is worth noting that small absolute changes from year to year can translate into relatively large percentage changes.
Sport
In 2019, the Sport sector had 563,000 jobs, a fall of 1.2% from 2018 but an increase of 14.5% from 2011.
Telecoms
In 2019, the Telecoms sector comprised of 178,000 jobs, a 0.7% increase on 2018 but an increase of 2.5% since 2011.
Tourism
In 2019, provisional estimates suggest that there were 1.4 million jobs in the Tourism sector, an increase of 2.6% since 2018. The Tourism estimate is based on the Tourism Satellite Account (TSA) for 2017 and will be revised when the updated TSA is published.
Chapter 4: Next steps
DCMS has developed a suite of economic estimates which help support policy and understand the economic impact our sectors have on the UK economy. The employment estimates in the release are expected to be used by customers both within and outside the government. In combination with other economic indicators, employment estimates help build a comprehensive picture of the UK economy, and of the DCMS sectors’ importance within it.
The next set of publications of DCMS sectors Economic Estimates are outlined below:
- DCMS Sectors Economic Estimates 2019: Regional GVA scheduled for mid-May 2020
- Digital Sector Economic Estimates 2019: Business demographics scheduled for early June 2020
The final dates will be announced via the DCMS statistical release calendar nearer the time.
Views on this publication are welcomed from users. Responses should be provided to: evidence@culture.gov.uk.
Annex A: Definitions and limitations
This annex outlines the limitations of the data used within DCMS sectors Economic Estimates: Employment. Further information is available in the methodology note.
The estimates set out in this report are robust but there are some limitations of which users should be aware:
Sport
For the purposes of this publication the statistical definition of sport has been used. This incorporates only those 4-digit SIC codes which are predominately sport (see methodology note Table 2.1). DCMS also publishes estimates of sport based on the EU agreed Vilnius definition. The Vilnius definition is a more comprehensive measure of sport which considers the contribution of sport across a range of industries (for example, sport advertising and sport-related construction). The DCMS Sport Satellite Account, which would cover the Vilnius definition of sport, is currently being developed and therefore has not been used in these estimates.
Tourism
Tourism is defined in this publication as the number of jobs that are directly supported by tourism consumption across the defined tourism industries. The tourism figures in this publication are based on the latest UK TSA (published in November 2018) and were produced by ONS as an ad-hoc release. As the latest TSA is for 2017, the 2018 and 2019 figures are provisional, and will be updated following the publication of the next TSA. Due to the methodology behind this data, no demographic breakdowns are available for the Tourism sector, and an aggregate figure for the DCMS Sector as a whole is published only.
The employment estimates for tourism used in this publication are based on a different methodology to other DCMS sectors as they are taken from the TSA. This methodology uses survey data to allocate spend by industry which is used to produce robust measures of GVA. These data are then used to produce ‘tourism ratios’, which estimate the proportion of different industries that are supported by the tourism industry. The tourism ratios are then applied to employment in the relevant industries to produce estimates of direct tourism employment in these industries. Jobs data are taken from the Annual Population Survey (APS), the same source as the other DCMS sectors, but are then pro-rated to Workforce Job estimates. The TSA only provides headline estimates, since the tourism ratios cannot be used to produce robust demographic breakdowns for tourism direct jobs. Therefore, tourism is only included in the headline figures in this report.
Industry breakdowns
The employment estimates in this report are based on survey data from the APS. This is a household survey, with industry self-reported by the individual completing the survey. This provides good information on demographics, but leads to some inaccuracies on the industry breakdown. This should be borne in mind when using these estimates.
Office for Civil Society
The Office for Civil Society leads cross-government work in support of the voluntary, community and social enterprise sector (VCSE). The estimates included in this report attempt to measure jobs for this sector for people who work in a charity, voluntary organisation or trust. This is an underestimate for the wider sector and does not include volunteers as a whole, social enterprises and mutuals. External data sources have been provided where appropriate to give an approximation of the size for these elements not captured in the DCMS sectors. Employment estimates have been produced from 2011, including for the Office for Civil Society-led VCSE sector (called “the Civil Society sector” in this document for brevity), to aid comparisons over time.
Operation of historical sites and similar visitor attractions
It is recognised that, due to the limitations associated with SIC codes, the SIC code used as a proxy for the Heritage sector (91.03 - Operation of historical sites and building and similar visitor attractions) is likely to be an underestimate of this sector’s value. As such, we have altered the name of the Heritage sector to ‘Operation for historical sites and similar visitor attractions’ to reflect this.
Estimates
The employment figures published in this report represent best estimates of employment in DCMS sectors. Whilst they are based on robust Official Statistics data sources, they are gathered by means of surveys and therefore are vulnerable to the inherent issues associated with observing a sample of the population rather than the whole population. The estimates are therefore our best estimates of employment and will have an associated margin of error surrounding them.
Feedback and consultation
DCMS aims to continuously improve the quality of estimates and better meet user needs. In response to user requests, this release includes additional web tables showing employment in DCMS sectors by disability, employment in the creative economy and employment in the digital economy. Feedback on this release should be sent to DCMS via email to: evidence@culture.gov.uk.
Annex B: Further information
-
The next update to these statistics is scheduled to be published in June 2021.
-
The responsible statistician for this release is Rachel Moyce. For enquiries on this release, please contact Rachel or evidence@culture.gov.uk.
-
For general enquiries contact: Department for Digital, Culture, Media and Sport, 100 Parliament Street, London, SW1A 2BQ, Email: enquiries@culture.gov.uk
-
For media enquiries contact: 020 7211 2210
-
DCMS statisticians can be followed on Twitter via @DCMSInsight.
-
The DCMS-Sector Economic Estimates were designed as National Statistics on 26 June 2019. This followed a report by the Office for Statistics Regulation in December 2018, which stated that the series could be designated as National Statistics subject to meeting certain requirements.
-
Since the report, we have striven to improve our publications by providing summaries of other notable sources of data, more detail on the nature and extent of the overlap between the sectors, and further information on the quality and limitations of the data. We will continue to improve the series in the future, in line with the recommendations of the report.
-
Tourism data are based on a different methodology to other DCMS sectors as they are taken from the Tourism Satellite Account and therefore it is not possible to produce robust demographic breakdowns for direct Tourism jobs. ↩
-
Sampling error is the error caused by observing a sample (as in a survey) instead of the whole population (as in a census). While each sample is designed to produce the “best” estimate of the true population value, a number of equal-sized samples covering the population would generally produce varying population estimates. ↩